United States
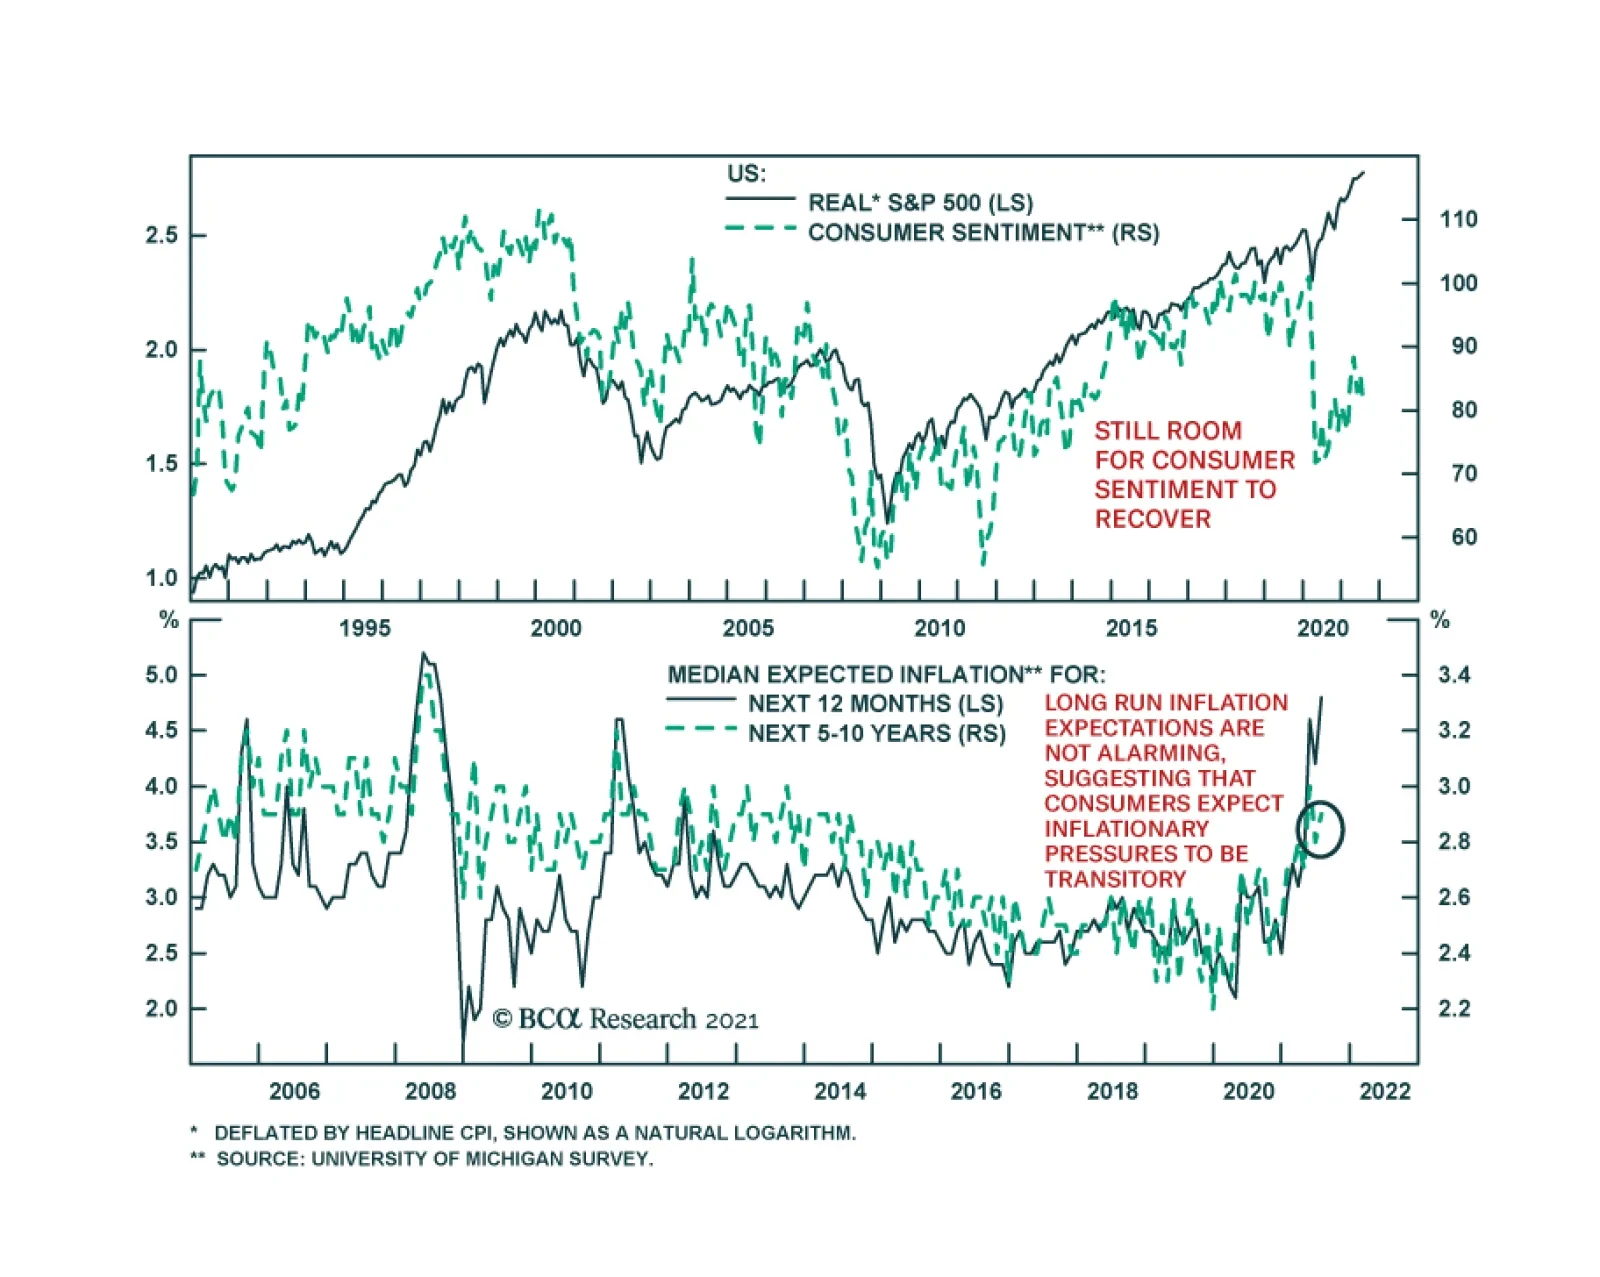
Friday’s preliminary University of Michigan Consumer Sentiment survey for July disappointed. The headline measure fell from 85.5 to 80.8 versus an anticipated tick up to 86.5. The deterioration reflects a decline in both the current conditions component as…
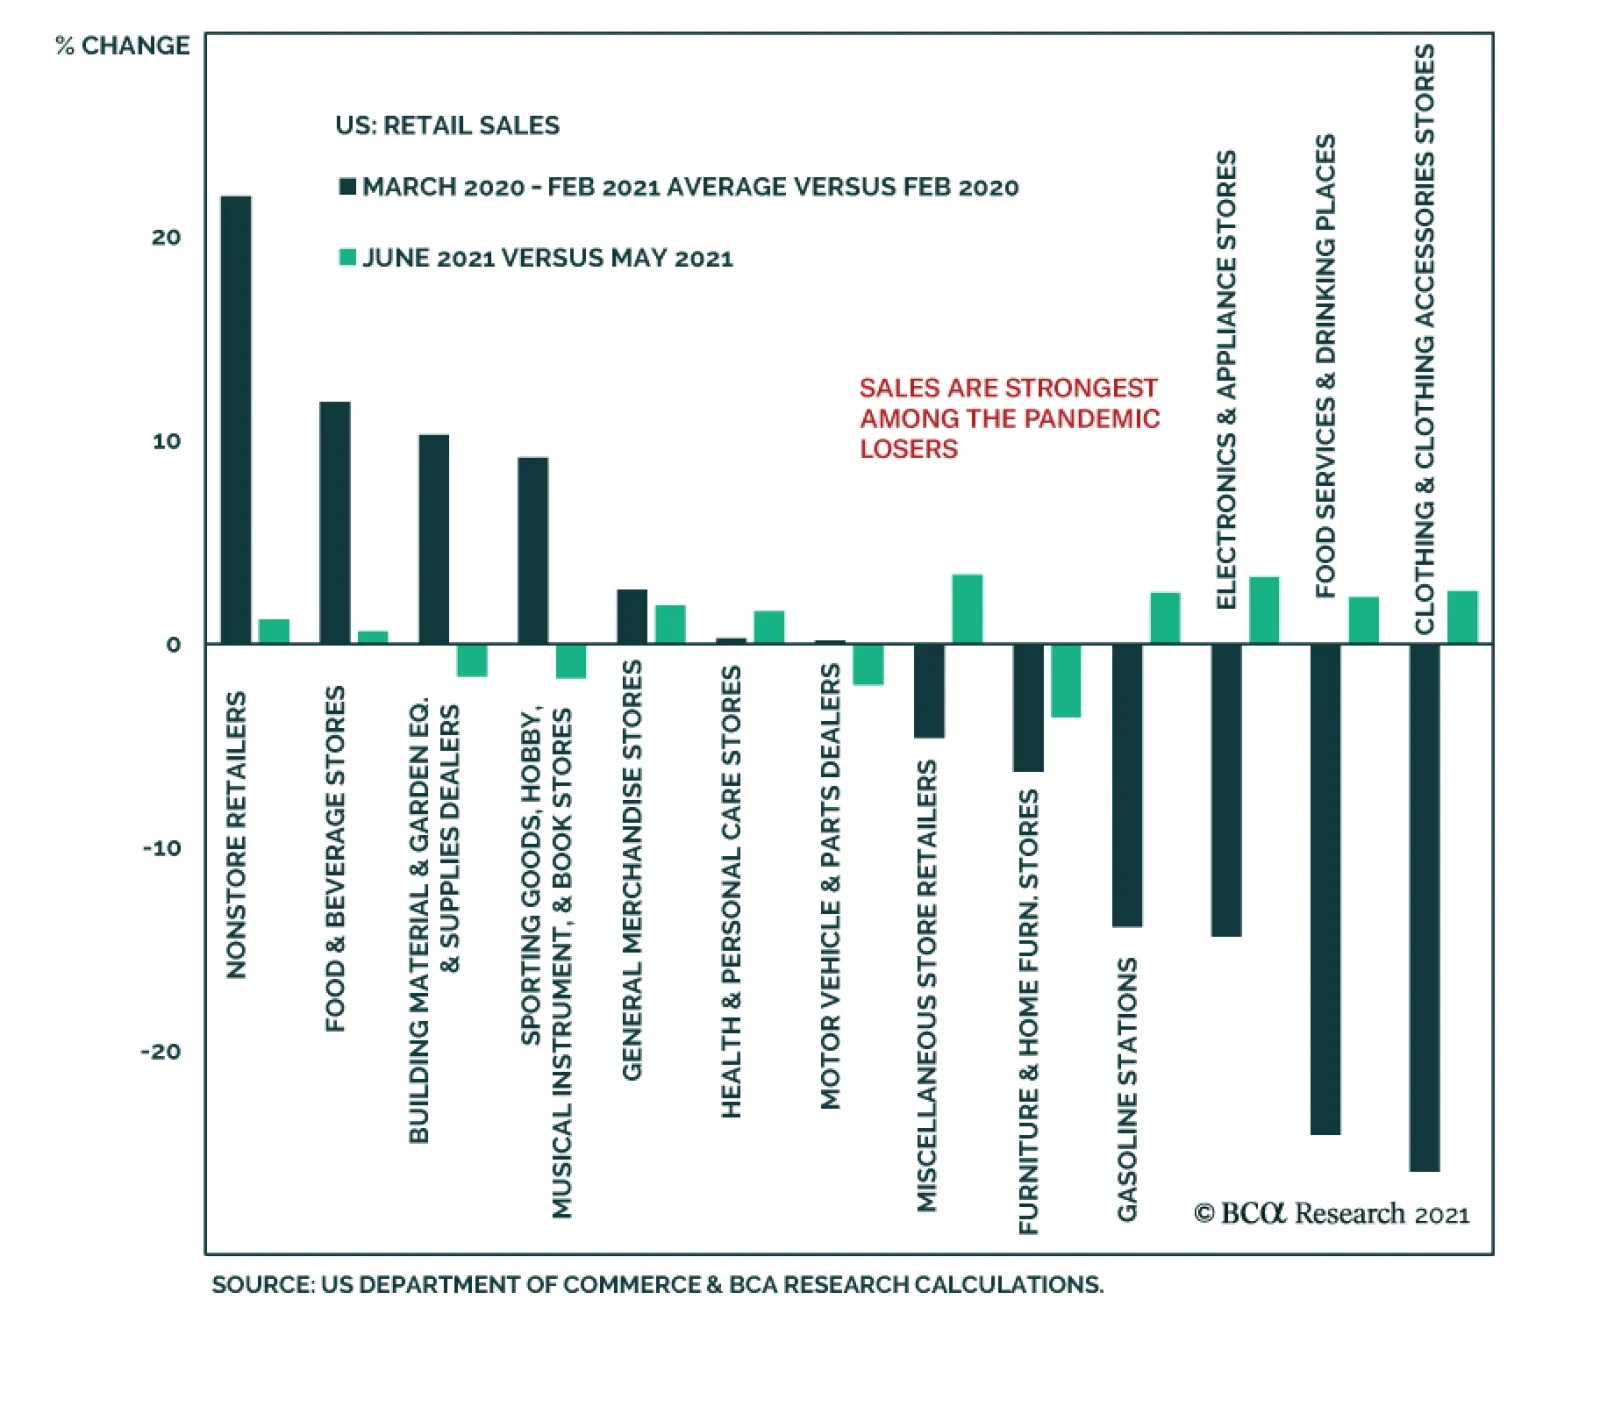
The US retail sales report for June surprised to the upside. The headline number increased 0.6% m/m versus expectations of a 0.3% m/m decline. Similarly, control group sales are up 1.1% m/m, beating consensus estimates of a more muted 0.4% m/m gain. The…
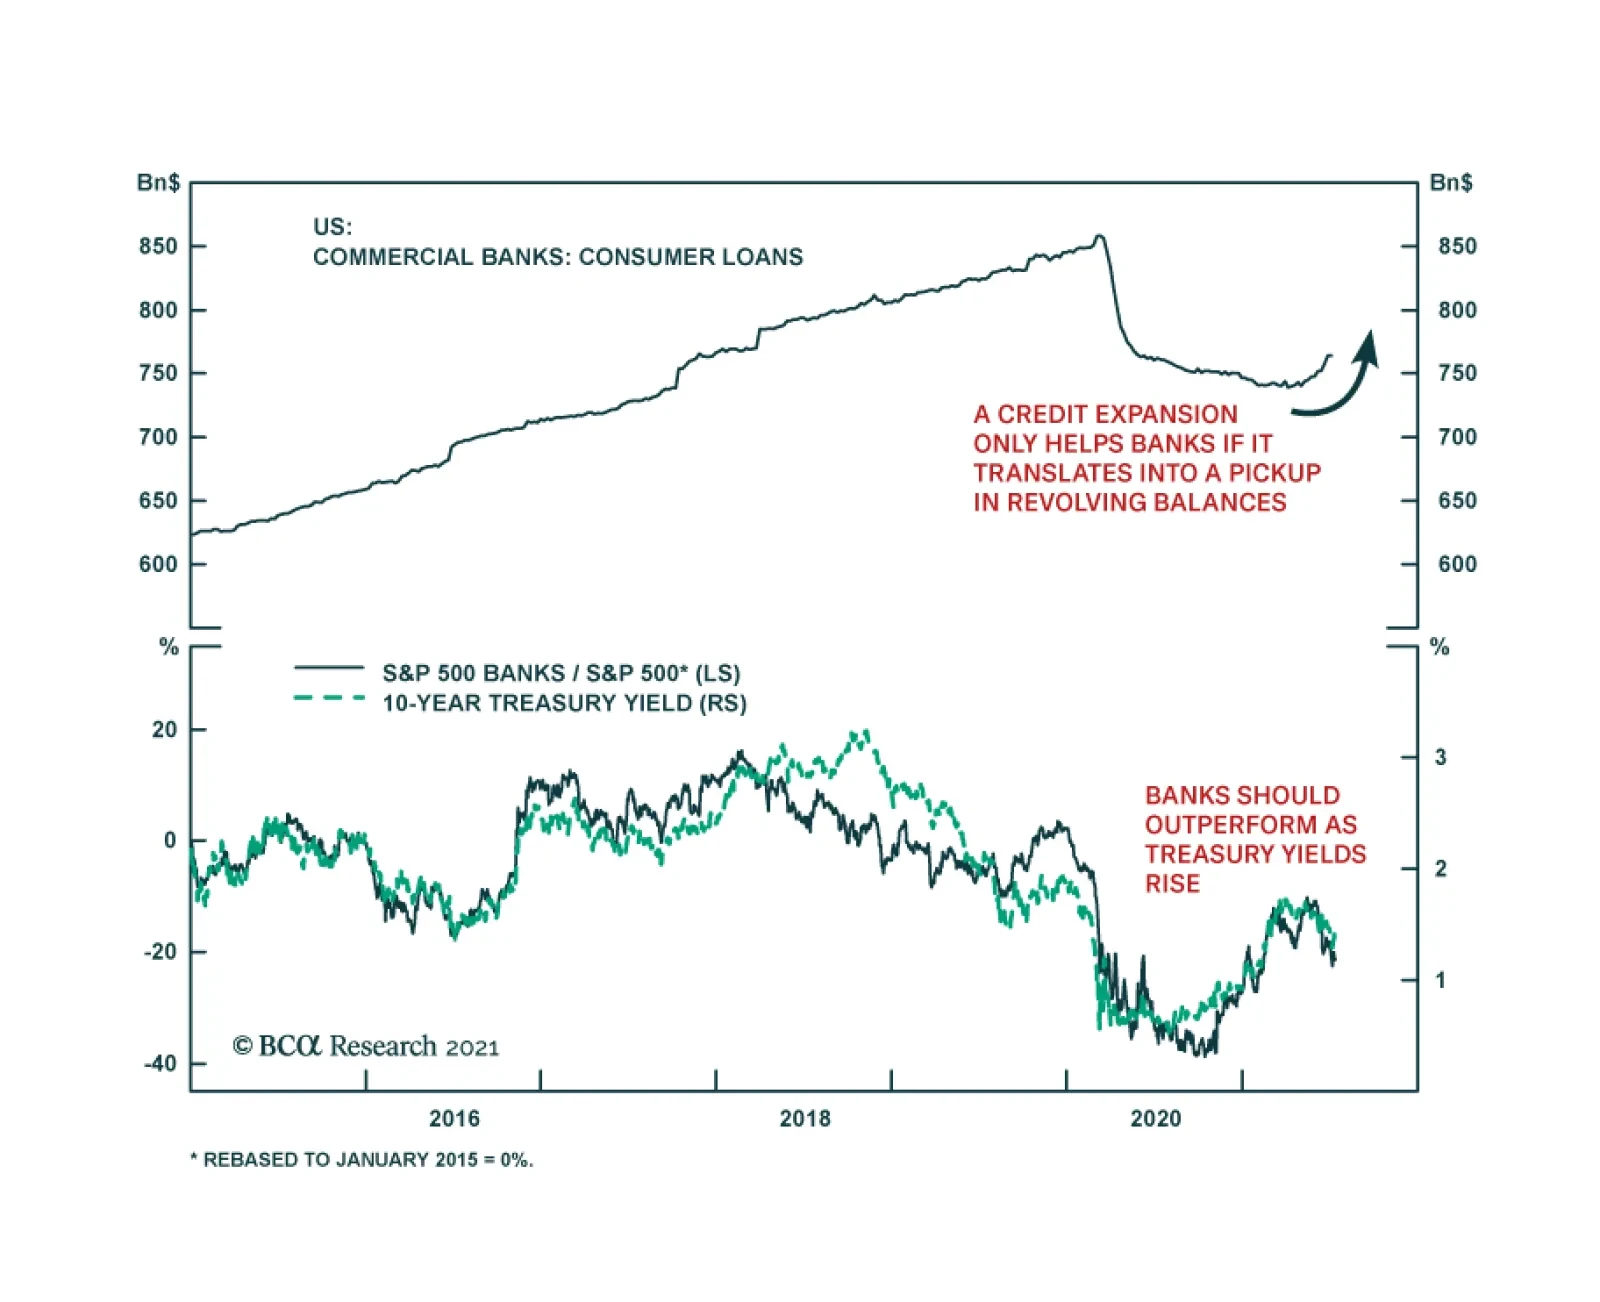
The Q2 earnings season kicked off in the US this week with banks. The main takeaway from all major banks is that both households and businesses are in very good shape – a positive for the economy, but not for banks. Ultra-accommodative monetary and fiscal…

Highlights Global oil demand will remain betwixt and between recovery and relapse through 3Q21, as stronger DM consumer spending and increasing mobility wrestles with persistent concerns over COVID-19-induced lockdowns in Latin America and Asia. These concerns will be allayed as vaccines become more widely distributed, and fears of renewed lockdowns – and their associated demand destruction – recede. Going by US experience – which can be tracked on a weekly basis – as consumer spending rises in the wake of relaxed restrictions on once-routine social interactions, fuel demand will follow suit (Chart of the Week). OPEC 2.0 likely will agree to return ~ 400k b/d monthly to the market over the course of the next year and a hal. For 2021, we raised our average forecast to $70/bbl, and our 2H21 expectation to $74/bbl. For 2022 and 2023, we expect Brent to average $75 and $78/bbl. These estimates are highly sensitive to demand expectations, particularly re containment of COVID-19. Feature For every bit of good news related to the economic recovery from the COVID-19 pandemic, there is a cautionary note. Most prominently, reports of increasing demand for refined oil products like diesel fuel and gasoline in re-opening DM economies are almost immediately offset by fresh news of renewed lockdowns, re-infections in highly vaccinated populations, and fears a new mutant strain of the coronavirus will emerge (Chart 2).1 In this latter grouping, EM economies feature prominently, although Australia this week extended its lockdown following a flare-up in COVID-19 cases. Chart of the WeekUS Product Demand Revives As Economy Reopens
US Product Demand Revives As Economy Reopens
US Product Demand Revives As Economy Reopens
Chart 2COVID-19 Infection And Death Rates Keep Markets On Edge
Demand Dictates Oil Price Expectations
Demand Dictates Oil Price Expectations
Our expectation on the demand side is unchanged from last month – 2021 oil demand will grow ~ 5.4mm b/d vs. 2020 levels, while 2022 and 2023 consumption will grow 4.1 and 1.6mm b/d, respectively (Chart 3). These estimates reflect the slowing of global GDP growth over the 2021-23 interval, which can be seen in the IMF's and World Bank's GDP estimates, which we use to drive our demand forecasts.2 Weekly data from the US seen in the Chart of the Week provide a hint of what can be expected as DM and EM economies re-open in the wake of relaxed restrictions on once-routine social interactions. Demand for refined products – e.g., gasoline, diesel fuel and jet fuel – will recover, but at uneven rates over the next 2-3 years. The US EIA notes the recovery in diesel demand, which is included in "Distillates" in the chart above, has been faster and stronger than that of gasoline and jet fuel. This is largely because it reflects the lesser damage done to freight movement and activities like mining and manufacturing. The EIA expects 4Q21 US distillate demand to come in 100k b/d above 4Q19 levels at 4.2mm b/d, and to hit an all-time record of 4.3mm b/d next year. US gasoline demand is not expected to surpass 2019 levels this year or next, in the EIA's forecast. This is partly due to improved fuel efficiencies in automobiles – vehicle-miles travelled are expected to rise to ~ 9mm miles/day in the US, which will be slightly higher than 2019's level. Jet fuel demand in the US is expected to return to 2019 levels next year, coming in at 1.7mm b/d. Chart 3Global Oil Demand Forecast Remains Steady
Global Oil Demand Forecast Remains Steady
Global Oil Demand Forecast Remains Steady
Quantifying Demand Risks We use the recent uptick in COVID-19 cases as the backdrop for modelling demand-destruction scenarios in this month’s oil balances (Chart 2). We consider different scenarios of potential demand destruction caused by the resurgence in the pandemic (Table 1). Last year, demand fell by 9% on average, which we take to be the extreme down move over an entire year. In our simulations, we do not expect demand to fall as drastically this time. Table 1Demand-Destruction Scenario Outcomes
Demand Dictates Oil Price Expectations
Demand Dictates Oil Price Expectations
We modelled two scenarios – a 5% drop in demand (our low-demand-destruction scenario) and an 8% drop in demand (our high-demand-destruction scenario). A demand drop of a maximum of 2% made nearly no difference to prices, and so, we did not include it in our analysis. In both cases, demand starts to fall by September and reaches its lowest point in October 2021. We adjusted changes to demand in the same proportion as changes in demand in 2020, before making estimates converge to our base-case by end-2022. The estimates of price series are noticeably distinct during the period of the simulation (Chart 4). Starting in 2023, the low-demand-destruction prices and base-case prices nearly converge, as do their inventory levels. Prices and inventory levels in the high-demand-destruction case remain lower than the base-case during the rest of the forecast sample. OPEC 2.0 and world oil supply were kept constant in these scenarios. World oil supply is calculated as the sum of OPEC 2.0 and Non-OPEC 2.0 supply. Non-OPEC 2.0 can be broken down into the US, and Non-OPEC 2.0, Ex-US countries. Examples of these suppliers are the UK, Canada, China, and Brazil. OPEC 2.0 can be broken down into Core-OPEC 2.0 and the cohort we call "The Other Guys," which cannot increase production. Core-OPEC 2.0 includes suppliers we believe have excess spare capacity and can inexpensively increase supply quickly. Chart 4Brent Forecasts Rise As Global Economy Recovers COVID-19 Demand Destruction Scenarios
Brent Forecasts Rise As Global Economy Recovers COVID-19 Demand Destruction Scenarios
Brent Forecasts Rise As Global Economy Recovers COVID-19 Demand Destruction Scenarios
OPEC 2.0 Remains In Control We continue to expect the OPEC 2.0 producer coalition led by the Kingdom of Saudi Arabia (KSA) and Russia to maintain its so-far-successful production policy, which has kept the level of supply below demand through most of the COVID-19 pandemic (Chart 5). This allowed OECD inventories to fall below their pre-COVID range, despite a 9% loss of global demand last year (Chart 6). We expect this discipline to continue and for OPEC 2.0 to continue restoring its market share (Table 2). Chart 5OPEC 2.0 Production Policy Kept Supply Below Demand
OPEC 2.0 Production Policy Kept Supply Below Demand
OPEC 2.0 Production Policy Kept Supply Below Demand
Chart 6...And Drove OECD Inventories Down
...And Drove OECD Inventories Down
...And Drove OECD Inventories Down
Table 2BCA Global Oil Supply - Demand Balances (MMb/d, Base Case Balances)
Demand Dictates Oil Price Expectations
Demand Dictates Oil Price Expectations
Our expectation last week the KSA-UAE production-baseline impasse will be short-lived remains intact. We expect supply to be increased after this month at a rate of 400k b/d a month into 2022, per the deal most members of the coalition signed on to prior to the disagreement between the longtime GCC allies. This would, as the IEA notes, largely restore OPEC 2.0's spare capacity accumulated via production cutbacks during the pandemic of ~ 6-7mm b/d by the end of 2022 (Chart 7). It should be remembered that most of OPEC 2.0's spare capacity is held by Gulf Cooperation Council (GCC) states, which includes the UAE. The UAE's official baseline production number (i.e., its October 2018 production level) likely will be increased to 3.65mm b/d from 3.2mm b/d, and its output in 2H21 and 2022 likely will be adjusted upwards. As one of the few OPEC 2.0 members that actually has invested in higher production and can increase output meaningfully, it would, like KSA, benefit from providing barrels out of this spare capacity.3 Chart 7OPEC 2.0 Spare Capacity Will Return
Demand Dictates Oil Price Expectations
Demand Dictates Oil Price Expectations
As we noted last week, we do not think this impasse was a harbinger of a breakdown in OPEC 2.0's so-far-successful production-management strategy. In our view, this impasse was a preview of how negotiations among states with the capacity to raise production will agree to allocate supply in a market starved for capital in the future. This is particularly relevant as US shale producers continue to focus on providing competitive returns to their shareholders, which will limit supply growth to that which can be done profitably. We see the "price-taking cohort" – i.e., those producers outside OPEC 2.0 exemplified by the US shale-oil producers – remaining focused on maintaining competitive margins and shareholder priorities. This means maintaining and growing dividends, and returning capital to shareholders will have priority as the world transitions to a low-carbon business model (Chart 8).4 For 2021, we raised our average forecast to $70/bbl on the back of higher prices lifting the year-to-date average so far, and our 2H21 expectation to $74/bbl. For 2022 and 2023, we expect Brent to average $75 and $78/bbl (Chart 9). These estimates are highly sensitive to demand expectations, which, in turn, depend on the global success in containing and minimizing COVID-19 demand destruction, as we have shown above. Chart 8US Shale Producers Focus On Margins
US Shale Producers Focus On Margins
US Shale Producers Focus On Margins
Chart 9Raising Our Forecast Slightly
Raising Our Forecast Slightly
Raising Our Forecast Slightly
Investment Implications In our assessment of the risks to our views in last week's report, we noted one of the unintended consequences of the unplanned and uncoordinated rush to a so-called net-zero future will be an improvement in the competitive position of oil and gas. This is somewhat counterintuitive, but the logic goes like this: The accelerated phase-out of conventional hydrocarbon energy sources brought about policy, regulatory and legal imperatives already is reducing oil and gas capex allocations within the price-taking cohort exemplified by US shale-oil producers. This also will restrict capital flows to EM states with heavy resource endowments and little capital to develop them. Our strong-conviction call on oil, gas and base metals is premised on our view that renewables and their supporting grids cannot be developed and deployed quickly enough to make up for the energy that will be foregone as a result of these policies. Capex for the metals miners has been parsimonious, and brownfield projects continue to dominate. Greenfield projects can take more than a decade to develop, and there are few in the pipeline now as the world heads into its all-out renewables push. In a world where conventional energy production is being forced lower via legislation, regulation, shareholder and legal decisions, higher prices will ensue even if demand stays flat or falls: If supply is falling, market forces will lift oil and gas prices – and the equities of the firms producing them – higher. As for metals like copper and their producers, if supply is unable to keep up with demand, prices of the commodities and the equities of the firms producing them will be forced to go higher.5 This call underpins our long S&P GSCI and COMT ETF commodity recommendations, and our long MSCI Global Metals & Mining Producers ETF (PICK) recommendation. We will look for opportunities to get long oil and gas producer exposure via ETFs as well, given our view on oil and metals spans the next 5-10 years. Robert P. Ryan Chief Commodity & Energy Strategist rryan@bcaresearch.com Ashwin Shyam Research Associate Commodity & Energy Strategy ashwin.shyam@bcaresearch.com Commodities Round-Up Energy: Bullish The US EIA expects growth in large-scale solar capacity will exceed the increase in wind generation for the first time ever in 2021-22. The EIA forecasts 33 GW of solar PV capacity will be added to the US grid this year and next, with small-scale solar PV increasing ~ 5 GW/yr. The EIA expects wind generation to increase 23 GW in 2021-22. The EIA attributed the slow-down in wind development to the expiration of a $0.025/kWH production tax credit at the end of 2020. Taken together, solar and wind generation will account for 15% of total US electricity output by the end of 2022, according to the EIA. Nuclear power will account for slightly less than 20% of US generation in 2021-22, while hydro will fall to less than 7% owing to severe drought in the western US. At the other end of the generation spectrum, coal will account for ~ 24% of generation this year, as it takes back incremental market share from natural gas, and ~ 22% of generation in 2022. Base Metals: Bullish Iron ore prices continue to trade above $215/MT in China, even as demand is expected to slow in 2H21. Supply additions from Brazil, which ships higher quality 65% Fe ore, have been slower than expected, which is supporting prices (Chart 10). Separately, the Chinese government's auction of refined copper earlier this month cleared the market at $10,500/MT, or ~ $4.76/lb. Spot copper has been trading on either side of $4.30/lb this month, which indicates the Chinese market remains well bid. Precious Metals: Bullish The 13-year record jump in the US Consumer Price Index reported this week for the month of June is bullish for gold, as it produced weaker real rates and sparked demand for inflation hedges. Fed Chair Powell continued to stick to the view that the recent rise in inflation is transitory. The Fed’s dovish outlook will support gold prices and likely will lead to a weaker US dollar, as it reduces the possibility that US interest rates will rise soon. A falling USD will further bolster gold prices (Chart 11). Chart 10
BENCHMARK IRON ORE 62% FE, CFR CHINA (TSI)RECOVERING
BENCHMARK IRON ORE 62% FE, CFR CHINA (TSI)RECOVERING
Chart 11
Gold Prices Going Down
Gold Prices Going Down
Footnotes 1 We highlighted this risk in last week's report, Assessing Risks To Our Commodity Views, which is available at ces.bcaresearch.com. Two events – in the Seychelles and Chile, where the majority of the populations were inoculated – highlight re-infection risk. Re-infections in Indonesia along with lockdowns following the spread of the so-called COVID-19 Delta variant also are drawing attention. Please see Euro 2020 final in UK stokes fears of spread of Delta variant, published by The Straits Times on July 11, 2021. The news service notes that in addition to the threats super-spreader sporting events in Europe present, "The rapid spread of the Delta variant across Asia, Africa and Latin America is exposing crucial vaccine supply shortages for some of the world's poorest and most vulnerable populations. Those two factors are also threatening the global economic recovery from the pandemic, Group of 20 finance ministers warned on Saturday." 2 Please see the recently published IMF World Economic Outlook Reports and the World Bank Global Economic Prospects. 3 If, as we suspect, KSA and the UAE are playing a long game – i.e., a 20-30-year game – this spare capacity will become more valuable as investment capex into oil production globally slows. Please see The $200 billion annual value of OPEC’s spare capacity to the global economy published by kapsarc.org on July 17, 2018. 4 Please see Bloomberg's interview with bp's CEO Bernard Looney at Banks Need ‘Radical Transparency,’ Citi Exec Says: Summit Update, which aired on July 13, 2021. In addition to focusing on margins and returns, the company – like its peers among the majors – also is aiming to reduce oil production by 20% by 2025 and 40% by 2030. 5 This turn of events is being dramatically played out in the coal markets, where the supply of metallurgical coals is falling as demand increases. Please see Coal Prices Hit Decade High Despite Efforts to Wean the World Off Carbon published by wsj.com on June 25, 2021. Investment Views and Themes Strategic Recommendations Tactical Trades Commodity Prices and Plays Reference Table Trades Closed in 2021 Summary of Closed Trades
Image
Highlights The August 1 deadline for Congress to raise the debt ceiling will come and go but the looming debt showdown will not replay the 2011-13 crisis. It is not a major risk to the bull market. The Biden administration still has the political capital to pass a signature piece of legislation via budget reconciliation by end of year. The tax component of the plan may bring a negative surprise but the market is likely to be more concerned over inflation expectations, eventual Fed rate hikes, and the 2022 fiscal cliff. The Delta variant of COVID-19 is spreading rapidly in Republican-leaning states but the existence of effective vaccines presents an immediate solution. Any substantial new jitters over the pandemic will increase monetary and fiscal stimulus. Stay long value over growth stocks despite near term risks and setbacks. Reassess if technical support is broken. Feature The Democratic Party is attempting to achieve two major things before Congress goes on recess in early August. The first is a $1.2 trillion bipartisan infrastructure package – which will take longer than that and may never pass. The second is a $2-$6 trillion budget resolution that will contain reconciliation instructions to enable the Senate to pass President Joe Biden’s proposed $2.5-$4.1 trillion American Jobs and Families Plan with 51 votes. Democrats may very well achieve this resolution before going on recess but that is the very problem when it comes to negotiations with Republicans. Even though divisions within Republican ranks make bipartisanship more likely to succeed than usual, investors should not bet on it. A partisan reconciliation process virtually guarantees both that Democrats pass their next spending bill without major disappointments for the market and that the debt ceiling is not a substantial risk to the bull market. The real risk for investors is that the markets have mostly priced the Democrats’ stimulus spending and will increasingly turn to tax hikes and especially Fed rate hikes. While we expect dovish surprises from the Fed, the strong 4.5% year-on-year growth in core consumer prices, in the context of booming consumer sentiment (Chart 1), suggests the opposite. Chart 1Consumer Confidence Still Rebounding
Consumer Confidence Still Rebounding
Consumer Confidence Still Rebounding
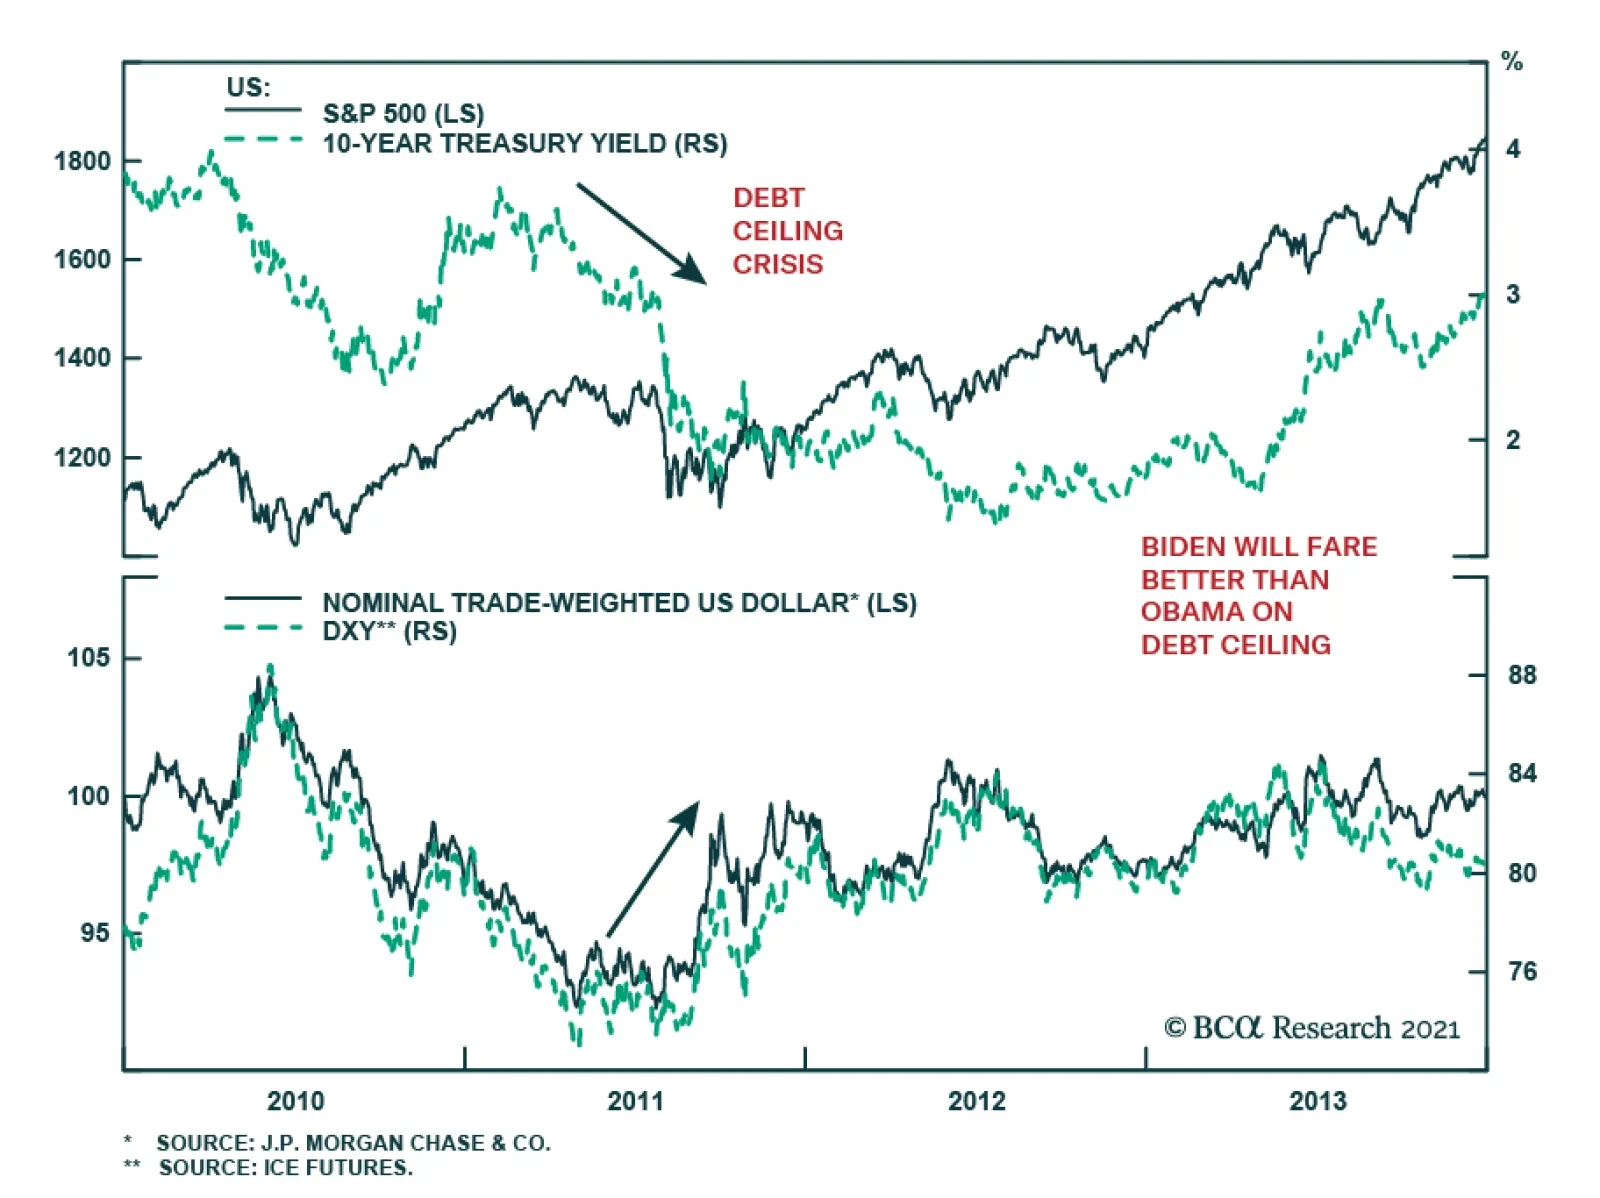
The Debt Ceiling Is Not A Significant Risk To The Bull Market Investors are increasingly concerned about the US debt ceiling, or statutory limit on the national debt, which comes due on August 1. But the debt ceiling does not pose a significant risk to the bull market this time around. The US is not in the same political context as it was in 2011-13 when debt showdowns roiled markets. Investors’ concerns are understandable, of course. In the wake of the Great Recession, congressional Democrats and Republicans quarreled over the debt ceiling, resulting in notable disinflationary episodes in which stocks fell while Treasuries and the dollar rallied (Chart 2). A close look at the debt showdowns of summer 2011 and winter 2012-13 reveals that the “risk off” phase occurred immediately in the first case and over the succeeding month in the second case (Chart 3). The implication is that the whole period from September to December of 2021 could be at risk from any new debt showdown. To understand why risk is not substantial this year one needs to understand what the debt ceiling is. Chart 2ABiden Will Fare Better Than Obama On Debt Ceiling
Biden Will Fare Better Than Obama On Debt Ceiling
Biden Will Fare Better Than Obama On Debt Ceiling
Chart 2BBiden Will Fare Better Than Obama On Debt Ceiling
Biden Will Fare Better Than Obama On Debt Ceiling
Biden Will Fare Better Than Obama On Debt Ceiling
Chart 3A Close Look At Debt Ceiling Showdowns, 2011-13
A Close Look At Debt Ceiling Showdowns, 2011-13
A Close Look At Debt Ceiling Showdowns, 2011-13
The debt ceiling is a legislative instrument intended to constrain the US’s public debt. Congress must authorize a higher debt limit to enable the Treasury Department to make debt payments. Legislating a higher debt ceiling is not the same as legislating government spending. Congress spends money through the annual appropriations process. Government spending amidst recurring budget deficits requires new debt issuance to provide the funds to be spent. But debt in excess of the statutory limit must be authorized by raising the limit. The last time Congress expanded the debt ceiling was in August 2019, leaving August 1, 2021 as the next deadline. Theoretically it is unpopular for congressmen to increase the allowance for their own profligate policies and as such the debt ceiling acts a curb on deficits and debt. In reality the two political parties usually pull together the 60 votes needed in the Senate to raise or suspend the limit and prevent the federal government from defaulting on debt payments that come due. The reason is that, if the debt limit were not raised, the government would default on debt payments and be forced to halt social security payments, civil servant wages, and other essential payments. A failure to write checks to seniors and military veterans would be extremely unpopular and both the president’s party and the opposition party would suffer for it (Chart 4). Chart 4ABoth President And Congress To Suffer From Any Debt Showdown
The Debt Ceiling Is The Least Of Your Worries
The Debt Ceiling Is The Least Of Your Worries
Chart 4BBoth President And Congress To Suffer From Any Debt Showdown
The Debt Ceiling Is The Least Of Your Worries
The Debt Ceiling Is The Least Of Your Worries
This does not mean that 10 Senate Republicans can easily be found to join 50 Democrats, thus reaching 60 votes in the Senate to raise the debt limit. The battle is likely to extend well into the fall, pushing up against Treasury Secretary Janet Yellen’s warning that the Treasury could run out of funds before Congress returns in mid-September. The battle will likely extend into October and create fears of a default. Getting 10 Republicans is difficult. It will not occur as part of a compromise infrastructure package, even though this package already has 11 Republicans supporting it. First, the bipartisan infrastructure deal may fail anyway because Republicans know that Democratic leadership, whether they admit it or not, will tie the deal to the passage of their larger budget reconciliation bill later this fall. Since Republicans oppose the reconciliation bill they may not be able to save face if they vote for an infrastructure deal that enables it. And Democrats do not have any reason to compromise on a bipartisan deal if they think it will destroy their larger reconciliation ambitions. Second, if a bipartisan infrastructure deal comes together, Republicans will insist that the debt ceiling is kept separate. They will not want to link themselves and their infrastructure spending with the bulging national debt. Rather they will want to force the Democrats to link their massive social spending with the national debt. Democrats may accept this trade off since the Biden administration wants a bipartisan deal – as long as they are given guarantees from moderate Senate Democrats that the latter will support the reconciliation bill. Public opinion is not generally distressed when it comes to federal budget deficits and the national debt. Only 3% of Americans cite these as the most important problem facing the country today – obviously people are more concerned with the general economic recovery and unemployment (Chart 5). However, voters clearly believe debt is one of the country’s problems, with 43% saying they are “very concerned” about debt growth, including 45% of independents. Republicans are under significant pressure on these issues, which is why only moderates would conceivably vote to raise the debt limit and even then would only raise it if forced to choose between doing so and triggering a national default (Chart 6). Brinkmanship is to be expected. Chart 5Voters Say Recovery More Important Than Debt
The Debt Ceiling Is The Least Of Your Worries
The Debt Ceiling Is The Least Of Your Worries
Chart 6Yet Concern About Debt Is Not Negligible
The Debt Ceiling Is The Least Of Your Worries
The Debt Ceiling Is The Least Of Your Worries
While public opinion generally favors infrastructure spending, support for infrastructure falls when it is explicitly linked to increases in national debt. Only 39% of voters, and 30% of independents, think it is acceptable to increase the debt to pay for infrastructure, according to a recent Ipsos/Reuters poll (Chart 7). About 60% of Democrats agree with this statement and 22% of Republicans. The implication – as we have long argued – is that investors should not bet on a bipartisan deal. They should bet on the partisan reconciliation process. Chart 7Democrats Support More Debt For Infrastructure … Others Do Not
The Debt Ceiling Is The Least Of Your Worries
The Debt Ceiling Is The Least Of Your Worries
Support for extreme deficit spending is likely to wane as the economy recovers and the sense of crisis abates. Support for emergency COVID-19 fiscal relief was very high early this year (Chart 8). Yet even at the height of the lockdowns there was a non-negligible group of voters who claimed to care about deficits (Chart 9). Fortunately for the Biden administration, the window of opportunity has not yet closed. The rise in the Delta variant of COVID-19 is generating higher hospitalization rates and renewed concerns about the pandemic, which will help support additional stimulus measures (Table 1). There is still time to pass a major spending bill on infrastructure and/or social welfare before the end of the year. Chart 8Support For COVID Relief Was Very High
The Debt Ceiling Is The Least Of Your Worries
The Debt Ceiling Is The Least Of Your Worries
Chart 9Yet Voters Showed Some Concern About Deficits Even At Height Of Crisis
The Debt Ceiling Is The Least Of Your Worries
The Debt Ceiling Is The Least Of Your Worries
Table 12022 Swing States Struggling With COVID-19
The Debt Ceiling Is The Least Of Your Worries
The Debt Ceiling Is The Least Of Your Worries
Ultimately Democrats control both chambers of Congress and will be able to vote with party discipline on raising the debt ceiling. They can raise the debt ceiling with a simple majority vote if they include it in their upcoming budget reconciliation bill. This is the main reason why investors should look through any financial market jitters: there is a clear escape hatch if Republicans obstruct. The only reason we do not exclude the possibility of Republican cooperation entirely is that Republicans are in such desperate need of a lifeline following President Trump’s defeat and the post-election riot on Capitol Hill. Indeed, the last time Republicans saw anywhere near such low levels of partisan identification was in 2013, after House Republicans brought the US to the brink of defaulting on its debt (Chart 10). The Senate Republicans are divided, not unified in willingness to trigger a default, and we can count at least 10 Senate Republicans who will capitulate if necessary to prevent a default. Chart 10Republicans Need A Lifeline … Infrastructure May Be It
The Debt Ceiling Is The Least Of Your Worries
The Debt Ceiling Is The Least Of Your Worries
Of course, Senate Republicans could refuse to raise the debt ceiling anyway. But the crucial difference is that Congress is not gridlocked. Democrats, as the ruling party, would suffer in the event of a default and they have the reconciliation process to prevent that from happening. (We have also maintained that they will eventually water down or abolish the Senate filibuster, which would open another way to lift the debt ceiling, although so far they have not succeeded in doing so.) Bottom Line: There are reasons for investors to be increasingly risk averse – tax hikes, eventual Fed rate hikes, the 2022 fiscal cliff, global growth sputters – but the debt ceiling is not one of them. Any major stock market jitters that emerge because of the debt ceiling should be ignored if they are not attended by more significant risks. Biden’s Political Capital Still Sufficient For One More Big Bill All year we have maintained that President Biden will get at least one signature bill passed in addition to the huge COVID-19 relief bill, the American Rescue Plan, passed at the beginning of the year. This view is based in our reading of his political support and capability, as evinced in our Political Capital Index, which we update weekly in the Appendix. This view is on track and we maintain high conviction. Nevertheless readers should be aware that Biden’s support will wobble over the coming months and US economic policy uncertainty will rebound from post-pandemic lows. This week’s update of the Political Capital Index shows some chinks in Biden’s armor that will likely get wider over the coming months, though we do not expect them to prevent the bill from passing. First, while political polarization has subsided from recent peaks in 2020, our polarization indicators are starting to rebound from post-election lows. Our polarization proxy (the gap in partisan approval of the president) will eventually find a floor considering the historically high structural polarization in the country. Meanwhile economic sentiment polarization and the Philly Fed Partisan Conflict Index climbed from their respective lows in the first half of the year, as Congress bickered over Biden’s next reconciliation bill (Chart 11). The upcoming partisan battles over infrastructure, the debt ceiling, budget appropriations, voting rights, guns, the Hyde amendment (abortion), a possible government shutdown, and the midterm elections will revive polarization even if it does not surpass 2020 peaks. Partisanship will ensure the passage of a reconciliation bill but then it will reduce Biden’s ability to pass legislation afterwards. Chart 11Polarization Still Historically Elevated
Polarization Still Historically Elevated
Polarization Still Historically Elevated
Second, Biden’s approval rating is rebounding a bit in July from its low point in June but the legislative process – as well as looming foreign policy challenges and other negative surprises – will weigh on his approval, at least until his infrastructure bill passes (Chart 12). Over the medium term, strong consumer sentiment and a recovering economy will prevent Biden’s approval rating from falling to President Trump’s levels, at least until a major mistake or negative shock occurs. Nevertheless presidents tend to have low approval ratings in the modern era due to partisanship and so far Biden is no exception. Chart 12ABiden Approval Will Suffer Till Infrastructure Passes
The Debt Ceiling Is The Least Of Your Worries
The Debt Ceiling Is The Least Of Your Worries
Chart 12BBiden Approval Will Suffer Till Infrastructure Passes
The Debt Ceiling Is The Least Of Your Worries
The Debt Ceiling Is The Least Of Your Worries
Third, while small business continues to be more concerned with wages and inflation than with Biden’s legislative agenda, concerns about higher taxes are gradually emerging. The business community may finally be internalizing Biden’s American Jobs Plan, which will include a corporate tax hike and possibly also individual tax hikes (Chart 13). The stock market is unlikely to ignore Biden’s corporate tax hikes forever, even if they only cause a one-off hit to earnings of 8%-10%. We expect negative tax surprises from the reconciliation process. The small business community’s opposition to Biden’s agenda is well known, and limited in impact, but it will increasingly detract from his political capital on the margin. Fourth, the economy is beginning to decelerate albeit from a very high rate of growth. The manufacturing PMI and its employment component have fallen from their highs in the first half of the year while the ratio of new orders to inventories was flat in June. The non-manufacturing sector showed the same trend with non-manufacturing business activity and new orders-to-inventories coming down from earlier heights. Non-manufacturing employment ticked down though it will likely rebound soon as enhanced federal unemployment benefits expire (Chart 14). Capex intentions softened a bit. Chart 13Small Biz Wakes Up To Inflation, Tax Hikes
Small Biz Wakes Up To Inflation, Tax Hikes
Small Biz Wakes Up To Inflation, Tax Hikes
Chart 14Economy To Decelerate From Highs
Economy To Decelerate From Highs
Economy To Decelerate From Highs
Still, the unemployment rate continued its decline in June and household and business balance sheets are strong as the economic recovery continues. Biden’s ability to pass his spending plans will ensure that the government contribution to growth remains robust in the coming years, after a soft patch in 2022 as the infrastructure plan is gradually rolled out. Most of these indicators show improvement relative to November, which gives Biden a store of political capital. Bottom Line: Polarization and policy uncertainty are likely to rebound as the economy decelerates, albeit from rapid growth. Ultimately Biden is likely to pass a signature government spending plan by the end of the year, which will give his approval rating a boost. But given thin margins in Congress, and the looming 2022 midterm elections, Biden’s political capital will largely be exhausted after the second half of this year. Fiscal policy will likely be frozen in place for several years after that. Investment Takeaways The debt ceiling is not a major risk to the bull market, though congressional brinkmanship is inevitable. We are prepared for more volatility and near-term equity setbacks but jitters arising solely from the debt ceiling should be looked through.. Investors should stay focused on the high likelihood that Biden and the Democrats will pass a reconciliation bill that will add about $1.3-$2.5 trillion to the budget deficit over eight years. Disappointments in the bill (higher taxes, lower spending) pose a greater risk to the stock market than the debt ceiling. This bill will solidify the economic recovery but also exact a one-off toll on corporate earnings and hasten concerns over rising inflation expectations and Fed rate hikes. Furthermore a fiscal cliff looms in 2022 as budget deficits normalize from extreme levels. Until new stimulus is secured, this fiscal cliff poses a much greater risk than debt ceilings or a possible government shutdown. The Delta variant of the COVID-19 virus is threatening to clog hospitals and thus poses a risk of forcing authorities to tighten social restrictions, especially in Republican-leaning states where vaccination rates are lower (Chart 15). However, we expect vaccinations to rise – and meanwhile highly vaccinated areas will remain free to conduct business. As long as vaccines remain effective, any scare over variants of the virus will be limited. A selloff is possible but would trigger new bouts of monetary and fiscal stimulus. Chart 15Red States Will Have To Increase Vaccination
The Debt Ceiling Is The Least Of Your Worries
The Debt Ceiling Is The Least Of Your Worries
We will maintain our cyclical orientation of favoring value stocks over growth stocks, although this trade faces an immediate and critical test that could trigger a revaluation (Chart 16). Tactically it should be clear from this report that rising policy uncertainty and other near-term risks are abounding. Chart 16A Test For Value Versus Growth
A Test For Value Versus Growth
A Test For Value Versus Growth
Matt Gertken Vice President Geopolitical Strategy mattg@bcaresearch.com Jesse Anak Kuri Associate Editor jesse.Kuri@bcaresearch.com Appendix Table A1USPS Trade Table
The Debt Ceiling Is The Least Of Your Worries
The Debt Ceiling Is The Least Of Your Worries
Table A2Political Risk Matrix
The Debt Ceiling Is The Least Of Your Worries
The Debt Ceiling Is The Least Of Your Worries
Chart A1Presidential Election Model
The Debt Ceiling Is The Least Of Your Worries
The Debt Ceiling Is The Least Of Your Worries
Chart A2Senate Election Model
The Debt Ceiling Is The Least Of Your Worries
The Debt Ceiling Is The Least Of Your Worries
Table A3Political Capital Index
The Debt Ceiling Is The Least Of Your Worries
The Debt Ceiling Is The Least Of Your Worries
Table A4APolitical Capital: White House And Congress
The Debt Ceiling Is The Least Of Your Worries
The Debt Ceiling Is The Least Of Your Worries
Table A4BPolitical Capital: Household And Business Sentiment
The Debt Ceiling Is The Least Of Your Worries
The Debt Ceiling Is The Least Of Your Worries
Table A4CPolitical Capital: The Economy And Markets
The Debt Ceiling Is The Least Of Your Worries
The Debt Ceiling Is The Least Of Your Worries
Footnotes
According to BCA Research’s US Political Strategy service, the August 1 deadline for Congress to raise the debt ceiling is not a major risk to the bull market. Investors are increasingly concerned about the US debt ceiling, or statutory limit on the…
In yesterday’s Sector Insight report we stripped out the base effect from SPX earnings growth. Today, we repeat this exercise and look at a two-year annualised growth rate for US headline CPI as well as some of its categories. Using 2019 as a benchmark year reveals that the headline number is at 3%, sitting on par with the 2011 level – a sharp contrast to the regular 12-month YoY CPI rate (6%) that is close to pre-GFC highs. In fact, the key food & energy categories also appear contained despite the former perking up during the pandemic (Chart 1). 2021/2020 comparison of food and energy prices yields 2.4% and 7.5% YoY inflation respectively. There are also exceptions: The used cars category is clearly accelerating (19%) even compared to 2019, albeit it is just a small component of the headline CPI number. For completion purposes, Chart 2 on the next page also shows data for some of the pandemic-scared industries including airlines and shelter, for which prices are still below pre-pandemic highs. Bottom Line: While optically the 2021 US inflation is surging, our analysis suggests that numbers are exaggerated by the base effect from the pandemic. Chart 1
Chart 1
Chart 1
Chart 2
Chart 2
Chart 2
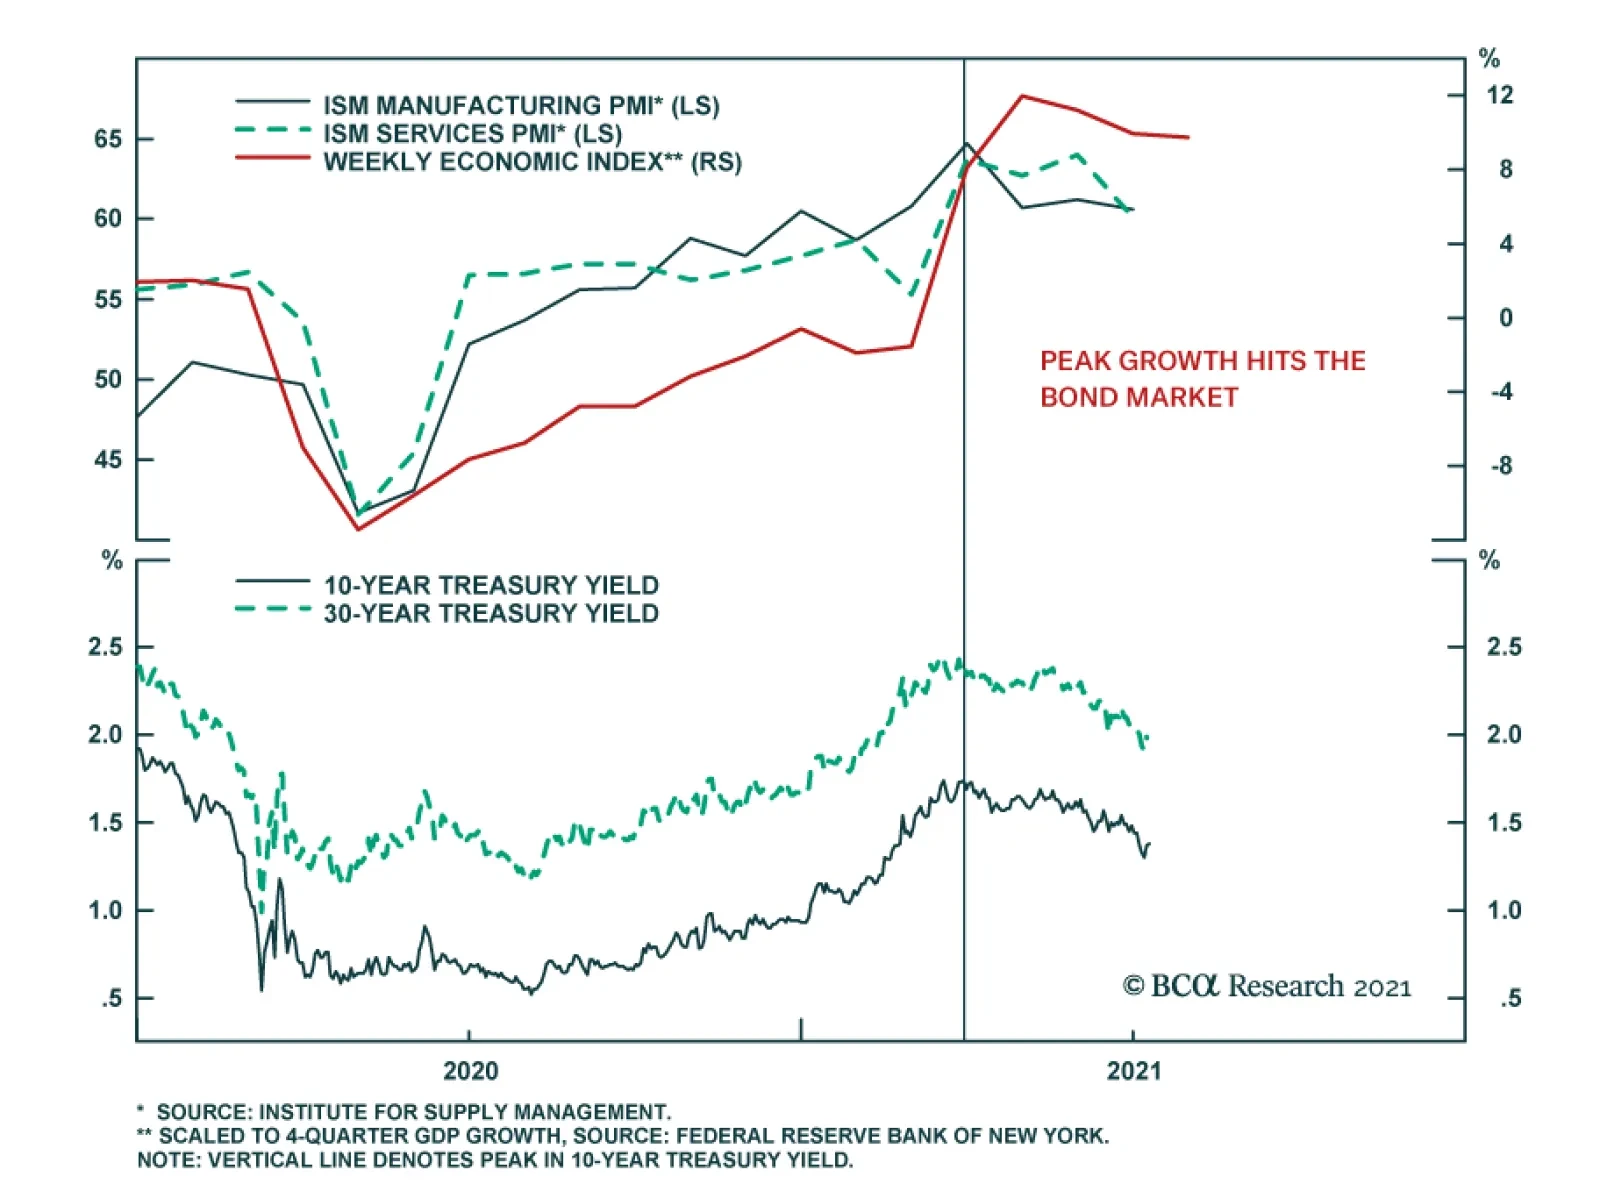
BCA Research’s US Bond Strategy service expects the 10-year Treasury yield to reach a range of 2% - 2.25% by the end of next year when the Fed is ready to lift rates. The team presents three reasons why the recent drop in Treasury yields is overdone. …
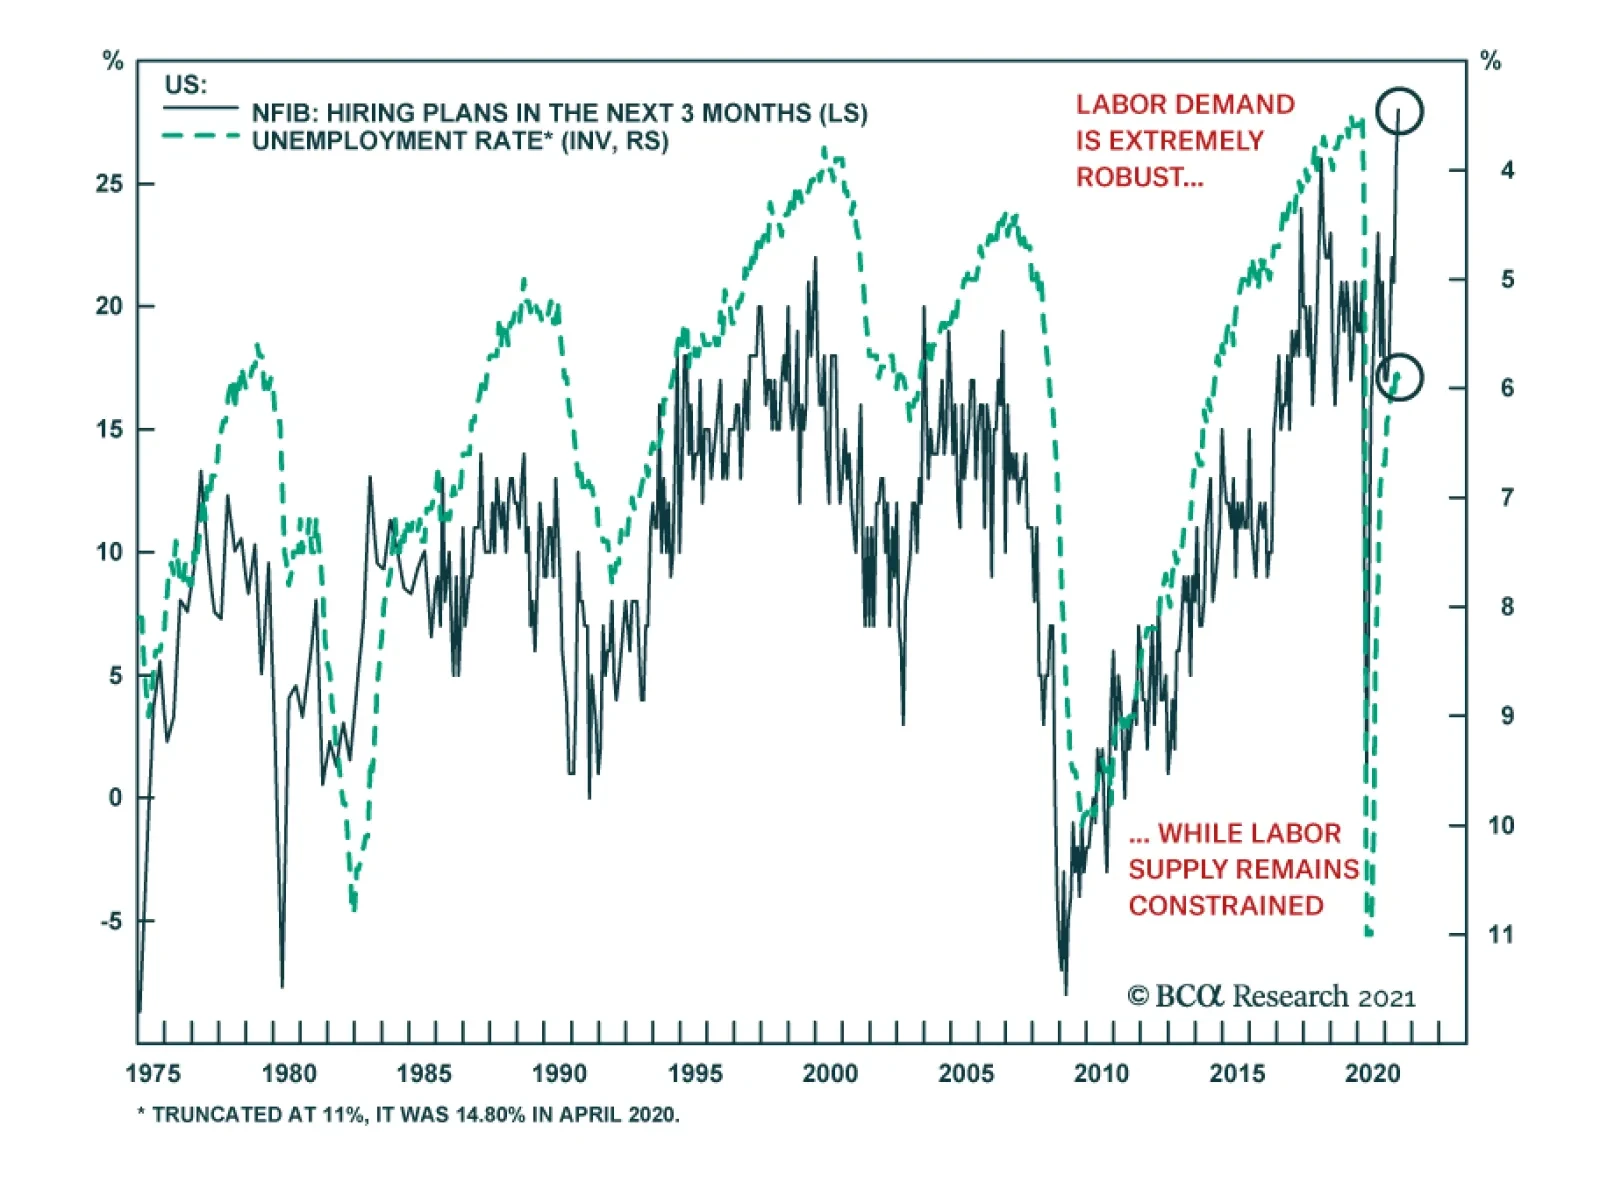
The NFIB Small Business Optimism Index surprised to the upside in June, rising 2.9 points to 102.5 versus expectations of a tick down to 99.5. The NFIB report revealed that a net 28% of respondents plan to create new jobs in the next three months – a…
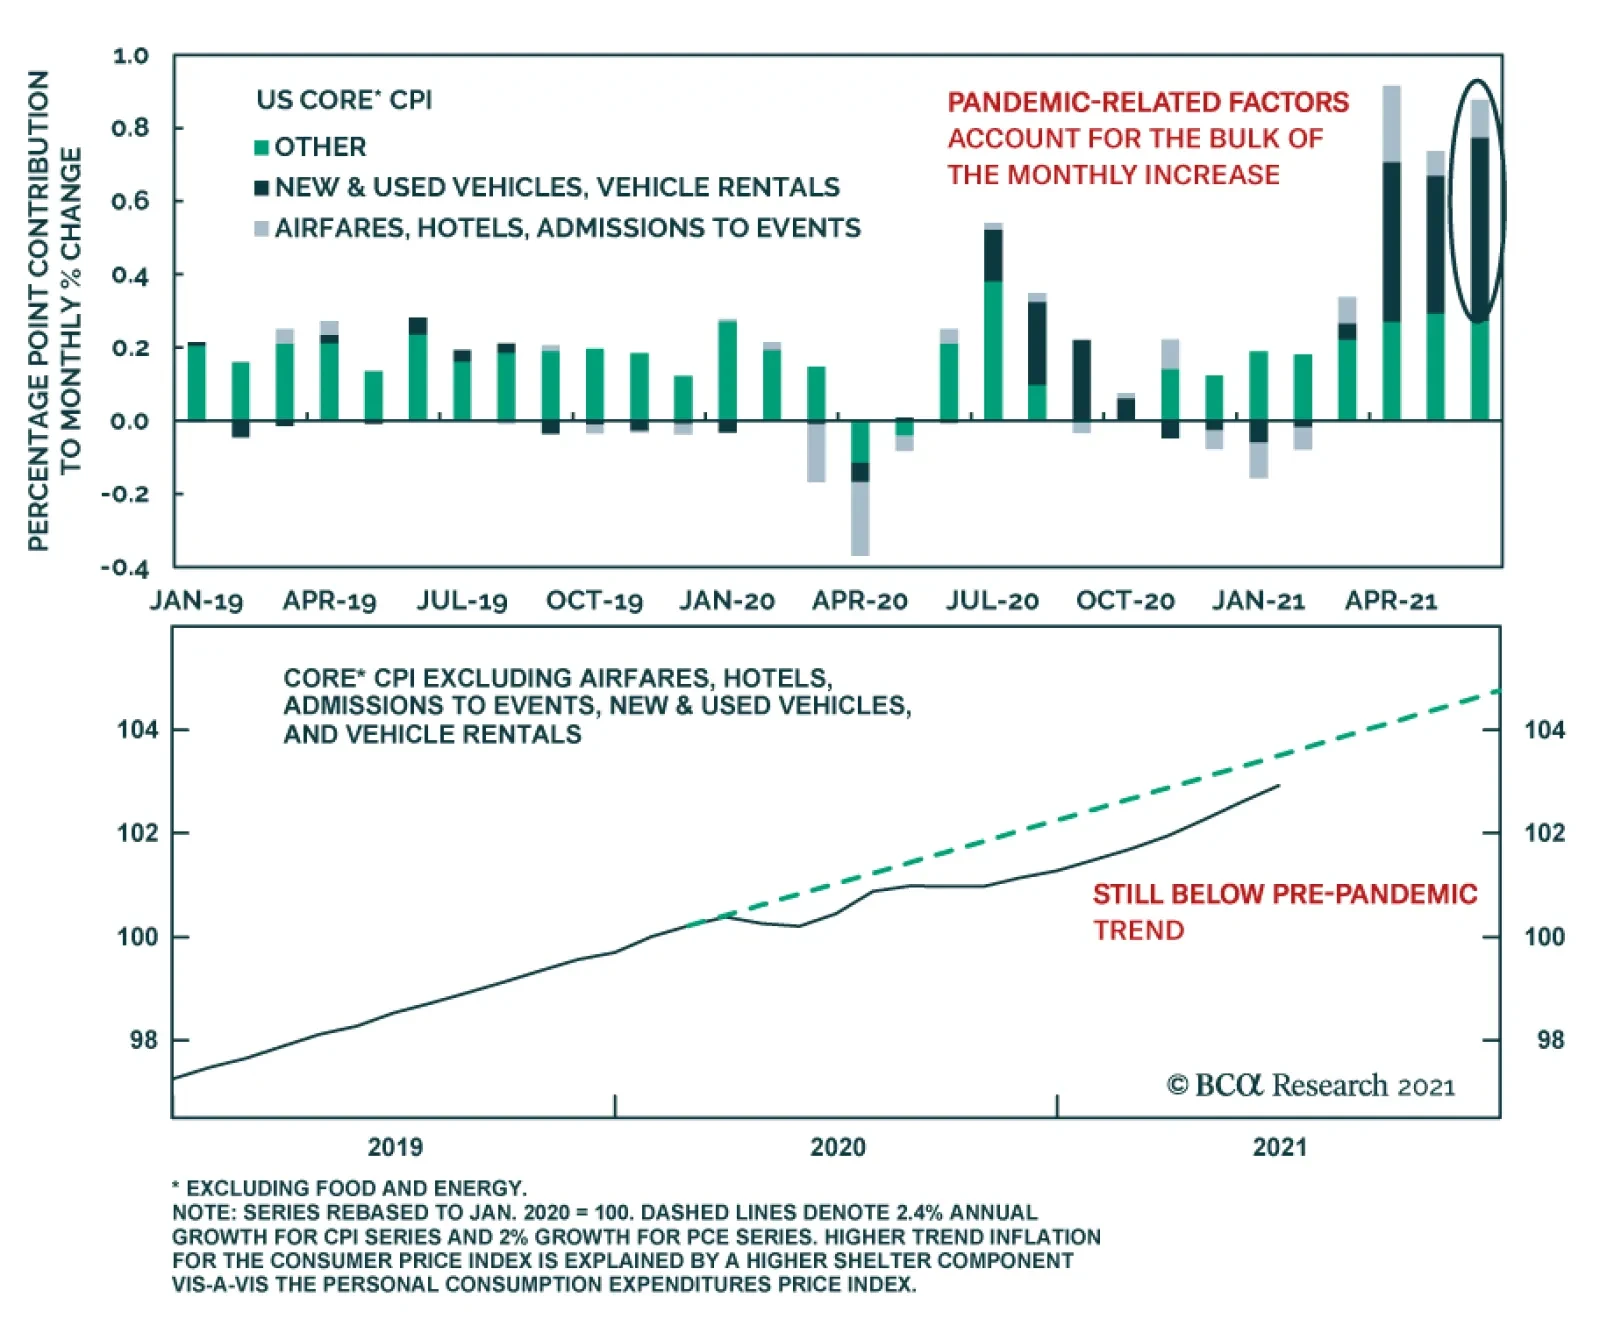
The US consumer price index report for June surprised on the upside. Headline CPI accelerated to 5.4% y/y versus expectations of a 0.1pp decline to 4.9% y/y. Core CPI jumped to 4.5% y/y which is greater than the anticipated 0.2pp increase to 4.0 % y/y.…