United States
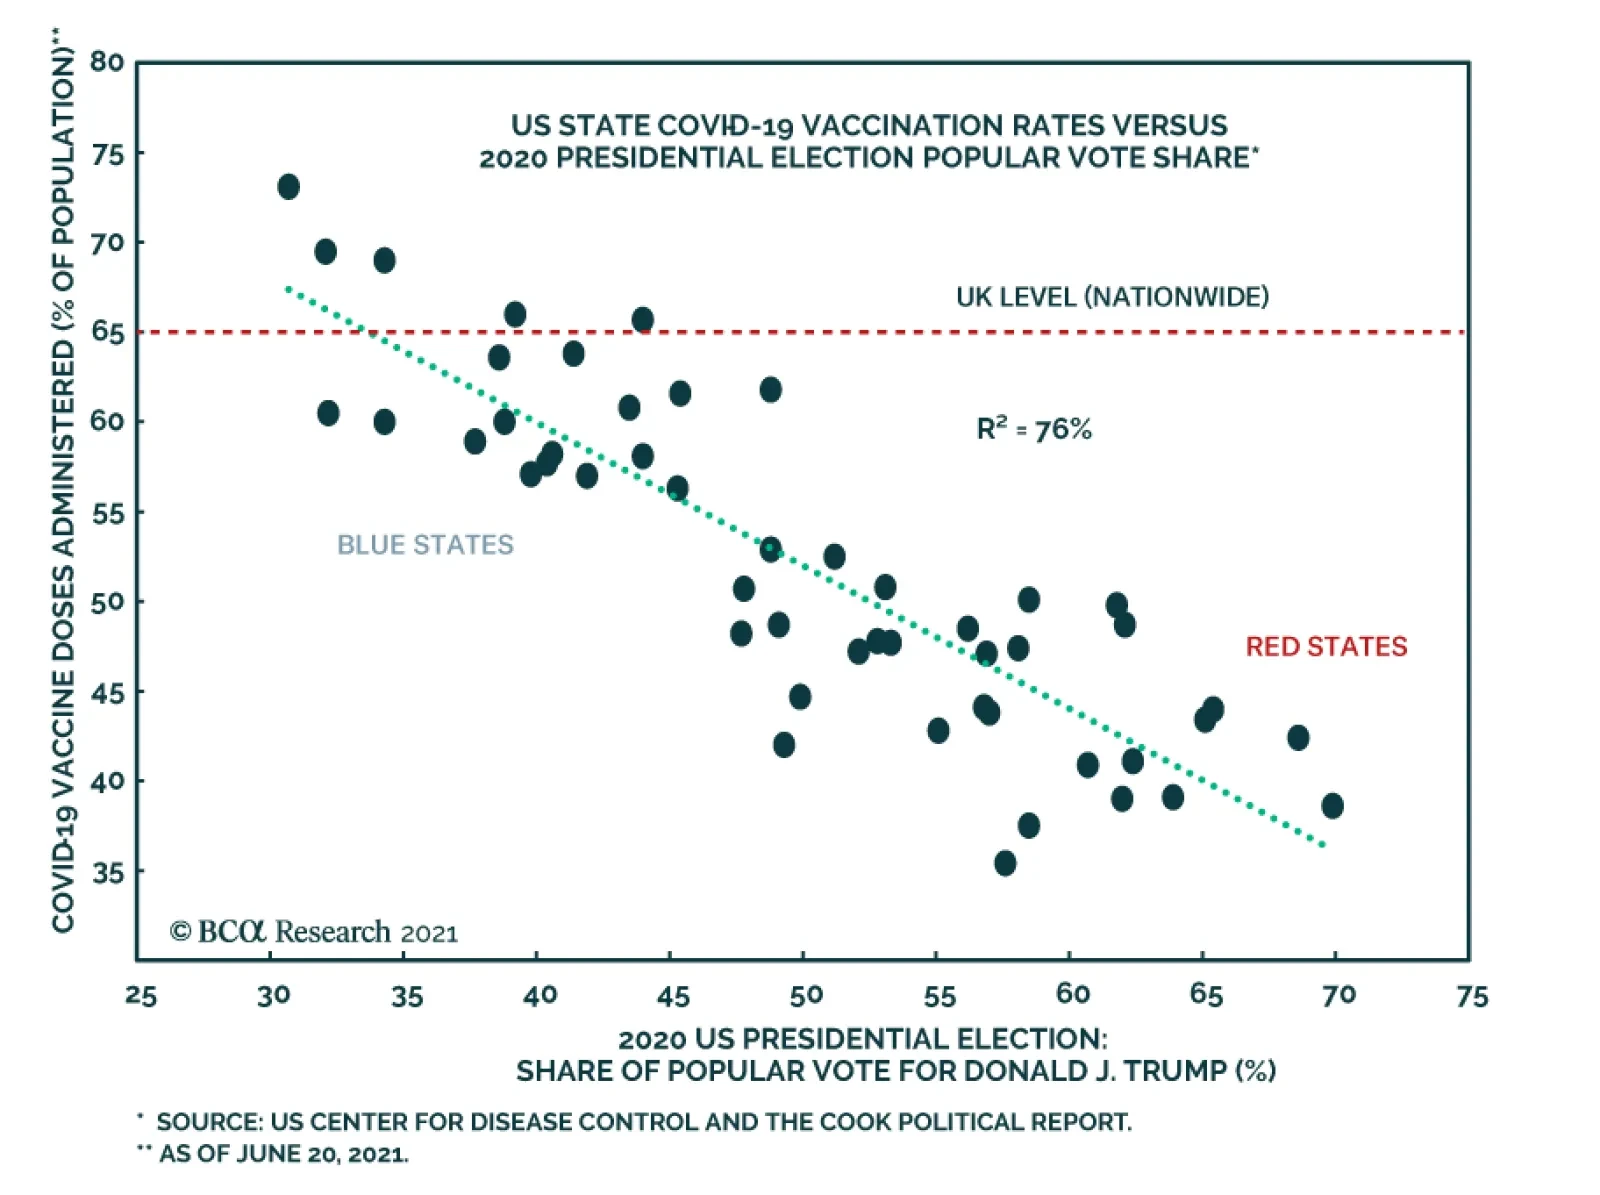
The “Delta variant” has been swiftly spreading across the globe of late. The mutated virus has caused a resurgence in COVID-19 new infections and now accounts for over 90% of all new cases in the UK, forcing the UK government to delay its reopening of the…
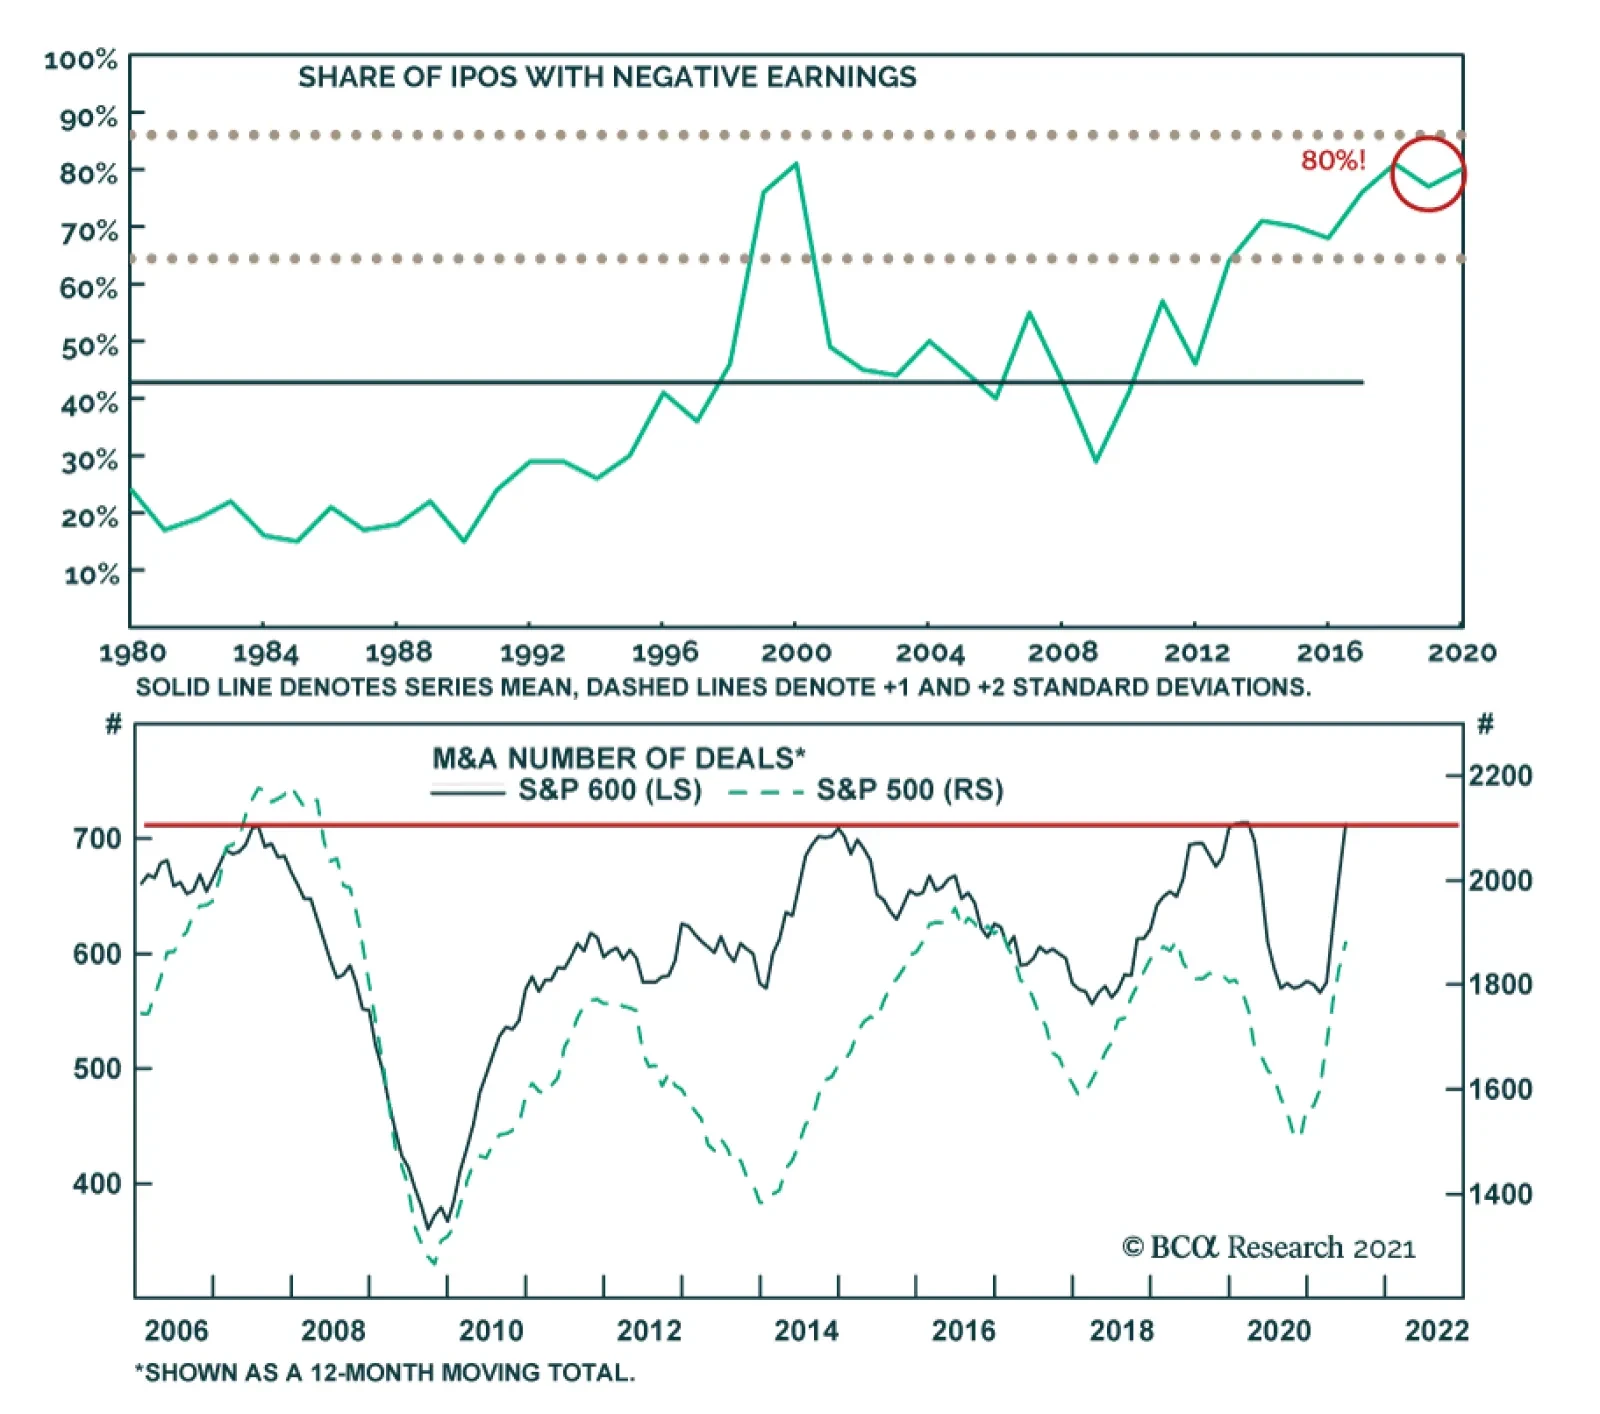
BCA Research’s US Equity Strategy service concludes that the number of IPOs with negative earnings is alarming, moreover, M&A activity has likely peaked. Initial public offerings (IPOs) are a source of future small-cap index constituents. Last year was…

On Small Versus Large Caps
On Small Versus Large Caps
Initial public offerings (IPOs) are a source of future small-cap index constituents. Last year was a fruitful year since 165 companies went public. However, just to put things into perspective, 1999 and 2000 saw 476 and 380 IPOs respectively. IPOs are on the tear this year as well – raking in $171B and already topping the 2020 total. Some 80% of IPOs last year were for unprofitable companies, which is nearly two standard deviations above the historical average of 40% (see chart). While a good crop of IPOs is a great feeder ground for the small-cap indexes, it is concerning that so many unprofitable companies hit the market and often at multi-billion-dollar valuations. Euphoria is certainly the word that comes to mind, and investors’ current willingness to back companies without earnings may be a drag on overall small company earnings’ performance over the next few years. Bottom Line: We recommend investors to fade a rebound in small caps and maintain a neutral size preference. For more details, please refer to this Monday’s Strategy Report.
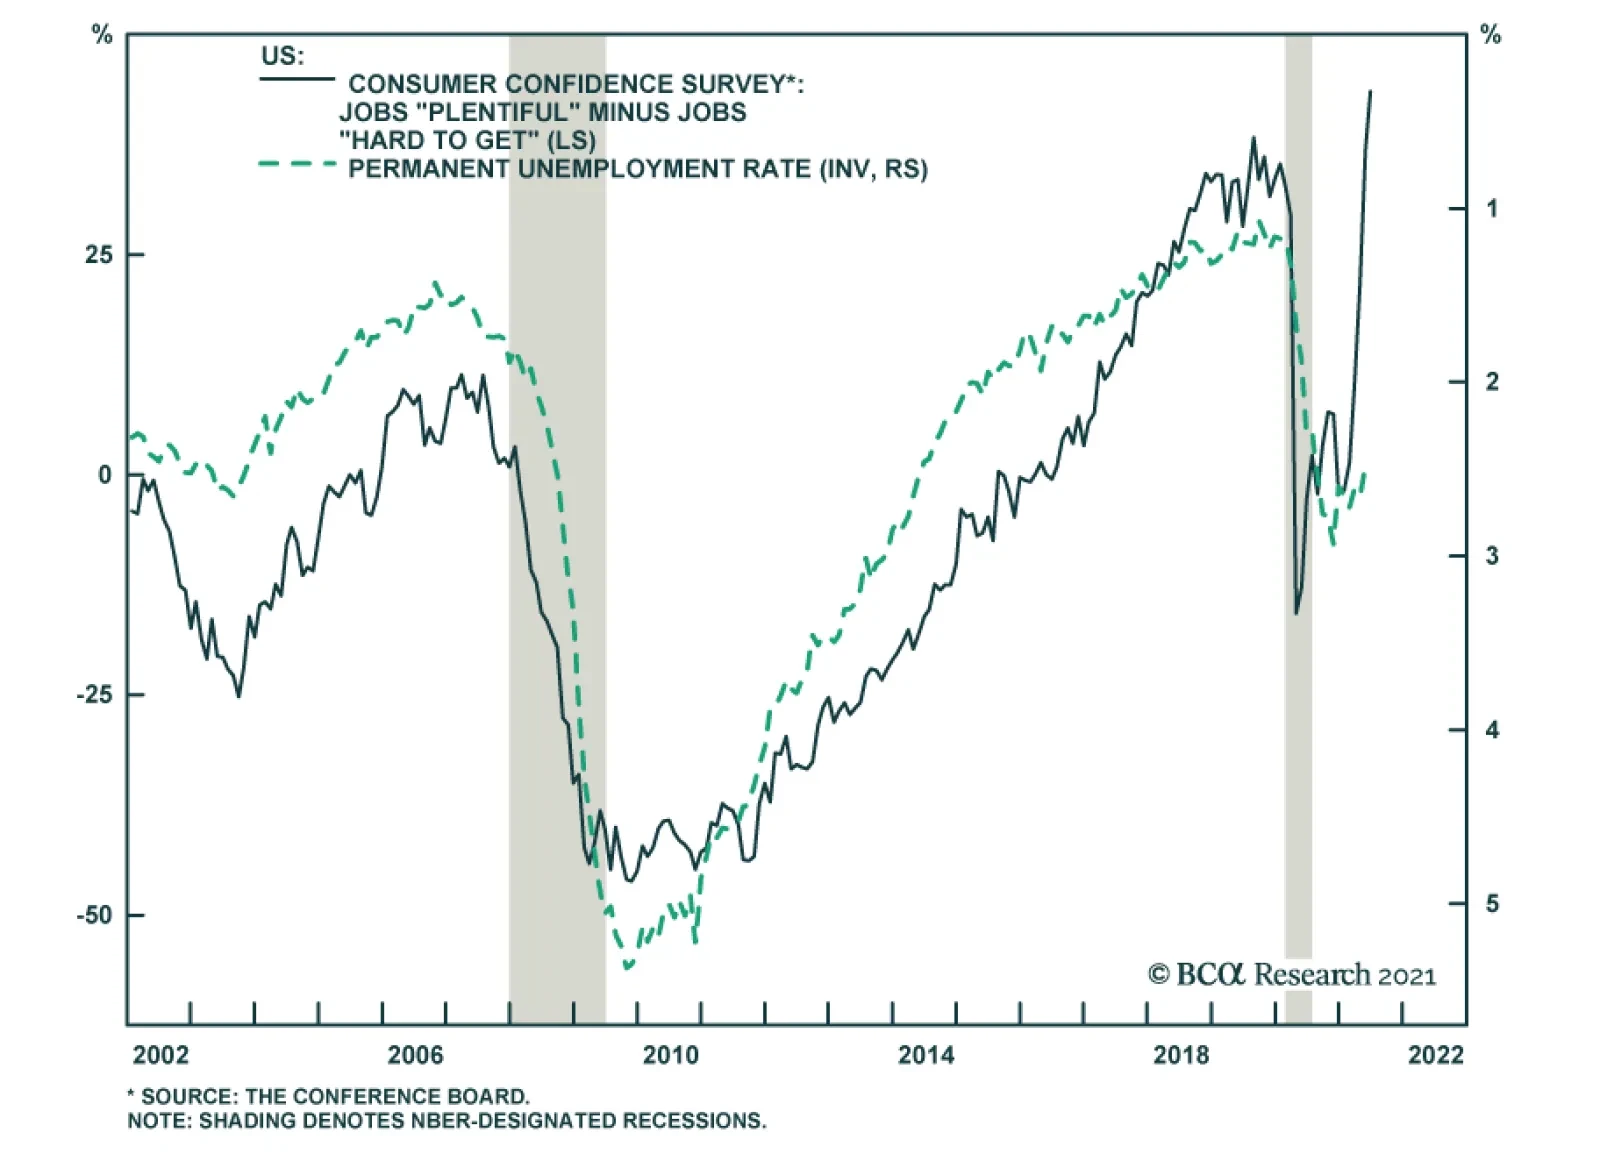
The Conference Board’s June survey of US consumer confidence was released yesterday. Upon release, we immediately checked for any changes in US households’ description of the labor market. We found that the number of survey respondents describing jobs as…
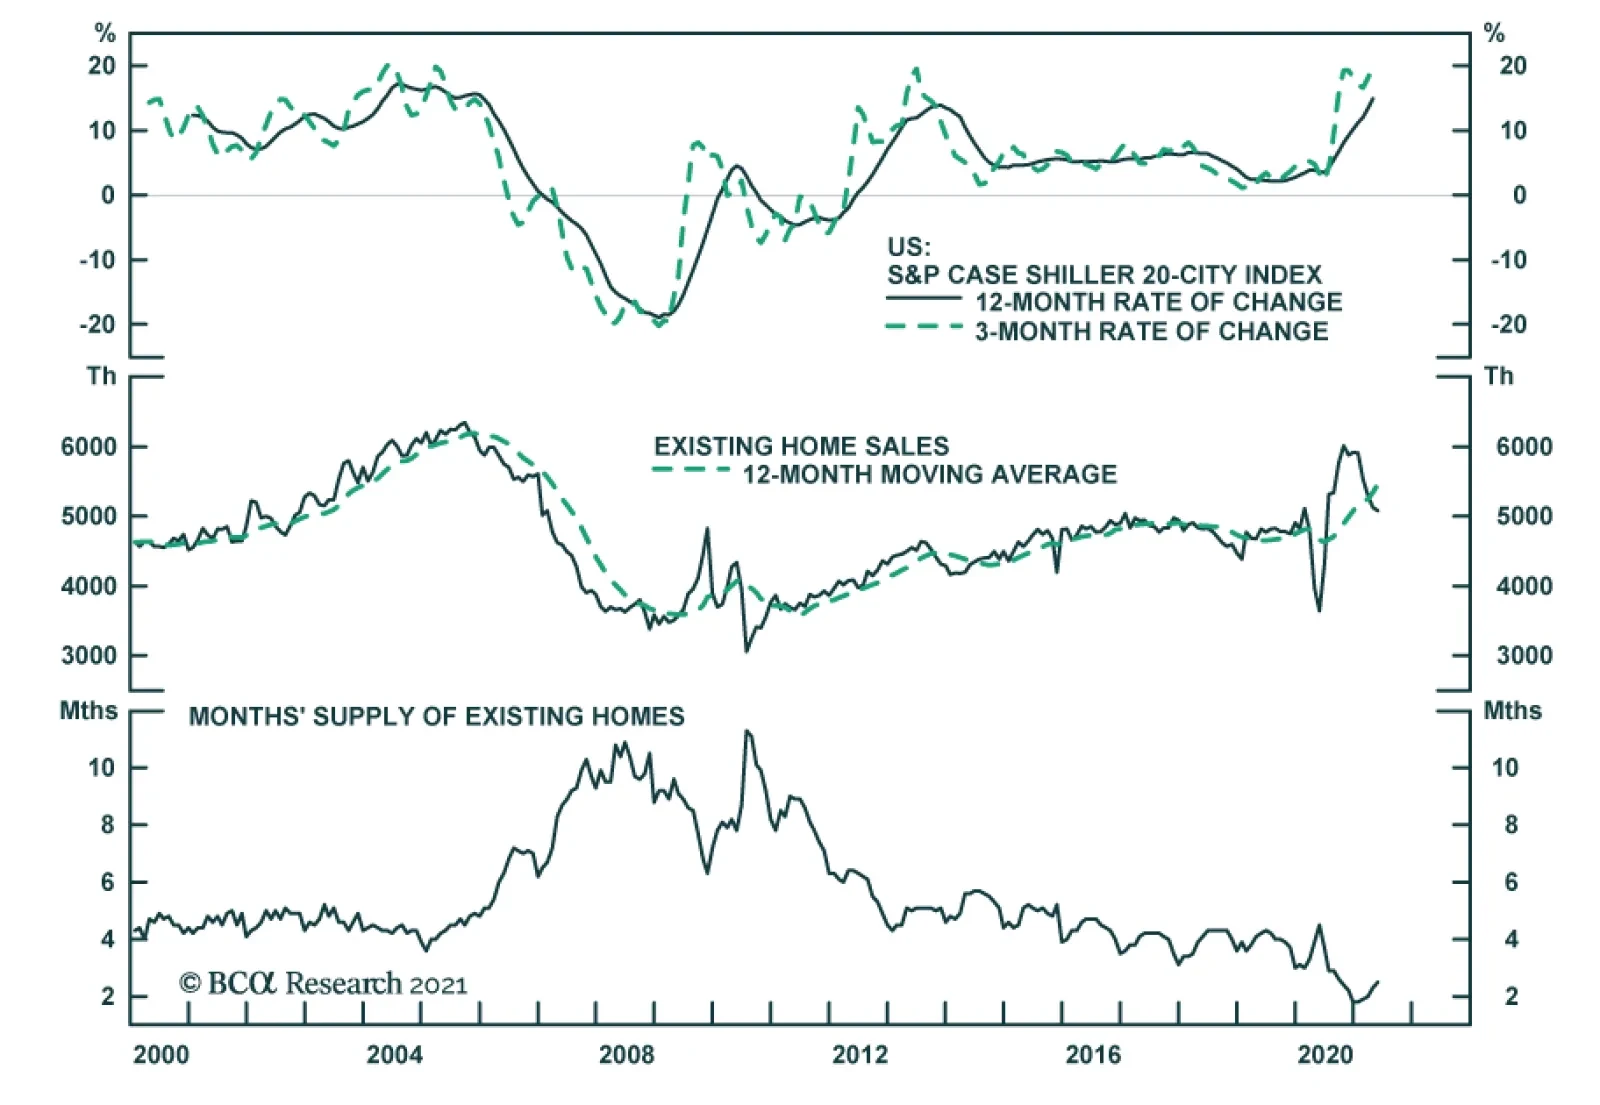
US home prices surged in April. The S&P CoreLogic Case-Shiller 20-City index increased 1.6% on the month, causing the year-over-year growth rate to reach 15% and the annualized 3-month growth rate to hit 20%. These are growth rates that rival the…
This week, we present the third edition of the BCA Research Global Fixed Income Strategy (GFIS) Global Credit Conditions Chartbook—a review of central bank surveys of bank lending standards and loan demand. The data from lending surveys during the first quarter of 2021 point towards easing standards in developed markets (Chart 1). Credit standards for business loans eased outright in most regions except for the euro area and New Zealand where the pace of tightening slowed significantly. On the whole, banks expected the easing trend to continue into Q2. Chart 1Credit Standards Moving Towards Or Deeper Into Easy Territory
Credit Standards Moving Towards Or Deeper Into Easy Territory
Credit Standards Moving Towards Or Deeper Into Easy Territory
With credit spreads at historical tights, banks across the board cited increased competition from other lenders as a reason behind easing standards, confirming that easy financial conditions are not limited solely to booming financial markets. This will help maintain a market-friendly economic growth backdrop as developed economies put pandemic restrictions behind them. At the same time, an absence of tightening lending standards by commercial banks puts incremental pressure on central banks to move towards bond-bearish tightenings of monetary policy. An Overview Of Global Credit Conditions Surveys Chart 2Credit Standards And Spreads Are Correlated
Credit Standards And Spreads Are Correlated
Credit Standards And Spreads Are Correlated
After every quarter, major central banks compile surveys to assess prevailing credit conditions. The purpose is to obtain from banks an assessment of how their lending standards and demand for loans, for both firms and consumers, changed over the previous quarter. Most surveys also ask questions about the key factors driving these changes and expectations for the next quarter.1 For fixed income investors, these surveys are valuable for a few reasons. Firstly, data on consumer lending is a window into consumer health while business loan demand sheds light on the investment picture. These help derive a view on the path of future economic growth and interest rates and, thus, the appropriate duration stance of a bond portfolio. Also, credit standards can tell us about the pass-through from fiscal and monetary policy measures to realized financial conditions (i.e. corporate borrowing rates). Most importantly, credit standards exhibit a direct correlation with corporate bond spreads (Chart 2). As loan officers have access to detailed, non-public information on a large number of borrowers, they are uniquely positioned to evaluate corporate health. When banks are tightening standards, they see an issue with the credit quality of current or future loans, which impacts borrowing costs in the corporate bond market. Tightening standards indicate a worsening borrowing backdrop and weaker growth, which then pushes up corporate spreads. Vice versa, easing standards imply a favorable backdrop and plentiful liquidity—both bullish signs for spread product. US In the US, a net percentage of domestic respondents to the Fed’s Senior Loan Officer Survey, reported easing standards for commercial and industrial (C&I) loans to firms of all sizes over Q1/2021 (Chart 3). Nearly 20% of respondents cited an improving or less uncertain economic outlook as a very important factor behind the decision to ease standards, while roughly one-third cited increased competition from other lenders. Chart 3US Credit Conditions
US Credit Conditions
US Credit Conditions
Chart 4High-yield Borrowers Are Exposed To A Widening In Spreads
High-yield Borrowers Are Exposed To A Widening In Spreads
High-yield Borrowers Are Exposed To A Widening In Spreads
Although it did not strengthen on net, C&I loan demand did weaken at a much slower pace in Q1. The factors driving loan demand suggest a buoyant economic backdrop—about a quarter of banks reporting increased demand cited merger and acquisition needs and increased investment as very important reasons. Meanwhile, weaker loan demand was attributed to less precautionary demand for cash and an increase in internally generated funds among customers. On the consumer side, loan demand improved slightly on the whole, driven largely by a significant improvement in auto loan demand. While consumer loan demand has historically correlated well with the year-over-year growth in personal consumption expenditures, those two series diverged remarkably in Q1, with spending growth far outpacing loan growth. This divergence reflects the tremendous impact of pandemic-related transfer payments and benefits. We expect a continued recovery in consumer lending demand as unemployment benefits are withdrawn and consumers once again have to borrow to finance spending. As part of the special ad-hoc questions in this edition of the survey, respondents were asked about how lending standards had changed compared to the pre-pandemic period by borrower risk rating. Interestingly, large banks actually eased their standards for investment grade borrowers, reflecting the impact of Fed’s massive liquidity injections (Chart 4). However, despite spreads on high-yield having tightened to post-GFC lows, credit standards for below-investment grade borrowers remain much tighter than before the pandemic. So far, lower-quality borrowers have been able to go to public debt markets for financing, but this highlights a downside risk—if there is an event which causes corporate bond spreads to widen, high-yield borrowers may be starved of cheap financing options with banks still holding purse strings taut. Euro Area In the euro area, banks continued to tighten standards to enterprises, albeit at a much-reduced pace, in Q1/2021 (Chart 5). The tightening, however, was lower than expected in the previous quarter, possibly reflecting prolonged policy support and improving risk sentiment. Deteriorating risk perceptions related to the general economic and firm-specific situation were the primary contributing factor to tightening. But this was partly offset by increased competition from other lenders. The reduced pace of tightening does confirm the signal from the high-yield default rate, which is rolling over. Going forward, banks expect the pace of tightening to slow very slightly going into Q2. Chart 5Euro Area Credit Conditions
Euro Area Credit Conditions
Euro Area Credit Conditions
Chart 6Credit Standards For Major Euro Area Economies
Credit Standards For Major Euro Area Economies
Credit Standards For Major Euro Area Economies
Business credit demand continued to weaken at a faster pace in Q1, marking three consecutive quarters of deterioration. Weak fixed investment continued to be the biggest drag on demand, while the previous positive contribution from inventory and working capital needs has disappeared entirely. As we highlighted in the last edition of this chartbook, the continued drag on demand for investment reflects a lingering uncertainty regarding the pandemic which could possibly lower potential long-term growth in the euro area.2 As in the US, however, the reduction in demand also reflected already built-up liquidity buffers and the availability of internal and market-based financing. In Q2, banks expect a strong rebound in enterprise loan demand, especially from small and medium-sized enterprises (SMEs). Consumer credit demand continued to decline at a stronger pace in Q1, reflecting the continued pandemic-related restrictions in Europe over the quarter. The key drivers were lower durable goods spending and weakening consumer confidence. Banks also reported increased use of internally-generated funds, which is consistent with accumulated savings and pent-up demand during the lockdown. Assuming that the emerging Delta variant does not sidetrack the European return to normalcy, we will likely see the expected consumer credit demand rebound come to fruition. This would be consistent with recent strong consumer confidence prints out of the region. Looking individually at the four major euro area economies, credit standards for enterprises tightened in Germany, Italy, and Spain but were unchanged in France (Chart 6). In countries where standards tightened, worsening risk perceptions were the primary factor. In France, increased competition from other lenders contributed to easing on the margin. Going into Q2, standards are expected to tighten very modestly in the two core European economies while diverging in peripheral Europe—Spanish banks expect an increased pace of tightening while Italian ones expect standards to remain unchanged. UK In the UK, overall corporate credit standards, measured as an average of standards for medium and large non-financial firms, eased slightly in Q1/2021 (Chart 7A). This increase in credit availability was driven primarily by an improving economic outlook and sector-specific risk picture. As in the US and euro area, competition from capital markets also played a role and is expected to contribute to the further easing expected in Q2. Chart 7AUK Credit Conditions
UK Credit Conditions
UK Credit Conditions
Chart 7BInvestment And Inventory Financing Expected To Pick Up In The UK
GFIS Credit Conditions Chartbook Q2/2021: Easing Up
GFIS Credit Conditions Chartbook Q2/2021: Easing Up
Meanwhile, corporate loan demand is picking up at a pace not seen since Brexit, excluding the 2020 spike driven by emergency funding needs, signaling a buoyant picture. In particular, the surge in demand was driven by large non-financial firms which are also expected to drive the demand pick-up in Q2. Household loan demand fell slightly in the first quarter but is expected to rebound. Consumer confidence, which had initially lagged behind loan demand, appears to have caught up as the UK’s “Freedom Day” from pandemic restrictions approaches in July. Lenders are also expected to ease availability for unsecured household loans, primarily on the back of market share objectives. This should create the ideal backdrop for a consumption boom if the Delta variant does not further limit the UK government’s ability to deliver on its promise of a full reopening. Delving into the factors behind booming corporate loan demand, there are promising signs for the broader UK economy (Chart 7B). In a Special Report published earlier this year, we argued that UK real interest rates were depressed because the country suffered from a series of rolling economic and political shocks, the effects of which were now expected to fade.3 There are already some signs of this in the credit data, with capital investment and inventory financing demand expected to rebound in Q2. Despite work-from-home effects dampening the need for office space, on the margin, UK commercial real estate demand is strong and expected to further strengthen. Japan Chart 8Japan Credit Conditions
Japan Credit Conditions
Japan Credit Conditions
In Japan, credit standards to firms and households eased at a slower pace in Q1/2021 (Chart 8). The vast majority of respondents indicated that standards were basically unchanged, with none of the firms reporting any tightening, and a small number reporting some degree of easing. The most important factors driving easing were aggressive competition from other bank and non-bank lenders, as well as strengthened efforts to grow the business. Going into Q2, the pace of easing is expected to continue to slow. Business loan demand, which behaves somewhat counter-cyclically in Japan, increased over Q1. The entirety of this pickup can be attributed to small firms; large and medium-sized firms on the whole decreased their loan demand. Counter to trends in other regions, firms in Japan actually saw a decrease in internally-generated funds, which was the most important factor contributing to increased loan demand. Consumer loan demand fell slightly on balance but was mostly unchanged from the previous quarter. Respondents reporting weaker demand saw a decrease in household consumption as the most important factor. Sentiment remains subdued and has lagged the recovery in loan demand seen last year. Our colleagues at BCA Research Foreign Exchange Strategy are eyeing a recovery for the Japanese economy as the government turns around its vaccination campaign and the Olympics jumpstart consumption.4 On that basis, the very modest recovery in loan demand expected by Japanese banks appears too pessimistic. Canada And New Zealand In Canada, business lending standards continued to ease at a faster pace in Q1/2021, coinciding with rebounding business confidence which is now back to pre-pandemic levels (Chart 9). This is in line with a remarkable vaccine rollout—68% of the population has already received its first dose and the pace of daily vaccinations is showing no signs of rolling over. Chart 9Canada Credit Conditions
Canada Credit Conditions
Canada Credit Conditions
Chart 10New Zealand Credit Conditions
New Zealand Credit Conditions
New Zealand Credit Conditions
However, housing is a major concern for Canadian policymakers. In a recent Special Report, co-authored with our colleagues at The Bank Credit Analyst, we highlighted both Canada and New Zealand as “higher risk” countries more exposed to ballooning house prices.5 In addition to low rates, mortgage lending standards, which have been easing since Q3/2020, have undoubtedly contributed to this issue. However, the Bank of Canada (BoC), with its hawkish messaging, has signaled that it will not idly stand by; there is also popular support behind raising rates to tamp down house prices. Expect mortgage standards to tighten and a pick-up in mortgage rates as the BoC nears liftoff, most likely in 2022. Credit standards in New Zealand were mostly unchanged in Q1/2021, reversing the tightening trend of previous quarters (Chart 10). Over the next six months, standards are expected to ease considerably. Business loan demand was unchanged on net, with corporates decreasing and SMEs increasing demand. SMEs are also expected to increase demand slightly over the next six months. Tepid loan demand is consistent with business confidence hovering around the neutral zero line. As in Canada, soaring house prices are a major issue for the New Zealand economy. Data on household lending is alarming on that front. Although consumer loan demand continued to weaken, demand for residential mortgages spiked to an all-time high in Q1. While demand is expected to normalize going forward, the Q1 datapoint indicates froth in the market. The Reserve Bank of New Zealand is considering a variety of macroprudential measures but will have to raise rates sooner rather than later to effectively cool down the housing market. Appendix: Where To Find The Bank Lending Surveys A number of central banks publish regular surveys of bank lending conditions in their domestic economies. The surveys, and the details on how they are conducted, can be found on the websites of the central banks: US Federal Reserve: https://www.federalreserve.gov/data/sloos.htm European Central Bank: https://www.ecb.europa.eu/stats/ecb_surveys/bank_lending_survey/ Bank of England: https://www.bankofengland.co.uk/credit-conditions-survey/2021/2021-q1 Bank of Japan: https://www.boj.or.jp/en/statistics/dl/loan/loos/index.htm/ Bank of Canada: https://www.bankofcanada.ca/publications/slos/ Reserve Bank of New Zealand: https://www.rbnz.govt.nz/statistics/c60-credit-conditions-survey Shakti Sharma Senior Analyst ShaktiS@bcaresearch.com Footnotes 1 The weblinks to each individual survey for the US, euro area, UK, Japan, Canada and New Zealand can be found in the Appendix on page 12. 2 Please see BCA Research Global Fixed Income Strategy Report, "GFIS Global Credit Conditions Chartbook Q1/2021: A Tentative Recovery", dated February 16, 2021, available at gfis.bcaresearch.com. 3 Please see BCA Research Global Fixed Income Strategy Special Report, "Why Are UK Interest Rates Still So Low?", dated March 10, 2021, available at gfis.bcaresearch.com. 4 Please see BCA Research Foreign Exchange Strategy Report, "The Case For Japan", dated June 11, 2021, available at fes.bcaresearch.com. 5 Please see BCA Research Global Fixed Income Strategy Special Report, "Global House Prices: A New Threat For Policymakers", dated May 28, 2021, available at gfis.bcaresearch.com.
Highlights Spread Product: The macro environment is highly supportive for spread product and it will likely remain supportive for the next 12-18 months, at least until the yield curve flattens to below 50 bps. Remain overweight spread product versus Treasuries in US bond portfolios. High-Yield: High-yield spreads still look fairly valued, or even slightly cheap, compared to our base case outlook for corporate defaults. Investors should continue to favor high-yield over investment grade corporates and maintain an overweight allocation to high-yield in US bond portfolios. EM Corporates: Within the A and Baa credit tiers, US bond investors should favor USD-denominated EM corporates over USD-denominated EM sovereigns and should favor both over US corporate bonds. Within the Aa credit tier, investors should favor USD-denominated EM sovereigns over USD-denominated EM corporates and should favor both over US corporate bonds. Feature Chart 1Fed Meeting Didn't Shock Credit Markets
Fed Meeting Didn't Shock Credit Markets
Fed Meeting Didn't Shock Credit Markets
Last week’s report looked at how the June FOMC meeting prompted a massive re-shaping of the Treasury curve.1 It didn’t discuss, however, the impact that June’s meeting had on credit spreads. There’s a simple reason for this. Corporate bond spreads didn’t move very much post-FOMC. In fact, neither investment grade nor high-yield spreads have widened significantly during the past two weeks, despite the Fed’s apparent “hawkish turn” (Chart 1). The VIX jumped briefly above 20 in the days following the Fed meeting but it has since re-discovered its lows (Chart 1, bottom panel). This week’s report considers whether the corporate bond market is too complacent. The first section updates our assessment of where we are in the credit cycle based on two indicators that did see large swings post-Fed. The second section updates our outlook for high-yield defaults and considers whether junk spreads continue to offer adequate compensation. Finally, the third section of this report presents an introductory look at valuation in the USD-denominated Emerging Market (EM) corporate sector. We find that, for the most part, investment grade EM corporates are attractively valued relative to EM sovereigns and US corporates of the same credit rating and duration. Credit Cycle Update Chart 2Credit Cycle Indicators
Credit Cycle Indicators
Credit Cycle Indicators
As we have repeatedly stated in past research, the slope of the yield curve is a very important credit cycle indicator.2 We have documented that spread product tends to outperform duration-matched Treasuries by a wide margin when the yield curve is steep. This outperformance tapers off once the 3-year/10-year Treasury slope falls below 50 bps and it falls off even more when the slope dips below zero.3 With that in mind, it is notable that the Treasury curve flattened dramatically following the June FOMC meeting (Chart 2). At 106 bps, the 3-year/10-year Treasury slope remains well above the 50 bps threshold that would start to get concerning for spread product. However, it’s likely that the yield curve will continue to flatten as we approach a Fed rate hike in 2022. In other words, we expect that monetary conditions will turn sufficiently restrictive for us to reduce our recommended spread product allocation within the next 12-18 months. On the other hand, one positive development for spread product returns is that the 5-year/5-year forward TIPS breakeven inflation rate declined following the June FOMC meeting. In fact, it is now below the 2.3% to 2.5% range that is consistent with the Fed’s inflation target (Chart 2, bottom panel). This is a positive development for spread product because the Fed will strive to ensure that monetary conditions stay accommodative at least until these long-dated inflation expectations are consistent with the 2.3% to 2.5% target. Or put differently, a rebound in long-maturity TIPS breakeven inflation rates back to the target range will slow the near-term pace of curve flattening, giving the credit cycle a small amount of extra running room. In short, the macro environment is highly supportive for spread product and it will likely remain supportive for the next 12-18 months, at least until the yield curve flattens to below 50 bps. Investment Grade Corporates The highly supportive macro environment applies to investment grade corporate bonds, just as it does to all spread sectors. However, investment grade corporates have the problem that valuation is extremely tight. Much like a flat yield curve environment, a tight spread environment tends to coincide with low excess corporate bond returns. However, our research reveals that tight spreads alone are not sufficient for investment grade corporates to underperform duration-matched Treasuries. Table 1 classifies each month since May 1973 based on the investment grade corporate bond spread and the 3/10 Treasury slope. It then shows a 90% confidence interval for corporate bond excess returns during the following 12 months. It shows that, even when the corporate bond spread is below 100 bps (it is 81 bps today), investment grade corporates still tend to outperform duration-matched Treasuries as long as the 3/10 Treasury slope is above 50 bps. Table 1Expected 12-Month Corporate Bond Excess Return* (BPs) Based On OAS And Yield Curve Slope
The Post-FOMC Credit Environment
The Post-FOMC Credit Environment
Bottom Line: The yield curve has started to flatten but it remains very steep, consistent with spread product outperforming duration-matched Treasuries. We remain overweight spread product versus Treasuries but will re-consider this position once the yield curve flattens to below 50 bps. We expect this could happen within the next 12-18 months. We maintain only a neutral allocation to investment grade corporate bonds because of stretched valuations. We see more attractive opportunities in high-yield corporates (see next section), municipal bonds, USD-denominated EM sovereigns and USD-denominated EM corporates (see final section below). High-Yield Default Update We last updated our default rate outlook in March.4 At that time, we concluded that junk spreads offered adequate compensation for expected default losses. Since then, we have received nonfinancial corporate sector profit and debt growth data for the first quarter of 2021, crucial inputs to our macro-based default rate model. Our macro-based model of the 12-month trailing speculative grade default rate is based on nonfinancial corporate sector gross leverage (i.e. pre-tax profits over total debt) and C&I lending standards (Chart 3). Lending standards enter our model with a lag, but we need a forward-looking estimate of gross leverage for our model to generate predictions. Chart 3Macro-Driven Default Rate Model
Macro-Driven Default Rate Model
Macro-Driven Default Rate Model
To estimate gross leverage we first model corporate profit growth based on real GDP (Chart 4) and assume that real GDP grows by 7% over the next four quarters, consistent with the Fed’s median forecast. This gives us a profit growth expectation of roughly 30%. Chart 4Profit & Debt Growth
Profit & Debt Growth
Profit & Debt Growth
We also need an estimate for corporate debt growth. Corporate debt exploded last year, growing 10% in 2020, but it then slowed to an annualized rate of 4% in Q1 2021. We think corporate debt growth will remain slow going forward. The nonfinancial corporate sector financing gap has been negative in each of the past four quarters (Chart 4, bottom panel), meaning that retained earnings have exceeded capital expenditures. In other words, firms have built up a lot of excess capital that can be deployed in place of debt to finance new investment opportunities. Table 2 shows our model’s predicted 12-month default rate based on different assumptions for profit and debt growth. If we assume corporate profit growth of 30% and corporate debt growth between 0% and 8%, then our model predicts that the 12-month default rate will fall from its current 5.5% to a range of 2.3% - 2.8%. Table 2Default Rate Scenarios
The Post-FOMC Credit Environment
The Post-FOMC Credit Environment
Next, we need to consider what sort of expected default rate is priced into the High-Yield index. Our analysis of historical junk spreads and returns suggests that we should require a minimum excess spread of 100 bps in the High-Yield index after subtracting default losses to be confident that junk bonds will outperform Treasuries.5 If we also assume a recovery rate of 40% on defaulted debt, then we calculate that the High-Yield index is fairly priced for a 12-month default rate of 2.9% (Chart 5). That is, junk spreads appear slightly cheap compared to the 2.3% - 2.8% range predicted by our macro model. Finally, it’s worth noting that actual corporate default events have been quite rare in recent months. In the first five months of 2021 we’ve seen between 1 and 3 default events per month. If we extrapolate that trend and assume we see 3 defaults per month going forward, then we calculate that the 12-month trailing default rate will fall to 2.0% by December, before leveling off at 2.2% (Chart 6). In other words, the recent trend has been one of significantly fewer defaults than predicted by our macro model Chart 5Spread-Implied Default Rate
Spread-Implied Default Rate
Spread-Implied Default Rate
Chart 6Recent Default Trends
Recent Default Trends
Recent Default Trends
Bottom Line: High-yield spreads still look fairly valued, or even slightly cheap, compared to our base case outlook for corporate defaults. Investors should continue to favor high-yield over investment grade corporates and maintain an overweight allocation to high-yield in US bond portfolios. An Attractive Opportunity In EM Corporates This week we present an introductory look at the risk/reward opportunity in USD-denominated EM corporate bonds. Specifically, we look at the investment grade Bloomberg Barclays USD-denominated EM Corporate & Quasi-Sovereign index. We compare this index to both the investment grade USD-denominated EM Sovereign index and the US Credit index.6 First, we look at recent performance trends and average index statistics (Table 3). Both the EM Corporate and EM Sovereign indexes have average credit ratings between A and Baa, so we compare their performance to the A-rated and Baa-rated US Credit indexes. We observe a significant option-adjusted spread (OAS) advantage in both the EM indexes, though part of the extra spread offered by the Sovereign index is compensation for its longer duration. The EM Corporate index sticks out as offering an extremely attractive OAS per unit of duration. Table 3Performance Trends & Index Statistics
The Post-FOMC Credit Environment
The Post-FOMC Credit Environment
As for performance, we see that the EM Corporate index experienced less of a drawdown (in excess return terms) during the COVID recession, though it has also returned less than both the EM Sovereign index and the Baa Credit index during the recent upswing. Chart 7Spreads Versus Credit Rating & Duration-Matched US Credit
The Post-FOMC Credit Environment
The Post-FOMC Credit Environment
Next, we look at each individual credit tier of both the EM Corporate & Quasi-Sovereign index and the EM Sovereign index, and we calculate the spread relative to a credit rating and duration-matched position in the US Credit index (Chart 7). In general, we see that both EM indexes offer a spread advantage versus duration-matched US Credit across all credit rating tiers. EM sovereigns look better than EM corporates in the Aa credit tier. This is the result of attractive spreads on the sovereign bonds of UAE and Qatar. However, EM corporates clearly dominate sovereigns in both the A and Baa credit tiers. Finally, we consider the risk/reward trade-off in our EM indexes by using our Excess Return Bond Map. Our Excess Return Bond Map shows the relationship between expected return (on the vertical axis) and risk (on the horizontal axis). In Chart 8A our risk measure is the 12-month spread widening required for each index to lose 100 bps versus a position in duration-matched Treasuries divided by that index’s historical spread volatility. It can be thought of as the number of standard deviations of spread widening required for the index to provide an excess return of -100 bps. A higher value corresponds to less risk, and vice-versa. Chart 8B uses the same risk measurement, only we use the spread widening required to lose 500 bps versus Treasuries to assess the risk of a large drawdown. Both Charts 8A and 8B use OAS as the measure of expected return. Chart 8AExcess Return Bond Map (100 BPs Loss Threshold)
The Post-FOMC Credit Environment
The Post-FOMC Credit Environment
Chart 8BExcess Return Bond Map (500 BPs Loss Threshold)
The Post-FOMC Credit Environment
The Post-FOMC Credit Environment
The first thing that sticks out in Charts 8A & 8B is that Baa-rated EM corporates offer greater expected return and less risk than the EM Sovereign index and the Baa US Credit Index. This is true whether our loss threshold is set at 100 bps or 500 bps. Unfortunately, we do not have sufficient data to split the EM Sovereign index by credit tier in these charts. A-rated EM corporates offer slightly less expected return than the EM Sovereign index but with significantly less risk, they also clearly dominate the A-rated US Credit Index. Aa-rated EM corporates appear to offer a similar risk/reward trade-off as the EM Sovereign index, though we know from Chart 7 that sovereigns have a spread advantage in the Aa credit tier. The bottom line is that USD-denominated EM corporates are attractively valued relative to investment grade US corporate bonds with the same duration and credit rating. EM corporates also look preferable to EM sovereigns in the A and Baa credit tiers. EM sovereigns are more attractive than EM corporates in the Aa credit tier. Within the A and Baa credit tiers, US bond investors should favor USD-denominated EM corporates over USD-denominated EM sovereigns and should favor both over US corporate bonds. Within the Aa credit tier, investors should favor USD-denominated EM sovereigns over USD-denominated EM corporates and should favor both over US corporate bonds. Ryan Swift US Bond Strategist rswift@bcaresearch.com Footnotes 1 Please see US Bond Strategy / Global Fixed Income Strategy Weekly Report, “How To Re-Shape The Yield Curve Without Really Trying”, dated June 22, 2021. 2 Please see US Bond Strategy Weekly Report, “Lower For Longer, Then Faster Than You Think”, dated May 25, 2021. 3 We use the 3-year/10-year Treasury slope in place of the more widely tracked 2-year/10-year slope in our credit cycle research only because using the 3-year/10-year slope allows us to include more historical cycles in our analysis. 4 Please see US Bond Strategy Weekly Report, “That Uneasy Feeling”, dated March 30, 2021. 5 Please see page 33 of the US Bond Strategy Quarterly Chartpack, “Testing The Limits Of Transitory Inflation”, dated May 18, 2021. 6 The US Credit Index consists predominantly of US corporate bonds, but also some non-corporate credit such as: Sovereigns, Foreign Agencies, Domestic Agencies, Local Authority bonds and Supranationals. Fixed Income Sector Performance Recommended Portfolio Specification
Feature Chart 1A Tug-Of-War In The US Treasury Market
A Tug-Of-War In The US Treasury Market
A Tug-Of-War In The US Treasury Market
This week, we are publishing one of our periodic reports, covering global central bank lending standard surveys. Yet given some of the moves seen in US bond markets recently, we felt the need to also provide some additional thoughts, along with that previously scheduled report. The short-term volatility of longer-maturity US Treasury yields since the June 16 FOMC meeting has been a bit extreme, to say the least. The 30-year yield fell from an intraday peak of 2.21% just before the Fed meeting to an intraday low of 1.93% on June 21, a 28bp plunge in a span of just three trading days, but has climbed back to 2.10% as we go to press. Over that same time frame, shorter maturity yields have been relatively more stable. After the 5-year yield rose from 0.78% on 0.93% immediately following the “hawkish” Fed surprise on FOMC Day, the yield has largely held those gains, hitting only a brief intraday low of 0.84% on June 21, and now sits at 0.90%. This price action is consistent with the two opposing forces currently at work in the US Treasury market. Investors are slowly repricing the expected path of Fed policy, pulling forward the liftoff date of the fed funds rate in line with the new “guidance” from the FOMC interest rate forecasts. This is putting upward pressure on the shorter maturity part of the Treasury curve. At the same time, the market continues to work off the deeply oversold condition that had developed in longer-maturity Treasuries, as we discussed in a recent report.1 The sharp volatility of the 30yr yield is consistent with a rapid adjustment of positioning, which had become very short when looking at measures like the CFTC data on 30-year bond futures net positioning (Chart 1). Chart 2Corporate Bond Investors Appear Far Less Worried Than Equity Investors
Corporate Bond Investors Appear Far Less Worried Than Equity Investors
Corporate Bond Investors Appear Far Less Worried Than Equity Investors
Once that overhang of short positioning in longer maturity yields is worked off, the overall Treasury yield curve will begin moving higher again, continuing the cyclical bear market. The next increase in yields, however, will look different than what occurred between August 2020 and March 2021, when rising growth and inflation expectations resulted in a bearish steepening of the Treasury curve. The next move will be led by yields rising more at the front end of the curve, as the Fed begins the long march toward policy normalization. This will result in a bearish flattening of the Treasury curve, which motivated us to introduce a new US yield curve trade last week along with our colleagues at BCA Research US Bond Strategy – going short a 5-year bullet versus going long a duration-matched 2-year/10-year barbell. We have added that trade to our Tactical Overlay portfolio using specific on-the-run Treasury bonds, as can be seen in the table on page 7.2 While yields are jumping around in government bond markets, credit markets remain calm. Corporate bond spreads have been grinding tighter, in line with the steady decline in the VIX index of US equity volatility (Chart 2). Yet investors in other asset classes are exhibiting more cautious optimism. The soaring SKEW index has climbed to an all-time high, suggesting that demand for downside portfolio protection via S&P 500 put options is very robust with the equity index also at an all-time high. However, with the VIX falling, economic growth remaining solid, bank lending standards easing and the Fed not expected to even begin tapering its asset purchases until the start of 2022, the backdrop remains generally positive for US corporate debt versus US Treasuries. Next week, we will be presenting our quarterly review of the Global Fixed Income Strategy model bond portfolio, where we will present our base case and tail risk scenarios for global bond markets over the remaining months of 2021, along with our recommended portfolio positioning. Robert Robis, CFA Chief Fixed Income Strategist rrobis@bcaresearch.com Footnotes 1 Please see BCA Research Global Fixed Income Strategy Report, “A Summer Nap For Global Bond Yields”, dated June 9, 2021, available at gfis.bcaresearch.com. 2 Please see BCA Research US Bond Strategy/Global Fixed Income Strategy Report, “How To Re-Shape The Yield Curve Without Really Trying”, dated June 22, 2021, available at gfis.bcaresearch.com. Recommendations The GFIS Recommended Portfolio Vs. The Custom Benchmark Index
Some Brief Comments On Recent US Bond Market Moves
Some Brief Comments On Recent US Bond Market Moves
Duration Regional Allocation Spread Product Tactical Trades Yields & Returns Global Bond Yields Historical Returns
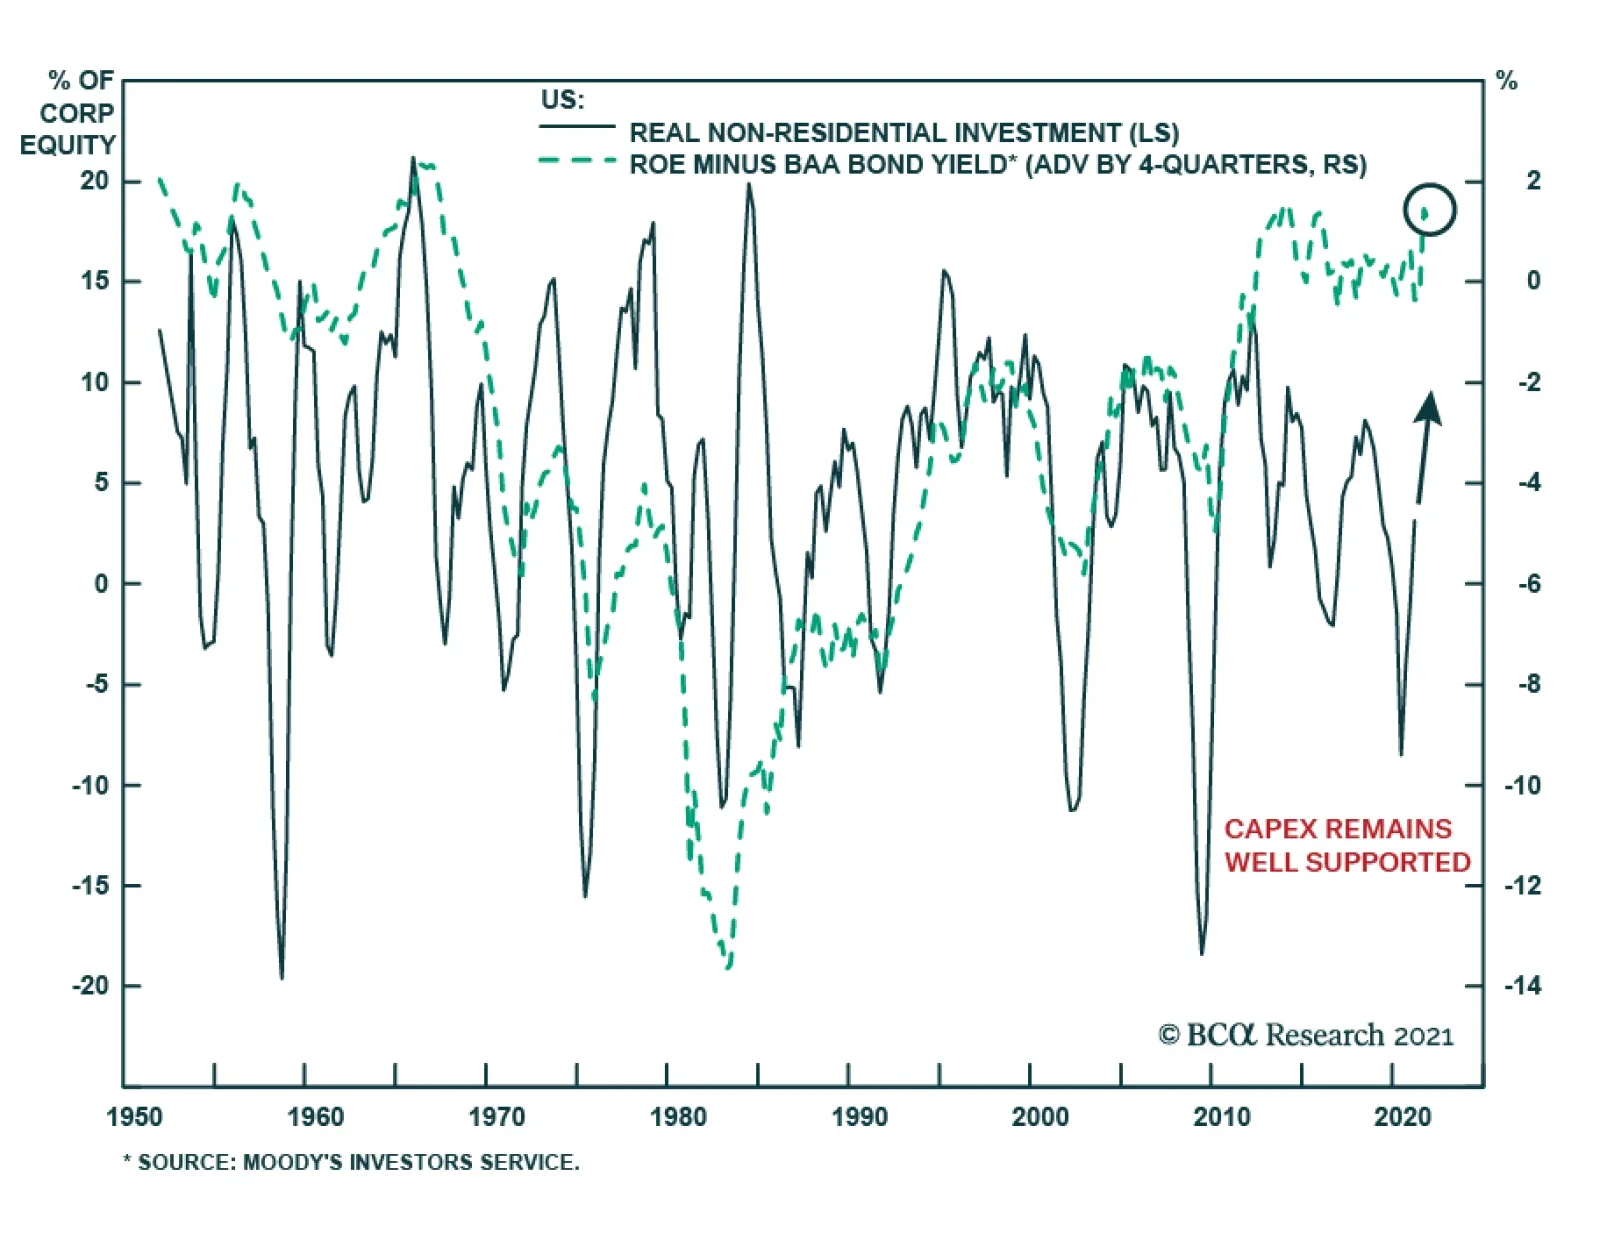
Thanks to very depressed interest rates, the gap between the US return on capital and the cost of capital stands near a record high. This is creating a potent incentive for businesses to expand their assets, especially because the age of the US capital stock…
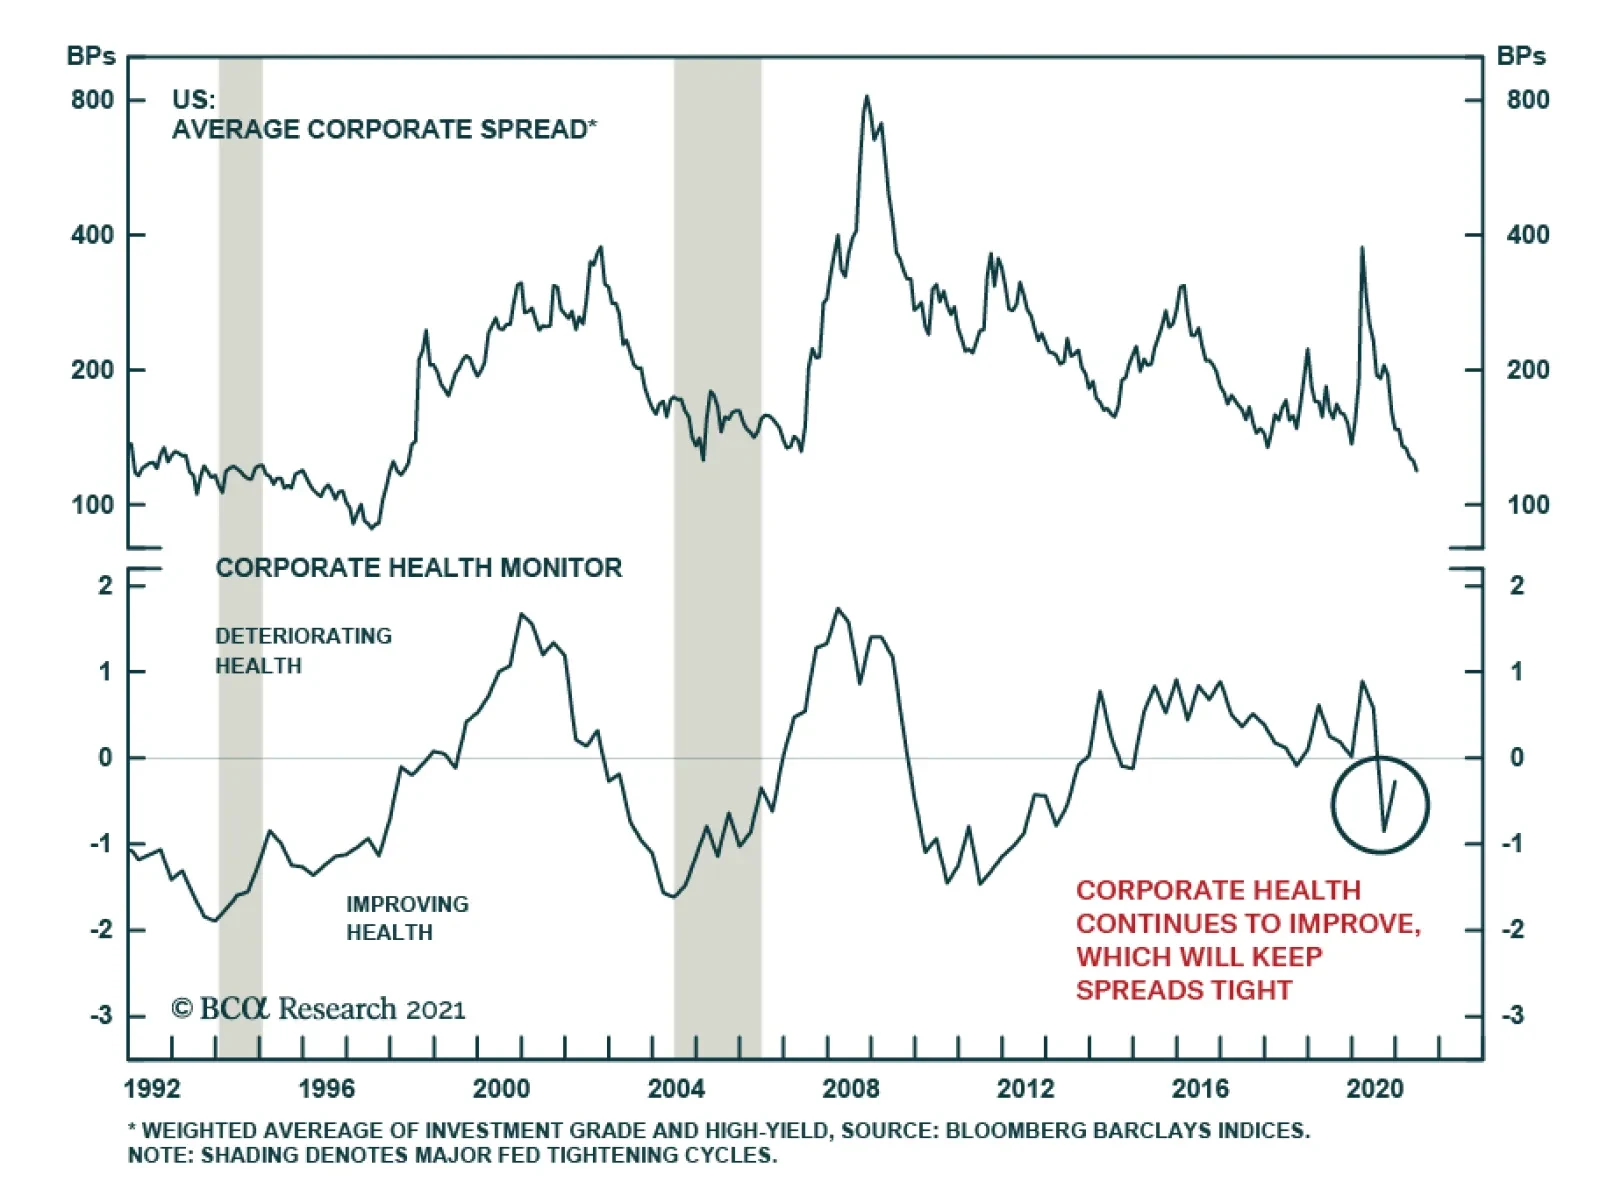
Despite the Fed backing away from the point of maximum monetary accommodation, threats to the corporate spreads are low. To begin with, even if QE ends this year and interest rates start rising in 2023, the fed funds rate remains far below the neutral rate…