United States

Highlights The Auto and Components industry group is in the middle of a momentous transition to electric and autonomous-vehicle manufacturing thanks to technological advances in battery storage, AI, and radars. The entire EV cohort will benefit from government support for decarbonization, the preferences of millennials for green tech, and cutting-edge technological innovation. Further, the price of gas has recently nearly doubled, average US vehicles are more than 12 years old, while most US consumers came out of recession unscathed. Is this the time for consumers to upgrade to EVs? Legacy Automakers are to be primary beneficiaries of the theme: Higher earnings and greater economic visibility regarding EV transition should lead to further rerating of the industry group. These carmakers are also turning into Growth stocks as an expected surge in earnings is far in the future. Tesla has already had an amazing run. Even though it is 30% down from its peak, it remains expensive, and much of the growth expectations are already baked into the price. We recommend staying neutral on Tesla as it is a “cult” stock and a surge “to the moon” is not out of question. Ecosystem: The surge in EV capex and R&D spending will give a boost to the entire supply chain, which consists of chip manufacturers, battery and lidar R&D, part manufacturers, and charging networks. Many of these companies are still small. An ETF may be the best way to capture these names. Existing EV themed ETFs may not be perfect: Many have holdings that are way too broad and over-diversified, most invest outside of the US. Yet, these are the convenient vehicles to capture the theme and provide exposure to the entire EV cohort. Some of the best-known ETFs are ARKQ, DRIV, IDRV, and KARS. We believe that the EV/AV theme will outperform the US equity market over the 3-12 months horizon. Overweighting EV is also consistent with our call to rotate into Growth as higher rates and the pick up in inflation appear to be priced in. Feature Auto And Components Industry Delivers Historical Technological Advances The auto industry is undergoing a monumental shift towards electric vehicles (EV) and autonomous driving thanks to technological advances in battery storage, AI, and radars. Transition to EV is happening at a fast pace: According to IEA, the number of EVs on the road increased from about 17,000 vehicles in 2010 to 7.9 million in 2019. Autonomous vehicles (AV) are still in a testing stage, but most automakers promise to put them on the road within the next decade. LMC Automotive forecasts that that by 2031, EVs will reach 17 million units, while AVs will approach one million in 2025. Investors are cheering on this transition: The MSCI USA Auto and Components sector has outperformed MSCI USA by over 300% (408% vs. 90%) since the pandemic trough in March 2020. The EV-themed ETF DRIV outperformed by 95%. In this Special Report we provide an overview of the EV and AV industries and their emerging ecosystem. It is structured as following: First, we discuss the tailwind for transitioning towards EV. Second, we identify the key players in the EVs and AVs space. Third, we look at ways that investors can best get exposure to the EV theme and provide an investment outlook for the space. EV Tailwinds: Biden Administration Pushes Toward “Clean Tech”, Millennials Cheer The Biden administration’s push toward decarbonization of the economy will further accelerate transition towards EVs with a host of fiscal, infrastructure, and executive actions, such as tax credits, scrappage incentives, and government purchases. The White House’s $1.7-2.3 trillion infrastructure bill – which is highly likely to pass by the end of the year with green initiatives intact – includes a $15 billion buildout of 500,000 charging stations (there are currently only 27,000 in operation). Executive action by President Biden has also tightened fuel-economy standards. Individual states like California have committed to zero-emission standards by 2030. Add this to the emerging preferences of millennials for clean tech, and fully electric vehicles are expected to account for 33% of all US auto sales by 2030. Of course, there are EV adoption challenges: EV batteries remain expensive, adding approximately $10,000 to the price of a vehicle. Charging infrastructure is sparse, while EVs have relatively limited driving ranges and long charging times. But even these obstacles will be resolved sooner rather then later. According to Cathie Wood, CEO and CIO of the ARK (thematic) ETFs, EVs will approach sticker parity with gas-powered cars as soon as 2023. And there are a number of new entrants developing charging networks. Even driving ranges are increasing with Lucid promising 500 miles per charge (Chart 1). Key Players In The US Market Tesla: Enormous Potential But Competition Is Catching Up Tesla is a pioneer of battery electric vehicles (BEV), rewarded with sky-high valuations and deep pockets. Its stock had a spectacular run, rising ten-fold in two years, getting ahead of itself: It is down 30% from its January peak. So what is the bull case for Tesla that justifies the multiples, and may be considered a catalyst for future outperformance? After all, manufacturing of EVs is likely to become a highly competitive and low-margin business. Tesla has four unique advantages that constitute its competitive “moat”: An extensive supercharger network in the US and worldwide. Its push towards increased vertical integration into capabilities such as battery manufacturing and other key enabling technologies would allow it to maintain a technological edge over competition, as well as protect the company against any potential supply-chain disruptions. A mobility ecosystem, especially of data and network, turning the car into “mobile real estate”, powered by the cloud and fueled ultimately by thousands of exabytes of data. A host of auxiliary businesses: Energy, insurance, mobility/rideshare, network services and third-party battery supply. However, despite its tremendous long-term potential, Tesla has only recently become profitable (Chart 2). Further, we can’t discount a possibility that Tesla’s dominance may come to an end. Not only are Ford and GM gearing up their EV operations, but also European and Asian vehicle manufacturers such as VW, BMW, Hyundai, and Toyota present a significant competitive threat. Further, Chinese EVs, such as NIO, Geely, BYD, and XPEV, could erode Tesla’s market share in the Chinese market. Chart 1EV Will Reach Price Parity With ICE In 2023
EV Revolution
EV Revolution
Chart 2Tesla Has Only Recently Become Profitable
Tesla Has Only Recently Become Profitable
Tesla Has Only Recently Become Profitable
Ford And GM Are Firmly Committed To EV Legacy automakers, such as Ford and GM, have no choice but to move aggressively into the EV space in order to survive the imminent regulatory push in Europe and the US to eliminate fossil-fuel cars. Also succeeding in the EV space is necessary to stave off competition from Tesla and other EV and legacy automakers (Chart 3). Recently, GM announced that it would accelerate its EV timeline and develop 30 new EV models by 2025, transitioning to 100% EV by 2035. It is targeting global EV sales of more than 1 million by 2025. On the heels of that announcement, Ford pledged to become all electric in Europe by 2030. The company anticipates that 40% of its global vehicle volume will be fully electric by 2030. Chart 3GM And Ford Need to Stave Off Competition From Tesla
GM And Ford Need to Stave Off Competition From Tesla
GM And Ford Need to Stave Off Competition From Tesla
The transition to EV is a major endeavor for all legacy automakers but, if successful, they will reap significant rewards by means of higher sales and profits as EVs become increasingly more popular. They will also emerge as prime competitors of Tesla. Waymo (Alphabet) Alphabet’s Waymo launched its first autonomous ride-hailing network in Arizona but will need time and significant resources to scale nationally. The company is also developing both local and long-haul AV networks to transport goods. So far the company has not been profitable, struggling to commercialize the product efficiently. New EV Players There is a host of newcomers into the EV/AV space in the US. Furthest down the path in the light-vehicle market are Lucid, Fisker, and Electrameccanica (Solo). Workhorse Group, and the controversial Nikola are most established in the truck space. There are also EV recreational vehicle makers such as Canoe and Green Power Motors. EV/Autonomous Vehicles Ecosystem There is a brand new ecosystem developing around EVs, with suppliers providing batteries, radars, and charging stations. The industry is highly fragmented, and most smaller suppliers on the cutting edge of technological innovation are too small to be part of any index just yet or are not even public yet. Batteries The recently IPO’d QuantumScape has developed a breakthrough technology for a battery that charges in just 15 minutes. The company has received significant investment from VW. Solid Power is its newest competitor, still privately owned. Romeo Power develops batteries for big trucks, buses, and construction equipment. And XL Fleet supports EV conversions for commercial vehicles. Lidars Companies like Luminar and Velodyne use Lidar technology to improve the 3-D “vision” of the self-driving cars. These ventures demand large investments into capex and R&D, but present significant future revenue opportunities to the winners. Waymo (Alphabet) relies on Lidar technology for its fleet of AV vehicles. Charging Networks There are also a few companies focused on developing private charging networks, overcoming the main obstacle on the path to EV adoption – the need for ubiquitous availability of charging stations: ChargePoint, EVBox and Volta. Chipmakers All these vehicles are powered by chips produced by Nvidia, Qualcomm, Micron, and other semiconductor manufacturers, and technological improvements taking place in this industry are literally exponential. It is not clear yet which of these entrants are here to stay and, in a way, the EV and AV industry should remind investors of biotech: Each of these companies requires only a small allocation as part of an EV basket in order to capture the 100-bagger future winners. Where Do You Find The EV/AV Theme In Equity Indices? EV Companies And Suppliers Are Spread Across A Multitude Of Sectors This may sound like a silly question. The answer is seemingly obvious: In the Auto and Components Industry Group. However, there is a whole host of companies that are part of the ecosystem that are neither in the S&P 500/MSCI USA nor in the Auto and Components industry group. Nvidia, Micron, and Qualcomm are chipmakers assigned to the Technology sector. Alphabet’s self-driving business unit, Waymo, sits within Communications Services. Velodyne (recently added to the Russell 2000), Luminar, Quantumscape, and XL Fleet are small caps. There are also a number of special purpose acquisition companies (SPACs) that are in the process of merging with EV companies (Lucid, Faraday, ChargePoint, etc.). Auto And Components Industry Group Is Dwarfed By Tesla Moreover, a key issue with Auto and Components GICS2 is that it is dominated by a few large companies: Ford, GM, and Tesla account for 90% of the segment by market cap. The rest is divided among several autoparts manufacturers. Moreover, despite generating sales equal to only a quarter of the sales of GM or Ford (in 2020 $31 billion vs $122 billion for GM and $116 billion for Ford), Tesla alone represents roughly 3/4 of the industry group by market cap, being five times larger than Chrysler and GM combined (Chart 4). In terms of market share, Ford and GM account for 6% and 9% of global auto sales respectively, while Tesla barely even registers on a radar at 0.8%. Tesla’s dominant position holds this industry group hostage to its price performance (Chart 5). Chart 4Tesla Dominates Auto & Components Industry Group
EV Revolution
EV Revolution
Chart 5Performance Of Auto Industry Is Held Hostage By Tesla
EV Revolution
EV Revolution
Therefore, it is more effective to pursue the EV theme via a more balanced and diversified custom stock basket or ETF. Having said that, because of the size of the three largest automakers, we rely on MSCI USA Auto and Components industry group as a proxy for the EV/AV investment theme for analytical purposes. EV ETFs Are Mushrooming Recently there appeared a number of ETFs powered by EV/AV themes, cutting across GICS, such as ARKQ, IDRV, KARS, and DRIV. The ETFs BATT and LIT narrowly focus on EV batteries. These ETFs contain a wide range of companies cutting across industries (See Appendix for details) Excluding the broader-themed ARKQ (Autonomous Technology and Robotics), the DRIV ETF is the most widely traded. This ETF contains all the same companies as the MSCI USA Auto and Parts industry group, but also covers the entire EV/AV supply chain from miners to companies manufacturing opto-electronic components like IIVI. DRIV contains 77 names, and ranges from giants like Tesla and Microsoft to the tiny Plug Power. It is a global ETF and includes names like Nio, VW, and Toyota. Not a single name exceeds 4% weight. DRIV is 67% correlated with MSCI USA Auto and Components, and is generally less volatile, as it is more diversified across a variety of sectors (Table 1). Table 1EV/AV ETFs
EV Revolution
EV Revolution
Key Revenue Drivers Reopening Trade And Global Growth Acceleration The Automobiles and Components industry group is a classic early cyclical, highly geared to economic growth, outperforming during the recovery stage of the business cycle. Global reopening has resulted in a sharp global growth acceleration and benefited US automakers’ sales at home and abroad. Indeed, total vehicle sales in the US have already exceeded pre-pandemic levels. The question is whether this surge may continue with a backdrop of a growth slowdown (albeit off high levels) and how fast supply-chain disruptions will be resolved. Consumers Are Flush With Cash Most vehicles are sold to consumers, whose sentiment and financial wellbeing are the key industry drivers. Ubiquitous vaccination and economy-wide reopening is increasing employment in the lower-paid cohorts most affected by lockdowns. Expiration of unemployment benefits and school reopening will see millions more returning to work this fall. Anticipating a surge in employment, consumer confidence has started to rebound, albeit off low levels. The most recent $1.9 trillion fiscal stimulus package with its $1,400 checks cut directly to consumers, bodes well for US auto sales. For many vehicles, this amount may be sufficient for a down-payment. Personal savings have increased by roughly $1.5 trillion from the January 2020 trough, and disposable income has increased by 6%. Coupled with low interest rates and an improvement in banks’ willingness to lend, US consumers are in an excellent shape to upgrade their vehicles (Charts 6 & 7). Chart 6Demand For Auto Loans Has Picked Up
Demand For Auto Loans Has Picked Up
Demand For Auto Loans Has Picked Up
Chart 7Lending Standards for Auto Loans Eased Up
Lending Standards for Auto Loans Eased Up
Lending Standards for Auto Loans Eased Up
However, plans to buy a new car have declined recently due to car shortages and a spike in prices. Supply Chain Disruptions Hurt Demand For Vehicles Pandemic has brought about unique challenges: Global pent-up demand and COVID-induced supply-chain disruptions led to a mismatch between supply and demand and resulted in sharp price acceleration across a wide range of goods. US automakers have been hit hard by the global chip shortage, resulting in plant shutdowns and lower output in some cases. Shortages of lithium, a key component of EV batteries, led to its price doubling. Transportation networks are also choked up, and delivery costs are up more than 30%. While these post-pandemic difficulties are transitory in nature, prices of vehicles spiked, making it the most volatile component of the latest CPI reading, with prices in May rising 16% YoY (Chart 8). Higher price tags and half-empty car lots at dealerships are dampening consumers’ intentions to upgrade their vehicles, despite their present financial wellbeing (Chart 9). Chart 8Prices Of Cars Surged
Prices Of Cars Surged
Prices Of Cars Surged
Chart 9Supply Disruption Dampened Demand For Vehicles
Supply Disruption Dampened Demand For Vehicles
Supply Disruption Dampened Demand For Vehicles
According to IHS Markit, the average age of vehicles on US roadways rose to a record 12.1 years last year, as lofty prices and improved quality prompted owners to hold on to their cars for longer. The average price for a new vehicle is $38,000, which is expensive for most Americans. However, there are early signs that supply disruptions are starting to dissipate: Production of motor vehicles rose 6.7% in May compared with a 5.7% decrease a month earlier. Once vehicle prices stabilize, or even correct, sales are likely to rebound. EV also enjoy a unique tailwind: The price of gasoline has doubled since the beginning of the year, making electric vehicles a more attractive proposition than gas-guzzling alternatives. Weaker Dollar Boosts Foreign Sales USD has weakened by 8% since the beginning of the pandemic. This bodes well for the US auto and parts manufacturers who derive about 1/3 of revenues from outside the US. A weaker USD not only stimulates demand by making vehicles cheaper for foreign buyers but will also benefit manufacturers' income statements via a currency-translation effect (Chart 10). Chart 10Weaker Dollar Boosts Foreign Sales
Weaker Dollar Boosts Foreign Sales
Weaker Dollar Boosts Foreign Sales
Profitability Of Automakers Belt-tightening Of 2020 Is Unsustainable Margin compression has been a problem for the industry group for a while as a race to enhance existing vehicles and transition to EV has been weighing on profitability (Chart 11). However, in 2020, despite a dip in sales volume, US automakers were able to successfully manage margins, by reducing R&D expenses, capex, and labor costs, and by halting increases in dividends and buybacks, and enjoying lower prices of industrial metals. Maintaining this new lean cost structure is hardly sustainable. Chart 11Margins Are Under Pressure
Margins Are Under Pressure
Margins Are Under Pressure
R&D And Capex Will Rise As Technological Innovation Demands Capital Outlays R&D and capex are likely to increase for the entire group. Legacy automakers are forced to operate on two distinct timelines by managing and investing in the immediate conventional vehicle production cycle, while concurrently preparing for the longer-term transition to a world of vehicle electrification and autonomous driving. Development of EVs requires deep pockets and substantial investments into both capex and R&D, which have been steadily rising (Charts 12 & 13). Chart 12R&D Expense Is Bound To Increase…
R&D Expense Is Bound To Increase…
R&D Expense Is Bound To Increase…
Chart 13… As Is Capex
EV Revolution
EV Revolution
Case in point, GM has recently announced a $35 billion investment into EV and AV, an increase of 75% from its initial pledge, an amount exceeding its gas and diesel investment. Not to be outdone, Ford has copied the move, pledging $30 billion on EV vehicle development, including battery development, by 2025. This is an increase of more than 35% over the $22 billion previously pledged. Clearly, commitment to EV siphons resources away from other businesses, and put pressures on automakers to keep up with competitors. Yet the market applauded these announcements by bidding up shares of both companies, implicitly saying that EV spending will lead to better future cashflows. Thus transition to EV moves auto stocks from the Value into the Growth camp, making the group more sensitive to interest rates. Runaway Cost Of Raw Materials Is Stabilizing Metals such as steel, iron, and aluminum comprise over 75% of the content of the car. The price of metals is particularly important to EV manufacturers as the body of an EV contains five times more steel than regular vehicles. In 2020 gross margin benefited from a dip in prices of industrial metals. However, the recent economic recovery has led to a rebound in the prices of commodities, with the GSCI Industrial Metals Index rising by more than 70% off the bottom and reaching 2010 levels (Chart 14). There are early signs that prices are stabilizing: The price of steel is down by 20%, copper by 13%, and aluminum by 6%, from their respective peaks (Chart 15). Chart 14Price Of Industrial Metals Have Spiked...
Price Of Industrial Metals Have Spiked...
Price Of Industrial Metals Have Spiked...
Chart 15...But There Are Early Signs Of Correction
...But There Are Early Signs Of Correction
...But There Are Early Signs Of Correction
High Operating Leverage Of Auto Manufacturers Amplified Earnings Growth Automakers and suppliers have high fixed-cost manufacturing facilities. As a result, their operating leverage is high, i.e., increases in sales are translated into even greater increases in profits. As 2021 sales are expected to rise, earnings will also continue to rebound, reaching or even exceeding pre-pandemic levels. Looking ahead, we expect earnings growth to decelerate as sales are likely to normalize while EV transitioning costs will continue to rise (Chart 16). However, eventually, EV investment will translate into higher sales volumes: Once new technology infrastructure is in place, the long-term profitability of the industry group will improve. Chart 16Earnings Are Rebounding To Pre-pandemic Levels
Earnings Are Rebounding To Pre-pandemic Levels
Earnings Are Rebounding To Pre-pandemic Levels
Valuations: Significant Dispersion Within Industry Group The auto and parts industry has been underperforming the market since February 2020, with valuations coming down significantly. Looking under the hood, we observe a pronounced bifurcation between Tesla and other stocks (Table 2). Table 2Tesla Is Still Expensive, Ford and GM Are Cheap
EV Revolution
EV Revolution
Tesla trades at an eye-watering 596x earnings (which is an improvement from 1,300x back in January) and 16.3x sales multiple. The company has enormous long-term potential, but over the short term it needs to grow into its valuations, as it has effectively “borrowed” returns from the future. Yet investors need to keep in mind that Tesla is a cult stock, and has a strong retail following: Continuation of an irrational speculative bubble is within the realm of possibility. Therefore, a neutral allocation to Tesla will be prudent. Legacy automakers and suppliers are still cheap despite a strong run off their market lows. Forward 12-month PE is in the single/low-double digit range. Low valuations indicate that there is still an overhang of uncertainty over the economic recovery and potential profitability of legacy car manufacturers and suppliers, along with lingering doubts about the success of the group in the EV space. However, there is a lot of room for long-term rerating once there is greater visibility (Chart 17). Chart 17With Tesla Down 30% From Peak, Industry Group Looks Cheaper
With Tesla Down 30% From Peak, Industry Group Looks Cheaper
With Tesla Down 30% From Peak, Industry Group Looks Cheaper
Investment Outlook We have a positive 3-12-month outlook for the investment performance of the EV theme: The entire EV cohort will benefit from government support for decarbonization, the preference of millennials for green tech, and cutting-edge technological innovation. American vehicles are getting old, and consumers have financial resources to purchase new cars. Supply disruptions are gradually dissipating. Gasoline is getting expensive, but EV/ICE parity is near. Investing in automakers and suppliers, which are turning into growth companies with longer duration of cash flows, is also aligned with our thesis of rotating into Growth as rates have stabilized and the pick up in inflation has been priced in. Legacy Automakers are to be primary beneficiaries of the theme. Both Ford and GM are relatively inexpensive. Higher earnings and improved visibility on the success of EV transition should lead to further rerating. Tesla is also a quintessential growth company. However, unlike legacy automakers, it has already had an amazing run. Even though it is down from its peak, it remains expensive, and much of the positive expectations are already baked into price. We recommend staying neutral on Tesla as it is a “cult” stock and a surge “to the moon” is not out of the question. Ecosystem Surge in EV capex and R&D spending will have positive spill-over effect on EV ecosystem suppliers. These are small cap stocks and creating a well-diversified basket of names in battery, radar, chips and software will help capture returns of the long-term winners. Existing EV-themed ETFs may not be perfect: Many have holdings that are way too broad and over diversified, most invest outside of the US. Yet, these are convenient vehicles to capture the theme and provide exposure to the entire EV value chain, including emerging industry players. Bottom Line: The auto industry is undergoing a major technological disruption. This process is expensive and perilous yet presents an enormous future earnings growth opportunity. The ingredients for success are in place: Proliferation of new technologies, government support, changing consumer preferences, and surging US economy. This tide will lift all boats: Legacy and EV-only auto manufacturers and suppliers as well as EV ecosystem players. We are bullish on the sector on a 3-12 months investment horizon. Irene Tunkel Chief Strategist, US Equity Strategy irene.tunkel@bcaresearch.com Appendix Table A1EV/AV ETF Summary
EV Revolution
EV Revolution
Recommended Allocation
EV Revolution
EV Revolution
Highlights Economy – We agree with the Fed’s judgment that sky-high inflation readings will not last: Used-car prices won’t go up forever and neither will airline fares or hotel accommodations. Supply bottlenecks affecting the prices of a wide range of goods will eventually ease. Markets – If growth is too strong for a recession but not so strong that it forces the Fed to induce a recession, equities and spread product will outperform Treasuries: Uncertainty surrounds the post-pandemic economy, but our base case is that the US will be able to grow well above trend in 2021 and 2022 without triggering uncomfortably high inflation. Strategy – Investors should remain at least equal weight risk assets in multi-asset portfolios: A strong-growth, easy-policy backdrop is good for equities and credit and investors should maintain exposure to them in balanced portfolios. Feature The unprecedented nature of the current economic backdrop, in which a global pandemic causes the US to idle large swaths of the economy, inject previously unimaginable amounts of aid to households and businesses to help them withstand its ravages, then attempt to restart the idled elements more than a year later, allows a lot of room for interpretation. One can see just about whatever one wants to see in the incoming flow of data as it is highly uncertain how long it will take the many individual engines to hum after their switches are flipped back to ON from OFF. Investors are charged with getting ahead of moves in forward-looking markets, however, and want to know now what awaits around the bend. Amidst the flow of often contradictory data points, we strive to maintain our focus on the broad overarching trend. We continue to find the Goldilocks-and-the-Two-Tails framework helpful in keeping our eye on the ball (Figure 1). Our base case remains that the just-right strong-growth/accommodative-monetary-policy backdrop will remain in place for the balance of our three-to-twelve-month cyclical investment time frame. COVID-19’s apparent retreat in the US1 leads us to believe that the too-cold left-tail outcome, characterized by disappointingly slow growth, is increasingly unlikely (Chart 1). Figure 1Goldilocks And The Two Tails
Checking In With The Inflation Checklist
Checking In With The Inflation Checklist
Chart 1The Pace Has Slowed, But A Lot Of Americans Are Already Vaccinated
The Pace Has Slowed, But A Lot Of Americans Are Already Vaccinated
The Pace Has Slowed, But A Lot Of Americans Are Already Vaccinated
Table 1Inflation Checklist
Checking In With The Inflation Checklist
Checking In With The Inflation Checklist
The right-tail outcome in which the economy overheats looks more probable and it is our primary concern. Overheating would bring uncomfortably high rates of consumer price inflation and we devote this week’s report to a review of our inflation checklist (Table 1). The checklist is not meant to identify the moment that inflation becomes a mortal threat to the expansion. We will not sound the alarm and adjust our asset allocation recommendations the instant that a pre-determined number of boxes are checked; it is simply meant to provide us with a systematic framework for assessing its movements and their implications for financial markets and the economy. Labor Market Indicators Chart 2Wages Are Not Yet A Hot Spot
Wages Are Not Yet A Hot Spot
Wages Are Not Yet A Hot Spot
The executive summary of last week’s examination of the labor market is that we expect the factors constraining supply will ease considerably by the fall as the services sector fully reopens, in-person learning resumes for all K through 12 students and federal supplements to unemployment insurance benefits expire. Demand for workers remains robust, with the JOLTS job openings rate and the NFIB survey’s unfilled job openings series making new highs. The combination of potent demand and constrained supply is not producing wage inflation, however. The Atlanta Fed’s wage tracker, which follows the same set of employees over time, has rolled over and is now nearly a full point below its post-GFC peak (Chart 2, middle panel); the employment cost index, which also adjusts for changes in labor force composition, is rising but remains near the bottom of its pre-GFC range (Chart 2, bottom panel); and the less-sophisticated average hourly earnings series has dipped below 2% (Chart 2, top panel). Price Indexes Checking the Marquee Indexes box was a no-brainer after the core CPI and core PCE price index made new multi-year highs in May. The question going forward is whether the surge in consumer prices is a one-off or a harbinger of a lasting change. We remain in the one-off camp with the Fed, figuring that the bottlenecks that have pushed month-over-month gains in the price indexes to multi-decade highs are a function of trying to ramp up production to more normal levels after a year-plus interruption. The trimmed-mean measures of core CPI and PCE send a much less worrisome message and suggest that once the bottlenecks driving outlier price increases are resolved, the marquee measures will settle down as well (Chart 3). Chart 3Trimmed-Mean Price Indexes Are Still Well Behaved
Trimmed-Mean Price Indexes Are Still Well Behaved
Trimmed-Mean Price Indexes Are Still Well Behaved
Pipeline Pressures BCA’s pipeline inflation pressure index did not let up in May (Chart 4, top panel), indicating that components like the CRB Raw Industrials Index are still pushing higher, reinforcing our Commodity and Energy Strategy team’s view that several years of tepid investment have left base metals and energy markets with supply deficits that will push prices higher into the intermediate term. The DXY index tested multi-year support at 90 but is holding above it for now (Chart 4, bottom panel), staving off the increase in import prices that could result from a technical breakdown in the dollar. There is also little direct inflation pressure coming from overseas, as consumer prices in the Eurozone and China, the two biggest economies outside of the US, remain contained (Chart 5). Chart 4Pipeline Pressures Have Not Eased, But The Dollar Staved Off An Inflationary Breakdown
Pipeline Pressures Have Not Eased, But The Dollar Staved Off An Inflationary Breakdown
Pipeline Pressures Have Not Eased, But The Dollar Staved Off An Inflationary Breakdown
Chart 5China And The Eurozone Aren't Exporting Inflation Pressures To The US Yet
China And The Eurozone Aren't Exporting Inflation Pressures To The US Yet
China And The Eurozone Aren't Exporting Inflation Pressures To The US Yet
Inflation Expectations Chart 6Markets Still Expect The Rate Of Inflation To Slow Over Time
Markets Still Expect The Rate Of Inflation To Slow Over Time
Markets Still Expect The Rate Of Inflation To Slow Over Time
The inflation expectations curve as derived from market-based measures remains inverted, indicating that investors agree with the Fed’s transitory inflation assessment. The message is the same as it was last month when we showed the TIPS break-even and CPI swap rates for the 2-to-5- and 5-to-10-year periods, though there have been some adjustments across the segments. The 2-to-5-year segment has become more inverted (Chart 6, top and third panels), which is to say that investors expect a larger drop-off in inflation in years three, four and five versus years one and two, while the 5-to-10-year segment has become less inverted (Chart 6, second and bottom panels). The curves still point to declining long-term inflation after a near-term spike, however, as inflation is projected to fall in years 3 to 5 and then hold steady (TIPS) or rise slightly (CPI swaps) in years 6 to 10 (Table 2). We find market-based measures to be more insightful than survey measures, but we were encouraged to see the University of Michigan consumer survey data follow the same pattern. The median 1-year inflation expectation, at 4% (down 60 basis points (“bps”) from May), was 120 bps above the median 5-year inflation expectation of 2.8% (down 20 bps from May’s reading). The New York Fed’s April Survey of Market Participants had 5-year-on-5-year CPI inflation rising, albeit at a modest level that demonstrated market professionals’ inflation expectations remain well anchored. The respondents’ median forecast for the annual rate of inflation from April 2026 through March 2031 was 2.2%, slightly above their 2.1% median forecast from April 2021 through March 2026. Table 2Investors Agree That Inflation Will Be Transitory
Checking In With The Inflation Checklist
Checking In With The Inflation Checklist
The Fed’s Reaction Function The June FOMC meeting accorded with our expectations. The post-meeting statement acknowledged the economy’s improvement as waning infections and an effective vaccination campaign have pushed the pandemic off of center stage. Meeting participants pulled their median liftoff date expectation into 2023 from 2024, aligning “the dots” more closely with financial markets and our own late-2022 view (Chart 7). They also significantly raised their 2021 inflation expectations from March, which had been trampled by the April and May CPI and PCE index releases. Chart 7Much Ado About A Modest Tweak
Much Ado About A Modest Tweak
Much Ado About A Modest Tweak
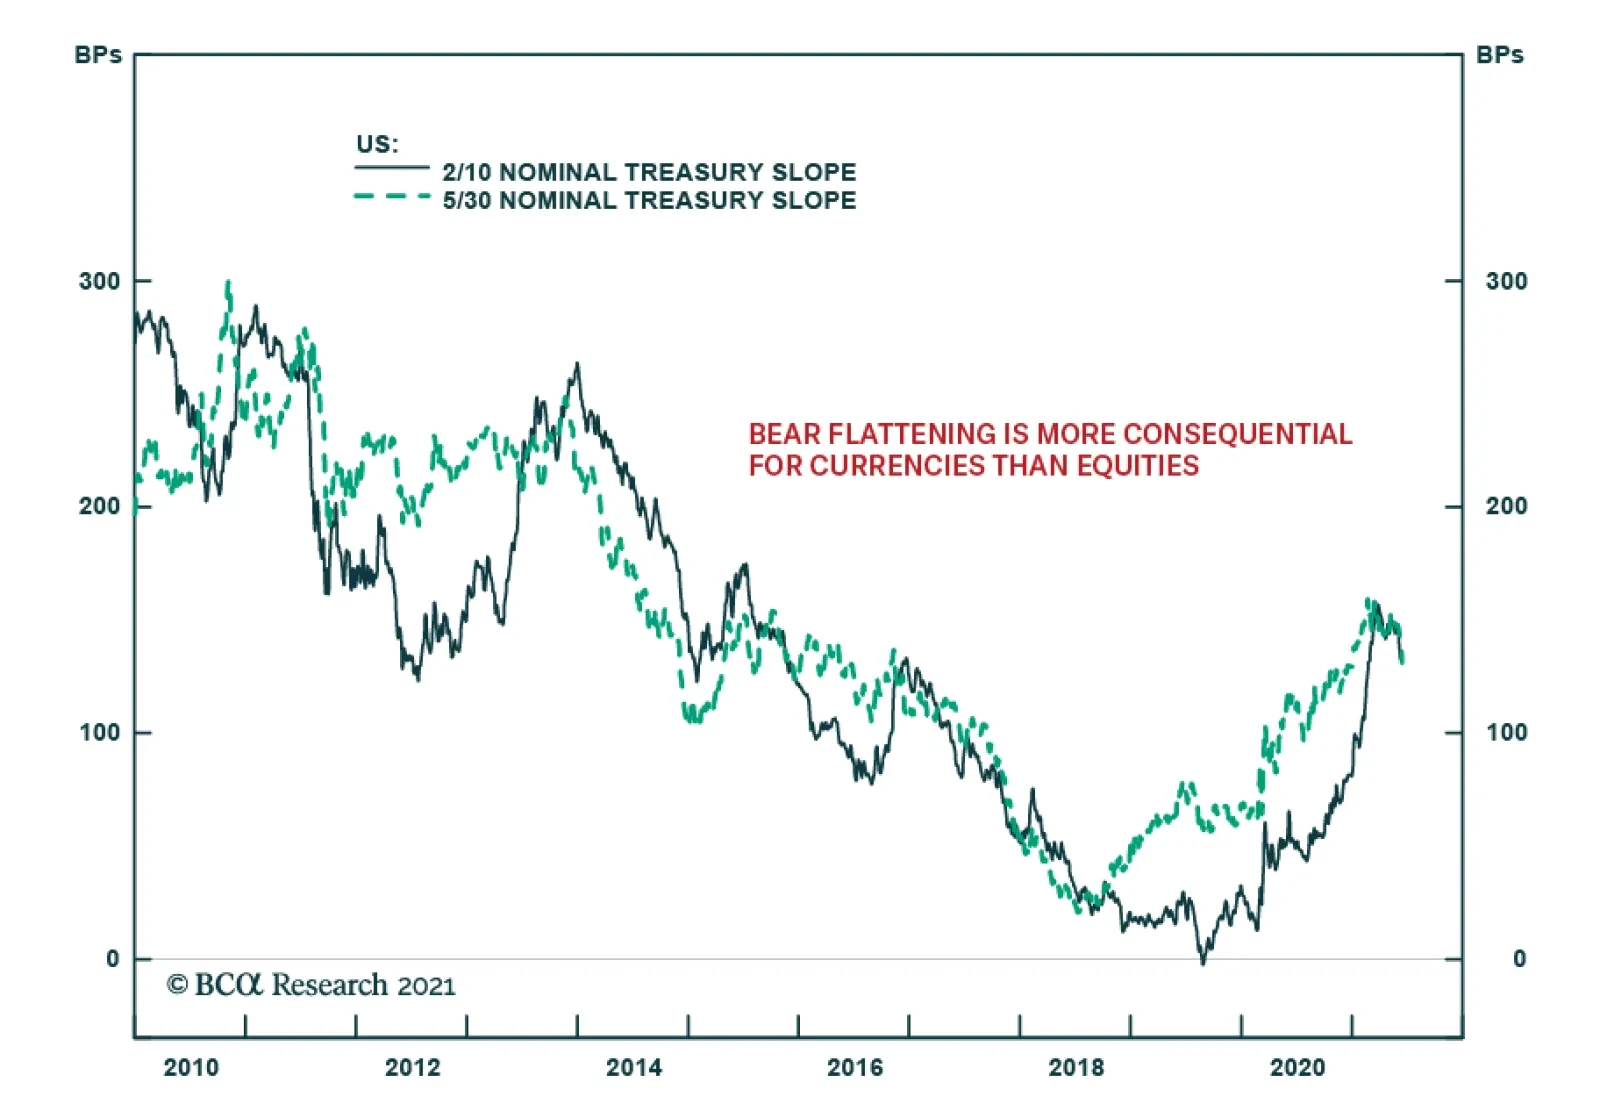
We were therefore surprised that the meeting produced so much excitement in financial markets. Treasuries gyrated, with yields soaring across all maturities Wednesday afternoon before long-dated issues unwound most of their backup (the 10-year note) or made new multi-month lows (the 30-year bond) in Thursday’s session. Yields at the short end of the curve stayed higher as the bond market moved its liftoff date expectations forward, with the net result that the Treasury curve flattened. The dollar popped, precious metals were hammered, and the NASDAQ rose while banks took a hit. We included the Fed reaction function items in our inflation checklist as a way of highlighting that the high-inflation end game will proceed once fed funds rate hikes are directed at containing it. When we introduced the checklist last month, we wrote that we would only check the Fed boxes in the event that Fed speakers begin to telegraph a change of direction or if the dots indicated that the bias toward accommodative policy was shifting. We do not think last week’s recognition that the March Summary of Economic Projections (SEP) had gone stale in the wake of subsequent data releases constitutes a change in the Fed’s accommodative stance. As a Wall Street Journal editorial lamenting that bias (and the administration’s ambitious spending plans) put it,2 Which of the following doesn’t fit with the others? A) 7% GDP growth in 2021. B) 5% and 3.8% year-over-year increases in CPI and core CPI, respectively. C) 4.5% unemployment by year-end, on its way to 3.8% at year-end 2022. D) A near-zero fed funds rate for two more years. As long as the Fed finds a way for D) to coexist with A), C) and whatever B) turns out to be over the ensuing months as transitory inflation pressures abate, there will be no need to check our reaction function boxes. Investors won’t have any need to get overweight benchmark duration to position for a cyclical rally in Treasuries, either. Why Bother? Our US Bond Strategy colleagues have noted that the inflation-related criteria for hiking rates have been met. Year-over-year PCE inflation is above 2% and with the SEP’s median headline and core projections for 2021 PCE inflation at 3.4% and 3%, respectively, it is on track to exceed 2% for some time. If the Fed abides by the specific guidance it has repeatedly outlined, the beginning of the next rate-hiking cycle will depend on the state of the labor market. An investor who wants to position for the cyclical inflection in Treasury yields will be best served by anticipating the path of nonfarm payrolls. We will continue to keep tabs on our inflation checklist, however, because inflation is an important tail risk. We are asked about it in every meeting and it is a hot topic in the general media as well. If households, businesses and investors were to become convinced that a new worrisome inflation regime had begun, financial markets and the economy would be roiled. Even though such a scenario lies outside of our base case, we will track it and think about how to navigate it on the general principle that we would rather be ready than have to get ready. Doug Peta, CFA Chief US Investment Strategist dougp@bcaresearch.com Footnotes 1 The 7-day averages of new cases and deaths have fallen all the way to their late March 2020 levels. 2https://www.wsj.com/articles/no-inflation-worries-at-the-fed-11623883322 Accessed June 17, 2021.
Dear Client, Next week, instead of our regular report, we will be sending you a Special Report from BCA Research’s MacroQuant tactical global asset allocation team. Titled “MacroQuant: A Quantitative Solution For Forecasting Macro-Driven Financial Trends,” this white paper will discuss the purpose, coverage, and methodology of the MacroQuant model. I hope you will find the report insightful. We will be back the following week with the GIS Quarterly Strategy Outlook, where we will explore the major trends that are set to drive financial markets for the rest of 2021 and beyond. We will also be holding a webcast on Thursday, July 8 at 10:00 AM EDT (3:00 PM BST, 4:00 PM CEST, 10:00 PM HKT) to discuss the outlook. Best regards, Peter Berezin Chief Global Strategist Highlights Although the Fed delivered a hawkish surprise on Wednesday, monetary policy is likely to remain highly accommodative for the foreseeable future. We continue to see high US inflation as a long-term risk rather than a short-term problem. Outside of a few industries, wage inflation remains well contained. In those industries suffering from labor shortages, the expiration of emergency unemployment benefits, increased immigration, and the opening up of schools should replenish labor supply. Bottlenecks in the global supply chain are starting to ease. Many key input prices have already rolled over, suggesting that producer price inflation has peaked and is heading down. A slowdown in Chinese credit growth could weigh on metals prices during the summer months, which would further temper inflationary pressures. We are downgrading our view on US TIPS from overweight to neutral. Owning bank shares is a cheaper inflation hedge. Look Who’s Talking The Fed jolted markets on Wednesday after the FOMC signaled it may raise rates twice in 2023. Back in March, the Fed projected no hikes until 2024 (Chart 1). Chart 1Fed Forecasts Converge Toward Market Expectations
Don’t Sweat US Inflation…Just Yet
Don’t Sweat US Inflation…Just Yet
Seven of 18 committee members expected lift-off as early as 2022, up from four in March. Only five participants expected the Fed to start raising rates in 2024 or later, down from 11 previously. The Fed acknowledged recent upward inflation surprises by lifting its forecast of core PCE inflation to 3.4% for 2021 compared with the March projection of 2.4%. These forecast revisions bring the Fed closer to market expectations, although the latter are proving to be a moving target. Going into the FOMC meeting, the OIS curve was pricing in 85 bps of rate tightening by the end of 2023. At present, the market is pricing in about 105 bps of tightening. At his press conference, Chair Powell acknowledged that FOMC members had discussed scaling back asset purchases. “You can think of this meeting as the ‘talking about talking about’ meeting,” he said. A rate hike in 2023 would imply the start of tapering early next year. The key question for investors is whether this week’s FOMC meeting marks the first of many hawkish surprises from the Fed. We do not think it does. As Chair Powell himself noted, the dot-plot is “not a great forecaster of future rate moves,” before adding that “Lift-off is well into the future.” Ultimately, a major monetary tightening cycle would require that inflation remain stubbornly high. As we discuss below, while there are good reasons to think that the US economy will eventually overheat, the current bout of inflation is indeed likely to be “transitory.” This implies that bond yields are unlikely to rise into restrictive territory anytime soon, which should provide continued support to stocks. Inflation: A Long-Term Risk Rather Than A Short-Term Problem Chart 2Globalization Plateaued More Than A Decade Ago
Globalization Plateaued More Than A Decade Ago
Globalization Plateaued More Than A Decade Ago
There are plenty of reasons to worry that US inflation will eventually move persistently higher. As we discussed in a recent report, many of the structural factors that have suppressed inflation over the past 40 years are reversing direction: Globalization is in retreat: The ratio of global trade-to-manufacturing output has been flat for over a decade (Chart 2). Looking out, the ratio could even decline as more companies shift production back home in order to gain greater control over unruly global supply chains. Baby boomers are leaving the labor force en masse. As a group, baby boomers control more than half of US wealth (Chart 3). They will continue to run down their wealth once they retire. However, since they will no longer be working, they will no longer contribute to national output. Continued spending against a backdrop of diminished production could be inflationary. Chart 3Baby Boomers Have Accumulated A Lot Of Wealth
Don’t Sweat US Inflation…Just Yet
Don’t Sweat US Inflation…Just Yet
Despite a pandemic-induced bounce, underlying productivity growth remains disappointing (Chart 4). Slow productivity growth could cause aggregate supply to fall short of aggregate demand. Social stability is in peril, as exemplified by the recent dramatic increase in the US homicide rate. In the past, social instability and higher inflation have gone hand in hand (Chart 5). Chart 4Trend Productivity Growth Has Been Disappointing
Trend Productivity Growth Has Been Disappointing
Trend Productivity Growth Has Been Disappointing
Chart 5Historically, Social Unrest And Higher Inflation Move In Lock-Step
Historically, Social Unrest And Higher Inflation Move In Lock-Step
Historically, Social Unrest And Higher Inflation Move In Lock-Step
Perhaps most importantly, policymakers are aiming to run the economy hot. A tight labor market will lift wage growth (Chart 6). Not only could higher wage growth push up inflation through the usual “cost-push” channel, but by boosting labor’s share of income, a tight labor market could spur aggregate demand. Despite these structural inflationary forces, history suggests that it will take a while – perhaps another two-to-four years – for the US economy to overheat to the point that persistently higher inflation becomes a serious risk. Consider the case of the 1960s. While the labor market reached its full employment level in 1962, it was not until 1966 – when the unemployment rate was a full two percentage points below NAIRU – that inflation finally took off (Chart 7). Chart 6A Tight Labor Market Eventually Bolsters Wages
A Tight Labor Market Eventually Bolsters Wages
A Tight Labor Market Eventually Bolsters Wages
Chart 7Inflation Started Accelerating Quickly Only When Unemployment Reached Very Low Levels In The 1960s
Inflation Started Accelerating Quickly Only When Unemployment Reached Very Low Levels In The 1960s
Inflation Started Accelerating Quickly Only When Unemployment Reached Very Low Levels In The 1960s
In May, 4.4% fewer Americans were employed than in January 2020 (Chart 8). The employment-to-population ratio for prime-aged workers stood at 77.1%, 3.4 percentage points below its pre-pandemic level (Chart 9). Chart 8US Employment Still More Than 4% Below Pre-Pandemic Levels
Don’t Sweat US Inflation…Just Yet
Don’t Sweat US Inflation…Just Yet
Chart 9Prime-Age Employment-To-Population Ratio Remains Below Pre-Pandemic Levels
Prime-Age Employment-To-Population Ratio Remains Below Pre-Pandemic Levels
Prime-Age Employment-To-Population Ratio Remains Below Pre-Pandemic Levels
A Labor Market Puzzle Admittedly, if one were to ask most companies if they were finding it easy to hire suitable workers, one would hear a resounding “no.” According to the National Federation of Independent Business (NFIB), 48% of firms reported difficulty in filling vacant positions in May, the highest share in the 46-year history of the survey (Chart 10). Chart 10US Labor Market Shortages (I)
US Labor Market Shortages (I)
US Labor Market Shortages (I)
Chart 11US Labor Market Shortages (II)
US Labor Market Shortages (II)
US Labor Market Shortages (II)
Nationwide, the job openings rate reached a record high of 6% in April, up from 4.5% in January 2020. The share of workers quitting their jobs voluntarily – a measure of worker confidence – also hit a record of 2.7% (Chart 11). How can we reconcile the apparent tightness in the labor market with the fact that employment is still well below where it was at the outset of the pandemic? Four explanations stand out. First, unemployment benefits remain extremely generous. For most low-wage workers, benefits exceed the pay they received while employed. It is not surprising that labor shortages have been most pronounced in sectors such as leisure and hospitality where average wages are relatively low (Chart 12). The good news for struggling firms is that the disincentive to working will largely evaporate by September when enhanced unemployment benefits expire. Chart 12Labor Scarcity Prevalent In Low-Wage Sectors
Don’t Sweat US Inflation…Just Yet
Don’t Sweat US Inflation…Just Yet
Chart 13School Closures Have Curbed Labor Supply
Don’t Sweat US Inflation…Just Yet
Don’t Sweat US Inflation…Just Yet
Second, lingering fears of the virus and ongoing school closures continue to depress labor force participation. Chart 13 shows that participation rates have recovered less for mothers with young children than for other demographic groups. This problem will also fade away by the fall when schools reopen. Third, the number of foreign workers coming to the US fell dramatically during the pandemic. State Department data show that visas dropped by 88% in the nine months between April and December of last year compared to the same period in 2019 (Chart 14). President Biden revoked President Trump’s visa ban in February, which should pave the way for renewed migration to the US. Chart 14US Migrant Worker Supply Is Depressed
Don’t Sweat US Inflation…Just Yet
Don’t Sweat US Inflation…Just Yet
Chart 15The Pandemic Accelerated Early Retirement
The Pandemic Accelerated Early Retirement
The Pandemic Accelerated Early Retirement
Fourth, about 1.5 million more workers retired during the pandemic than one would have expected based on the pre-pandemic trend (Chart 15). Most of these workers were near retirement age anyway. Thus, there will likely be a decline in new retirements over the next couple of years before the baby boomer exodus described earlier in this report resumes in earnest. Other Input Prices Set To Ease Just as labor shortages in a number of industries will ease later this year, some of the bottlenecks gripping the global supply chain should also diminish. The prices of various key inputs – ranging from lumber, steel, soybeans, corn, to DRAM prices – have rolled over (Chart 16). This suggests that producer price inflation for manufactured goods, which hit a multi-decade high of 13.5% in May – has peaked and is heading lower. Chart 16Input Prices Have Rolled Over
Input Prices Have Rolled Over
Input Prices Have Rolled Over
The jump in prices largely reflected one-off pandemic effects. For example, rental car companies, desperate to raise cash at the start of the pandemic, liquidated part of their fleets. Now that the US economy is reopening, they have found themselves short of vehicles. With fewer rental vehicles hitting the used car market, households flush with cash, and new vehicle production constrained by the global semiconductor shortage, both new and used car prices have soared. Vehicle prices have essentially moved sideways since the mid-1990s (Chart 17). Thus, it is doubtful that the recent surge in prices represents a structural break. More likely, prices will come down as supply increases. According to a recent report from Goldman Sachs, auto production schedules already imply an almost complete return to January output levels in June. Chart 17Vehicle Prices Have Essentially Moved Sideways Since The Mid-1990s
Vehicle Prices Have Essentially Moved Sideways Since The Mid-1990s
Vehicle Prices Have Essentially Moved Sideways Since The Mid-1990s
Chart 18Rebounding Pandemic-Affected Services Prices Are Pushing Up Overall CPI
Don’t Sweat US Inflation…Just Yet
Don’t Sweat US Inflation…Just Yet
As Chart 18 shows, more than half of the increase in consumer prices in April and May can be explained by higher vehicle prices, along with a rebound in pandemic-affected service prices (airfares, hotels, and event admissions). Outside those sectors, the level of the CPI remains below its pre-pandemic trend (Chart 19). Chart 19Unwinding Of "Base Effects"
Unwinding Of "Base Effects"
Unwinding Of "Base Effects"
Chart 20"Supercore" Inflation Measures Remain Well Contained
"Supercore" Inflation Measures Remain Well Contained
"Supercore" Inflation Measures Remain Well Contained
More refined measures of underlying inflation such as the trimmed-mean CPI, median CPI, and sticky price CPI are all running well below their official core CPI counterpart (Chart 20). While certain components of the CPI basket, such as residential rental payments, are likely to exhibit higher inflation in the months ahead, others such as vehicle and food prices will see lower inflation, and perhaps even outright deflation. Slower Chinese Credit Growth Should Temper Commodity Inflation Chart 21Chinese Credit Growth And Metal Prices Move Together
Chinese Credit Growth And Metal Prices Move Together
Chinese Credit Growth And Metal Prices Move Together
Chinese credit growth and base metals prices are strongly correlated (Chart 21). We do not expect the Chinese authorities to embark on a new deleveraging campaign. Credit growth has already fallen back to 11%, which is close to the prior bottom reached in late-2018. Nevertheless, to the extent that changes in Chinese credit growth affect commodity prices with a lag of about six months, metals prices could struggle to maintain altitude over the summer months. China’s plan to release metal reserves into the market could further dampen prices. We remain short the global copper ETF (COPX) relative to the global energy ETF (IXC) in our trade recommendations. The trade is up 18.4% since we initiated on May 27, 2021. We will close this trade if it reaches our profit target of 30%. Bank Shares Are A Better Hedge Against Inflation Than TIPS We have been overweight TIPS in our view matrix. However, with 5-year/5-year forward breakevens trading near pre-pandemic levels, any near-term upside for inflation expectations is limited (Chart 22). As such, we are downgrading TIPS from overweight to neutral in our fixed-income recommendations. Investors looking to hedge inflation risk should consider bank shares. Our baseline view is that the 10-year Treasury yield will rise to about 1.9% by the end of the year. If inflation fails to come down as fast as we anticipate, bond yields would increase even more than that. Chart 23 shows that banks almost always outperform the S&P 500 when bond yields are rising. Chart 22Limited Near-Term Upside For Inflation Expectations
Limited Near-Term Upside For Inflation Expectations
Limited Near-Term Upside For Inflation Expectations
Chart 23Bank Shares Thrive in A Rising Yield Environment
Bank Shares Thrive in A Rising Yield Environment
Bank Shares Thrive in A Rising Yield Environment
Banks are also cheap. US banks trade at 12.2-times forward earnings compared with 21.9-times for the S&P 500. Non-US banks trade at 10-times forward earnings compared to 16.4-times for the MSCI ACW ex-US index. Finally, we like gold as a long-term inflation hedge. We would go long gold in our structural trade recommendations if the price were to fall to $1700/ounce. Peter Berezin Chief Global Strategist pberezin@bcaresearch.com Global Investment Strategy View Matrix
Don’t Sweat US Inflation…Just Yet
Don’t Sweat US Inflation…Just Yet
Special Trade Recommendations
Don’t Sweat US Inflation…Just Yet
Don’t Sweat US Inflation…Just Yet
Current MacroQuant Model Scores
Don’t Sweat US Inflation…Just Yet
Don’t Sweat US Inflation…Just Yet
Highlights China’s Communist Party has overcome a range of challenges over the past 100 years, performed especially well over the past 42 years, but the macro and geopolitical outlook is darkening. The “East Asian miracle” phase of Chinese growth has ended. Potential GDP growth is slowing and it will be harder for Beijing to maintain financial and sociopolitical stability. The Communist Party has shifted the basis of its legitimacy from rapid growth to quality of life and nationalist foreign policy. The latter, however, will undermine the former by stirring up foreign protectionism. In the near term, global investors should favor developed market equities over China/EM equities. But they should favor China and Hong Kong stocks over Taiwanese stocks given significant geopolitical risk over the Taiwan Strait. Structurally, favor the US dollar and euro over the renminbi. Feature Ten years ago, in the lead up to the Communist Party’s 90th anniversary, I wrote a report called “China and the End of the Deng Dynasty,” referring to Deng Xiaoping, the Chinese Communist Party’s great pro-market reformer.1 The argument rested on three points: the end of the export-manufacturing economic model, an increasingly assertive foreign policy, and the revival of Maoist nationalism. After ten years the report holds up reasonably well but it did not venture to forecast what precisely would come next. In reality it is the rule of the Communist Party, and not the leader of any one man, that fits into China’s history of dynastic cycles. As the party celebrates a hundred years since its founding on July 23, 1921, it is necessary to pause and reflect on what the party has achieved over the past century and what the current Xi Jinping era implies for the country’s next 100 years. Single-Party Rule Can Bring Economic Success. Communism Cannot. Regime type does not preclude wealth. Countries can prosper regardless of whether they are ruled by one person, one party, or many parties. The richest countries in the world grew rich over centuries in which their governments evolved from monarchy to democracy and sometimes back again. Even today several of the world’s wealthy democracies are better described as republics or oligarchies. Chart 1China Outperformed Communism But Not Liberal Democracy
China’s Communist Party Turns 100: So What?
China’s Communist Party Turns 100: So What?
The rule of one person, or autocracy, is not necessarily bad for economic growth. For every Kim Il Sung of North Korea there is a Lee Kuan Yew of Singapore. But authority based on a single person often expires with that person and rarely survives his grandchild. In China, Chairman Mao Zedong’s death occasioned a power struggle. Deng Xiaoping’s attempts to step down led to popular unrest that threatened the Communist Party’s rule on two separate occasions in the 1980s. The rule of a single party is thought to be more sustainable. Japan and Singapore are effectively single-party states and the wealthiest countries in Asia. They are democracies with leadership rotation and a popular voice in national affairs. And yet South Korea’s boom times occurred under single-party military rule. The same goes for the renegade province of Taiwan. Only around the time these two reached about $11,000-$14,000 GDP per capita did they evolve into multi-party democracies – though their wealth grew rapidly in the wake of that transition. China and soon Vietnam will test whether non-democratic, single-party rule can persist beyond the middle-income economic status that brought about democratic transition in Taiwan (Chart 1). Vietnam and Taiwan are the closest communist and non-communist governing systems, respectively, to mainland China. Insofar as China and Vietnam succeed at catching up with Taiwan it will be for reasons other than Marxist-Leninist ideology. Most communist systems have failed. At the height of international communism in the twentieth century there were 44 states ruled by communist parties; today there are five. China and Vietnam are the rare examples of communist states that not only survived the Soviet Union’s fall but also unleashed market forces and prospered (Chart 2). North Korea survived in squalor; Cuba’s experience is mixed. States that close off their economies do not have a good record of generating wealth. Closed economies lack competition and investment, struggle with stagflation, and often succumb to corruption and political strife. Openness seems to be a more diagnostic variable than government type or ideology, given the prosperity of democratic Japan and non-democratic China. Has the CPC performed better than other communist regimes? Arguably. It performs better than Vietnam but worse than Cuba on critical measures like infant mortality rates and life expectancy. Has it performed better than comparable non-communist regimes? Not really, though it is fast approaching Taiwan in all of these measures (Chart 3). Chart 2Communist States Get Rich By Compromising Their Communism
China’s Communist Party Turns 100: So What?
China’s Communist Party Turns 100: So What?
Chart 3China Catching Up To Cuba On Basic Wellbeing
China’s Communist Party Turns 100: So What?
China’s Communist Party Turns 100: So What?
What can be said for certain is that, since China’s 1979 reform and opening up, the CPC has avoided many errors and catastrophes. It survived the 1980s, 1990s, and 2000s without succumbing to international isolation, internal divisions, or economic crisis. It has drastically increased its share of global power (Table 1). Contrast this global ascent with the litany of mistakes and crises in the US since the year 2000. The CPC also managed the past decade relatively well despite the Chinese financial turmoil of 2015-16, the US trade war of 2018-19, and the COVID-19 pandemic. However, these events hint at greater challenges to come. China’s transition to a consumer-oriented economy has hardly begun. The struggle to manage systemic financial risk is intensifying today at risk to growth and stability (Chart 4). The trade war is simmering despite the Phase One trade deal and the change of party in the White House. And it is too soon to draw conclusions about the impact of the global pandemic, though China suppressed the virus more rapidly than other countries and led the world into recovery. Table 1China’s Global Rise After ‘Reform And Opening Up’
China’s Communist Party Turns 100: So What?
China’s Communist Party Turns 100: So What?
Chart 4China To Keep Struggling With Financial Instability
China To Keep Struggling With Financial Instability
China To Keep Struggling With Financial Instability
Judging by the points above, there are two significant risks on the horizon. First, the CPC’s revival of neo-Maoist ideology, particularly the new economic mantra of self-reliance and “dual circulation” (import substitution), poses the risk of closing the economy and undermining productivity.2 Second, China’s sliding back into the rule of a single person – after the “consensus rule” that prevailed after Deng Xiaoping – increases the risk of unpredictable decision-making and a succession crisis whenever General Secretary Xi Jinping steps down. The party’s internal logic holds that China’s economic and geopolitical challenges are so enormous as to require a strongman leader at the helm of a single-party and centralized state. But because of the traditional problems with one-man rule, there is no guarantee that the country will remain as stable as it has been over the past 42 years. Slowing Growth Drives Clash With Foreign Powers Every major East Asian economy has enjoyed a “miracle” phase of growth – and every one of them has seen this phase come to an end. Now it is China’s turn. The country’s potential GDP growth is slowing as the population peaks, the labor force shrinks, wages rise, and companies outsource production to cheaper neighbors (Charts 5A & 5B). The Communist Party is attempting to reverse the collapse in the fertility rate by shifting from its historic “one Child policy,” which sharply reduced births. It shifted to a two-child policy in 2016 and a three-child policy in 2021 but the results have not been encouraging over the past five years. Chart 5AChina’s Demographic Decline Accelerating
China’s Communist Party Turns 100: So What?
China’s Communist Party Turns 100: So What?
Chart 5BChina’s Demographic Decline Accelerating
China’s Communist Party Turns 100: So What?
China’s Communist Party Turns 100: So What?
In the best case China’s growth will follow the trajectory of Taiwan and South Korea, which implies at most a 6% yearly growth rate over the next decade (Chart 6). This is not too slow but it will induce financial instability as well as hardship for overly indebted households, firms, and local governments. Chart 6China's Growth Rates Will Converge With Taiwan, South Korea
China's Growth Rates Will Converge With Taiwan, South Korea
China's Growth Rates Will Converge With Taiwan, South Korea
The Communist Party’s legitimacy was not originally based on rapid economic growth but it came to be seen that way over the roaring decades of the 1980s through the 2000s. Thus when the Great Recession struck the party had to shift the party’s base of legitimacy. The new focus became quality of life, as marked by the Xi administration’s ongoing initiatives to cut back on corruption, pollution, poverty, credit excesses, and industrial overcapacity while increasing spending on health, education, and society (Chart 7). Chart 7China’s Fiscal Burdens Will Rise On Social Welfare Needs
China’s Communist Party Turns 100: So What?
China’s Communist Party Turns 100: So What?
The party’s efforts to improve standards of living and consumer safety also coincided with an increase in propaganda, censorship, and repression to foreclose political dissent. The country falls far short in global governance indicators (Chart 8). Chart 8China Lags In Governance, Rule Of Law
China’s Communist Party Turns 100: So What?
China’s Communist Party Turns 100: So What?
A second major new source of party legitimacy is nationalist foreign policy. China adopted a “more assertive” foreign and trade policy in the mid-2000s as its import dependencies ballooned. It helped that the US was distracted with wars of choice and financial crises. After the Great Recession the CPC’s foreign policy nationalism became a tool of generating domestic popular support amid slower economic growth. This was apparent in the clashes with Japan and other countries in the East and South China Seas in the early 2010s, in territorial disputes with India throughout the past decade, in political spats with Norway and most recently Australia, and in military showdowns over the Korean peninsula (2015-16) and today the Taiwan Strait (Chart 9). Chart 9Proxy Wars A Real Risk In China’s Periphery
China’s Communist Party Turns 100: So What?
China’s Communist Party Turns 100: So What?
If China were primarily focused on foreign policy and global strategy then it would not provoke multiple neighbors on opposite sides of its territory at the same time. This is a good way to motivate the formation of a global balance-of-power coalition that can constrain China in the coming years. But China’s outward assertiveness is not driven primarily by foreign policy considerations. It is driven by the secular economic slowdown at home and the need to use nationalism to drum up domestic support. This is why China seems indifferent to offending multiple countries at once (like India and Australia) as well as more distant trade partners whom it “should be” courting rather than offending (like Europe). Such assertive foreign policy threatens to undermine quality of life, namely by provoking international protectionism and sanctions on trade and investment. The US is galvanizing a coalition of democracies to put pressure on China over its trade practices and human rights. The Asian allies are mostly in step with the US because they fear China’s growing clout. The European states do not have as much to fear from China’s military but they do fear China’s state-backed industry and technological rise. Europe’s elites also worry about anti-establishment political movements just like American elites and therefore are trying to win back the hearts and minds of the working class through a more proactive use of fiscal and industrial policy. This entails a more assertive trade policy. China has so far not adapted to the potential for a unified front among the democracies, other than through rhetoric. Thus the international horizon is darkening even as China’s growth rates shift downward. China’s Geopolitical Outlook Is Dimming China’s government has overcome a range of challenges and crises. The country takes an ever larger role in global trade despite its falling share of global population because of its productivity and competitiveness. The drop in China’s outward direct investment is tied to the global pandemic and may not mark a top, given that the country will still run substantial current account surpluses for the foreseeable future and will need to recycle these into natural resources and foreign production (Chart 10). However, the limited adoption of the renminbi as a reserve currency in the face of this formidable commercial power reveals the world’s reservations about Beijing’s ability to maintain macroeconomic stability, good governance, and peaceful foreign relations. Chart 10China's Rise Continues
China's Rise Continues
China's Rise Continues
Chart 11China's Policy Uncertainty: A Structural Uptrend
China's Policy Uncertainty: A Structural Uptrend
China's Policy Uncertainty: A Structural Uptrend
China is not in a position to alter the course of national policy dramatically prior to the Communist Party’s twentieth national congress in 2022. The Xi administration is focused on normalizing monetary and fiscal policy and heading off any sociopolitical disturbances prior to that critical event, in which General Secretary Xi Jinping, who was originally slated to step down at this time according to the old rules, may be anointed the overarching “chairman” position that Mao Zedong once held. The seventh generation of Chinese leaders will be promoted at this five-year rotation of the Central Committee and will further consolidate the Xi administration’s grip. It will also cement the party’s rotation back to leaders who have ideological educations, as opposed to the norm in the 1990s and early 2000s of promoting leaders with technocratic skills and scientific educations.3 This does not mean that President Xi will refuse to hold a summit with US President Biden in the coming months nor does it mean that US-China strategic and economic dialogue will remain defunct. But it does mean that Beijing is unlikely to make any major course correction until after the 2022 reshuffle – and even then a course correction is unlikely. China has taken its current path because the Communist Party fears the sociopolitical consequences of relinquishing economic control just as potential growth slows. The new ruling philosophy holds that the Soviet Union fell because of Mikhail Gorbachev’s glasnost and perestroika, not because openness and restructuring came too late. Moreover it is far from clear that the US, Europe, and other democratic allies will apply such significant and sustained pressure as to force China to change its overall strategy. America is still internally divided and its foreign policy incoherent; the EU remains reactive and risk-averse. China has a well-established set of strategic goals for 2035 and 2049, the 100th anniversary of the People’s Republic, and the broad outlines will not be abandoned. The implication is that tensions with the US and China’s Asian neighbors will persist. Rising policy uncertainty is a secular trend that will pick back up sooner rather than later (Chart 11), to the detriment of a stable and predictable investment environment. Chart 12Chinese Government’s Net Worth High But Hidden Liabilities Pose Risks
China’s Communist Party Turns 100: So What?
China’s Communist Party Turns 100: So What?
Monetary and fiscal dovishness and a continued debt buildup are the obvious and necessary solutions to China’s combination of falling growth potential, rising social liabilities, the need to maintain the rapid military buildup in the face of geopolitical challenges. Sovereign countries can amass vast debts if they own their own debt and keep nominal growth above average bond yields. China’s government has a very favorable balance sheet when national assets are taken into consideration as well as liabilities, according to the IMF (Chart 12). On the other hand, China’s government is having to assume a lot of hidden liabilities from inefficient state-owned companies and local governments. In the short run there are major systemic financial risks even though in the long run Beijing will be able to increase its borrowing and bail out failing entities in order to maintain stability, just like Japan, the US, and Europe have had to do. The question for China is whether the social and political system will be able to handle major crises as well as the US and Europe have done, which is not that well. Investment Takeaways The rule of a single party is not a bar to economic success – but the rule of a single person is a liability due to the problem of succession. Marxism-Leninism is terrible for productivity unless it is compromised to allow for markets to operate, as in China and Vietnam. States that close their economies to the outside world usually atrophy. There is no compelling evidence that China’s Communist Party has performed better than a non-communist alternative would have done, given the province of Taiwan’s superior performance on most economic indicators. Since 1979, the Communist Party has avoided catastrophic errors. It has capitalized on domestic economic potential and a favorable international environment. Now, in the 2020s, both of these factors are changing for the worse. China’s “miracle” phase of growth has expired, as it did for other East Asian states before it. The maturation of the economy and slowdown of potential GDP have forced the Communist Party to shift the base of its political legitimacy to something other than rapid income growth: namely, quality of life and nationalist foreign policy. An aggressive foreign policy works against quality of life by provoking protectionism from foreign powers, particularly the United States, which is capable of leading a coalition of states to pressure China. The Communist Party’s policy trajectory is unlikely to change much through the twentieth national party congress in 2022. After that, a major course correction to improve relations with the West is conceivable, though we would not bet on it. Between 2021 and China’s 2035 and 2049 milestones, the Communist Party must navigate between rising socioeconomic pressures at home and rising geopolitical pressures abroad. An economic or political breakdown at home, or a total breakdown in relations with the US, could lead to proxy wars in China’s periphery, including but not limited to the Taiwan Strait. For now, global investors should favor the euro and US dollar over the renminbi (Chart 13). Chart 13Prefer The Dollar And Euro To The Renminbi
Prefer The Dollar And Euro To The Renminbi
Prefer The Dollar And Euro To The Renminbi
Mainland investors should favor government bonds relative to stocks. Chinese stocks hit a major peak earlier this year and the government’s seizure of control over the tech sector is taking a toll. Investors should prefer developed market equities relative to Chinese equities until China’s current phase of policy tightening ends and there is at least a temporary improvement in relations with the United States. But investors should also prefer Chinese and Hong Kong stocks relative to Taiwanese due to the high risk of a diplomatic crisis and the tail risk of a war. Matt Gertken Vice President Geopolitical Strategy mattg@bcaresearch.com Footnotes 1 The report concluded, “the emerging trends suggest a likely break from Deng's position toward heavier state intervention in the economy, more contentious relationships with neighbors, and a Party that rules primarily through ideology and social control.” Co-written with Jennifer Richmond, "China and the End of the Deng Dynasty," Stratfor, April 19, 2011, worldview.stratfor.com. 2 The Xi administration’s new concept of “dual circulation” entails that state policy will encourage the domestic economy whereas the international economy will play a secondary role. This is a reversal of the outward and trade-oriented economic model under Deng Xiaoping. See “Xi: China’s economy has potential to maintain long-term stable development,” November 4, 2020, news.cgtn.com. 3 See Willy Wo-Lap Lam, "China’s Seventh-Generation Leadership Emerges onto the Stage," Jamestown Foundation, China Brief 19:7, April 9, 2019, Jamestown.org.
Based on the reaction of financial markets, Wednesday’s FOMC meeting produced an unquestionably hawkish surprise for financial markets. US Treasuries sold off, the US dollar strengthened, and gold fell. However, equity moves were significantly more muted. The…
Highlights Oil demand expectations remain high. Realized demand continues to disappoint. This means OPEC 2.0's production-management strategy – i.e., keeping the level of supply below demand – will continue to dictate oil-price levels. US producers will remain focused on consolidation via M&A and on returning capital to shareholders, in line with the Kingdom of Saudi Arabia's (KSA) expectation. Going forward, shale producers will focus on protecting and growing profit margins. The durability of OPEC 2.0's tactical advantage arising from its enormous spare capacity – ~ 7mm b/d – is difficult to gauge: Tightening global oil markets now in anticipation of Iran's return as a bona fide exporter benefits producers globally, and could accelerate the return of US shales if that return is delayed or re-opening boosts demand more than expected. We are raising our average Brent forecast for 2021 to $66.50 vs. $63/bbl earlier, with 2H21 prices averaging $70/bbl. We are moving our 2022 and 2023 forecasts up slightly to $74 and $81/bbl (Chart of the Week). WTI will trade $2-$3/bbl lower. We remain long the S&P GSCI Dynamic Roll Index ETF (COMT) and the S&P GSCI, expecting tight supply-demand balances to further steepen backwardations in forward curves. Feature While the forecasted rebound in global oil demand continues to drive expectations for higher prices, it is the production discipline of OPEC 2.0 and capital discipline imposed on US shale producers that has and will continue to super-charge the recovery of prices. Continued monetary accommodation and fiscal stimulus notwithstanding, realized global oil demand has mostly flatlined at ~ 96mm b/d following its surge in February, as uncertainty over COVID-19 containment keeps governments hesitant about reopening their economies too quickly. Stronger demand in Asia, led by China, has been offset by weaker demand in India and Japan, where COVID-19 remains a deterrent to re-opening and recovery. The recovery in DM demand generally stalled over this period even as vaccine availability increased (Chart 2). Chart of the WeekOPEC 2.0 Comfortable With Higher Prices
Balance Of Risks Tilts To Higher Oil Prices
Balance Of Risks Tilts To Higher Oil Prices
Chart 2Global Demand Recovery Stalled
Balance Of Risks Tilts To Higher Oil Prices
Balance Of Risks Tilts To Higher Oil Prices
That likely will change in 2H21, but it is not a given: The UK, which has been among the world leaders in COVID-19 containment and vaccinations, delayed its full reopening by a month – to July 19 – in an effort to gain more time to bolster its efforts against the Delta variant first identified in India. In the US, New York state lifted all COVID-19-induced restrictions and fully re-opened this week. Still, even in the US, unintended inventory accumulation in the gasoline market – just as the summer driving season should be kicking into high gear – suggests consumers remain cautious (Chart 3). Chart 3Unintended Inventory Accumulation in US Gasoline Market
Balance Of Risks Tilts To Higher Oil Prices
Balance Of Risks Tilts To Higher Oil Prices
We continue to expect the re-opening of the US and Europe (including the UK) will boost DM demand in 2H21, and wider vaccine availability will boost EM oil demand later in the year and in 2022. For all of 2021, we have lifted our demand-growth estimate slightly to 5.3mm b/d from 5.2mm b/d last month. We expect global demand to grow 4.1mm b/d next year and 1.6mm b/d in 2023. Our 2021 estimates are in line with those of the US EIA and the IEA. OPEC is more bullish on demand recovery this year, expecting growth of 6mm b/d. We continue to believe the risk on the demand side remains to the upside; however, given continued uncertainty around global COVID-19 containment, we remain circumspect. Supply-Side Discipline Drives Oil Prices OPEC 2.0 remains committed to its production-management strategy that is keeping the level of supply below demand. Compliance with production cuts in May reportedly was at 115%, following a 114% rate in April.1 Core OPEC 2.0 – i.e., states with the capacity to increase production – is holding ~ 7mm b/d of spare capacity, according to the IEA, which will allow it to continue to perform its role as the dominant supplier in our modeling (Chart 4). Earlier this year, KSA's Energy Minister Abdulaziz bin Salman correctly recognized the turn in the market that likely ensures OPEC 2.0's dominance for the foreseeable future – i.e., the shift in focus of the US shale-oil producers from production for the sake of production to profitability.2 This is a trend that has been apparent for years as capital markets all but abandoned US shale-oil producers. Chart 4OPEC 2.0 Remains Dominant
Balance Of Risks Tilts To Higher Oil Prices
Balance Of Risks Tilts To Higher Oil Prices
Producers outside OPEC 2.0 – what we refer to as the "price-taking cohort" – have prioritized shareholder interests as a result of this market pressure, and remain focused on sometimes-forced consolidation via M&A, which we have been expecting.3 The significance of this evolution of shale-oil production is difficult to overstate, particularly as the survivors of this consolidation will be firms with strong balance sheets and a focus on profitability, as is the case with any well-run manufacturing firm. We also expect large producers to opportunistically shed production assets to reduce their carbon footprints, so as to come into compliance with court-ordered emission reductions and shareholder demands to reduce pollution.4 With the oil majors like Shell, Equinor and Oxy divesting themselves of shale properties, production increasingly will be in the hands of firms driven by profitability.5 We expect US shale-oil production to end the year at 9.86mm b/d and to average 9.57mm b/d next year; however, as the shales become the marginal global supply, production could become more volatile (Chart 5). The consolidation of US production also will alter the profitability of firms continuing to operate in the shales. We expect breakeven costs to fall as acquired production by stronger firms results in high-grading of assets – only the most profitable will be produced given market-pricing dynamics – while less profitable acreage will be mothballed until prices support development(Chart 6). Chart 5US Producers Focus On Profitability
Balance Of Risks Tilts To Higher Oil Prices
Balance Of Risks Tilts To Higher Oil Prices
Chart 6Shale Breakevens Likely Fall As Consolidation Picks Up
Balance Of Risks Tilts To Higher Oil Prices
Balance Of Risks Tilts To Higher Oil Prices
Supply-Demand Balances Tightening The current round of M&A consolidation and OPEC 2.0's continued discipline lead us to expect continued tightening of global oil supply-demand balances this year and next (Chart 7). This will allow inventories to continue to draw, which will keep forward oil curves backwardated (Chart 8). Chart 7Supply-Demand Balances Will Continue To Tighten
Balance Of Risks Tilts To Higher Oil Prices
Balance Of Risks Tilts To Higher Oil Prices
Chart 8Tighter Markets, Lower Stocks
Balance Of Risks Tilts To Higher Oil Prices
Balance Of Risks Tilts To Higher Oil Prices
The critical factor here will be OPEC 2.0's continued calibration of supply in line with realized demand and the return of Iran as a bona fide exporter, which we expect later this year. OPEC 2.0's restoration of ~ 2mm b/d of supply will be done by the beginning of 3Q21, when we expect Iran to begin restoring production and visible exports (i.e., in addition to its under-the-radar sales presently). The return of Iranian supply – and a possible increase in Libyan output – will present some timing difficulties for OPEC 2.0's overall strategy, but they will be short-lived. We continue to monitor output to assess the evolution of balances (Table 1). Table 1BCA Global Oil Supply - Demand Balances (MMb/d, Base Case Balances)
Balance Of Risks Tilts To Higher Oil Prices
Balance Of Risks Tilts To Higher Oil Prices
Investment Implications Oil demand will increase over the course of 2H21, as vaccines become more widely distributed globally, and the massive fiscal and monetary stimulus deployed worldwide kicks economic activity into high gear. On the supply side, markets will tighten on the back of continued restraint until Iranian barrels return to the market. The balance of risk is to the upside, particularly if the US and Iran are unable to agree terms that restore Iran as a bona fide exporter. In that case, the market tightening now under way will result in sharply higher prices. That said, realized demand growth has stalled over the past three months, which can be seen in unintended inventory accumulation in the US gasoline markets just as the summer driving season opens. We are raising our average Brent forecast for 2021 to $66.50 vs. $63/bbl earlier, with 2H21 prices averaging $70/bbl. We are moving our 2022 and 2023 forecasts up slightly as well to $74 and $81/bbl (Chart of the Week). WTI will trade $2-$3/bbl lower. We remain long the S&P GSCI Dynamic Roll Index ETF (COMT) and the S&P GSCI, expecting tight supply-demand balances to further steepen backwardations in forward curves. The big risk, as highlighted above, remains an acceleration of COVID-19 infections, hospitalizations and deaths, which force governments to delay re-opening or impose localized lockdowns once again. In this regard, KSA's strategy of calibrating its output to realized – vice forecasted – demand likely will remain in place. Robert P. Ryan Chief Commodity & Energy Strategist rryan@bcaresearch.com Ashwin Shyam Research Associate Commodity & Energy Strategy ashwin.shyam@bcaresearch.com Commodities Round-Up Energy: Bullish China's refinery throughput surged 4.4% to 14.3mm b/d in May, a record high that surpassed November 2020's previous record of 14.26mm b/d, according to S&P Platts Global. The increased runs were not unexpected, and were largely accounted for by state-owned refiners, which operated at 80% of capacity after coming out of turnaround season. Turnarounds will fully end in July. In addition, taxes on niche refined-product imports are due to increase, which will bolster refinery margins as inventories are worked down. China's domestic crude oil production was just slightly more than 4mm b/d. Base Metals: Bullish China's Standing Committee approved the release an undisclosed amount of its copper, aluminum and zinc stockpiles via an auction process in the near future, according to reuters.com. The government disclosed its intent on the website of National Food and Strategic Reserves Administration on Wednesday; however, specifics of the auction – volumes and auction schedule, in particular – were not disclosed. Prices had fallen ~ 9% from recent record highs in the lead-up to the announcement, which we flagged last month.6 Prices rallied from lows close to $4.34/lb on the COMEX Wednesday (Chart 9). Precious Metals: Bullish After a worse-than-expected US employment report, we do not expect the Federal Reserve to lift nominal interest rates in Wednesday’s Federal Open Market Committee (FOMC) meeting. The Fed will only raise rates once the US economy reaches a level consistent with its definition of "maximum employment." Wednesday’s interest rate decision will be crucial to gold prices. If the Fed does not mention asset tapering or an interest-rate hike, citing current inflation as a transitory phenomenon, gold demand and prices will rise. On the other hand, if the Fed indicates an interest rate hike sooner than the previously stated 2024, this will weigh on gold prices (Chart 10). Ags/Softs: Neutral As of June 13, 96% of the US corn crop had emerged vs. the five-year average of 91%, according to the USDA. 68% of the crop was rated in good to excellent condition, slightly below the five-year average. In the bean market, 94% of the crop was planted as of 13 June, vs. the five-year average of 88%. The Department reported 86% of the crop had emerged vs. the five-year average of 74%. According to the USDA, 52% of the bean crop was in good-to-excellent condition vs the five-year average of 72%. Chart 9
Balance Of Risks Tilts To Higher Oil Prices
Balance Of Risks Tilts To Higher Oil Prices
Chart 10
Balance Of Risks Tilts To Higher Oil Prices
Balance Of Risks Tilts To Higher Oil Prices
Footnotes 1 Please see OPEC+ complies with 115% of agreed oil curbs in May - source published by reuters.com on June 11, 2021. 2 Please see Saudis raise U.S. and Asian crude prices for April delivery published by worldoil.com on March 8, 2021. 3 Please see US shale consolidation continues as Independence scoops up Contango Oil & Gas published by S&P Global Platts on June 8, 2021. 4 We discuss this in A Perfect Energy Storm On The Way, published on June 3, 2021. Climate activism will become increasingly important to the evolution of oil and natural gas production, and likely will lead to greater concentration of supply in the hands of OPEC 2.0 and privately held producers that do not answer to shareholders. 5 Please see Interest in Shell's Permian assets seen as a bellwether for shale demand published by reuters.com on June 15, 2021. 6 Please see Less Metal, More Jawboning, which we published on May 27, 2021. It is available at ces.bcaresearch.com. Investment Views and Themes Strategic Recommendations Tactical Trades Commodity Prices and Plays Reference Table Trades Closed in 2021 Summary of Closed Trades
Image
Highlights The US Innovation and Competition Act shows that the US is rediscovering industrial policy amid domestic populism and foreign geopolitical risk. Fiscal accommodation is a basis for the economy to improve, political polarization to moderate, and Congress’s approval rating to continue to normalize. Biden’s infrastructure bill still has a subjective 80% chance of passage, despite bipartisan talks faltering and his own caucus growing restive. The price tag is still around $1-$1.5 trillion. Senate passage will mark peak US stimulus for this cycle. Close long consumer staples for a gain of 6%. Cut losses on long materials/tech. Close our fiscal advantage trade relative to the NASDAQ. Feature Bipartisanship is not dead in the 117th Congress, though a bipartisan deal on infrastructure may not come together. Investors should still expect Congress to pass the president’s signature legislative proposal, the American Jobs Plan. Our subjective odds remain 80% with high conviction. The bill’s price tag is still ranging from $1-to-$1.5 trillion in deficit spending this year, or 4.4%-6.7% of GDP – i.e. not a number that financial markets can ignore. A budget resolution is being drafted with a rough headline value of $1.5 trillion. Financial markets are experiencing an inevitable period of doubts over whether the bill will actually pass. In the short run investors should stay invested in infrastructure plays, cyclical equity sectors, and value stocks. However, market dynamics are shifting and there is a basis for upgrading the tech and health sectors. The Senate’s passage of Biden’s infrastructure bill, in whatever form, will mark the peak of US fiscal stimulus for this cycle. Meanwhile our theme of bipartisan structural reform is apparent in the Senate’s passage of the Innovation and Competition Act on June 8 (Chart 1). This bill marks a rare bipartisan achievement in Congress and a sea change in American policymaking. The sea change is the US’s need to revive industrial policy in order to compete with adversaries abroad – a mission that the political establishment supports after being snapped out of its slumber by President Trump’s populist rebellion. In this report we take a look at the domestic consequences of this bill. We leave the international consequences to our sister Geopolitical Strategy service. Chart 1Newsflash: Bipartisan Bill Passes Senate Via Regular Order!
A Bipartisan Congress?
A Bipartisan Congress?
We also look at the surprising recovery in Congress’s popular approval rating. While the US remains at “peak polarization” from a historic point of view, there is a cyclical drop in polarization after the quadruple crisis of 2020 (pandemic, recession, social unrest, contested election) (Chart 2). This cyclical drop may well become a secular decline over the coming decade, as fiscal accommodation at home and geopolitical risk abroad will generate domestic policy consensus on the topics of trade, manufacturing, industry, and technology. This trend will support Congress’s approval rating. Chart 2Polarization Subsides From Crisis Peaks
Polarization Subsides From Crisis Peaks
Polarization Subsides From Crisis Peaks
While Congress will never be loved, it will not be as hated in the coming decade as the past decade. The reason is that Congress is taking a more active role in the economy. This is positive for markets in the short run but adds policy uncertainty over the long run. The Return Of Industrial Policy The US Innovation and Competition Act (USICA) is the outcome of a crisis in the American political system two decades in the making. The hyper-globalization of the Bill Clinton presidency, combined with the profligate economic and foreign policies of the George W. Bush presidency, led to the Great Recession. While the US was distracted with foreign wars and financial crisis, China emerged as a challenger to the US’s strategic dominance (Russia also revived and undermined US stability). The Obama administration began taking tougher action on China in 2015 but by then it was too late to accomplish much. The sluggish recovery and loss of national status triggered a populist rebellion in the form of the Trump administration, which provoked an even greater backlash from the political establishment in 2020. The Republicans imposed fiscal austerity, took power, then abandoned austerity and declared a trade war on China. The Democrats took back power, abandoned austerity, and are continuing the trade war. Now the two parties agree on the need to increase government support for the economy (infrastructure, industrial policy, protectionism) and to redirect foreign policy to confront major powers like China and Russia (as opposed to wasteful forever wars in the Middle East and South Asia). Public opinion has been coalescing around these twin goals since 2008 and the Biden administration so far can be said to represent a kind of synthesis of the Obama and Trump administrations. Even more powerful is the formation of a new consensus in Congress, which is the “first branch” of the US government and represents popular attitudes. Congress has always been more nationalist and more protectionist in its leanings than the executive and judicial branches, which represent policy elites and technocrats.1 While Congress is fickle when it comes to passing fancies of the day, it can be incredibly stubborn when it comes to a nationwide, once-in-a-generation popular consensus. Moreover China does not present a fleeting challenge like Iraq or Al Qaeda. It is more like the Soviet Union and will motivate a congressional consensus and policy consensus for decades. Great power competition will work against US political polarization. A Productivity Mini-Boom The USICA consists of about $115 billion in federal research and development funding, $52 billion in funding for the US semiconductor industry, and $10 billion for regional tech hubs. Funding will flow to the National Science Foundation, NASA, the Department of Energy, and the Defense Advanced Research Projects Agency (DARPA), among others. There are also specific measures to counter China (including intellectual property protections) as well as a regulatory overhaul to codify “Buy America” provisions and require that materials used in federally funded projects are produced in the United States (Table 1). Table 1US Senate Passes Bipartisan ‘Innovation And Competition Act’ To Counter China
A Bipartisan Congress?
A Bipartisan Congress?
In research and development, the USICA formalizes the key technologies that the federal government should focus on and fund. These include: AI, machine learning, and autonomy High performance computing Quantum science and technology Natural and anthropogenic disaster prevention and mitigation Advanced communication technology Biotech, medical tech, genomics, and synthetic biology Data storage and cybersecurity Advanced energy, industrial efficiency, batteries, nuclear energy Advanced material science The $81 billion allocated to the National Science Foundation, covering fiscal 2022-26, will be allocated as shown in Table 2. The Department of Energy will focus on energy-related supply chain issues within the key technological areas of focus. Table 2NSF Gets Additional Dole
A Bipartisan Congress?
A Bipartisan Congress?
Private research and development amount to more than twice the R&D spending of the federal government (Chart 3). Higher spending will augment private R&D, rather than substitute for it. It will likely boost US productivity, which has been in the doldrums over the past few years. Chart 3A Boost To R&D Spending
A Boost To R&D Spending
A Boost To R&D Spending
While it is speculative to say whether the revival of industrial policy will cause productivity to break out of its long-term structural decline, a mini-boom seems warranted, especially when considering that foreign competition will remain a constant impetus (Chart 4). There is ample pork-barrel spending and plenty of potential for boondoggles, as will always be the case with fiscal spending splurges. But a rise in productivity will have a greater macro impact. Chart 4US Productivity Boom, Or At Least Mini-Boom
US Productivity Boom, Or At Least Mini-Boom
US Productivity Boom, Or At Least Mini-Boom
Another aspect of the bill consists of funding for regional technology hubs. The office of Economic Development Administration will oversee three tech hubs in each region covered by the EDA’s regional office. These must be areas that are not already tech centers. No less than one third of the funding will go to small and rural communities and at least one consortium must be headquartered in a low-population state. The info-tech revolution and de-industrialization have created a problem of regional inequality, which these measures attempt to address. The USICA also funds the incentives for the domestic semiconductor industry first outlined in the national defense appropriations last year. The CHIPS Act, for example, helps incentivize investment in facilities and equipment for computer chip fabrication, assembly, testing, advanced packaging, and R&D. This funding was subject to the availability of appropriations but is now authorized under the USICA to the tune of $52 billion. Substantial breakthroughs in the 1980s-90s, in software and other areas, followed on much smaller public investments in education and research.2 The semiconductor industry is capital-intensive. For every one dollar in sales, 15 cents of capital expenditures are needed, compared to just seven cents in the tech sector as a whole and six cents across companies in the S&P 500 index. The capex requirement for the energy sector grew from six cents in 2004 to 17 cents in 2015, almost tripling in a decade due to the capital intensity of the shale boom (Chart 5). Thus lowering the cost of investment for the semiconductor companies will have a major positive impact. Quarterly capex for the chip makers stands at around $25 billion. An infusion of $52 billion in government incentives over five years amounts to $2.6 billion per quarter or roughly 10% of current capex. Chart 5A Boon For US Semi Capex
A Boon For US Semi Capex
A Boon For US Semi Capex
Finally, the USICA consists of notable “Buy America” or protectionist measures. The bill holds that public works must be produced by American workers and funding should not be used to reward companies that “offshore” their operations, especially to countries that do not share US regulatory standards on workers, workplace safety, and the environment. The USICA gives a big sop to US manufacturing: all manufactured goods purchased with the bill’s funding must be made in the USA or have at least 55% of their total components sourced in the country. All iron and steel manufacturing processes, from melting through coatings, must occur in the United States. Buy America provisions will stir up some quarrels with US allies and trading partners but ultimately the US will need to increase imports as a result of the USICA. Private non-residential investment in the US moves closely with import growth, whereas US government investment has less of a relationship with imports (Chart 6). Chart 6Supply Constraints Amid US Fiscal Stimulus
Supply Constraints Amid US Fiscal Stimulus
Supply Constraints Amid US Fiscal Stimulus
The Buy American provision will put new pressures on a supply chain that is already strained by the pandemic and the Trump administration’s tariffs. Industrial production is at an all-time high and so are producer prices, which means that producers have high pricing power. This is beneficial for the industrial and materials sectors over the medium term, even if the short-term inflation scare proves overdone (Chart 7). Buy American provisions will even improve the pricing power of the machinery sub-sector, as contractors will be forced to buy American-made machinery. The bottom line is that the Biden administration has coopted the Trump administration’s agenda on China, trade, and manufacturing, which itself was an attempt to steal thunder from the Obama administration. However, Biden and the Democrats bring a defensive and domestic-oriented approach rather than an offensive and foreign-oriented approach. Tariffs and investment restrictions will stay on China but they are not being increased or tightened (at least not yet). Instead the emphasis falls on fiscal largesse for US industry and manufacturing as well as research and development, promotion of STEM education (science, technology, education, and mathematics), and semiconductor subsidies. Chart 7Sustained Proactive Fiscal Policy Is Inflationary
Sustained Proactive Fiscal Policy Is Inflationary
Sustained Proactive Fiscal Policy Is Inflationary
The goal is to increase the pace of US innovation, notwithstanding the fact that countries will continue to borrow, spy, and steal from each other. The international context of competition – and the widespread resort to debt monetization – will have a positive impact on productivity over the long run. But the protectionist regulations will combine with US supply constraints to put upward pressure on material and industrial prices over the short and medium run. Will Americans Hate Congress Less? A bipartisan industrial agenda in Congress raises the question of whether a bipartisan infrastructure deal can also be achieved. We remain optimistic, though the talks are currently wobbling. Biden’s approval among Democrats is falling as the Democratic caucus abandons his attempt to forge a bipartisan infrastructure deal and presses for a Democrat-only reconciliation bill. However, his overall approval rating is not likely to settle at a lower level than that of Presidents Obama and Trump. His approval rating on handling the economy has probably already hit its floor (Chart 8). He still has the ability to pass a signature piece of legislation, according to our Political Capital Index (Appendix). Chart 8Biden Struggles With Democratic Party
A Bipartisan Congress?
A Bipartisan Congress?
Chart 9US Public Approving Of Congress?!?
A Bipartisan Congress?
A Bipartisan Congress?
The sharp increase in public approval for Congress is another signal of Biden’s political capital (Chart 9). About 36% of Americans now say they approve of the job Congress is doing while 61% disapprove. This is not very good in absolute terms but relative to Congress’s history it is notable. The sharp uptick is due in large part to the expanded unemployment benefits, stimulus checks, and other social subsidies doled out during the pandemic. A fleeting spike in approval also occurred around the GFC-era stimulus, only to give way to new lows. Yet there is a deeper source. Approval of Congress has risen continually since the bruising debt ceiling standoffs and government shutdowns of 2010-14, when the Obama administration squared off against a Republican Congress in the context of a sluggish economy (Chart 10). With Gallup polling data going back to the 1970s, the big picture is that Americans lost faith in Congress during the stagflationary 1970s, the first Gulf War and recession of the early 1990s, and especially the Iraq/Afghanistan wars and Great Recession. It is now slowly recovering to normally low (rather than abnormally low) levels. Chart 10A Longer View Of Public Attitudes Toward Congress
A Bipartisan Congress?
A Bipartisan Congress?
Aside from fleeting rallies around the flag, such as after the September 11, 2001 terrorist attacks, public approval of Congress rarely rises above 50%. The reasons are obvious: Congress is an institution in which power-hungry politicians engage in endless and petty quarrels over the minutiae of public policy in full view of the world. Its job is inherently unpopular.3 But as partisanship and polarization have increased dramatically since the 1980s, Congress has lost effectiveness at its primary function of forging compromises and passing laws. The public differs on what laws should be passed but it generally disapproves of the lack of compromise (Chart 11). A clear uptrend in congressional approval has emerged since the near-recession of 2015. The one overriding change in national policy since that time has been the activation of the fiscal lever. Trump unleashed a bipartisan spending binge as well as tax cuts. COVID-19 encouraged a Trump-Biden spending binge. Now Biden’s measures are adding to this anti-austerity blowout. While voters rewarded Congress for balancing the budget in the 1990s, the Great Recession marked a secular change. Disapproval rose with the process of fiscal tightening from 2010-14 (budget sequestration) and fell as the fiscal deficit has widened since then (Chart 12). Chart 11Public Approves Of Lawmakers Who … Make Laws
A Bipartisan Congress?
A Bipartisan Congress?
Chart 12Public Approves Of Spendthrift Congress?
A Bipartisan Congress?
A Bipartisan Congress?
Voters do not approve of Congress based on wonky policy views. Their approval, like their approval of the president, tracks with the state of the nation. There is a fairly close correlation between the two approval ratings. A major deviation emerged in 2010-14 when President Obama partially restored public faith in the presidency (albeit with historically low approval ratings) while Congress sank to even lower lows than it witnessed during the Iraq war on the back of Republican obstructionism and Obama’s second-term legislative failures (Chart 13). The current trend is for presidential approval to remain flat at its post-2010 levels while Congress regains some support. Chart 13Approval Of Congress Tracks Approval Of President
A Bipartisan Congress?
A Bipartisan Congress?
Congressional infighting will resume after Biden passes the American Jobs Plan. His American Families Plan is much less likely to pass. Opposition Republicans have a subjective 75% chance of retaking the House of Representatives in 2022, which would result in gridlock. However, congressional approval is normalizing from the depths of the disinflationary 2010s to around the 30%-40% range. It will probably continue tracking presidential approval. And history shows that presidential approval ultimately hinges on peace and prosperity as opposed to war, recession, and scandal (Chart 14). This will dictate the direction under the Biden administration and beyond. Chart 14Approval Of President Tracks ‘Peace And Prosperity’
A Bipartisan Congress?
A Bipartisan Congress?
A critical factor is whether polarization will continue to subside. High polarization makes it so that voters identify the passage or failure of government policy exclusively with the ruling party; this incentivizes the opposition to obstruct.4 Lower polarization enables bipartisan deals and thus forces the two parties to share the praise and the blame of new policies. Compromise and lawmaking increase congressional approval; higher congressional approval increases the odds of compromise. The current legislative agenda reveals several areas of emerging consensus, not only on industrial policy and manufacturing but also on anti-trust law and infrastructure (Table 3). Table 3Pending Legislation In Congress Under Biden
A Bipartisan Congress?
A Bipartisan Congress?
The Biden administration may only get one or two more major bipartisan legislative accomplishments. Polarization is still at historically elevated levels. In the next two-to-five years polarization could easily re-escalate, given the ongoing power struggle between the two dominant parties and the grievances over the 2020 election. However, over the next five-to-ten years, polarization should settle at levels beneath the record highs witnessed in 2020 due to foreign competition and fiscal accommodation. The USICA shows how this trend could take shape. Investment Takeaways The macro implications of Biden’s political capital and Congress’s rising approval rating consist of trends and themes that we have emphasized before: the return of Big Government; populist monetary and fiscal policy; protectionist industrial policy; nation building at home; and geopolitical struggle abroad. There is no direct market impact of a less unpopular Congress – the implication can be positive or negative depending on the policies, assets, and time frames in question. For example, the congressional effect, in which markets rally while Congress is at recess, is debatable.5 Congress is least active in January, July, August, and December and yet this recess schedule manifestly has no consistent impact on well-known equity market calendar effects (Chart 15). Chart 15Calendar Effects But No Congressional Calendar Effect
A Bipartisan Congress?
A Bipartisan Congress?
Markets under congressional gridlock often outperform markets under single-party sweeps but the difference is small and debatable (Chart 16). Markets dislike both effective congresses that pursue market-unfriendly policies and ineffective congresses that would be pursuing market-friendly policies. The pandemic and recession required an effective congress, bipartisan stimulus resulted, and approval has gone up. Sustaining this approval will require avoiding both deflationary and stagflationary environments in the coming years, as well as gratuitous wars and massive scandals. That will be difficult. Chart 16Sweeps Don’t Always Underperform Gridlock
A Bipartisan Congress?
A Bipartisan Congress?
Still, a floor in congressional approval has probably been established over the past decade as the US political establishment has rediscovered proactive fiscal policy at home and nationalism abroad. These two key trends create cross-currents for the dollar. The macroeconomic backdrop for the dollar is bearish but the political and geopolitical backdrop is bullish. At present the dollar stands at a critical juncture. Any increase in global policy uncertainty and geopolitical risk abroad should push the dollar up (Chart 17). Given the dollar-bearish BCA House View, we are therefore neutral and will revisit the issue in our upcoming third quarter outlook report. We are adjusting our equity sector risk matrix. Our new US Equity Strategist, Irene Tunkel, argues convincingly that investors should continue favoring cyclicals but also take a more optimistic outlook on the tech and health sectors. We agree on health in particular since the Biden administration’s policy risks have largely been passed up. We are closing our long materials / short tech trade for a loss of 8.2% and our long fiscal advantage / NASDAQ trade for a loss of 1.3%. We will also close our long consumer staples trade for a gain of 6.5%. Chart 17Relative Policy Uncertainty Rising, Greenback On Edge
Relative Policy Uncertainty Rising, Greenback On Edge
Relative Policy Uncertainty Rising, Greenback On Edge
Matt Gertken Vice President Geopolitical Strategy mattg@bcaresearch.com Jesse Anak Kuri Associate Editor jesse.Kuri@bcaresearch.com Appendix Table A1USPS Trade Table
A Bipartisan Congress?
A Bipartisan Congress?
Table A2Political Risk Matrix
A Bipartisan Congress?
A Bipartisan Congress?
Table A3Political Capital Index
A Bipartisan Congress?
A Bipartisan Congress?
Table A4APolitical Capital: White House And Congress
A Bipartisan Congress?
A Bipartisan Congress?
Table A4BPolitical Capital: Household And Business Sentiment
A Bipartisan Congress?
A Bipartisan Congress?
Table A4CPolitical Capital: The Economy And Markets
A Bipartisan Congress?
A Bipartisan Congress?
Footnotes 1 See David R. Mayhew, “Is Congress ‘The Broken Branch?,’” Boston University Law Review 89 (2009), 357-69, bu.edu. 2 See Danny Crichton, Chris Miller, and Jordan Schneider, “Labs Over Fabs: How The U.S. Should Invest In The Future Of Semiconductors,” Foreign Policy Research Institute, March 2021, www.fpri.org. 3 See John R. Hibbing and Christopher W. Larimer, “The American Public’s View Of Congress,” Faculty Publications: Political Science 27 (2008), digitalcommons.unl.edu/poliscifacpub/27. 4 See David R. Jones, “Partisan Polarization and the Effect of Congressional Performance Evaluations on Party Brands and American Elections,” Political Research Quarterly 68:4 (2015), 785-801, jstor.org. See also Jones, “Declining Trust In Congress: Effects of Polarization and Consequences for Democracy,” The Forum 13:3 (2015), degruyter.com. 5 Some market participants and researchers have uncovered a “Congressional effect” in which stock market returns are higher on average on days when Congress is on recess than on days when it is in session.
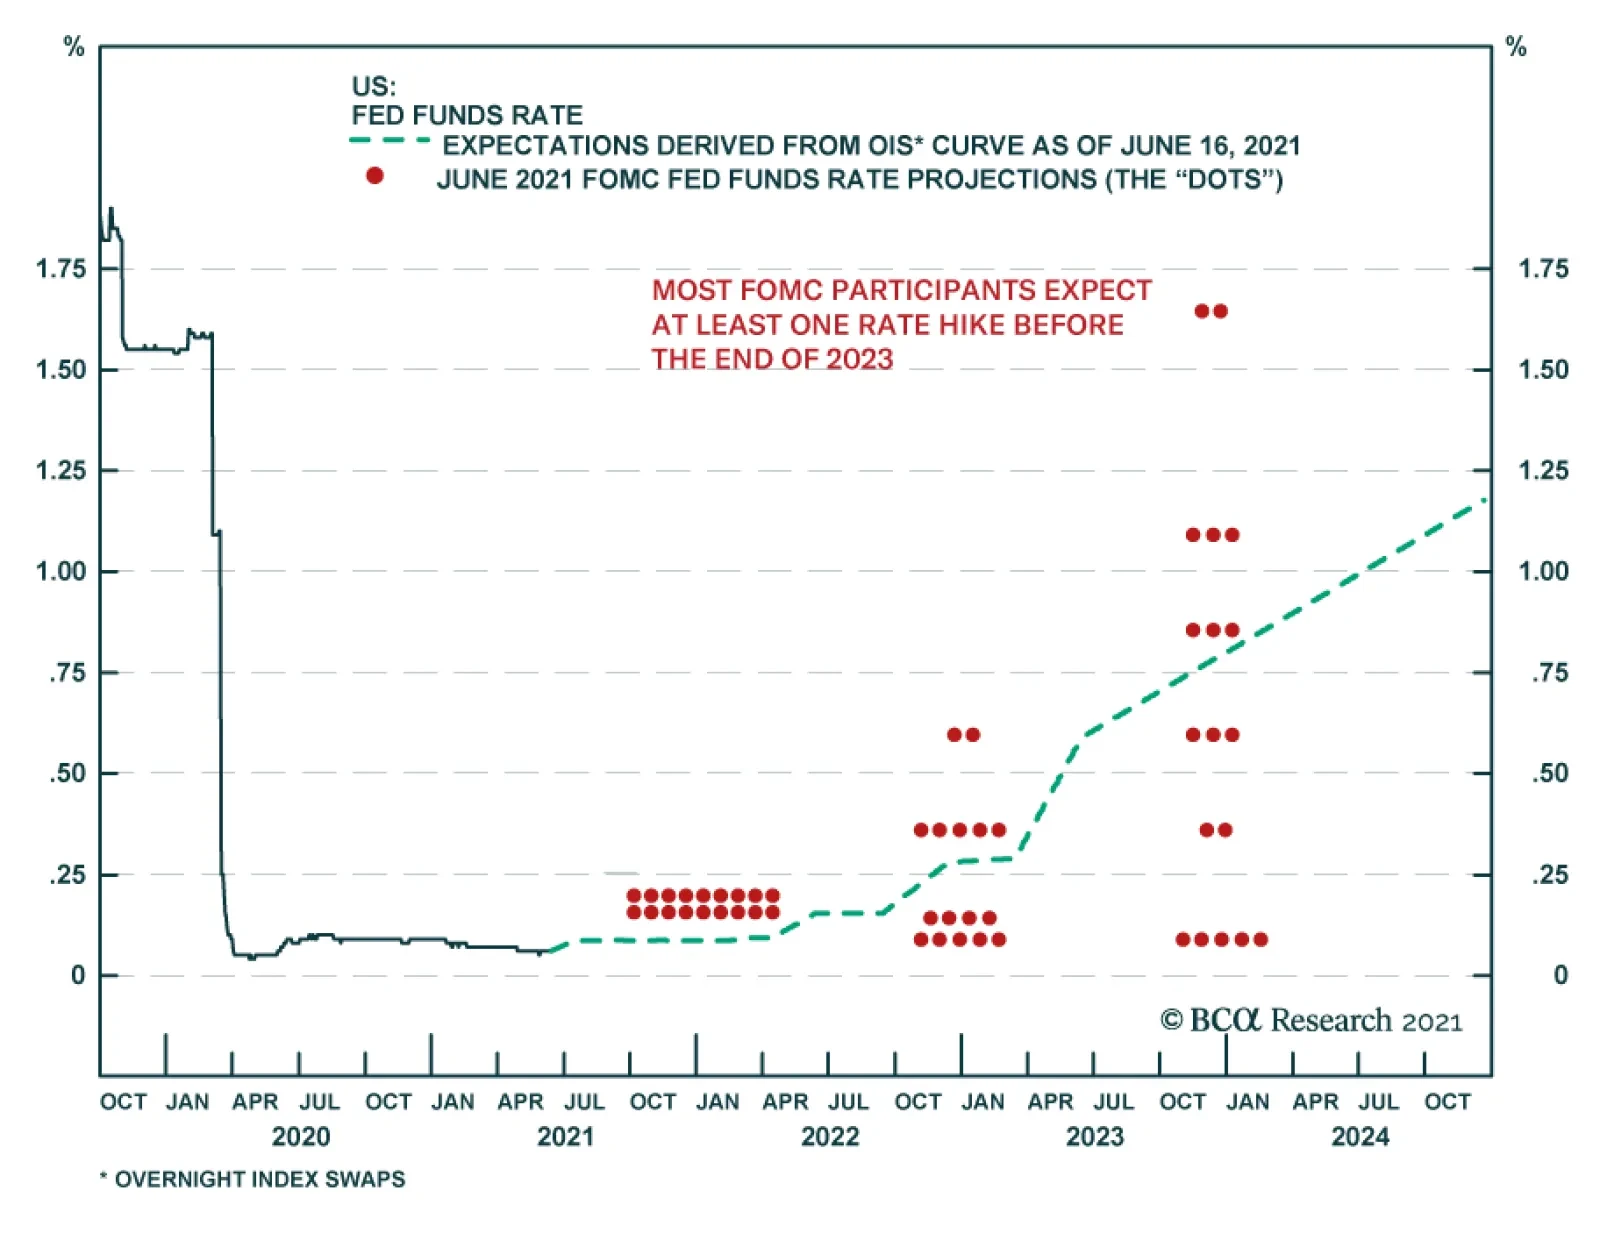
As expected, the Fed left policy unchanged following the conclusion of its meeting on Wednesday. However, the revised economic projections and subsequent press conference reflect an ongoing shift away from the need for ultra-accommodative policy. FOMC…
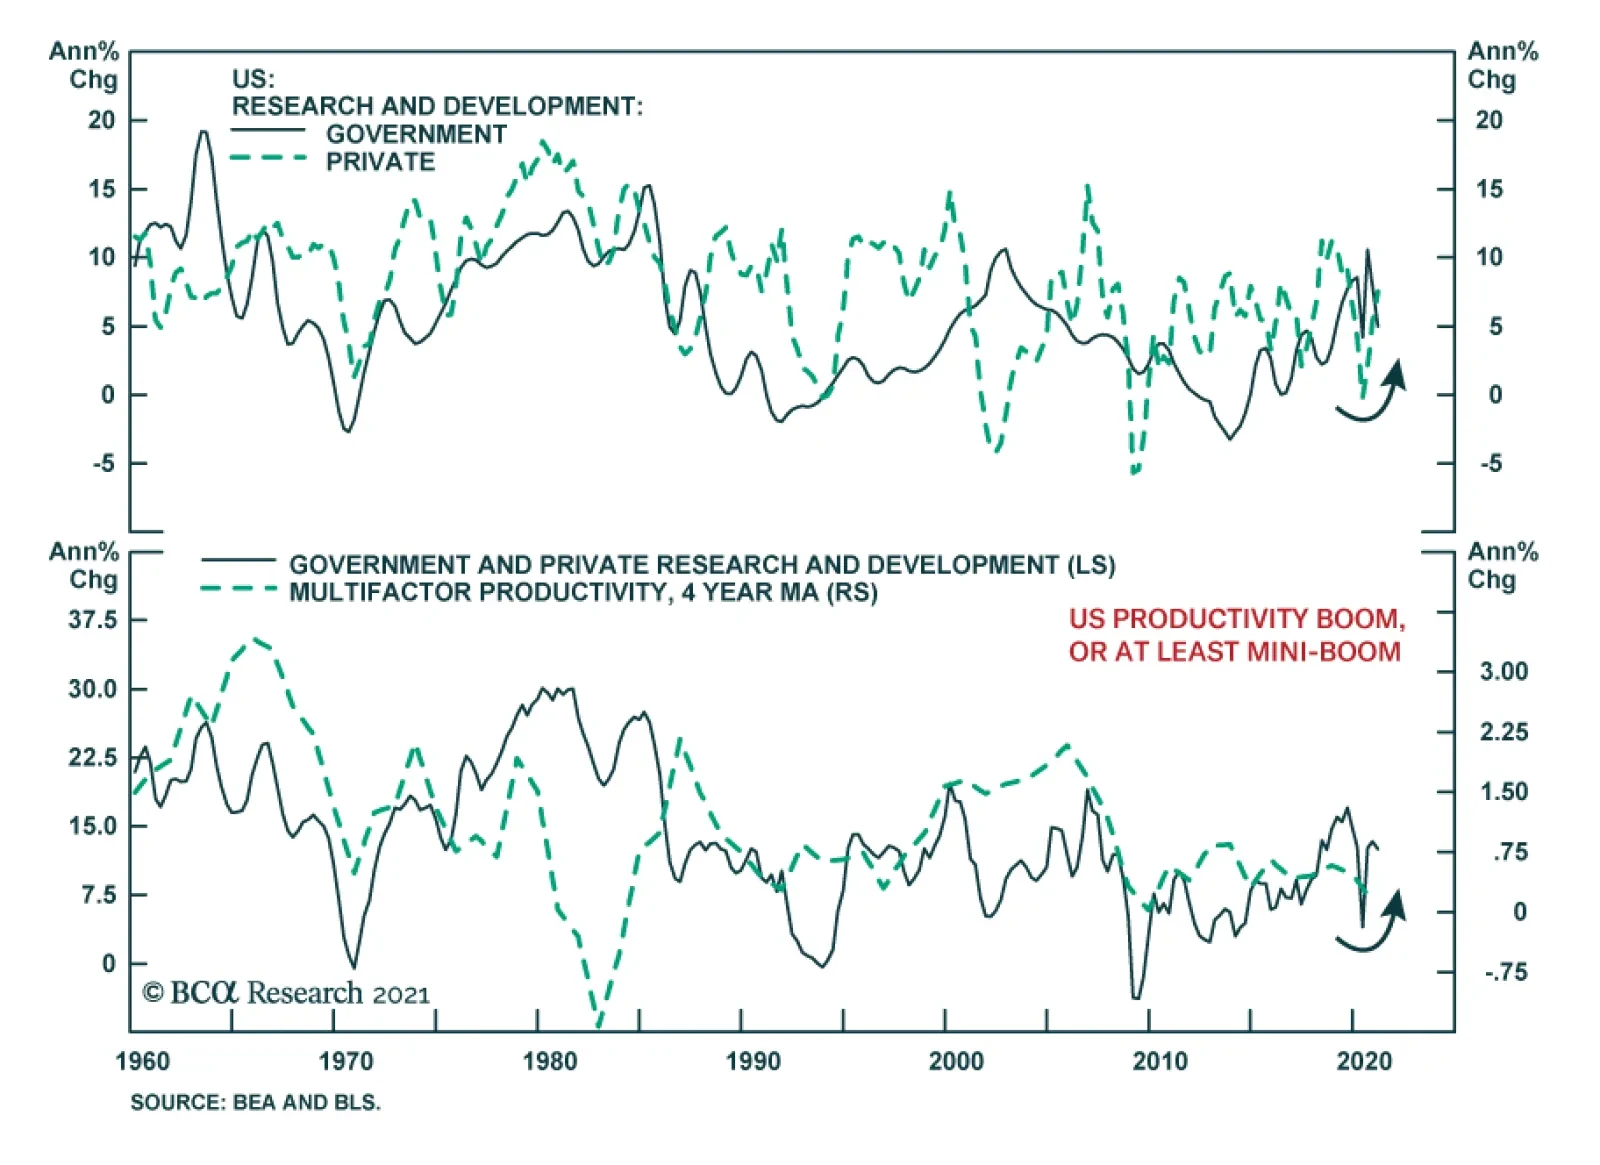
According to BCA Research’s US Political Strategy service, the US Innovation and Competition Act (USICA) will produce a mini-boom in US productivity. The Senate’s passage of the Innovation and Competition Act on June 8 marks a rare bipartisan achievement…
Copper Shortage: Bids Gone Missing?
Copper Shortage: Bids Gone Missing?
The media went on a hype spree last month forecasting copper prices to the tune of $20,000t ($9.07/lb) on the back of EV-driven demand and supply shortages. While they will likely be right at some point over the next 10 years, such bullishness reminded us of the Goldman Sachs’ $200/bbl crude oil forecast back in May of 2008, followed by Gazprom’s $250/bbl number in June of 2008. By February 2009 crude was trading at $30/bbl. Given this anecdotal evidence and our view about the Chinese economic slowdown, on June 1 we recommended investors to buy crude at the expense of copper (proxied by long S&P oil & gas exploration & production / short S&P metals & mining indexes) as a way to capitalize on the DM/China growth differential. Since then, at the time of writing, the crude/copper ratio is up 17%, while our sector-level proxy is up 18.5%. Bottom Line: We reiterate our long S&P oil & gas exploration & production / short S&P metals & mining market neutral trade. For the full rationale behind this trade, please refer to the following Special Report.