United States
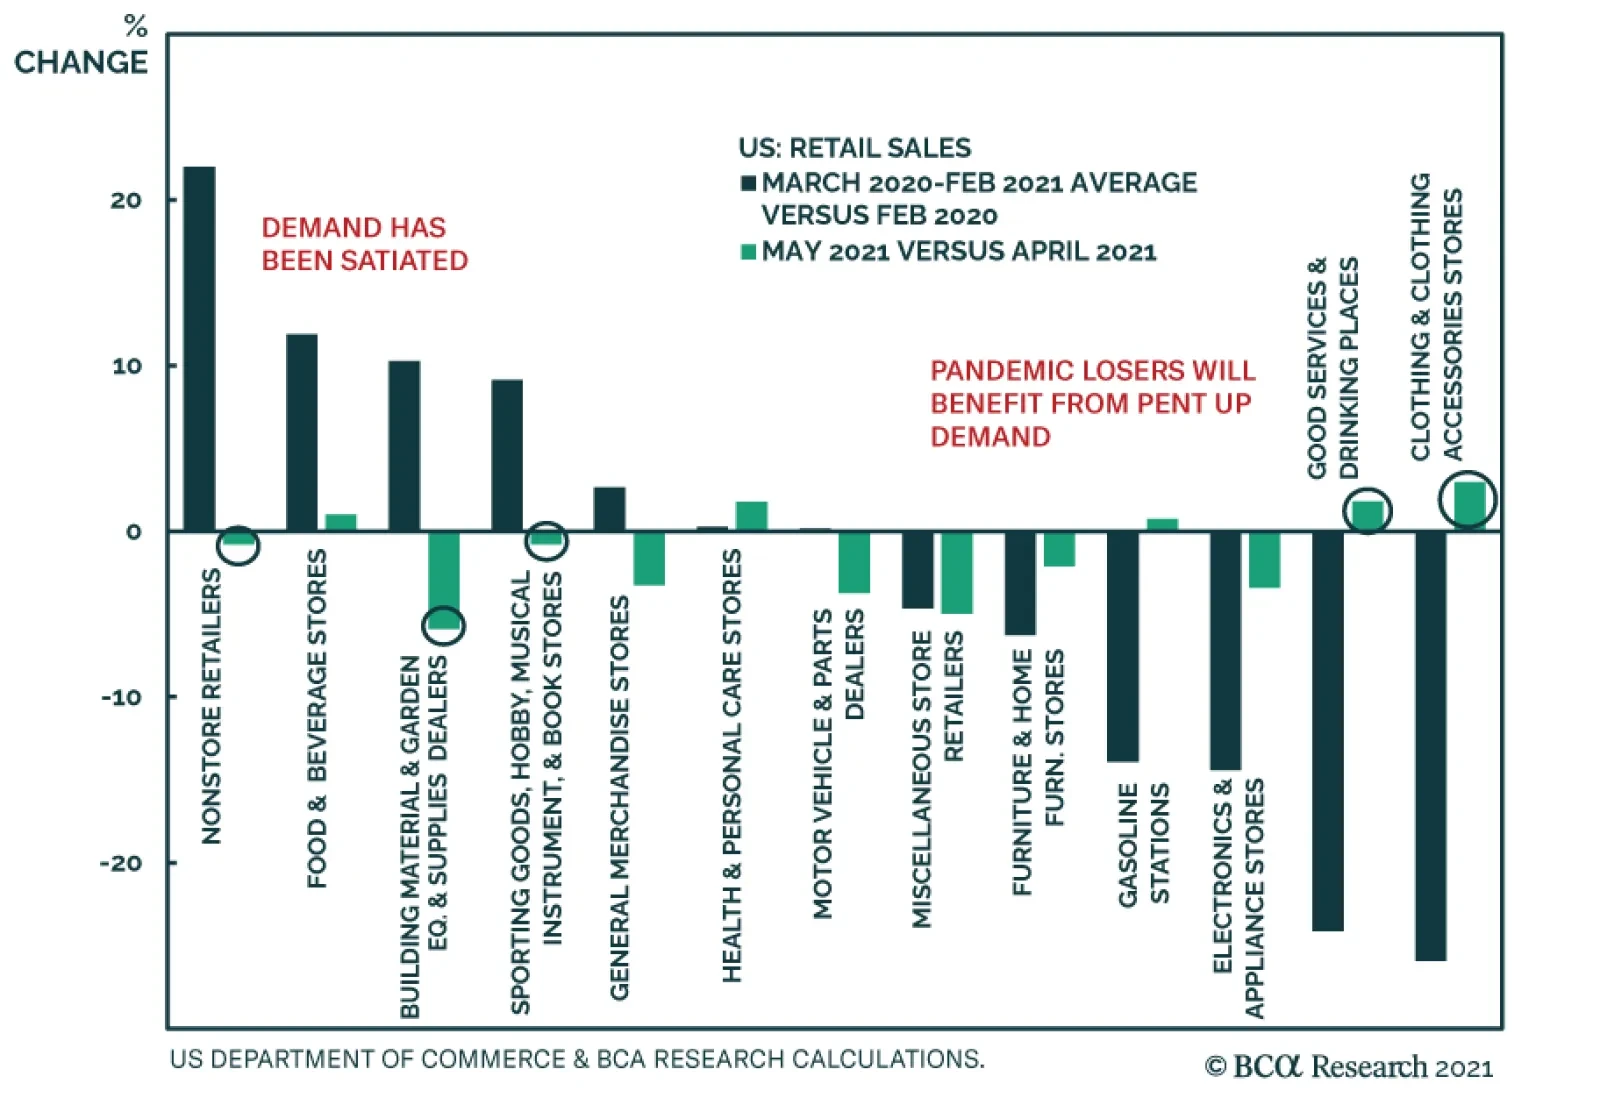
The US retail sales report for May indicates that the stimulus-fueled bounce earlier this year is dissipating. Retail sales fell 1.3% m/m, disappointing expectations of a more muted 0.8% m/m decline. Similarly, control group sales contracted by 0.7% m/m…
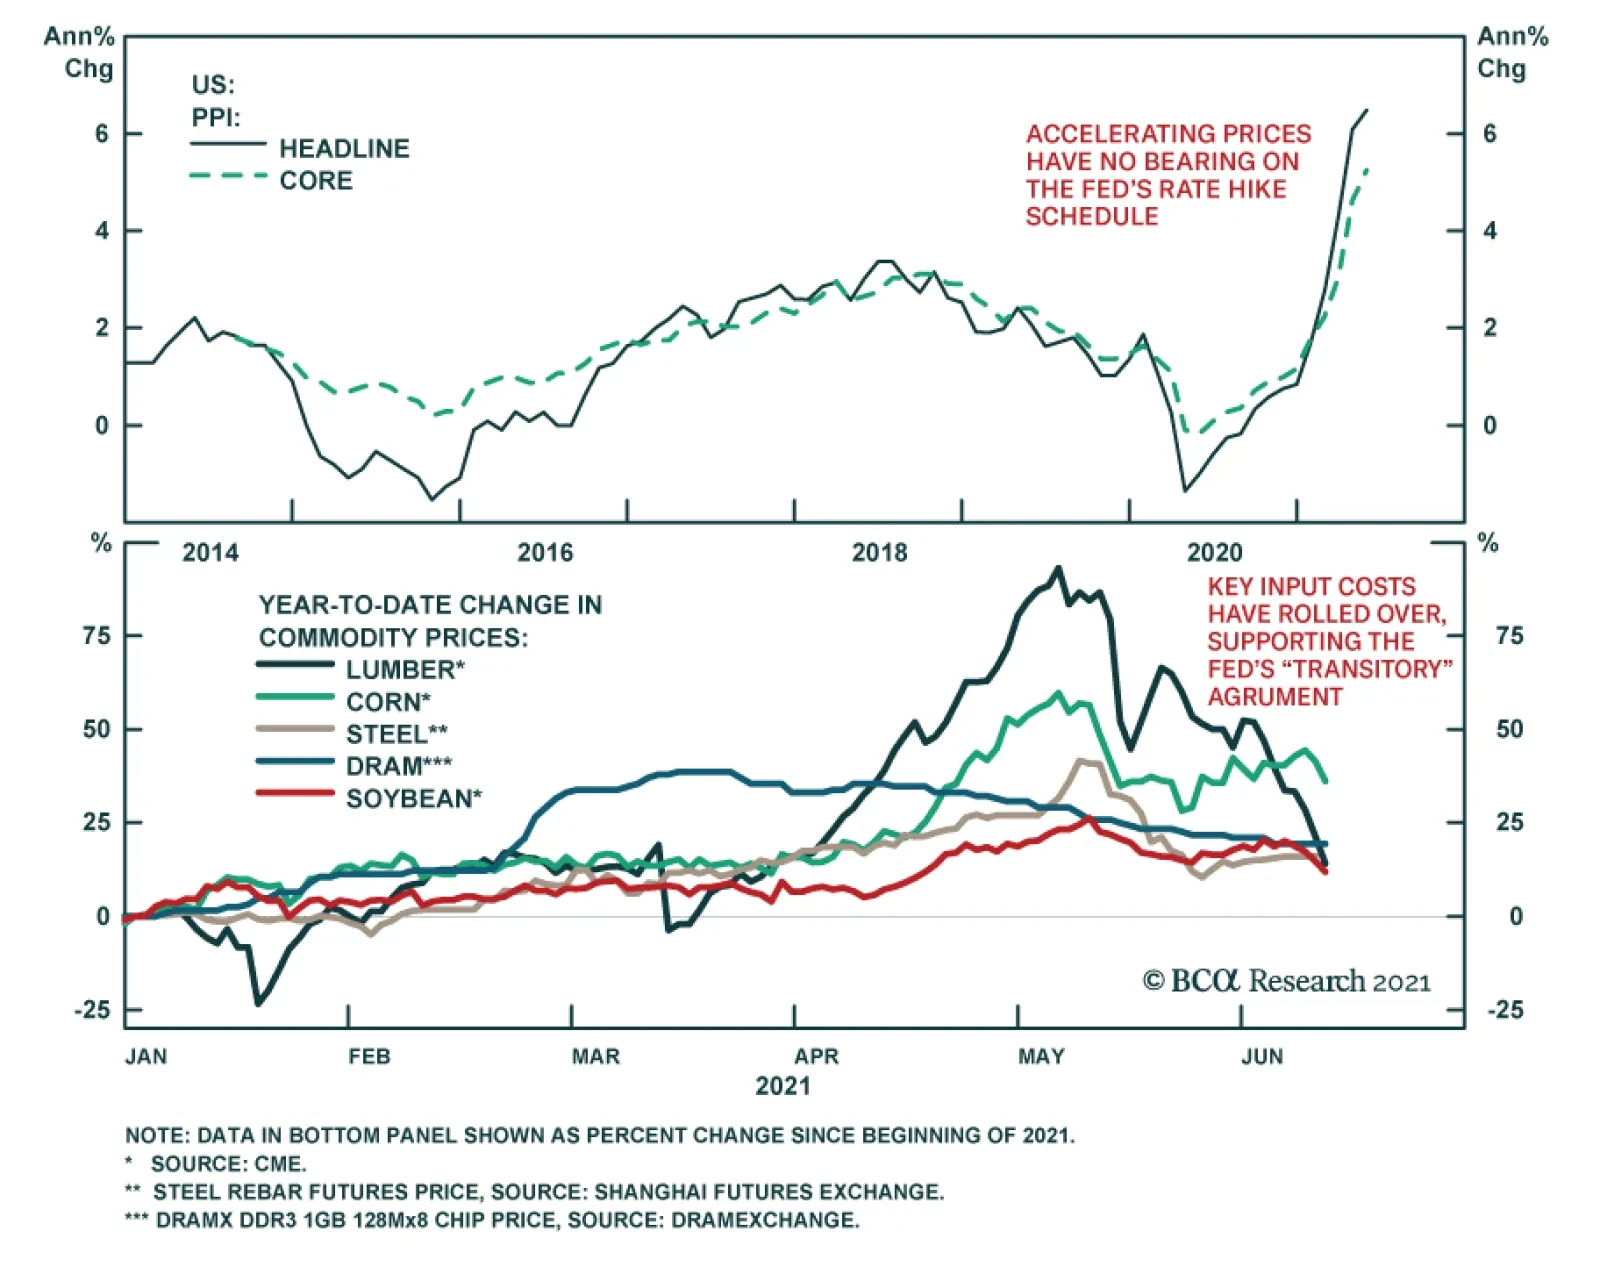
US Treasury yields ended the day unchanged on Tuesday despite the US producer price index (PPI) report, which once again surprised to the upside. The PPI for final demand accelerated to 0.8% m/m in May from 0.6% m/m, exceeding consensus forecasts of a slight…
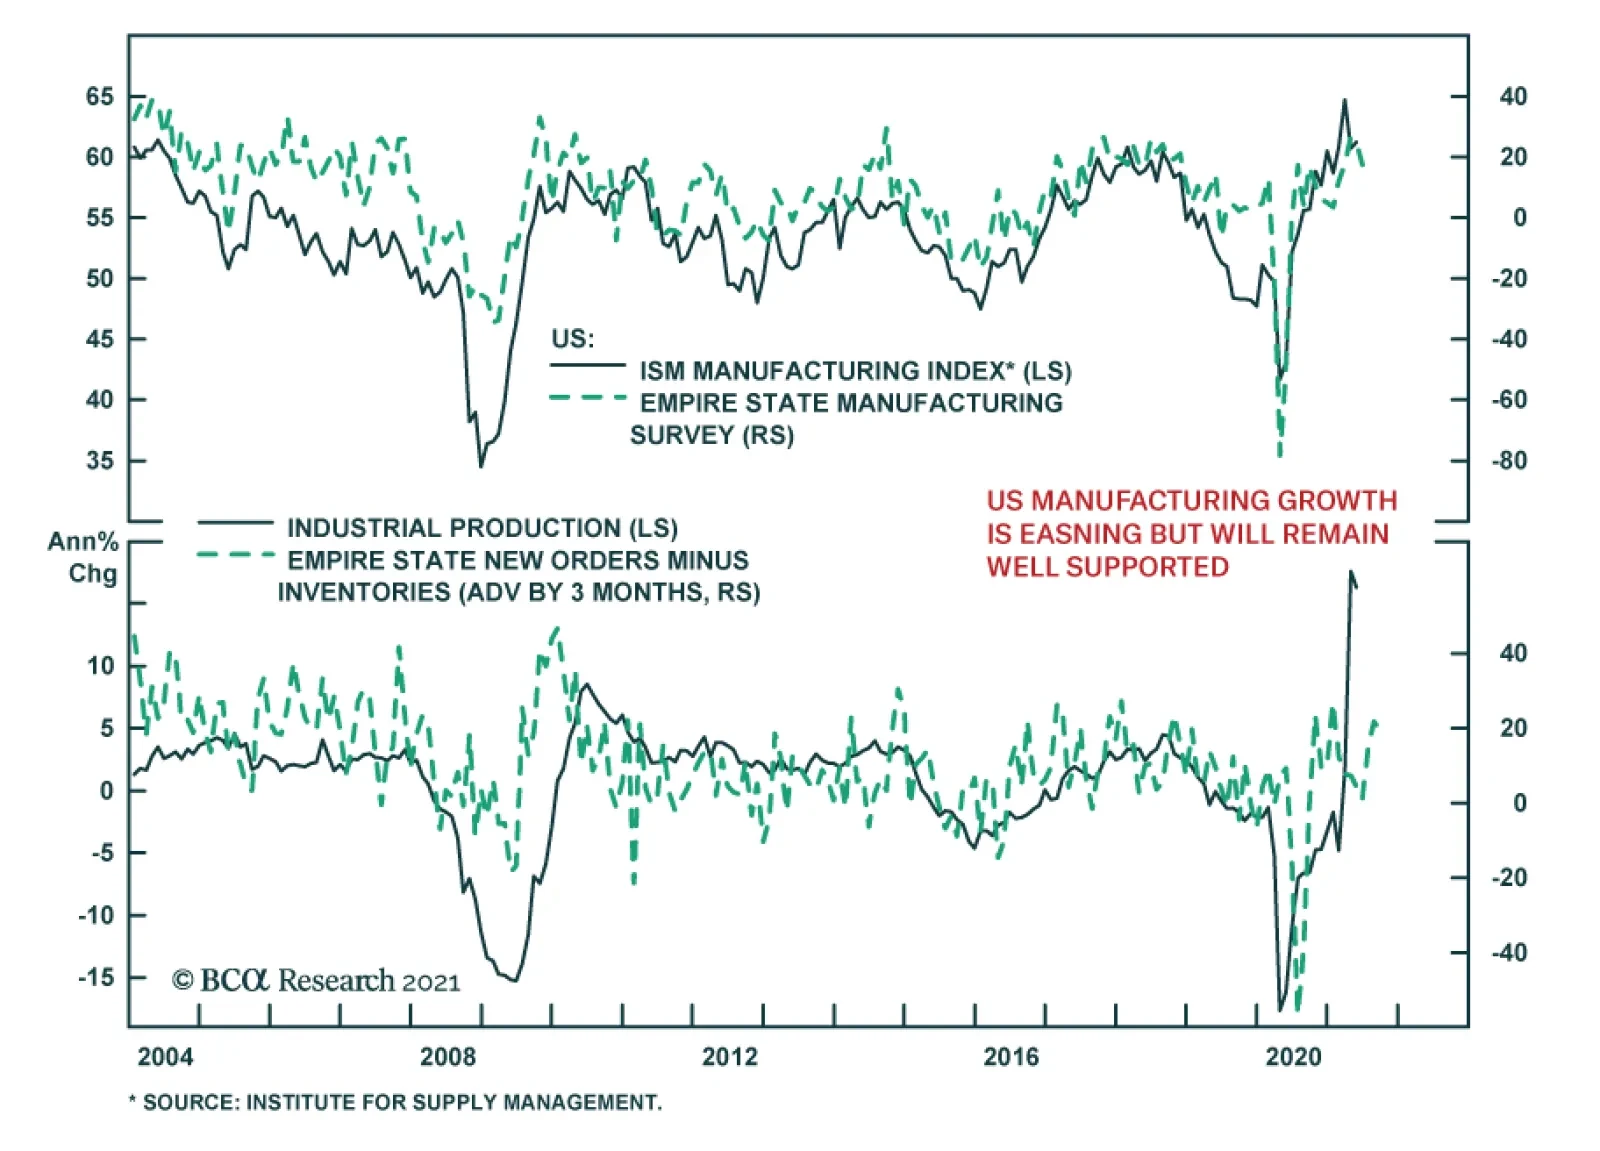
The New York Fed’s Empire Manufacturing Survey is sending a warning about the US economy. Current business conditions – which tracks the ISM manufacturing index – fell nearly 7 points in June on the back of an 8.3 percentage point increase in firms reporting…
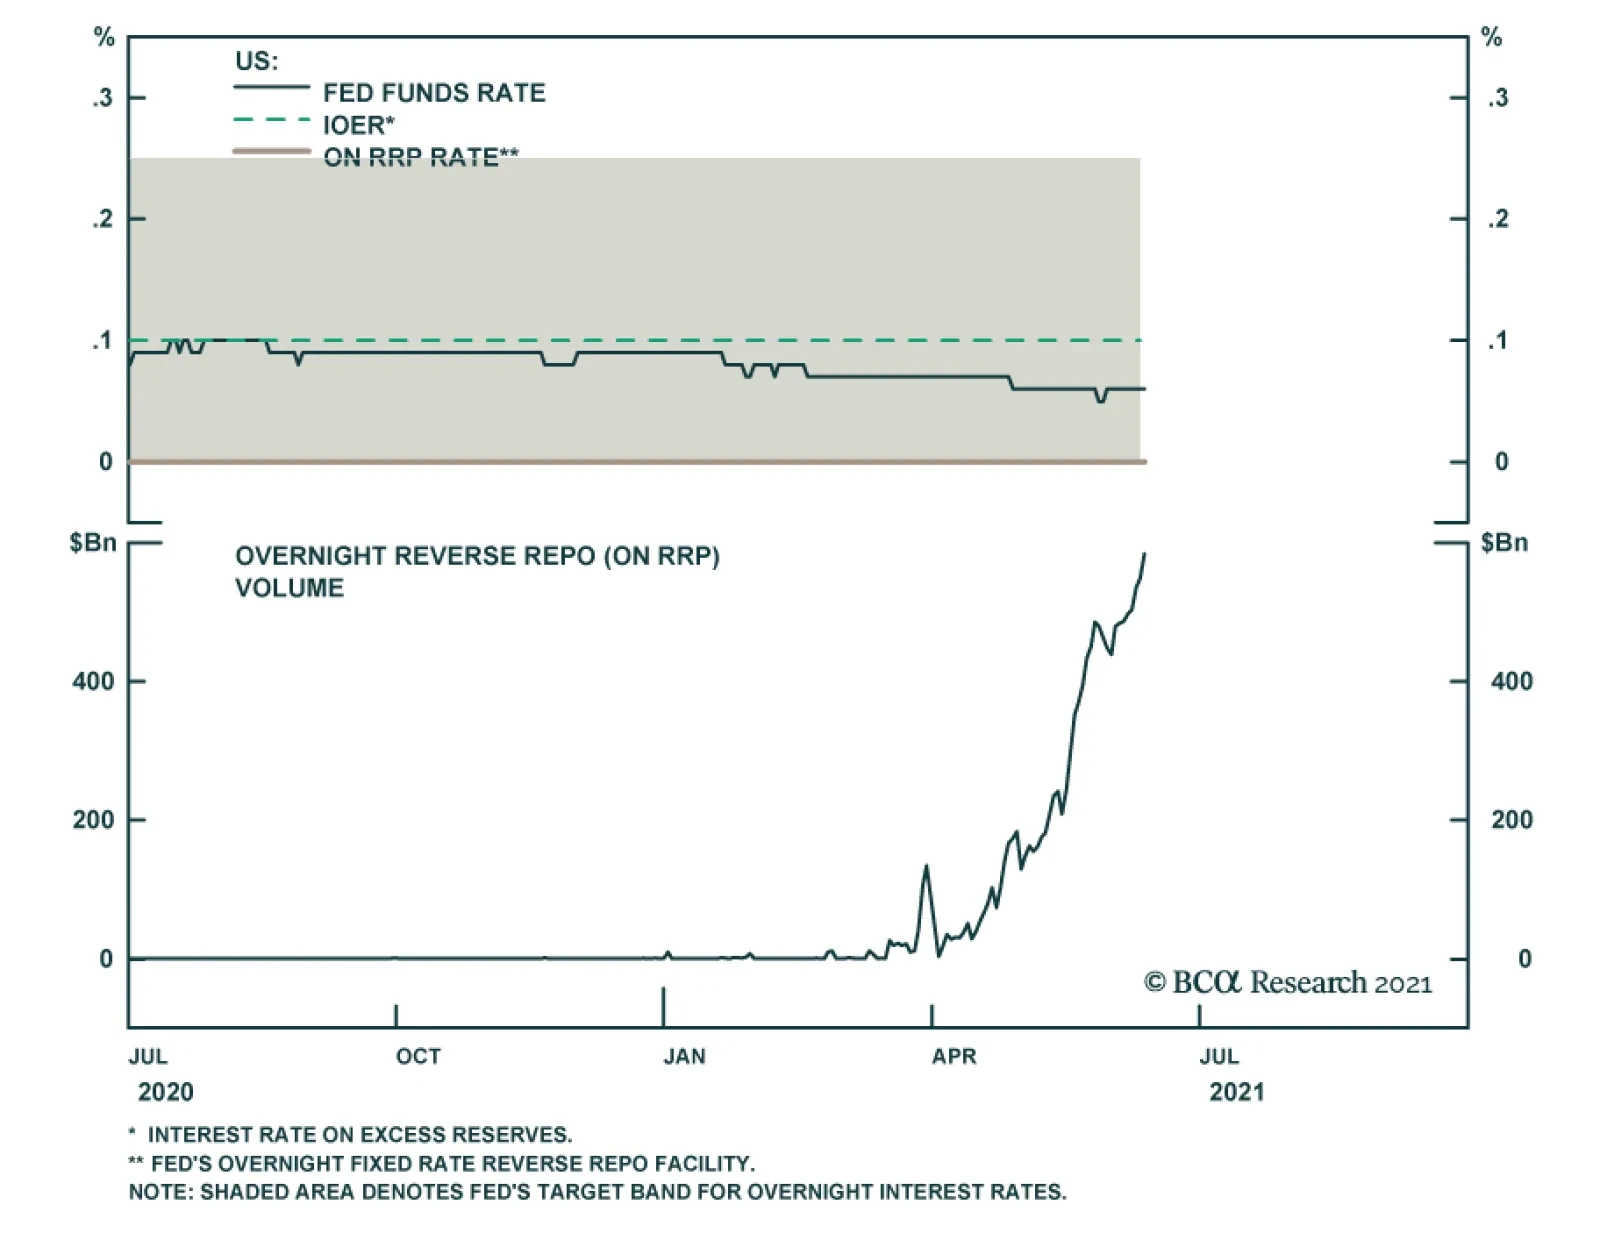
BCA Research’s US Bond Strategy service sees no implications for the Fed’s balance sheet or interest rate policies stemming from the recent uptick in ON RRP usage. The increased take-up of the ON RRP is a sign that the Fed’s operational strategy is working…

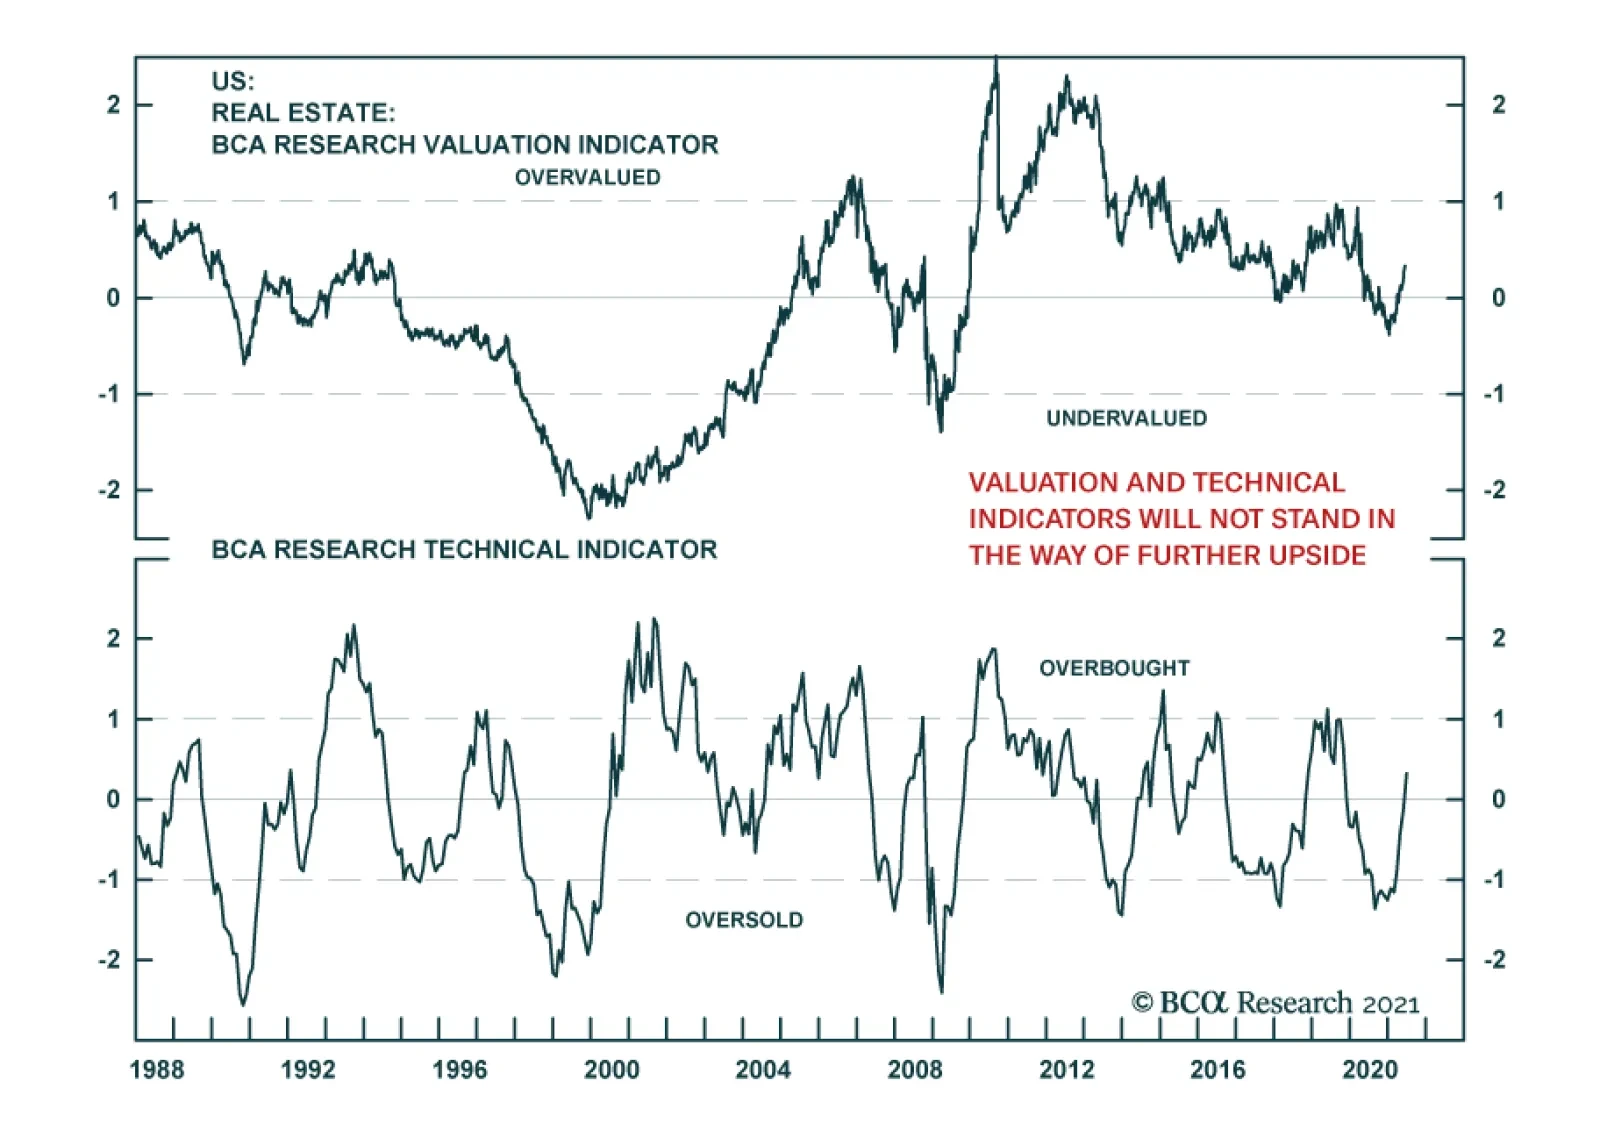
Overweight (High-Conviction) We remain overweight the S&P real estate index both in our cyclical and high-conviction universes, and both positions are currently up 7% since inception. While our initial rationale for putting the trade on was the flip in the correlation between this relative share price ratio and the 10-year US Treasury yield from negative to positive, now there are new catalysts that underpin this GICS1 sector. First, real assets have historically been a good inflation hedge making the S&P real estate index a popular addition to one’s portfolio in the current inflationary regime. Second, given that the market expects some turbulence thanks to the global growth slowdown, investors are adding real estate holdings as a defensive play (Chart 2). Finally, Chart 1 bottom panel shows that the supply-side of the equation is constrained as US commercial construction spending has been lagging. The implication is that in relative terms, the supply of commercial REITs has been contracting, pushing prices higher (relative construction spending shown inverted). Tack on the anecdotes that empty offices are converted into apartment buildings, and empty malls into e-commerce fulfillment centers, and there is plenty of room for growth and improvement in the industry. Bottom Line: We reiterate our cyclical and high-conviction S&P real estate overweight calls. Chart 1
Revisiting Real Estate
Revisiting Real Estate
Chart 2
Revisiting Real Estate
Revisiting Real Estate
Highlights Economy – We think the current hiring logjam will prove to be temporary: Once schools fully re-open for in-person learning in August and September and enhanced unemployment benefits expire, restraints on labor supply should ease. Markets – We expect that employment will rebound quickly enough to support an initial rate hike in 2022, ahead of the bond market’s current expectations: Liftoff expectations will have to be pulled forward if nonfarm payrolls return to their pre-pandemic peak before the end of 2022. Strategy – Remain underweight duration to stay ahead of a repricing of Fed tightening: Rates may continue to consolidate or edge lower in the near term, but we still see them rising over the next twelve months. Feature The state of the labor market is the key uncertainty for US macro observers. Although the headline unemployment rate has come down nine percentage points from its 14.8% peak, retracing nearly 80% of its sudden increase, it overstates the healing that has occurred. 22 million people, or nearly 15% of employees, lost work in March and April 2020. Two-thirds of those jobs have been recovered, but 5% fewer Americans are employed now than at last February’s employment peak. Even if today’s much-reduced shortfall had marked the trough, it would represent a postwar drawdown surpassed only by the Great Recession (Chart 1). Chart 1An Especially Severe Bloodletting
Sizing Up The Labor Market
Sizing Up The Labor Market
The economic implications of a plunge in employment follow from what we like to call the fundamental theorem of macroeconomics: my spending is your income and your spending is my income. The US economy has dodged those implications, thanks to a massive infusion of fiscal stimulus that featured three waves of direct assistance to households, but it will not be able to stand on its own until nonfarm payrolls close in on their previous peak. Financial markets will take some notice of payrolls’ impact on economic fundamentals, but they are mostly concerned about their effect on monetary policy settings. With the Fed’s inflation-related criteria for hiking rates largely met, its full-employment goal is set to take center stage. It is easy to envision a scenario in which bond yields and equity multiples begin taking their cue from payrolls’ ongoing progress. We center our examination of that progress on labor force participation, which is likely to inform the pace of payroll expansion and wage gains. The Incredible Shrinking Work Force Only 61.6% of civilians 16 and over are participating in the labor force, recovering less than half of the pandemic decline from 63.4% to 60.2%. The participation rate has been subject to a structural headwind since 2001 when the baby boomers, born between 1946 and 1964, began exiting their prime working years1 (Chart 2, top panel). Except for a modest decline in the wake of the global financial crisis, however, the labor force kept expanding, even during recessions (Chart 2, bottom panel), thanks to an expanding working-age population. The pandemic decline was large enough to overcome population growth, with the participation rate now at a (pre-pandemic) level it last hit in January 1977, when female prime-age participation was 17-1/2 percentage points lower than it is today. Chart 2Participation Took A Big Hit From The Pandemic
Participation Took A Big Hit From The Pandemic
Participation Took A Big Hit From The Pandemic
Table 1Labor Force Growth Has Been Slowing For A While
Sizing Up The Labor Market
Sizing Up The Labor Market
Labor force growth has been decelerating since the ‘70s (Table 1), when it was souped up by the first half of the baby boomers’ entry into their prime working years and the explosion in female participation. It tapered in the ‘80s as the growth in female participation moderated even as the rest of the boomers turned 25. After a middling decade of labor force expansion in the ‘90s, growth slowed sharply over the last two decades as one cohort of baby boomers exited their prime working years every year from 2001 through 2019. The demographic headwind from aging boomers never produced outright contraction like today’s, though, with the labor force plunging by 5% at last April’s trough, and still languishing 2.2% below its pre-pandemic peak today. Where Did All Those Workers Go? There is no smoking gun among demographic breakouts of those who have left the labor force, but the loss of external caregiving resources appears to have been a formidable obstacle to participation. Child care burdens tend to fall more heavily on women, married or unmarried, and the recovery in the participation rate of women with young children has consistently lagged the recovery for women without young children and men with or without young children (Chart 3). It currently sits nearly a percentage point below the other three gender/children categories. Participation rate data by age group suggests that increased adult caregiving burdens may also be playing a role in suppressing participation, based on the mean and median ages of 49.4 and 51, respectively, of adult caregivers.2 Among all workers, the 45-to-54 and 55-and-above cohorts accounted for an outsized share of labor force departures while the 35-to-44 cohort, which is less likely to have adult-care burdens, has experienced labor-force losses at one-fifth of its proportion of the labor force (Table 2). Though adult caregivers skew female (61%), there is not an observable difference in the change in male and female participation at the ages of 45 and above. Chart 3Remote Learning Is Weighing On Participation
Sizing Up The Labor Market
Sizing Up The Labor Market
Table 2Pandemic Labor Force Changes By Age And Gender Cohorts
Sizing Up The Labor Market
Sizing Up The Labor Market
As part of the Household Pulse Survey it began conducting in late April 2020 to track the effects of the pandemic on American households, the Census Bureau has asked the jobless why they are not working. Childcare has steadily gained share and together with eldercare accounted for 9% of responses in May (Chart 4). The largest factor last April and May – the coronavirus’ impact on businesses, covering business drop-offs, temporary and permanent closures and furloughs and layoffs – rapidly fell away and is down to just 11%. Retirements have taken up 11 percentage points of the slack, with 42% of May survey respondents saying they are retired (Chart 5). Chart 4Childcare, Eldercare And ...
Sizing Up The Labor Market
Sizing Up The Labor Market
Chart 5"Retirement" Have Shrunk The Work Force
Sizing Up The Labor Market
Sizing Up The Labor Market
The huge pickup in retirees matches the plunge in 55-and-over participation, but it flies in the face of longer-term trends. 55-plus participation surged during the nineties’ expansion and during all of the aughts, including the dot-com and the GFC recessions, both of which dealt a blow to retirement nest eggs (Chart 6). The 55-and-over participation rate had held remarkably steady around 40% over the last ten years and we are skeptical that so many older workers are exiting at a time when their share of the population is increasing along with life spans. We expect that many of these respondents’ stated retirements may prove to be as "final" as their favorite bands’ retirement tours. Chart 6Previous Equity Selloffs Forced Older Workers To Stay On The Job
Previous Equity Selloffs Forced Older Workers To Stay On The Job
Previous Equity Selloffs Forced Older Workers To Stay On The Job
The Demand Picture Is Different This Time “Jobless recoveries” have become a fixture of the post-recession landscape of the last three decades, which have seen the time it takes to recover the previous cycle’s employment peak become increasingly protracted (Chart 7). We do not believe that we are in the throes of a jobless recovery now, however. The sluggish pace of hiring that followed the last three recessions has mainly been a function of weak demand. This time around,3 the issue appears to be a dearth of labor supply, as increasingly desperate employers report that they are unable to find capable workers to fill open positions. Chart 7It Takes A Long Time To Regain Peak Employment In A Jobless Recovery, ...
It Takes A Long Time To Regain Peak Employment In A Jobless Recovery, ...
It Takes A Long Time To Regain Peak Employment In A Jobless Recovery, ...
Chart 8... But It Doesn't Look Like We're In One Now
... But It Doesn't Look Like We're In One Now
... But It Doesn't Look Like We're In One Now
Chart 9Help Wanted
Help Wanted
Help Wanted
Per the job openings component of the Job Openings and Labor Turnover Survey (JOLTS), there is very nearly one job for every unemployed worker. Although the JOLTS has only existed since 2000, the current level of demand is remarkably robust compared to each of the last two cycles (Chart 8). May’s NFIB survey of small businesses shows the percentage of firms with at least one job opening extended its all-time high (Chart 9, top panel) and hiring intentions over the next three months matched the high set late last cycle (Chart 9, bottom panel). Surging demand for workers is also evident in the record-high rate at which they’re quitting their jobs, presumably to hop to better ones (Chart 8, bottom panel). The Bond Market’s Take The Fed is at pains to avoid market disruptions from its inevitable future moves to tighten monetary policy from the pandemic’s emergency levels. It has explicitly laid out three criteria for hiking rates: year-over-year PCE inflation above 2%, PCE inflation on track to moderately exceed 2% for some time and labor market conditions consistent with its assessment of maximum employment. With both inflation criteria seemingly accomplished, attaining maximum employment shapes up as the swing factor. Maximum employment is a squishy concept that affords the Fed ample discretion in setting its liftoff date. Fed officials keep referring to the previous employment peak in their public comments, and we view it as a simple proxy for meeting its labor market condition. At the end of May, 7.6 million fewer people were working than at the cyclical employment peak in February 2020. At a monthly rate of 500,000 net payrolls gains, it would take fifteen months to get back to the pre-pandemic peak; at a 400,000 clip, it would take nineteen months. Sustaining monthly payrolls additions at the required 4.2% and 3.3% annualized rates for fifteen and nineteen months, respectively, may seem improbable, but it has been done before (Chart 10). The economy’s trend rate of growth was much faster in those past instances, but the employment decline was much larger now, like the fiscal aid meant to counter it. We expect that nonfarm payroll employment will recover its pre-pandemic peak level before the end of 2022. Chart 10It's Not Easy, But It Has Been Done Before
It's Not Easy, But It Has Been Done Before
It's Not Easy, But It Has Been Done Before
Investment Strategy The 10-year Treasury bond yield spent much of April and May consolidating its August-to-March surge from 0.5% to 1.75% and has retraced about a quarter-point of it after its recent slide. It may well stay put or even ease a little more over the next month or so if the Fed sticks to its transitory inflation messaging and the hiring logjam stretches into the summer. We expect that it will eventually be broken, however, as school re-openings and the return of adult-care providers allow sidelined workers to come back to work and the end of enhanced employment benefits forces some lower-wage earners to clock in again. As the pace of hiring picks up in line with our expectations and increasingly points to a return to pre-pandemic employment sometime in the latter half of 2022, we expect that the fixed income markets will pull their liftoff date estimates forward. As market expectations get closer to our first-hike-in-2022 view, bond yields will rise and longer-maturity Treasuries will bear the brunt of the ensuing selloff. Over our cyclical 3-to-12-month timeframe, we therefore continue to recommend that investors underweight fixed income in multi-asset portfolios while maintaining large Treasury underweights and below-benchmark duration. There may well be a tactical opportunity to overweight duration in fixed income or equity portfolios, and our sister US Equity Strategy publication recommends overweighting growth sectors over value sectors to position for it. We do not disagree with our equity colleagues’ call but are keeping our asset allocation eyes fixed on the 12-month horizon. Doug Peta, CFA Chief US Investment Strategist dougp@bcaresearch.com Footnotes 1 An individual is deemed to be in his/her prime-age employment years between the ages of 25 and 54. The baby boomers entered their prime working years from 1971 to 1989, and exited them from 2001 to 2019. 2Caregiving in the US 2020, AARP and The National Alliance for Caregiving. 3 The NBER’s business cycle dating committee declared that the last expansion ended in February 2020, but it has not yet made a judgment as to when the new one began. We assume it likely began in last year’s fourth quarter or this year’s first quarter.
Highlights Duration: The Fed will ignore inflation for the time being and focus on its “maximum employment” target to decide when to lift rates off the zero bound. As a result, bond investors should also ignore inflation and focus on the employment data. We anticipate that significant positive nonfarm payroll surprises will start in late-summer/early-fall and that they will catalyze a move higher in bond yields. Keep portfolio duration below benchmark. Fed Operations: We see no implications for the Fed’s balance sheet or interest rate policies stemming from the recent uptick in ON RRP usage. It is possible that the Fed will decide to slightly increase the IOER or ON RRP rates at this month’s FOMC meeting in an effort to move the funds rate closer to the middle of its target range, but we don’t view this as a pressing need. Inflation: Inflation will moderate in the coming months, but 12-month core inflation will remain close to or above the Fed’s target at least through the end of 2022. Baffling Bond Market Strength We’ve received more questions than usual in recent days, mostly from readers seeking to understand why long-dated bond yields fell during a week that saw one of the strongest CPI prints of the past 40 years and the Treasury dump $38 billion of new 10-year supply on the market. We believe we can explain the conundrum. First, consensus expectations are finally starting to catch up with the pace of economic recovery. Economic surprise indexes measure the strength of economic data relative to consensus expectations and they have fallen a lot compared to the elevated levels seen last year (Chart 1). In fact, if it weren’t for incredibly strong inflation data these indexes would be much closer to “negative surprise” territory. The Industrial Sector and Labor Market components of the Bloomberg Economic Surprise Index have already dipped well below the zero line (Chart 1, bottom panel). Encouragingly, the fall in surprise indexes has more to do with investor expectations ratcheting higher than it does with a slowdown in the pace of economic growth, or at least that is the message you get from the CRB/Gold ratio, an excellent coincident indicator for bond yields (Chart 2). The CRB Raw Industrials commodity price index serves as a proxy for global economic growth and it remains in a solid uptrend. What has changed in the past few weeks is that gold is also staging a rally (Chart 2, bottom panel). This tells us that bond yields are not falling because of a slowdown in economic growth. Rather, they are falling because investors see the Federal Reserve turning increasingly dovish. Chart 1Surprise Indexes
Surprise Indexes
Surprise Indexes
Chart 2CRB/Gold Ratio
CRB/Gold Ratio
CRB/Gold Ratio
Why might investors have this impression of Fed Policy? During the past few months the Fed has successfully convinced markets that it will not lift rates until its “maximum employment” target is achieved, irrespective of what happens with inflation or inflation expectations (more on this in the section titled “A Checklist For Liftoff” below). This explains why bond investors are ignoring positive inflation surprises and focusing instead on the employment data, which have been disappointing. Nonfarm payroll growth came in significantly below consensus expectations in both May and April (Table 1). In light of those disappointing numbers, investors have pushed out expectations for the timing of Fed liftoff and bond yields have fallen as a result. Table 1Monthly Nonfarm Payroll Results Versus Consensus
Watch Employment, Not Inflation
Watch Employment, Not Inflation
In For A Jolt Chart 3Labor Demand Is Not The Problem
Labor Demand Is Not The Problem
Labor Demand Is Not The Problem
We view the recent drop in yields as a bond market over-reaction to weak employment data. Investors are focusing on the weaker-than-expected nonfarm payroll numbers but ignoring skyrocketing indicators of labor demand such as the JOLTS Job Openings Rate, the NFIB Jobs Hard To Fill survey and the Consumer Confidence Jobs Plentiful less Hard To Get survey (Chart 3). As we have noted in past reports, the demand for labor has already fully recovered from the pandemic and it is the lack of labor supply that is holding back the employment recovery.1 That is, people are not making themselves available to work. When we think about possible reasons why people are not making themselves available for job opportunities, the most obvious candidates relate to the pandemic and the fiscal response to the pandemic. Table 2 shows the net number of jobs lost since February 2020 broken down by major industry group. It shows that the Leisure & Hospitality sector (mostly restaurants and bars) accounts for about one third of the net job loss. Together, the Education & Health Services and Government sectors account for another third. A lot of these missing jobs are close-proximity service industry jobs that pay a relatively low average hourly wage. It therefore shouldn’t be too surprising that people are reluctant to take these jobs due to fears of contracting COVID and the fact that they have received large income supplements from the federal government in the form of stimulus checks and expanded unemployment benefits. Table 2Employment By Industry
Watch Employment, Not Inflation
Watch Employment, Not Inflation
It seems unlikely that these constraints to labor supply will persist beyond the next few months. Virus fears will ebb over time, as long as the case count remains low, and government income support will also go away. There will be no more stimulus checks and expanded unemployment benefits are scheduled to expire in September. Chart 4S&L Government Hiring Will Increase
S&L Government Hiring Will Increase
S&L Government Hiring Will Increase
With this in mind, we expect that labor supply constraints will ease by end-summer/early-fall and the result will be significant upside surprises to nonfarm payroll growth. Bond yields will likely stay rangebound in the near-term, but the next significant move will be an increase in yields driven by strong employment data. As a final point on the labor market, we noted above that the Government sector accounts for about 15% of the net job loss since February 2020. In fact, all those missing government jobs are from state & local governments.2 State & local governments cut expenditures drastically last year, but thanks to a faster-than-expected recovery in tax revenues and generous transfers from the federal government, they actually saw overall revenues exceed expenditures in 2020 and again in the first quarter of 2021 (Chart 4). The upshot is that state & local governments are now in a position to ramp up spending, and their pace of hiring should accelerate in the coming months. Bottom Line: The Fed will ignore inflation for the time being and focus on its “maximum employment” target to decide when to lift rates off the zero bound. As a result, bond investors should also ignore inflation and focus on the employment data. We anticipate that significant positive nonfarm payroll surprises will start in late-summer/early-fall and that they will catalyze a move higher in bond yields. Keep portfolio duration below benchmark. A Note On Reverse Repos And Fed Operations Chart 5An Over-Supply Of Reserves
An Over-Supply Of Reserves
An Over-Supply Of Reserves
Many investors have noticed that usage of the Fed’s Overnight Reverse Repo Facility (ON RRP) has surged during the past few weeks, and many are also wondering if this will force the Fed to alter its interest rate or balance sheet policies. The short answer is no. In fact, the increased take-up of the ON RRP is a sign that the Fed’s operational strategy is working as intended. Let’s explain. The Fed’s main task is to set a target range for the federal funds rate and then ensure that the funds rate stays within that range. Today, that target range is between 0% and 0.25%. The fed funds market is where banks trade reserves amongst each other. If the Fed has over-supplied the market with reserves, then they will be very cheap to acquire and the fed funds rate will fall. Conversely, if the Fed has under-supplied the market with reserves, they will be more expensive to acquire and the fed funds rate will rise. At present, the market is awash with reserves. This is the result of the Fed’s asset purchases and the Treasury department’s ongoing policy of reducing its cash holdings.3 This over-supply of reserves is forcing the fed funds rate down, toward the lower-end of the Fed’s target band (Chart 5). This is where the ON RRP comes to the rescue. Through the ON RRP, the Fed pledges to borrow reserves from any eligible counterparty at a rate of 0% using a security off its balance sheet as collateral. This effectively gives any eligible counterparty the option of depositing excess reserves at the Fed in return for a rate of 0%. The result is that the ON RRP establishes a firm floor of 0% under the fed funds rate. Chart 6An Under-Supply Of Reserves
An Under-Supply Of Reserves
An Under-Supply Of Reserves
This is why we say that the ON RRP is working as intended. The market is currently over-supplied with bank reserves and the ON RRP is absorbing that excess while keeping the funds rate anchored within the Fed’s target range. We should note that, in addition to the ON RRP rate, the Fed also pays a rate of interest on excess reserves (IOER). This IOER rate is currently 0.10%. Much like the ON RRP, the IOER should function as a floor on interest rates since it promises banks a rate of 0.10% for excess reserves deposited at the Fed. The problem is that the IOER is only available to primary dealer banks that have accounts at the Federal Reserve. There are other major players in overnight money markets, such as the GSEs and large money market funds, and these institutions do not have access to the IOER, only to the ON RRP. It is this broader counterparty access that makes the ON RRP the true floor on interest rates. It’s also interesting to look back at a time when the Fed was grappling with the opposite issue. In September 2019 the Fed was supplying the market with too few reserves and the fed funds rate was rising as a result (Chart 6). During this period, the fed funds rate actually did briefly break above the top-end of the Fed’s target range. This is because the Fed does not have a standing facility to put a ceiling above rates the way that the ON RRP provides a floor. In September 2019, the Fed had to conduct ad-hoc repo operations – lending reserves in exchange for securities – in order to bring the funds rate back down. Fortunately, the Fed has plans to rectify this problem. The minutes from the last FOMC meeting reveal that a “substantial majority of participants” supported the establishment of a standing repo facility to serve as a ceiling on interest rates in the same way that the ON RRP serves as a floor. The establishment of such a facility will make it easier for the Fed to shrink the size of its balance sheet when the time comes. All in all, we see no implications for the Fed’s balance sheet or interest rate policies stemming from the recent uptick in ON RRP usage. It is possible that the Fed will decide to slightly increase the IOER or ON RRP rates at this month’s FOMC meeting in an effort to move the funds rate closer to the middle of its target band (the fed funds rate is currently 0.06%), but we don’t view this as a pressing need. It is more likely that the Fed will stay the course, knowing that the over-supply of reserves will abate once the Treasury’s cash balance re-normalizes and that the ON RRP will keep the funds rate well-anchored in the meantime. A Checklist For Liftoff Table 3The Fed’s Liftoff Checklist
Watch Employment, Not Inflation
Watch Employment, Not Inflation
At the beginning of this report we claimed that, in determining when to lift rates off the zero bound, the Fed will ignore inflation and inflation expectations and will be guided only by the labor market. This claim stems from the three criteria that the Fed has said will determine the timing of liftoff (Table 3). Yes, above-target inflation is one of the items on the checklist. However, the checklist places no upper limit on inflation that would cause the Fed to ignore the checklist’s “maximum employment” criteria. Further, it’s highly likely that inflation will remain close to or above the Fed’s target at least through the end of 2022. In essence, this means that the inflation portion of the Fed’s liftoff checklist has been achieved and it is only employment that will determine the timing of liftoff. Inflation To see why inflation is likely to remain close to or above target levels we look at 12-month core CPI (Chart 7A) and 12-month core PCE (Chart 7B) and run some scenarios based on future monthly growth rates of 0.1%, 0.2%, 0.3% and 0.4%. For context, core CPI grew 0.9% in April and 0.7% in May. Core PCE grew 0.7% in April and May data have not yet been released. Chart 7A12-Month Core CPI Scenarios
12-Month Core CPI Scenarios
12-Month Core CPI Scenarios
Chart 7B12-Month Core PCE Scenarios
12-Month Core PCE Scenarios
12-Month Core PCE Scenarios
Charts 7A and 7B show that an average monthly growth rate of 0.2%, a significant drop from current rates, will cause 12-month core CPI and core PCE to level-off either at or above target levels and this leveling-off won’t even occur until the middle of next year. Given that we are likely to see at least a few more elevated monthly inflation prints, it is highly likely that inflation will be at or above the Fed’s target by the end of 2022. Employment As for the Fed’s “maximum employment” criteria, we have updated our scenarios for the average monthly pace of nonfarm payroll growth required to reach “maximum employment” by specific dates in the future. As a reminder, we define “maximum employment” as an unemployment rate between 3.5% and 4.5% and a labor force participation rate of 63.3%, equal to its February 2020 level. Our results are presented in Tables 4A-4C. We calculate that average monthly nonfarm payroll growth of between +378k and +462k is required to reach “maximum employment” by the end of 2022. As noted above, we expect that nonfarm payroll growth will come in far above this range starting in late-summer/early-fall. Table 4AAverage Monthly Nonfarm Payroll Growth Required For The Unemployment To Reach 4.5% By The Given Date
Watch Employment, Not Inflation
Watch Employment, Not Inflation
Table 4BAverage Monthly Nonfarm Payroll Growth Required For The Unemployment To Reach 4% By The Given Date
Watch Employment, Not Inflation
Watch Employment, Not Inflation
Table 4CAverage Monthly Nonfarm Payroll Growth Required For The Unemployment To Reach 3.5% By The Given Date
Watch Employment, Not Inflation
Watch Employment, Not Inflation
All in all, we think that the Fed’s maximum employment and inflation criteria will both be met in time for a rate hike in 2022. Ryan Swift US Bond Strategist rswift@bcaresearch.com Footnotes 1 For more details on the lack of labor supply please see US Bond Strategy Weekly Report, “Making Money In Municipal Bonds”, dated April 27, 2021. 2 The federal government has added a net 24 thousand jobs since Feb. 2020. State & local governments have lost a net 1.2 million. 3 For more details on how the Treasury department’s cash management policy is influencing the supply of bank reserves please see US Bond Strategy Weekly Report, “No Panic From Powell”, dated March 9, 2021. Fixed Income Sector Performance Recommended Portfolio Specification
BCA Research’s US Equity Strategy service recommends a barbell positioning for equity portfolios. The US business cycle is shifting into a slowdown stage: US economic and earnings growth will remain robust but decelerate from their peak. Meanwhile,…
Real estate is the best performing S&P 500 sector so far this quarter. It is up 14.8% since March 31, beating the broad index by 7.4 percentage points and bringing its year-to-date gains to 24.4%. The outperformance is somewhat puzzling given the…
Highlights The US business cycle is shifting into a slowdown stage: US economic and earnings growth will remain robust but decelerate from their peak. Treasury rates have stabilized, and inflation fears, if not dissipated, have become priced in. The consumer is flash with cash, and pent-up demand has not yet faded. Demand for services exceeds demand for goods. Valuations are rich, and short-term consolidation is likely. Considering this market backdrop, we recommend a barbell positioning for equity portfolios – a combination of Growth and Cyclicals: Shift allocation towards stable growth sectors, such as Technology, which are getting a shot in the arm from rates stabilization and the growth slowdown. Take a granular approach to selection of cyclical sectors and industries, with preference for the ones most exposed to consumer pent-up demand for goods and services and to a revival of global trade flows. Differentiate between Value and Cyclicals: Cyclicals are more “growthy” than run-of-the-mill Value sectors. Feature In our report of June 7, 2021, we outlined our investment framework. In this report we apply our investment principles to analyze the state of the equity markets today and derive investment recommendations. Business Cycle Is Shifting Into A Slowdown Stage The pandemic is barely over, but the markets have already galloped through both the recovery and expansion stages of the business cycle on the back of economic reopening, fiscal and monetary stimulus, and pent-up demand (Table 1). Table 1Stages Of The Business Cycle
Rotate Into Growth Stocks, Be Granular In The Selection Of Cyclicals
Rotate Into Growth Stocks, Be Granular In The Selection Of Cyclicals
We posit that the business cycle is at the crest of the expansion stage and is shifting into a moderate slowdown. While growth is to remain robust, it has most likely peaked and is starting to decelerate: The ISM Composite reading is elevated but has slipped from a high of 64.2 in March to 62.6 in June (Chart 1). According to Bloomberg consensus estimates, GDP growth is to slow from 6.4% in 2021 to 4% in 2022. The earnings cycle is also peaking. In Q1-2021 US equities delivered 53% YoY earnings growth. Going forward, expectations are for 21% (Chart 2). Chart 1ISM Composite Has Peaked
ISM Composite Has Peaked
ISM Composite Has Peaked
Chart 2EPS Growth Has Also Peaked
EPS Growth Has Also Peaked
EPS Growth Has Also Peaked
While earnings growth is expected to remain robust, a change in pace often manifests itself in a change of market leadership from Value to Growth. Prices Set To Rise But At A Slower Pace Since the beginning of this year, investors’ eyes have been fixed on rising inflation readings. The crux of the debate was centered on whether high inflation is here to stay or is a transitory phenomenon. While we don’t have a definitive answer yet, there is a sufficient body of evidence to suggest that inflation is likely to decelerate. First, the 5-year inflation breakeven has stabilized indicating that the market expects consumer price increases to moderate (Chart 3). Second, the recent spike in the inflation reading has been exacerbated by the base effect of comparison with the darkest days of the pandemic in March-May 2020. Inflation troughed in June of 2020, which will anchor this coming summer’s inflation numbers to a higher base. (Chart 4). Chart 3Inflation Breakeven Stabilized
Inflation Breakeven Stabilized
Inflation Breakeven Stabilized
Chart 4Base Effects Of The Spring 2020 Are To Roll Off
Base Effects Of The Spring 2020 Are To Roll Off
Base Effects Of The Spring 2020 Are To Roll Off
Third, inflation is likely to dissipate to more normal levels later in the year thanks to millions rejoining the labor force upon expiration of supplemental employment insurance benefits in the fall, and the supply chain gradually becoming unclogged. Last, the bubble in commodities prices has burst with prices of lumber, corn and steel coming down from their highs by more than 30%, keeping a lid on PPI, and subsequently on the price of finished goods (Chart 5 & Chart 6) . Chart 5Bubble In Commodities Burst
Bubble In Commodities Burst
Bubble In Commodities Burst
Chart 6PPI To Follow Commodity Prices
PPI To Follow Commodity Prices
PPI To Follow Commodity Prices
Rates Are Stabilizing After rising by nearly 1% from 0.5% to 1.5% in the course of just four months from November 2020 to February 2021, the 10-year Treasury yield has been range bound between 1.5% and 1.7% despite fireworks in the US economic data ranging from CPI readings to unemployment beats (Chart 7). The fact that the bond market is refusing to budge no matter how positive a macro release number we get, confirms our view that a post Covid-19 economic revival and accelerated growth have been priced in. Case in point: The Citi Economic Surprise Index (CESI) turned down from its February highs and is approaching zero. Chart 7Rates Are Range Bound Since March
Rates Are Range Bound Since March
Rates Are Range Bound Since March
Given the tight positive correlation (44%) between CESI and UST10Y, and inflation moderating, it is unlikely that the bond market will enter another aggressive sell-off phase (Chart 8). It is possible that rates will continue to grind higher over the summer, but the rate of ascent, which is more important for growth-oriented assets than the level (excluding extreme readings), is likely to be slow. Chart 8Positive Economic Data Is Priced In
Positive Economic Data Is Priced In
Positive Economic Data Is Priced In
Consumers Are Flash With Cash After a series of helicopter cash drops, most consumers came out of the recession in a better financial shape than they entered it. According estimates by Peter G Peterson Foundation, only 22% and 19% of second and third round of stimulus checks have been spent (in addition, some of the money was used to pay off debt). Personal savings have increased by roughly $1.5 trillion from January 2020 trough, and disposable income has increased by 6% (Chart 9). With plentiful jobs and quit rates off the map, we expect consumer confidence to remain high and support spending. The investment implication is that we favor parts of the equity market most exposed to American consumer. Chart 9Consumers Are Flash With Cash
Consumers Are Flash With Cash
Consumers Are Flash With Cash
Services Are In Higher Demand Than Goods After months of consumer behavior altered by fears of the pandemic, economic reopening has brought about strong demand for services. Indeed, the latest Non-manufacturing ISM PMI reading was 64 compared to 61 for Manufacturing, which has clearly peaked. As a result, we favor service sectors, both in the consumer and industrial space (Chart 10). Chart 10Demand For Services Outstrips Demand For Goods
Demand For Services Outstrips Demand For Goods
Demand For Services Outstrips Demand For Goods
Global Trade Flows Are Soaring The global push for vaccinations and pent-up demand have jump-started trade flows around the globe. Despite shipping bottlenecks and container shortages, global trade is thriving, strengthening demand for industrial goods and transportation services (Chart 11). Chart 11Global Trade Soars
Global Trade Soars
Global Trade Soars
Valuations Are Elevated The US equity market had a fantastic run over the past year, delivering 93% return from March 2020 trough, and is now trading at 30x trailing PE. Forward-looking PE is also elevated at 23x. About 40% of S&P 500 industry groups are trading in the top 10% of their historical valuations. In a way, markets have borrowed returns from the future (Chart 12). With valuations close to an all-time high, equity markets do not have much safety margin and are vulnerable to a correction which may be triggered by hawkish rhetoric from the Fed, or upside inflation or employment surprises. Having said that, we are bullish on equity markets on a three to six months horizon. Chart 12US Equities Are Expensive
US Equities Are Expensive
US Equities Are Expensive
Lastly, high valuation is not necessarily an impediment to a continued bull market but more of a speed limit: Returns of US equities are to be modest going forward. To keep portfolio return volatility down and enhance compounding effects, we recommend carrying a healthy allocation to such defensive sectors as Health Care. We would stay away from bond proxies like Utilities and Telecom. Investment Implications To sum it all up: Economic and earnings growth is to remain robust but come down from the peak, inflation is to decelerate but stay high, rates are to remain stable, consumer spending is to stay robust, demand for services is to exceed demand for goods and global trade flows are soaring. What do these economic developments mean for portfolio positioning? What styles and sectors will fare best in the current economic environment? Growth does well when rates and inflation are stabilizing thanks to the long duration nature of its earnings stream, and shines in a slowdown when growth becomes scarcer. Cyclicals thrive in an environment of falling inflation, but a mature cycle is not an ideal backdrop for their outperformance. In terms of sector selection, we favor Cyclicals with exposure to consumers, playing growth through the “new economy”, i.e. Software and Services, and Internet Retailing. We will fund the new positions by taking profits from recent winners, Financials and Materials. The following is a brief rationale for these allocations. Value/Growth Rotation Between November 5, 2020 and May 7, 2021, long-duration Growth equities underperformed Value equities by 16%, beaten down by rising rates and accelerating economic growth. However, recently the case for Growth has strengthened. With rates stabilizing and inflation decelerating, there are already early signs that Growth stocks are staging a comeback, outperforming Value by 2.5% since May 10. Chart 13 shows that, in an enviroment of slowing inflation, Growth tends to outperform Value (Chart 14). Chart 13Growth Underperforms Value Since October 2020
Growth Underperforms Value Since October 2020
Growth Underperforms Value Since October 2020
Chart 14Growth Has Outperformed When Inflation Decelerates
Rotate Into Growth Stocks, Be Granular In The Selection Of Cyclicals
Rotate Into Growth Stocks, Be Granular In The Selection Of Cyclicals
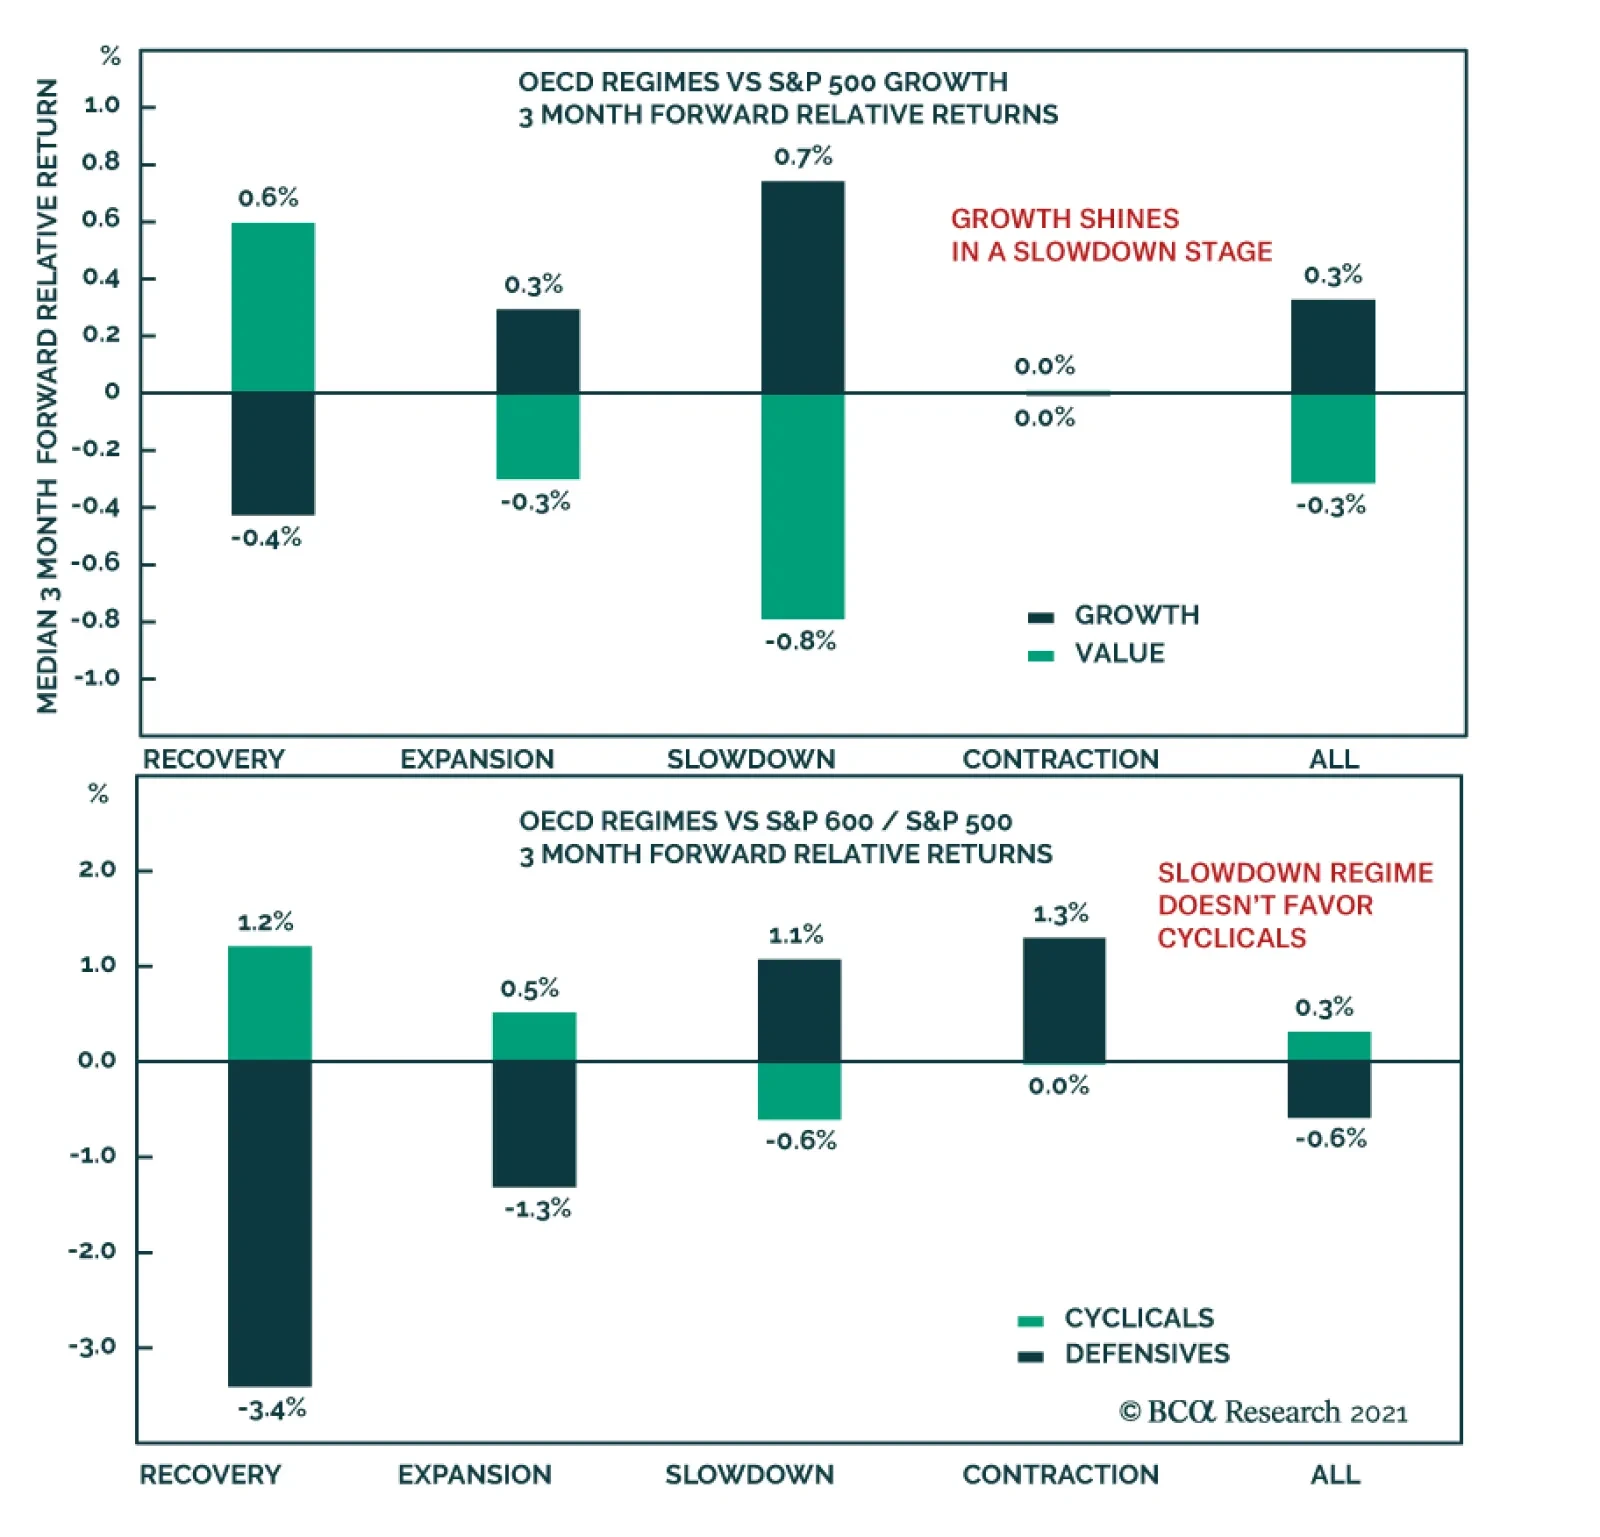
Further, peak economic and earnings growth, as well as the business cycle moving into a slowdown stage, bode well for Growth sectors (Chart 15). Chart 15Growth Shines In A Slowdown Stage
Rotate Into Growth Stocks, Be Granular In The Selection Of Cyclicals
Rotate Into Growth Stocks, Be Granular In The Selection Of Cyclicals
Chart 16Growth Is Less Frothy Now
Growth Is Less Frothy Now
Growth Is Less Frothy Now
Further, zooming into fundamentals and valuations, we observe that Growth stocks remain expensive, trading at a forward multiple of 27x, which is a 53% premium to Value, but some of the froth has come off as the style is now trading 3 points lower than back in December 2020 (Chart 16). Comparing Growth and Value earnings expectations, Value stocks are expected to grow about 10% faster than Growth stocks (Chart 17). The crux of the current Growth/Value dilemma is that, while optically Value is more attractive: cheaper than Growth and offering higher earnings growth, it is also much more sensitive to a slowdown in economic growth and rates stabilization (even if rates remain high). Thus, if we are right and rates and inflation have indeed steadied, and growth is slowing. Growth will outperform Value despite the latter’s superior fundamentals. The explanation lies in a sector composition of the two styles. Value’s top allocation is Financials, for which stabilizing rates and a flattening yield curve are detrimental. Growth’s top allocation is Information Technology (40% of the index), which thrives in an environment of lower growth and stable rates (Chart 18). All in all, we recommend topping up Growth sectors in a portfolio to be better positioned for an imminent change in regime. Chart 17Value Is Expected To Have Higher Earnings Growth
Value Is Expected To Have Higher Earnings Growth
Value Is Expected To Have Higher Earnings Growth
Chart 18Growth Is Exposed To Tech, Value To Financials
Rotate Into Growth Stocks, Be Granular In The Selection Of Cyclicals
Rotate Into Growth Stocks, Be Granular In The Selection Of Cyclicals
Cyclicals Vs Defensives Similarly to Value, Cyclicals have outperformed Defensives by about 10.7% since November. However, in March this rally ran out of steam, and relative returns remain range bound Chart 19. Further, performance of Cyclicals is sensitive to the stages of the business cycle. Normally, in a slowdown stage, Cyclicals lag. Chart 20 shows performance of Cyclicals during the slowdown stage of the business cycles. Chart 19Cyclicals Have Not Outperformed Defensives Since March
Cyclicals Have Not Outperformed Defensives Since March
Cyclicals Have Not Outperformed Defensives Since March
Chart 20Slowdown Regime Doesn’t Favor Cyclicals
Rotate Into Growth Stocks, Be Granular In The Selection Of Cyclicals
Rotate Into Growth Stocks, Be Granular In The Selection Of Cyclicals
However, this cycle may turn out somewhat different due to supply-chain disruptions and pent-up demand. Many of the conditions supporting Cyclicals are still in place: The potential infrastructure package, improving global trade and easy financial conditions. Earnings expectations relative to Defensives remain robust, and valuations have recently compressed from a 97% premium in February 2021, to 17% in May (Chart 21). Hence, we are not yet ready to give up on Cyclical stocks but will be granular in our allocations, favoring industry groups most exposed to services, global trade, infrastructure, and the US consumer. Chart 21Cyclicals Have Rerated Rel To Defensives
Cyclicals Have Rerated Rel To Defensives
Cyclicals Have Rerated Rel To Defensives
Are Cyclicals The Same As Value? The reader may observe that we favor Cyclicals over Value and wonder if they are not one and the same. While recently Value and Cyclicals have been nearly 90% correlated (Chart 22), this relationship changes over time. Cyclicals have higher exposure than Value to stable growth sectors like Technology, and Consumer Discretionary (Chart 23). We prefer Cyclicals to Value because Technology is a quintessential growth sector favored by the current macroeconomic backdrop, and the Consumer Discretionary sector is exposed to increases in discretionary income and consumer demand for services. Choosing between Value and Cyclicals, we pick Cyclicals (Chart 23). Chart 22Relationship Between Value And Cyclicals Changes Over Time
Rotate Into Growth Stocks, Be Granular In The Selection Of Cyclicals
Rotate Into Growth Stocks, Be Granular In The Selection Of Cyclicals
Chart 23Cyclicals Have More Exposure To Stable Growth Than Value
Rotate Into Growth Stocks, Be Granular In The Selection Of Cyclicals
Rotate Into Growth Stocks, Be Granular In The Selection Of Cyclicals
Investment Recommendations Overweight Growth-Oriented And Cyclical Sectors Growth-oriented industries groups and industries benefiting from rate stabilization, such as Software and IT Services, Semiconductors, and Internet Retail. Valuations are expensive but are justified by strong expected long-term earnings growth. Cyclical industries exposed to consumer demand for services and experiences, such as Hotels, Restaurants, Entertainment, and Airlines. Discretionary goods industry groups such as Autos & Components, and Consumer Durables. Industrial service-oriented industry groups, such as Transportation and Professional Services Global trade and infrastructure exposed industries such as Transportation, Construction and Engineering, and Building Materials. Equal Weight Defensive Sectors Health care valuations and returns have been subdued due to disruptions wrecked by the pandemic. However, in addition to trading at 16x forward earnings, the sector expects solid earnings growth (10% over the next 12 months) and is likely to benefit from post-Covid-19 normalization in health care and diminished policy risks. To be more specific, policy risk for Big Pharma is higher as it is a bipartisan target, while managed health care got a big positive policy surprise when Biden wisely decided earlier this year not to re-fight the health care battles of the Obama administration. Underweight Sectors Negatively Affected By Rate And Inflation Stabilization (Off High Levels) Rate stabilization and yield-curve flattening is detrimental to rate-sensitive sectors such as Banks and Insurance. Inflation deceleration will be detrimental to industry groups with high pricing power and high exposure to raw materials. Since commodities prices have rolled over, the Metals and Mining industry group may take a pause. We will also avoid bond-proxy sectors like Utilities and Consumer Staples: Rates have stabilized but a bull market in bonds is highly unlikely Bottom Line Peak growth, inflation and rates stabilization herald a new lease of life for Growth stocks. Strong consumption and pent-up demand for goods and services as well as a revival of global trade support further outperformance of Cyclicals. Irene Tunkel Chief Strategist, US Equity Strategy irene.tunkel@bcaresearch.com Recommended Allocation
Rotate Into Growth Stocks, Be Granular In The Selection Of Cyclicals
Rotate Into Growth Stocks, Be Granular In The Selection Of Cyclicals