United States
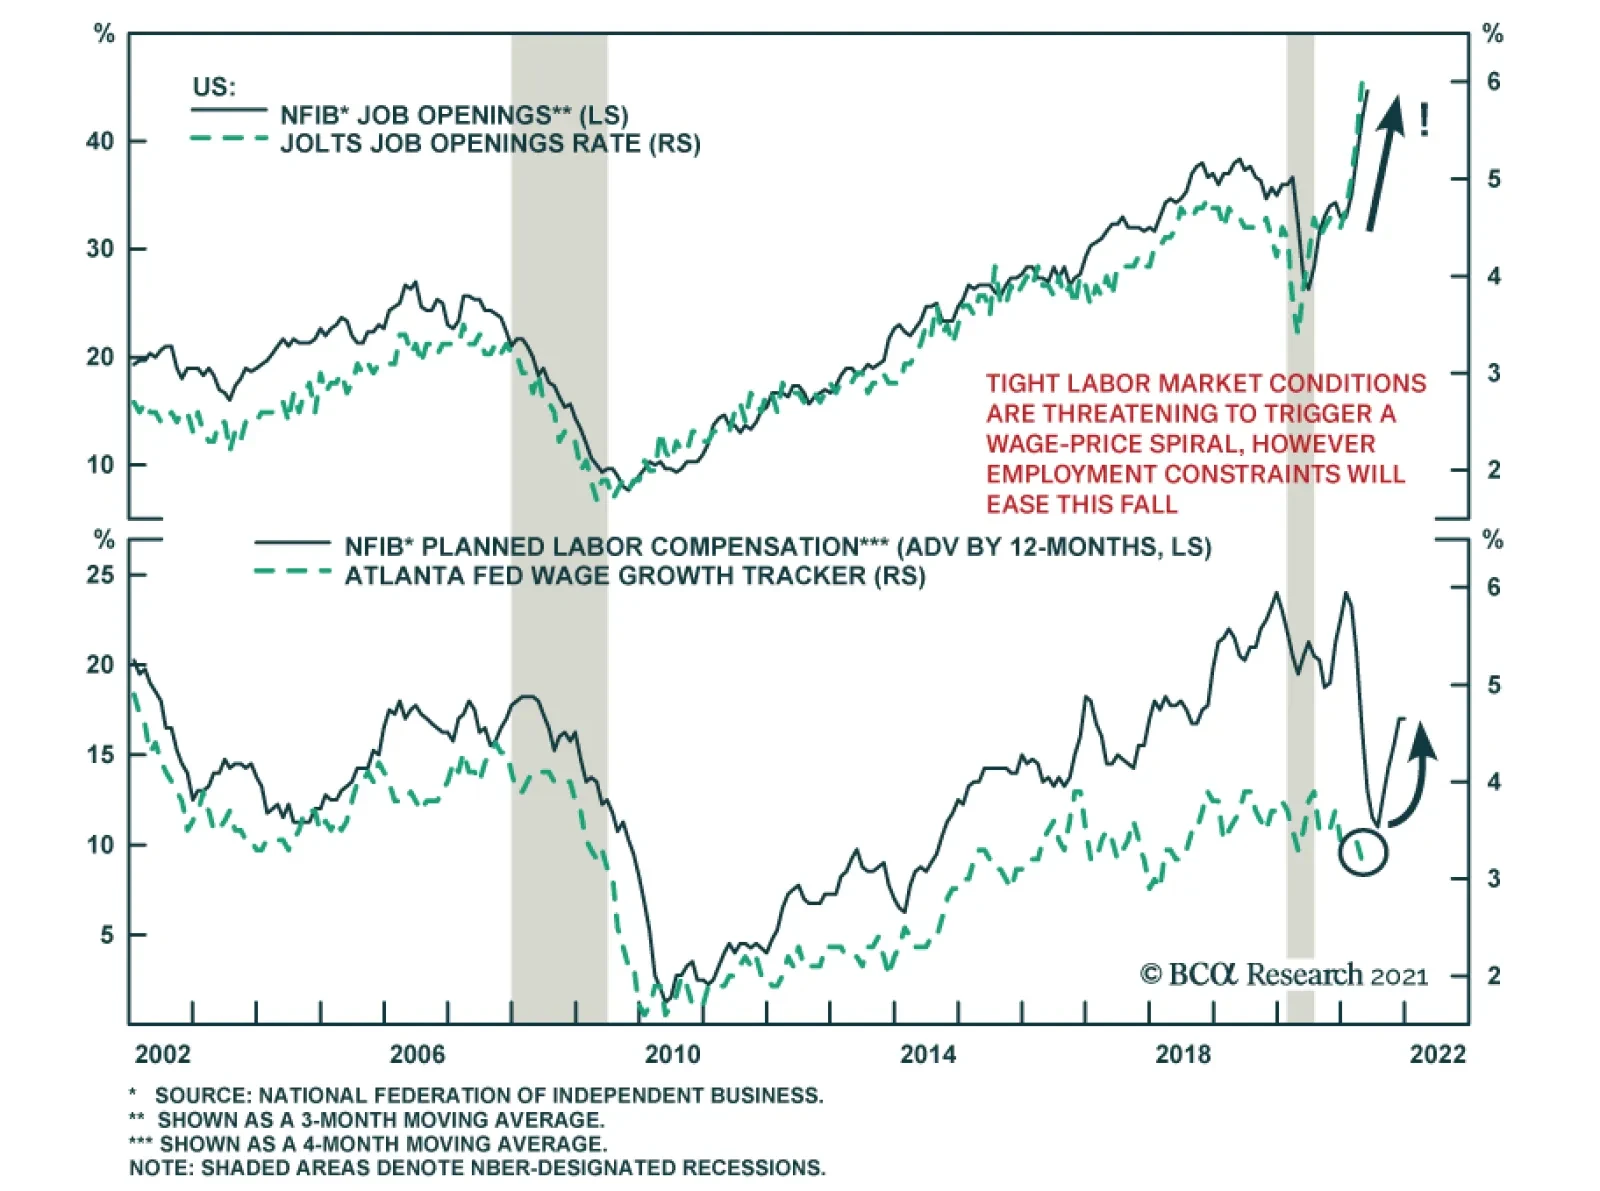
The NFIB Small Business Optimism Index disappointed in May, slipping 0.2 points to 99.6 from 99.8, versus expectations of an increase to 101.0. The main takeaway is that supply side constraints are intensifying for small business owners. A record 48% of…
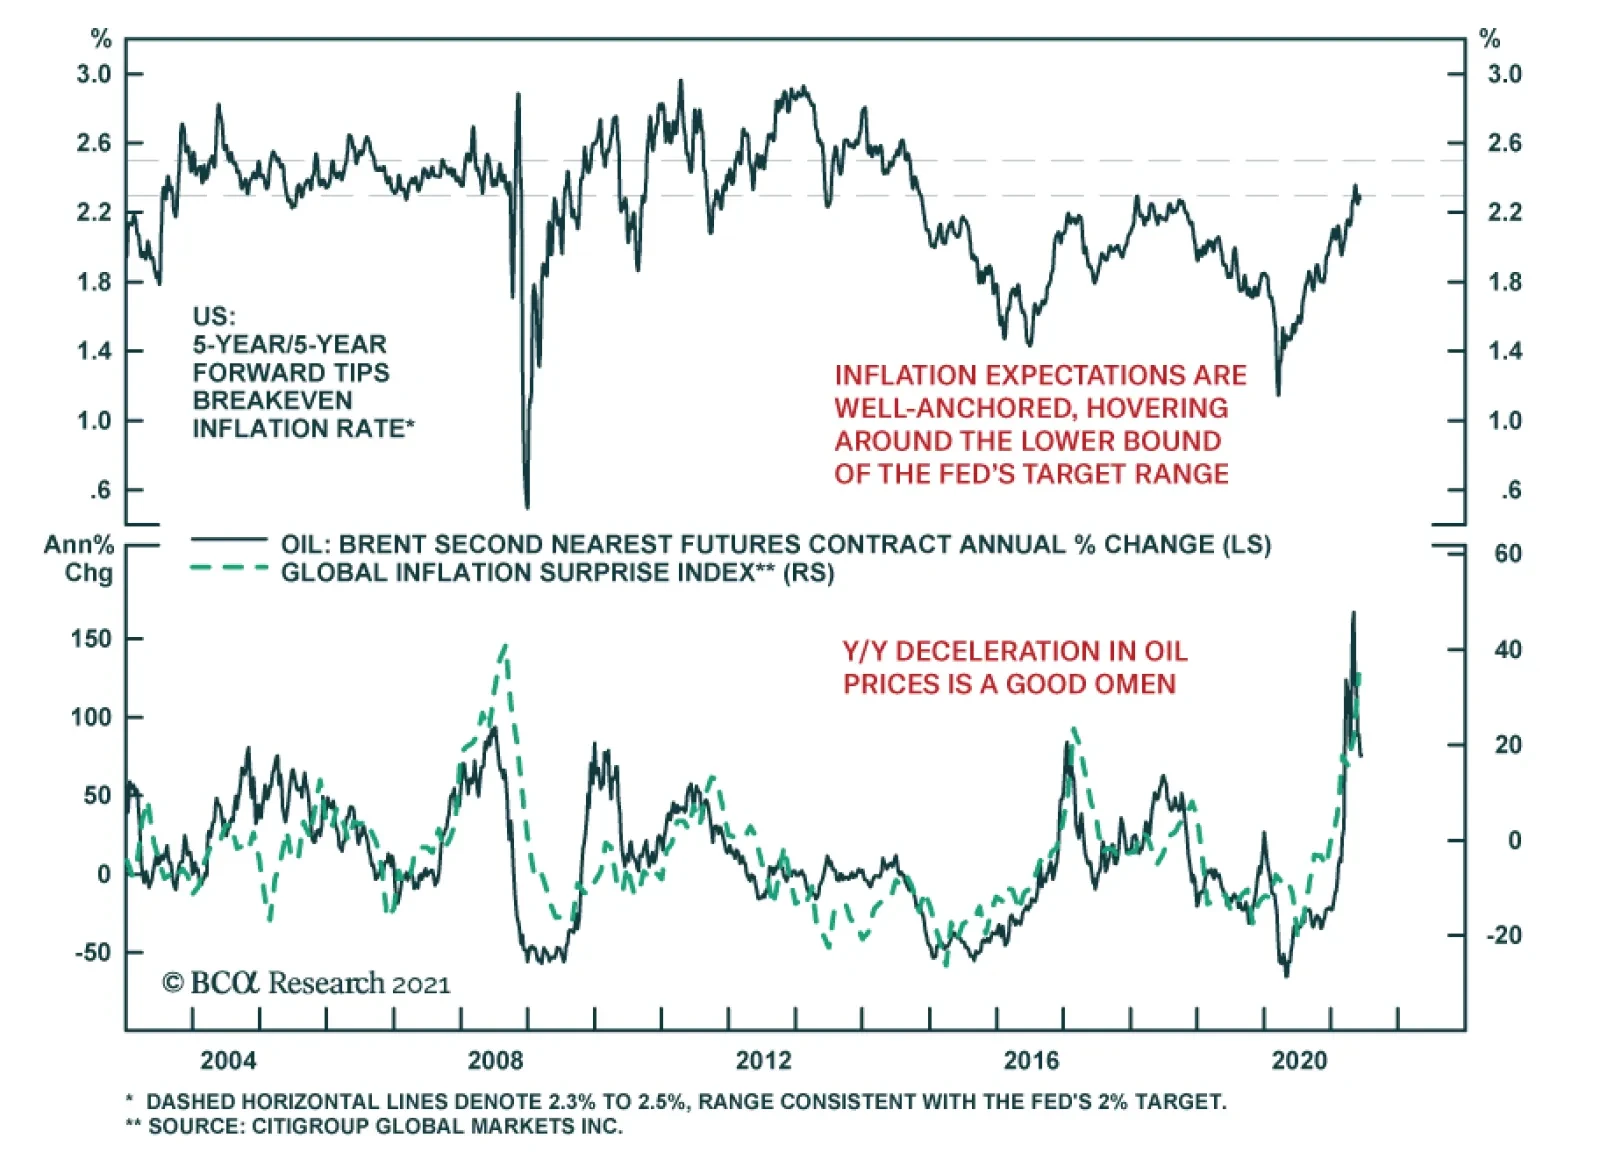
Market based inflation expectations have been easing recently. After climbing nearly 50 bps between March 1 and May 11, the 5-year/5-year forward TIPS breakeven inflation rate fell more than 10 bps and is now just below 2.3% – the lower bound of the range…

Rolling VIX Futures Hedge
Rolling VIX Futures Hedge
Our hedging techniques proved profitable this year with the previous long VIX futures trade bringing in gains just shy of 20%, on top of our two synthetic SPY long options trades that added 676% ($5.41/contract) and 2850% ($8.86/contract) in returns to the portfolio. Our reinstated and currently active June 2021 VIX futures hedge is about to expire for a loss of 27% as the market has proven to be resilient. Alas, wrong and early look the same! Indeed, we had a chance to crystalize some gains on May 12, but we believed, and still do, that a more pronounced correction is imminent, especially given the divergence between high-yield corporate spreads and the SPX (see chart) along with many other reasons, such as expensive valuations and an expected gradual growth slowdown. The VIX curve has also shifted higher over the past several months making it more expensive to roll the hedge, but a 5-10% SPX correction will make this trade profitable. Bottom Line: Roll the June 2021 VIX hedge into the September 2021 contract.
Highlights Chart 1Tracking Nonfarm Payrolls
Tracking Nonfarm Payrolls
Tracking Nonfarm Payrolls
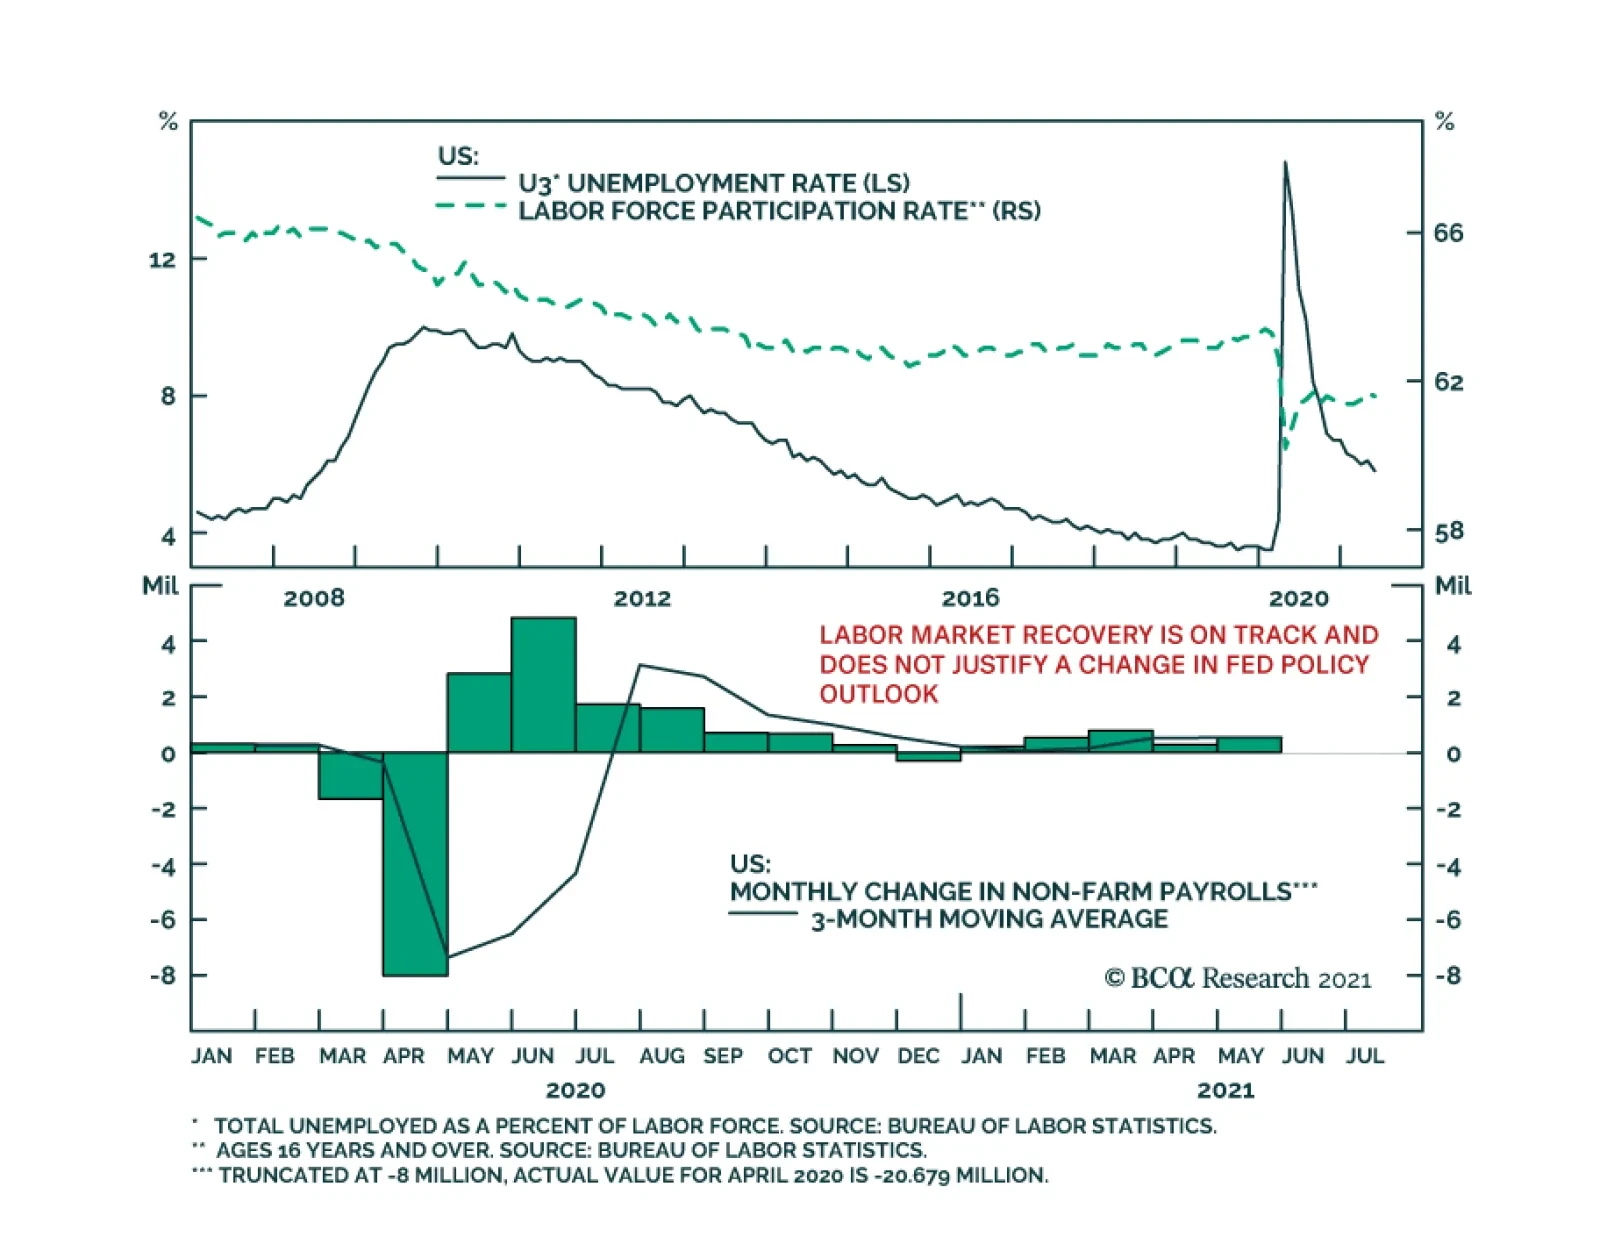
With 12-month PCE inflation already above the Fed’s 2% target, it is progress toward the Fed’s “maximum employment” goal that will determine both the timing of Fed liftoff and whether bond yields rise or fall. On that note, the bond market is currently priced for Fed liftoff in early 2023. We also calculate that average monthly nonfarm payroll growth of between 378k and 462k is required to meet the Fed’s “maximum employment” goal by the end of 2022, in time for an early-2023 rate hike. It follows from this analysis that any monthly employment print above +462k should be considered bond-bearish and any print below +378k should be considered bond-bullish (Chart 1). In that light, May’s +559k print is bond-bearish, and we anticipate further bond-bearish employment reports in the coming months as COVID fears fade and people return to a labor market that is already awash with demand. Investors should maintain below-benchmark portfolio duration in US bond portfolios and also continue to favor spread product over duration-matched Treasuries. Feature Table 1Recommended Portfolio Specification
It’s All About Employment
It’s All About Employment
Table 2Fixed Income Sector Performance
It’s All About Employment
It’s All About Employment
Investment Grade: Neutral Chart 2Investment Grade Market Overview
Investment Grade Market Overview
Investment Grade Market Overview
Investment grade corporate bonds outperformed the duration-equivalent Treasury index by 47 basis points in May, bringing year-to-date excess returns up to +159 bps. The combination of above-trend economic growth and accommodative monetary policy supports positive excess returns for spread product versus Treasuries. At 142 bps, the 2/10 Treasury slope is very steep and the 5-year/5-year forward TIPS breakeven inflation rate sits at 2.27% - almost, but not quite, within the 2.3% to 2.5% range that the Fed considers “well anchored”.1 The message from these two indicators is that the Fed is not yet ready for monetary conditions to turn restrictive. Despite the positive macro back-drop, investment grade corporate valuations are extremely tight. The investment grade corporate index’s 12-month breakeven spread is almost at its lowest since 1995 (Chart 2). Though we retain a positive view of spread product as a whole, tight valuations cause us to recommend only a neutral allocation to investment grade corporates. We prefer high-yield corporates, municipal bonds and USD-denominated Emerging Market Sovereigns. Last week, the Fed announced that it will wind down its corporate bond portfolio over the coming months. The corporate bond purchase facility has not been operational since December 2020, meaning that the corporate bond market has been functioning without an explicit Fed back-stop for all of 2021. The portfolio itself is also quite small compared to the size of the corporate bond market. As a result, we anticipate no material impact on spreads. Table 3ACorporate Sector Relative Valuation And Recommended Allocation*
It’s All About Employment
It’s All About Employment
Table 3BCorporate Sector Risk Vs. Reward*
It’s All About Employment
It’s All About Employment
High-Yield: Overweight Chart 3High-Yield Market Overview
High-Yield Market Overview
High-Yield Market Overview
High-Yield outperformed the duration-equivalent Treasury index by 8 basis points in May, bringing year-to-date excess returns up to +343 bps. In a recent report, we looked at the default expectations that are currently priced into the junk index and considered whether they are likely to be met.2 If we demand an excess spread of 100 bps and assume a 40% recovery rate on defaulted debt, then the High-Yield index embeds an expected default rate of 3.3% (Chart 3). Using a model of the speculative grade default rate that is based on gross corporate leverage (pre-tax profits over total debt) and C&I lending standards, we can estimate a likely default rate for the next 12 months using assumptions for profit and debt growth. The median FOMC forecast of 6.5% real GDP growth in 2021 is consistent with 31% corporate profit growth. We also assume that last year’s corporate debt binge will moderate in 2021. According to our model, 30% profit growth and 2% debt growth is consistent with a default rate of 3.4%, very close to what is priced into junk spreads. Given that the large amount of fiscal stimulus coming down the pike makes the Fed’s 6.5% real GDP growth forecast look conservative, and the fact that the combination of strong economic growth and accommodative monetary policy could easily cause valuations to overshoot in the near-term, we are inclined to maintain an overweight allocation to High-Yield bonds. MBS: Underweight Chart 4MBS Market Overview
MBS Market Overview
MBS Market Overview
Mortgage-Backed Securities underperformed the duration-equivalent Treasury index by 36 basis points in May, dragging year-to-date excess returns down to -9 bps. The nominal spread between conventional 30-year MBS and equivalent-duration Treasuries widened 7 bps in May. The spread remains wide compared to recent history, but it is still tight compared to the pace of mortgage refinancings (Chart 4). The conventional 30-year MBS option-adjusted spread (OAS) currently sits at 24 bps. This is considerably below the 51 bps offered by Aa-rated corporate bonds and the 27 bps offered by Agency CMBS. It is only slightly more than the 18 bps offered by Aaa-rated consumer ABS. All in all, value in MBS is not appealing compared to other similarly risky sectors. In a recent report, we looked at MBS performance and valuation across the coupon stack.3 We noted that the higher convexity of high-coupon MBS makes them likely to outperform lower-coupon MBS in a rising yield environment. Higher coupon MBS also have greater OAS than lower coupons. This makes the high-coupon MBS more likely to outperform in a flat bond yield environment as well. Given our view that bond yields will be flat-to-higher during the next 6-12 months, we recommend favoring high coupons over low coupons within an overall underweight allocation to Agency MBS. Government-Related: Neutral Chart 5Government-Related Market Overview
Government-Related Market Overview
Government-Related Market Overview
The Government-Related index outperformed the duration-equivalent Treasury index by 15 basis points in May, bringing year-to-date excess returns up to +87 bps (Chart 5). Sovereign debt outperformed duration-equivalent Treasuries by 32 bps in May, bringing year-to-date excess returns up to +53 bps. Foreign Agencies outperformed the Treasury benchmark by 2 bps on the month, bringing year-to-date excess returns up to +37 bps. Local Authority bonds outperformed by 30 bps in May, bringing year-to-date excess returns up to +360 bps. Domestic Agency bonds and Supranationals both outperformed by 8 bps, bringing year-to-date excess returns up to +27 bps and +24 bps, respectively. We recently took a detailed look at USD-denominated Emerging Market (EM) Sovereign valuation.4 We found that, on an equivalent-duration basis, EM Sovereigns offer a spread advantage over investment grade US corporates. Attractive countries include: Qatar, UAE, Saudi Arabia, Indonesia, Mexico, Russia and Colombia. We prefer US corporates over EM Sovereigns in the high-yield space where there is still some value left in US corporate spreads and where the EM space is dominated by distressed credits like Turkey and Argentina. Municipal Bonds: Overweight Chart 6Municipal Market Overview
Municipal Market Overview
Municipal Market Overview
Municipal bonds underperformed the duration-equivalent Treasury index by 21 basis points in May, dragging year-to-date excess returns down to +286 bps (before adjusting for the tax advantage). We took a detailed look at municipal bond performance and valuation in a recent report and came to the following conclusions.5 First, the economic and policy back-drop is favorable for municipal bond performance. The recently enacted American Rescue Plan includes $350 billion of funding for state & local governments, a bailout that comes after state & local government revenues already exceeded expenditures in 2020 (Chart 6). President Biden has also proposed increasing income tax rates. However, there may not be time to pass these tax hikes before the 2022 midterm elections. Second, Aaa-rated municipal bonds look expensive relative to Treasuries (top panel). Muni investors should move down in quality to pick up additional yield. Third, General Obligation (GO) and Revenue munis offer better value than investment grade corporates with the same credit rating and duration, particularly at the long-end of the curve. Revenue munis in the 12-17 year maturity bucket offer a before-tax yield pick-up versus corporates. GO munis offer a breakeven tax rate of just 7% (panel 2). Fourth, taxable munis offer a yield advantage over investment grade corporates that investors should take advantage of (panel 3). Finally, high-yield muni spreads are reasonably attractive relative to high-yield corporates, offering a breakeven tax rate of 22% (panel 4). But despite the attractive spread, we recommend only a neutral allocation to high-yield munis versus high-yield corporates as the deep negative convexity of high-yield munis makes them prone to extension risk if bond yields gap higher. Treasury Curve: Buy 5-Year Bullet Versus 2/30 Barbell Chart 7Treasury Yield Curve Overview
Treasury Yield Curve Overview
Treasury Yield Curve Overview
Treasury yields fell in May, with the 5-10 year part of the curve benefiting the most. The 7-year yield fell 8 bps in May while the 5-year and 10-year yields both fell 7 bps. Yield declines were smaller for shorter (< 5-year) and longer (> 10-year) maturities. The 2/10 Treasury slope flattened 5 bps to end the month at 144 bps. The 5/30 Treasury slope steepened 3 bps to end the month at 147 bps (Chart 7). We recently changed our recommended yield curve position from a 5 over 2/10 butterfly to a 5 over 2/30 butterfly.6 In making the switch we noted that the slope of the Treasury curve has behaved differently since bond yields peaked in early April. Prior to April, the rise in bond yields was concentrated at the very long-end (10-year +) of the curve. During the past two months, the belly of the curve (5-7 years) has seen more volatility. We conclude that we are now close enough to an expected Fed liftoff date that further significant increases in yields will be met with a flatter curve beyond the 5-year maturity point and that the 5-year and 7-year notes are likely to benefit the most if bond yields dip. We also observe an exceptional yield pick-up of +33 bps in the 5-year bullet over a duration-matched 2/30 barbell. Given our view that bond yields will be flat-to-higher during the next 6-12 months, we recommend buying the 5-year bullet over a duration-matched 2/30 barbell to take advantage of the strong positive carry in a flat yield environment, and as a hedge against our below-benchmark portfolio duration stance. TIPS: Neutral Chart 8TIPS Market Overview
TIPS Market Overview
TIPS Market Overview
TIPS outperformed the duration-equivalent nominal Treasury index by 86 basis points in May, bringing year-to-date excess returns up to +484 bps. The 10-year and 5-year/5-year forward TIPS breakeven inflation rates rose 1 bp and 2 bps on the month, respectively. At 2.42%, the 10-year TIPS breakeven inflation rate is near the top-end of the 2.3% to 2.5% range that is consistent with inflation expectations being well anchored around the Fed’s target (Chart 8). Meanwhile, at 2.27%, the 5-year/5-year forward TIPS breakeven inflation rate is just below the target band (panel 3). With long-maturity breakevens already consistent (or close to consistent) with the Fed’s target, they have limited upside going forward. The Fed has so far welcomed rising TIPS breakeven inflation rates, but it will have an increasing incentive to lean against them if they continue to move up. We also think that the market has priced-in an overly aggressive inflation outlook at the front-end of the curve. The 1-year and 2-year CPI swap rates stand at 3.76% and 3.12%, respectively. There is a good chance that these lofty inflation expectations will not be confirmed by the actual data. With all that in mind, investors should maintain a neutral allocation to TIPS versus nominal Treasuries and also a neutral posture towards the inflation curve (panel 4). The inflation curve could steepen somewhat in the near-term if short-maturity inflation expectations moderate, but we expect the curve to remain inverted for a long time yet. An inverted inflation curve is more consistent with the Fed’s Average Inflation Target than a positively sloped one, and it should be considered the natural state of affairs moving forward. ABS: Overweight Chart 9ABS Market Overview
ABS Market Overview
ABS Market Overview
Asset-Backed Securities outperformed the duration-equivalent Treasury index by 13 basis points in May, bringing year-to-date excess returns up to +33 bps. Aaa-rated ABS outperformed by 13 bps on the month, bringing year-to-date excess returns up to +26 bps. Non-Aaa ABS outperformed by 12 bps on the month, bringing year-to-date excess returns up to +70 bps. The stimulus from last year’s CARES act led to a significant increase in household savings when individual checks were mailed in April 2020. This excess savings has still not been spent and, already, the most recent round of stimulus checks is pushing the savings rate higher again (Chart 9). The extraordinarily large stock of household savings means that the collateral quality of consumer ABS is also extraordinarily high. Indeed, many households have been using their windfalls to pay down consumer debt (bottom panel). Investors should remain overweight consumer ABS and should also take advantage of the high quality of household balance sheets by moving down the quality spectrum. Non-Agency CMBS: Neutral Chart 10CMBS Market Overview
CMBS Market Overview
CMBS Market Overview
Non-Agency Commercial Mortgage-Backed Securities outperformed the duration-equivalent Treasury index by 41 basis points in May, bringing year-to-date excess returns up to +163 bps. Aaa Non-Agency CMBS outperformed Treasuries by 27 bps in May, bringing year-to-date excess returns up to +78 bps. Non-Aaa Non-Agency CMBS outperformed by 84 bps, bringing year-to-date excess returns up to +453 bps (Chart 10). Though returns have been strong and spreads remain attractive, particularly for lower-rated CMBS, we continue to recommend only a neutral allocation to the sector because of the structurally challenging environment for commercial real estate. Even with the economic recovery well underway, commercial real estate loan demand continues to weaken and banks are not making lending standards more accommodative (panels 3 & 4). Agency CMBS: Overweight Agency CMBS outperformed the duration-equivalent Treasury index by 37 basis points in May, bringing year-to-date excess returns up to +125 bps. The average index option-adjusted spread tightened 7 bps on the month and it currently sits at 27 bps (bottom panel). Though Agency CMBS spreads have completely recovered their pre-COVID levels, they still look attractive compared to other similarly risky spread products. Stay overweight. Appendix A: Butterfly Strategy Valuations The following tables present the current read-outs from our butterfly spread models. We use these models to identify opportunities to take duration-neutral positions across the Treasury curve. The following two Special Reports explain the models in more detail: US Bond Strategy Special Report, “Bullets, Barbells And Butterflies”, dated July 25, 2017, available at usbs.bcaresearch.com US Bond Strategy Special Report, “More Bullets, Barbells And Butterflies”, dated May 15, 2018, available at usbs.bcaresearch.com Table 4 shows the raw residuals from each model. A positive value indicates that the bullet is cheap relative to the duration-matched barbell. A negative value indicates that the barbell is cheap relative to the bullet. Table 4Butterfly Strategy Valuation: Raw Residuals In Basis Points (As Of May 28TH, 2021)
It’s All About Employment
It’s All About Employment
Table 5 scales the raw residuals in Table 4 by their historical means and standard deviations. This facilitates comparison between the different butterfly spreads. Table 5Butterfly Strategy Valuation: Standardized Residuals (As Of May 28TH, 2021)
It’s All About Employment
It’s All About Employment
Table 6 flips the models on their heads. It shows the change in the slope between the two barbell maturities that must be realized during the next six months to make returns between the bullet and barbell equal. For example, a reading of 57 bps in the 5 over 2/10 cell means that we would only expect the 5-year to outperform the 2/10 if the 2/10 slope steepens by more than 57 bps during the next six months. Otherwise, we would expect the 2/10 barbell to outperform the 5-year bullet. Table 6Discounted Slope Change During Next 6 Months (BPs)
It’s All About Employment
It’s All About Employment
Appendix B: Excess Return Bond Map The Excess Return Bond Map is used to assess the relative risk/reward trade-off between different sectors of the US bond market. It is a purely computational exercise and does not impose any macroeconomic view. The Map’s vertical axis shows 12-month expected excess returns. These are proxied by each sector’s option-adjusted spread. Sectors plotting further toward the top of the Map have higher expected returns and vice-versa. Our novel risk measure called the “Risk Of Losing 100 bps” is shown on the Map’s horizontal axis. To calculate it, we first compute the spread widening required on a 12-month horizon for each sector to lose 100 bps or more relative to a duration-matched position in Treasury securities. Then, we divide that amount of spread widening by each sector’s historical spread volatility. The end result is the number of standard deviations of 12-month spread widening required for each sector to lose 100 bps or more versus a position in Treasuries. Lower risk sectors plot further to the right of the Map, and higher risk sectors plot further to the left. Chart 11Excess Return Bond Map (As Of May 28TH, 2021)
It’s All About Employment
It’s All About Employment
Ryan Swift US Bond Strategist rswift@bcaresearch.com Footnotes 1 For further discussion of how we assess the state of monetary policy vis-à-vis spread product please see US Bond Strategy Weekly Report, “Lower For Longer, Then Faster Than You Think”, dated May 25, 2021. 2 Please see US Bond Strategy Weekly Report, “That Uneasy Feeling”, dated March 30, 2021. 3 Please see US Bond Strategy Weekly Report, “A New Conundrum”, dated April 20, 2021. 4 Please see US Bond Strategy Weekly Report, “Searching For Value In Spread Product”, dated January 26, 2021. 5 Please see US Bond Strategy Weekly Report, “Making Money In Municipal Bonds”, dated April 27, 2021. 6 Please see US Bond Strategy Weekly Report, “Entering A New Yield Curve Regime”, dated May 11, 2021.
BCA Research’s US Equity Strategy service presents eight guiding principles of investing to successfully navigate the equity market: The Business Cycle Matters: The business cycle and macroeconomic conditions are the cornerstones of any investment…
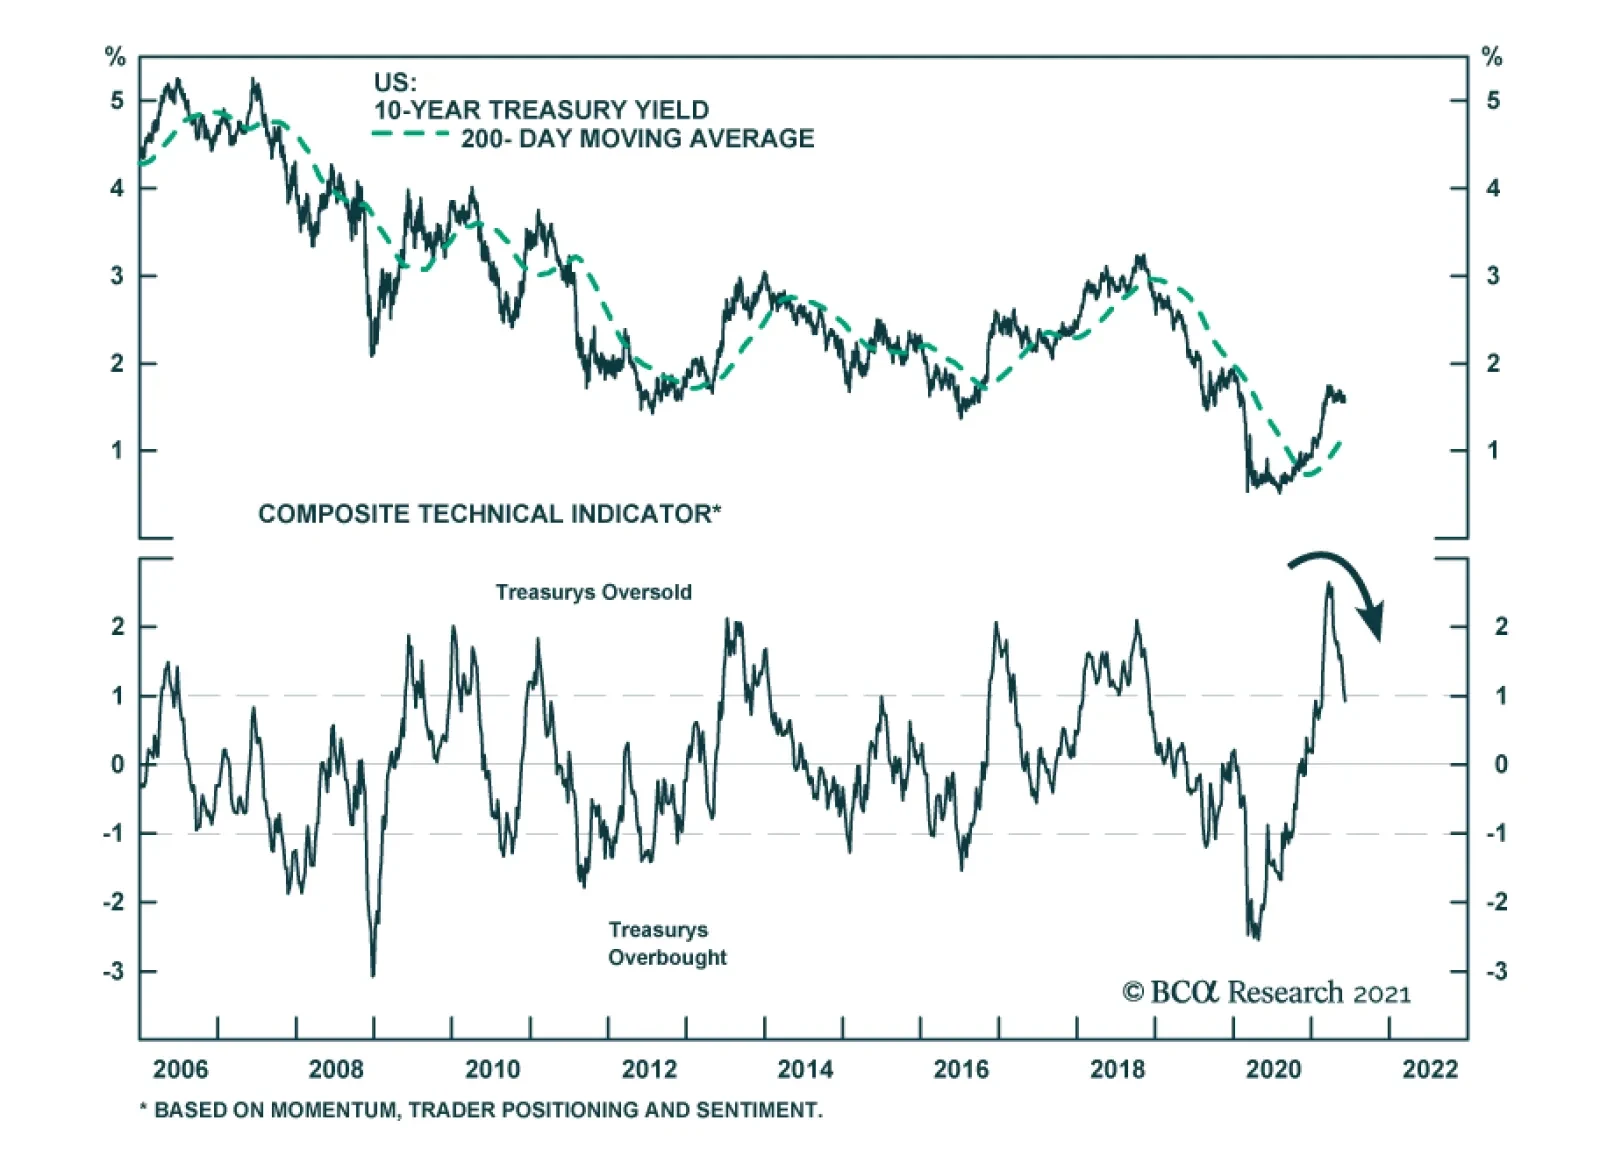
The 81-basis point increase in yields in Q1 pushed US 10-year Treasurys deep into oversold territory. This triggered a rally that brought yields down to 1.56% by mid-April. US government bonds have been in stasis since then, with the 10-year yield oscillating…
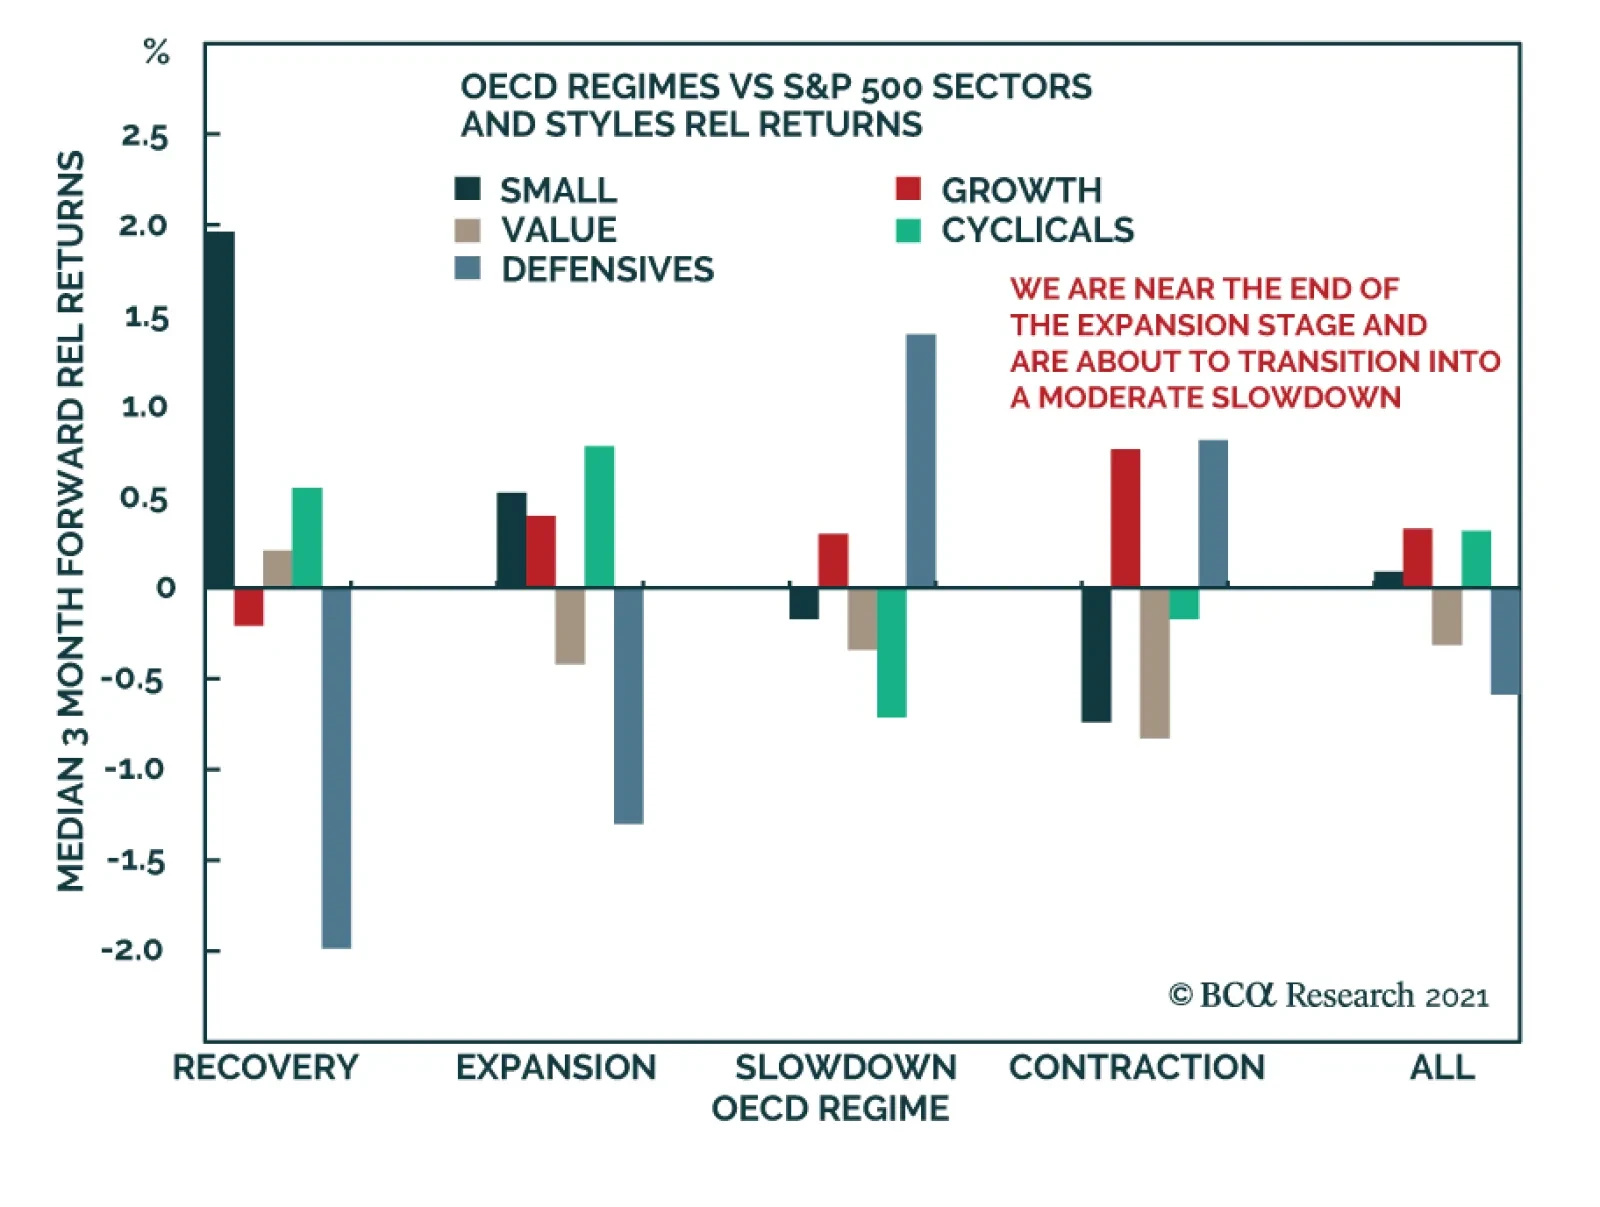
Dear Client, I am delighted to take charge of the US Equity Strategy publication upon Anastasios Avgeriou’s departure. By way of introduction, I have been an investor for nearly 20 years, with my career spanning both the buy and sell side, bottom-up stock selection and top-down asset allocation, and fundamental and quantitative approaches to investing. I have invested through two business cycles (starting on the third one now), watched the internet stock bubble burst, and seen grown men shedding tears on Bloomberg keyboards in the summer of 2008 – the market has a way of humbling us, mere mortals. As a result of these diverse professional experiences, I became an agnostic and don’t believe there is one correct way to invest as long as a thesis is well thought through and backed up by numbers and in-depth analysis. I believe that different approaches to investing, fundamental and quant, bottom up and top down, should complement each other leading to “best of all worlds” results. I also rely on an investment framework which is disciplined enough to offer a structure to fall back on to minimize behavioral biases, and yet is flexible to rapidly accommodate both “black swan” and “grey rhino” themes into investment decision-making. The following are the guiding principles of this investment framework. I hope this week’s publication will provide insights into my approach to investing and the nature of the US Equity Strategy product under my stewardship. I look forward to your feedback and suggestions. Kind Regards, Irene Tunkel Chief Strategist, US Equity Strategy Principle 1: The Business Cycle Matters The business cycle and macroeconomic conditions are the cornerstones of any investment decision as they underpin the fundamentals of most assets, and preordain the types of assets likely to outperform based on their level of risk and sensitivity to economic growth. Analyzing the stages of the business cycle is a succinct way to summarize a wide range of economic data, such as capacity utilization, growth, policy, credit conditions and valuation. Each business cycle is different, yet on average across all cycles, the stages have the following characteristics (Table 1). Table 1Business Cycle Is In Expansion Stage
Eight Principles Of Successful Equity Investing
Eight Principles Of Successful Equity Investing
Recovery: Policy is easy, and liquidity is plentiful, profits rebound but growth is scarce, inflation is low, risk aversion elevated, and stocks are still cheap. In this environment cyclicals, small caps and value outperform. Expansion: Policy is neutral, inflation is moderate, growth is abundant, risk aversion is low. During this phase it is cyclicals and small caps that shine. Slowdown: Inflation is higher, and policy is tightened, growth is rolling over, valuations are extended, and risk aversion is rising. In this environment of slowing growth, growth stocks, large caps, defensives and real assets outperform (Chart 1). Contraction: Deflation (or fears thereof) ensues, output is falling, growth is scarce and risk aversion is high. In this environment defensives, quality and highly profitable stocks rule the day. Chart 1Performance Of Equities In Different Stages Of Business Cycle
Eight Principles Of Successful Equity Investing
Eight Principles Of Successful Equity Investing
Although the pandemic is barely over, the markets have galloped through the recovery stage and have landed squarely in expansion territory. US equities exhibited exceptional earnings growth of 52.5% year-on-year in Q1-2021 on the back of economic reopening, fiscal and monetary stimulus, and pent-up demand. Monetary and fiscal policy remain easy. The only deviation from a textbook description of expansion is low capacity utilization and a high unemployment rate which persist as aftereffects of factors specific to the pandemic: School closures and elevated unemployment benefits. High unemployment whilst demand for labor is high triggered inflationary pressures. However, we believe that we are near the end of the expansion stage and are about to transition into a moderate slowdown. While growth is to remain robust, it is bound to slow modestly from its peak: The Manufacturing ISM PMI came down from 64.7 in April to 61.2 in June. According to Bloomberg consensus estimates GDP growth is to slow from 6.4% in 2021 to 4% in 2022. The Fed is starting to “talk about talking about tightening”, and with inflation elevated many expect somewhat hawkish rhetoric/intervention from the Fed sooner than the end of 2022. Valuations are rich. Now may be opportune time to reposition for a slowdown to be ahead of the game. To do well in a slowdown stage, which may last for months but by no means heralds the end of a bull market in equities, we recommend dusting off growth, large-cap and defensive stocks and taking profits in some of the recent cyclical outperformers. A barbell approach may do well at this point, with portfolio overweights in both cyclical sectors such as energy and industrials along with more defensive plays such as health care and technology Principle 2: Shocks And Transient Themes Trump Both Macro And Fundamentals Macro is important on the cyclical time horizon but, intra-cycle, it is transient themes and macro shocks that move markets. These themes, also known as “black swans” and “grey rhinos”, are exogenous shocks and developments that dominate investor psyche. Mostly, they are policy driven, like trade war or fiscal stimulus, but occasionally are force majeure events, like Covid-19. Transient themes may have a positive or negative effect on the market. These are news and developments that are not immediately priced by the market but are not to be ignored or dismissed: They dominate investment outcomes irrespective of the normal market order of things. Usually transient themes are short-lived and fade once macroeconomic and fundamental data have readjusted to the new reality: Economic and earnings growth estimates have been revised, and relevant stock and sector returns have absorbed the shock. Back in March 2020, neither fundamentals nor valuations mattered. Nor did macro. Stocks were first sledgehammered by a “corona” theme, and then soared on a “liquidity is abundant” theme. It took analysts three months to downgrade US GDP growth to contraction (Chart 2)! Over the past few months, the only theme that seemed to matter to market participants was inflation, and inflation alone. Implications? Fear of inflation and sooner-than-expected Fed tightening have triggered an energetic selloff in bonds and defensive/growth equities. However, there are early signs that this theme is beginning to fade with rates stabilizing and growth stocks rebounding (Chart 3). Chart 2Markets Take Time To Price In Shocks
Markets Take Time To Price In Shocks
Markets Take Time To Price In Shocks
Chart 3Inflation Fears Triggered Equity Rotation
Inflation Fears Triggered Equity Rotation
Inflation Fears Triggered Equity Rotation
Principle 3: Interplay Between Valuations And Fundamentals Once the macro backdrop and transient themes are well understood, we zoom in our analysis to the valuations and fundamentals of individual styles and sectors to select the most attractive opportunities. Ideally, we are looking for the reasonably priced sectors that have solid fundamentals and can deliver strong growth. Finding sectors like that is easier said than done: Rarely do good and cheap exist in the same incarnation. Hence, investors need to compromise: Buy cheap stocks with poor earnings growth and challenged fundamentals or pay a premium for solid growth. A classic value/growth dilemma. Our approach is as follows: Cheap Sectors: Relative valuations are very important: Most value investments are mean-reversion plays (Chart 4) We don’t attach much weight to fundamentals – we don’t expect a stellar balance sheet or earnings growth In order to screen out value traps, we are looking for a catalyst for mean reversion For cheap stocks valuations are more important than fundamentals. Expensive Sectors: Relative valuations are much less important than growth expectations and fundamentals. Are fundamentals continuing to improve or have they reached a peak? Is earnings growth about to accelerate or slow? If fundamentals, e.g. RoE or margins are improving, and a slowdown in growth is not expected, then the valuation premium is justified. Chart 4Value Is Mean Reverting
Eight Principles Of Successful Equity Investing
Eight Principles Of Successful Equity Investing
The software industry group is a case in point. Back in 2019-2020 valuations were eyewatering (more than two standard deviations above 10 years of history) but earnings growth was resilient, and profitability was in a multi-year upward trend. The valuation premium was justified. But late in 2020 RoE started deteriorating, and the industry group experienced a pullback. More recently, RoE has stabilized and turned. Returns are following (Chart 5). Chart 5Changes In Profitability Drive Valuations
Changes In Profitability Drive Valuations
Changes In Profitability Drive Valuations
Principle 4: Stock Markets Are Markets Of Stocks Understanding the behavior of individual stocks makes top-down sector and style selection much more informed and nuanced. After all, we are dealing not just with a stock market, but with a market of stocks. Those glued to Bloomberg screens in March 2020 may have noticed a rare green with companies like Zoom, Citrix and Amazon rallying amidst stock Armageddon. These were green shoots (no pun intended) of one the most vigorous stock market rallies in history. Paying attention to stock-level data also gave an early pointer that pandemic shutdowns, as awful as they were, would be a boon for selected technology and e-commerce sectors (Chart 6). At present, we notice that cyclicals have not outperformed defensives since March. We also notice over the past two-to-three weeks the comeback of hot technology stocks, many of which are former “Covid-19 winners”, beaten up by a “back-to-work rally”. These are fintech and e-commerce names such as PayPal, Pinterest and Peloton, some of which are more than 50% off from their February peak. Reversal in performance of growth stocks is a sign that rates have stabilized, inflation fears are overdone, and US economic growth is gradually slowing. Chart 6Covid-19 Winners Led S&P 500 Rebound
Covid-19 Winners Led S&P 500 Rebound
Covid-19 Winners Led S&P 500 Rebound
Principle 5: Markets Are Forward Looking As Warren Buffet succinctly put it “buy risky assets when there is blood in the streets”, and “be fearful [i.e., sell], when others are greedy.” In other words, it is important to anticipate turning points, and be one step ahead of the market. Last year’s rally is a case in point, with the S&P 500 delivering the best return in history despite not having much to show for it in terms of earnings growth, with nearly 70% of S&P 500 returns coming from multiple expansion. Investors looked past shutdowns, rightly believing that the profit recession is transitory, companies are in sound financial health, valuations are at abysmal, once-in-a-lifetime, levels, and the V-shaped recovery will ensue once the pandemic is over (Chart 7). Chart 7Stocks Returns Lead Earnings
Stocks Returns Lead Earnings
Stocks Returns Lead Earnings
Conversely, the Q1-2021 earnings season was stellar, but many stocks, even those which exceeded expectations, have ceded gains: Stocks are priced to perfection, and investors concluded that, for some of them, the best days are behind, and growth is slowing (Chart 8). At present, trailing valuations of nearly all sectors and styles in the S&P 500 are at extreme levels, trading at 36x trailing earnings. However, forward PEs are on average 9 points lower, around 21x forward earnings. Hope is that the stock market will rerate and grow into its big shoes within the next 12 months with expected EPS growth of 23%. We think it will! Chart 8During Q1-2021 Earning Season, Beats Were Not Rewarded
During Q1-2021 Earning Season, Beats Were Not Rewarded
During Q1-2021 Earning Season, Beats Were Not Rewarded
Principle 6: Asset Prices Respond To The “Second Derivative” This principle is a corollary to “markets are forward looking”. Usually the rate of growth is already priced in, as markets are efficient and new information arrives as a change in expected growth, i.e. the impulse. Change in the growth outlook is absorbed by the markets and is a leading indicator of turning points in equity returns. Most often the impulse relates to change in economic or earnings growth expectations. For example, sales for the hotels industry group are still falling, but at a lower rate than before (the second derivative is improving). These “less bad” numbers are enough to send hotels returns soaring (Chart 9). Chart 9Hotels Are Rallying On “Less Bad” Sales
Hotels Are Rallying On “Less Bad” Sales
Hotels Are Rallying On “Less Bad” Sales
Principle 7: Thematic Investing: Channeling Cathie Woods Thematic investing is really “smart” momentum investing, but its appeal lies in being able to identify a theme/catalyst that unites stocks and makes them move in unison. Knowing a theme behind momentum helps one to understand its thematic drivers and anticipate turning points. Arguably, thematic investing is a nuisance for stock pickers, but a boon for top-down investors: Identifying a theme has a higher impact on portfolio returns than choosing the individual stocks to represent it. For example, identifying recovery in air travel and investing into the Jets ETF is a more important decision than choosing the right airline stock. Since February 2020, American Airlines is 94% and Delta is 98% correlated with Jets ETF (Chart 10). Knowing the drivers, we can brainstorm what can trigger a reversal of this theme, for example: An increase in the price of oil, a structural shift in business travel, falling consumer confidence, and a high household dissaving rate. Thematic investing is popular as it allows an investor to ride the momentum yet also be equipped to anticipate turning points. Chart 10Air Travel Stocks Are Highly Correlated
Air Travel Stocks Are Highly Correlated
Air Travel Stocks Are Highly Correlated
Thematic investing may be over a variety of investment horizons (stocks benefitting from retirement of baby boomers being an example of a structural theme versus stocks benefitting from post-corona supply-chain disruption being (hopefully) a short-lived theme). Further, themes can be high tech, such as autonomous driving or green energy, and low tech, such as the pandemic “puppy boom”. The most prominent and widely discussed themes in the recent months are “Covid-19 winners” vs “back to work”. Arguably, thematic investing is the “passive investing” of the future – a trend illustrated by the popularity of the ARK funds managed by Cathie Woods. Going forward, the US Equity service will be covering investment themes in a series of Special Reports. Principle 8: “No Country Is An Island” Lastly, while the focus of this publication is squarely on the US equity market, it is important to keep an eye on developments in the rest of the world. Companies in the S&P 500 derive 43% of sales from abroad. As a result, corporate earnings are highly sensitive to the direction of the trade-weighted dollar both due to the price of goods and to translation effects. Recent depreciation of the dollar will boost corporate earnings growth, especially for the technology (58% of earnings outside the US), materials (56%) and energy (50%) sectors. It takes roughly three to six months to fully absorb dollar moves into sales growth (Chart 11). Further, the economic growth rates of the major US trading partners, i.e., Europe, Mexico, Canada, and China, also have a profound effect on the US economy with transmission through the US trade balance, dollar movements and Treasury yields (Chart 12). Chart 11US Dollar Drives S&P 500 Sales
US Dollar Drives S&P 500 Sales
US Dollar Drives S&P 500 Sales
Chart 12Major US Trading Partners Affect US Economy
Major US Trading Partners Affect US Economy
Major US Trading Partners Affect US Economy
Bottom Line Markets are complex: Macro works until it does not, expensive stocks can be a good investment, and an equity rally may take off in the midst of an earnings recession. Yet, we believe that the eight principles of investing that we have outlined above will guide us through the noise and help successfully navigate equity markets. Irene Tunkel Chief Strategist, US Equity Strategy irene.tunkel@bcaresearch.com
Highlights Economy – Following a recession like no other, American households are flush with cash: Since COVID-19 broke out last March, real disposable income has grown at its fastest 14-month rate ever, the S&P 500 is 24% above its pre-pandemic peak and home prices are up 14%. With social distancing measures hindering consumption as income rose, savings have exploded. Markets – If the cash is spent in line with economists’ expectations, corporate profits should have little trouble topping undemanding targets: The bottom-up consensus forecast for nominal earnings contraction over the rest of the year is incompatible with real GDP growth forecasts of nearly 7%. Strategy – Stick with equities unless the Fed changes its tune: Multiple contraction looms as the main threat to equities over the next twelve months, and a shift in Fed policy is the most likely de-rating catalyst. As long as Powell and company stay the course, we will too. Feature BCA researchers’ mission is simple. We analyze the world’s major economies for insight into where financial markets are headed. On the US Investment Strategy team, we primarily use the US economy to anticipate the future direction of US equity and bond markets. Our market take drives our investment strategy views and asset allocation recommendations. With this Strategy Report, we are tweaking the format of our written output to align more clearly with our mission. We will highlight the most relevant economic takeaways and link them to expected market outcomes, with our strategy recommendations following from the forecasted outcomes. To provide more detail than US Investment Strategy’s legacy overweight/equal weight/underweight asset allocation recommendations, we will add a multi-asset ETF portfolio linking our cyclical views to specific ticker symbols. We are at work on our cyclical portfolio and will unveil it sometime over the next month. One Fantastic Recession If a visitor from space had touched down at the beginning of 2020 and spent the subsequent seventeen months boarding in an American household, he/she/they might ask why recessions have gotten such a bad rap. Savings piled up as fiscal transfers swelled household income while social distancing measures curtailed spending. Wealth got an additional boost from surging stock and bond markets and a potent rally in home prices. Put it all together, and households are on much firmer footing today than they were when the pandemic began to assert itself last March. As a first-time visitor, the space traveler may not appreciate that the pandemic recession was sui generis thanks to the unprecedented policy measures undertaken to limit its damage. For the first time in 51 years (seven recessions ago), the rate of nominal disposable income growth accelerated during a recession (Chart 1). In real terms, the pandemic period has been the best fourteen-month stretch for disposable income growth in the 70-year history of the series, reaching a level three standard deviations above the mean (Chart 2). Lavish fiscal transfers in the form of direct payments to over three-quarters of all households (Chart 3, top panel) and supplemental benefits to the unemployed (Chart 3, middle panel) cushioned the blow that would typically result from economic contraction and soaring unemployment. Chart 1Uncharacteristic Growth In Nominal Income ...
Uncharacteristic Growth In Nominal Income ...
Uncharacteristic Growth In Nominal Income ...
Chart 2... And Unprecedented Growth In Real Income
... And Unprecedented Growth In Real Income
... And Unprecedented Growth In Real Income
Chart 3No Adult Left Behind
A Recession Like No Other
A Recession Like No Other
So far, the consequence of the policy measures has been to limit the decline in output (real 4Q20 GDP was 2.4% below its 4Q19 level, or about 4.4% below trend) and stave off a self-reinforcing wave of defaults that would have limited credit availability and hampered future growth. Going forward, the potential for households to spend some of the $2.3 trillion mountain of excess savings they’ve accumulated since March 2020 (Table 1) should turbo-charge growth across the rest of the year and keep it well above trend in 2022. Excess pandemic savings will be the primary spending driver, but equity gains (Chart 4, top panel) and home price appreciation (Chart 4, bottom panel) will help at the margin. All in all, savings and increases in financial asset and real property prices have driven an unprecedentedly rapid increase in household net worth as a share of GDP (Chart 5), feeding a remarkable buildup of dry powder to support a surge in consumption. Table 1A Great Recession For Household Savings ...
A Recession Like No Other
A Recession Like No Other
Chart 4The Recession That Was Good For Asset Prices
The Recession That Was Good For Asset Prices
The Recession That Was Good For Asset Prices
Chart 5The Pandemic Recession Did Wonders For Households' Relative Standing
The Pandemic Recession Did Wonders For Households' Relative Standing
The Pandemic Recession Did Wonders For Households' Relative Standing
What Does GDP Growth Have To Do With Equity Returns? There’s a good reason why Treasury investors pay much more attention to GDP releases than equity analysts and PMs: S&P 500 returns have no near-term relationship with GDP moves. Corporate revenue growth ought to converge with the economy’s nominal growth rate over time, however, so future GDP moves could inform the future direction of S&P 500 earnings. With all the fuel households have stored up for consumption once the economy fully reopens, consensus forecasts are calling for blockbuster growth over the final three quarters of the year and solidly above-trend growth in 2022 (Table 2). Though BCA does not make economic point forecasts, we concur with the direction and magnitude of the consensus view. The top-down forecast of red-hot economic growth is seemingly incompatible with bottom-up analysts’ consensus forecast of a decline in the run rate of S&P 500 earnings. With 495 constituents having reported, calendar first quarter S&P 500 earnings are projected to come in at $49 per share. Absent seasonal adjustments, $49 equates to an annualized run rate of $196 per share. Analysts are calling for a nearly 10% sequential decline in earnings in the second quarter, to $44.49, third quarter earnings that fall about 4% shy of their first quarter level, and meager 1% and 2% increases over 1Q21 in 4Q21 and 1Q22, respectively (Table 3). Table 2Economists Predict Explosive GDP Growth ...
A Recession Like No Other
A Recession Like No Other
Table 3... But Analysts Foresee Declining Earnings ...
A Recession Like No Other
A Recession Like No Other
The key takeaway is that analysts expect the sum of the next four quarters of S&P 500 earnings to fall short of the first quarter’s annualized run rate. That is an unusual development in a series that has averaged double-digit expected forward growth over its 42-year life and had previously only called for earnings to shrink on three instances during the Carter Administration (Chart 6). We are in accord with widely held expectations that the economy’s sequential growth rate will peak in the second quarter and fully expect that sequential earnings growth will decelerate from the last three quarters’ torrid pace. Outright contraction, however, strikes us as highly unlikely when the economy is growing at the fastest sustained rate we expect to see over the rest of our lifetime. Chart 6... For The First Time In Four Decades
... For The First Time In Four Decades
... For The First Time In Four Decades
Investment Strategy We view equity prices as the product of expected earnings and the multiple investors will pay for those earnings. Holding the index price-earnings (P/E) multiple constant, the S&P 500 will rise if earnings beat expectations and that beat feeds into upward revisions in future estimates or fall if they disappoint, leading to downward revisions. We expect that the S&P’s constituents will beat current expectations over the next four quarters, which simply require them to run in place. Earnings growth should not be too hard to come by when the economy is expected to expand at a 7% pace – three-and-a-half times its trend rate of growth – over the rest of 2021. That leaves the multiple investors are willing to pay for those future earnings as the swing factor. If earnings are the stolid fundamental component of equity investing, P/E multiples are the animal-spirits wild card. The current 22 multiple is expensive relative to history and potential de-rating is the biggest risk confronting equity investors (Chart 7). Chart 7Equity Multiples Are Elevated
Equity Multiples Are Elevated
Equity Multiples Are Elevated
The key question is what will trigger a de-rating and when. We expect that monetary policy tightening will be the most likely catalyst and are therefore keeping a close eye on the Fed as we formulate our strategy. Our US Bond Strategy colleagues have stressed that the Fed will not hike rates until all three of its criteria (Table 4) are met. With the economy seemingly much closer to checking the inflation boxes, “maximum employment” is poised to be the final hurdle standing in the way of rate hikes. Table 4A Checklist For Liftoff
A Recession Like No Other
A Recession Like No Other
We did not view the May employment situation report, released before Friday’s open, as materially changing the timeframe for attaining maximum employment. Though bond, currency and equity markets saw the approximate 100,000 March-May payrolls miss as a cue to reprice their Fed assumptions, the report fit the broad contours that we expect to remain in place over the next year: the labor market will revive as the services sector fully reopens and the restoration of child care and elder care services free those sidelined by family obligations to return to work. There are still more than 7.5 million fewer people working than there were before the pandemic (Chart 8). If payrolls expand at an average monthly clip of 500 to 750 thousand, employment progress will support tapering in the winter of 2021-22 and an initial rate hike before the end of 2022. Chart 8Still 7.6 Million People To Re-employ
Still 7.6 Million People To Re-employ
Still 7.6 Million People To Re-employ
We do not see the sure-to-be-well-telegraphed tapering of the Fed’s asset purchases as posing a threat to equity multiples. Our first-hike-in-2022 timetable is ahead of the market’s but we do not expect meaningful de-rating over the next twelve months while investors of every stripe are stuffed with cash. If the rate-hike timetable accelerates because of unexpectedly strong growth, S&P 500 earnings estimates will have to rise to reflect it. We would expect that “numerator effect” to fully offset increases in the discount rate denominator used to the calculate the present value of expected future cash flows, as periods of rising real rates have typically been associated with better equity performance than periods of falling real rates.1 Equities would be in trouble if rates were to take off because of runaway inflation expectations rather than rising real growth. In that scenario, the future-cash-flows numerator would not be able to keep up with the rising-discount-rate denominator and it could even fall outright as profit margins were squeezed. We are continuously monitoring our inflation checklist and are vigilant for signs of enduring inflation pressures. The bottom line is that the potential emergence of inflation pressures, and the Fed’s reaction to them, are the biggest imminent threat to forward earnings multiples and equity performance. As long as the inflation coast is clear and the Fed is able to stand pat, abiding by last summer’s revised statement of long-run policy goals, we will stick with our equity overweight. Postcard From The High Street The Harry Potter store filling 20,000 square feet of retail space between Broadway and Fifth Avenue just below 22nd Street had its grand opening on Thursday. The Peta children’s attempt to visit the store on its first day came to no avail, however, as they encountered late-afternoon switchback lines around the building. Scattered showers were not enough to dampen would-be shoppers’ enthusiasm, some of whom claimed to have been waiting for six hours.2 The event highlighted two themes from last week’s Special Report: brick-and-mortar retail has not yet given up the ghost and the post-COVID period in the United States, marked by a desire to congregate, celebrate and spend, appears to have arrived. The near-term growth implications are favorable. Doug Peta, CFA Chief US Investment Strategist dougp@bcaresearch.com Footnotes 1 Please see US Investment Strategy Special Report "When Will Higher Rates Hurt Stocks?" dated September 24, 2018, available at usis.bcaresearch.com 2 Harry Potter fans wait hours in the rain for NYC store opening (nypost.com)
Friday’s US employment report was another miss. Nonfarm payroll employment increased by 559 thousand in May, below the anticipated 675 thousand. Moreover, the labor force participation rate ticked down to 61.6% from 61.7%. Thus, the 0.3 percentage point…
The DXY weakened following Friday’s disappointing Employment Report release, pushing the index towards 90 – near the critical technical level of 89. The dollar’s move suggests that weaker than expected job gains caused investors to adjust their Fed…