United States

Highlights Portfolio Strategy The rising shadow fed funds rate and related flattening of the yield curve, eerie similarities with the 2009/10 episode, overbought technicals, and extended sector breadth, all signal that financials are due for a breather. Downgrade to neutral and lock in relative gains of 20% since inception. Early signs of housing related euphoria turning into consternation, lack of an overall bank credit impulse, relative share price overbought conditions, a looming increase in bank non-performing loans as government spending programs are set to expire in the autumn, will more than offset compelling bank valuations and rising interest rates. Trim the S&P banks index to underweight. Recent Changes We trigger our downgrade alert and trim the S&P financials sector to neutral today cementing gains of 20% since inception. Downgrade the S&P banks index to underweight today. Table 1
Litmus Test
Litmus Test
Feature Following the 9/11 attacks, the great Alan Abelson of Barron’s “Up And Down Wall Street” column, eloquently wrote: “The market is a mechanism for allocating capital and, of course, making us all rich. What it most decidedly isn't is a forum for venting civic sentiment. To equate buying stock with patriotism or selling stock with a lack of patriotism is balderdash, the equivalent of praising or damning a thermometer for the temperature it records (emphasis ours).” This last part of the quote has been with me ever since, and is relevant today in the context of rising inflation, the related further bond market selloff and the equity market’s looming reaction to it. Currently, one cannot blame the stock market for not really caring about inflation as it is the equivalent of blaming mercury-in-glass for taking the temperature. However, the Fed’s tapering of asset purchases is coming later this fall and there will be a market shakeout before the SPX reaches a new equilibrium, likely 10% lower than current levels. Over the past few weeks we highlighted ten reasons to lighten up on equities and five technical reasons not to chase equities higher in the near-term. Today we reiterate our short-term cautiousness on the prospects of the stock market and below is a detailed reminder of our thesis. Fourteen months ago we penned a report titled “20 Reasons To Buy Equities” and now that the SPX is up 2,000 points since that trough, the risk/reward tradeoff is to the downside and we are compelled to book gains and raise some cash. On May 3 we upgraded health care to overweight and added some defensive exposure to our portfolio and last week we highlighted five technical reasons not to chase equities higher in the near term. What follows are 10 reasons to lighten up on stocks and therefore await a better entry point to deploy fresh capital later this summer: 1. The Fed and other developed global central banks’ easing has reached a peak. In fact, taper has started at the BoC and the BoE announced a quasi-taper, the ECB is rumored to commence decreasing asset purchases this summer and the Fed will likely taper by yearend (Chart 1). 2. US fiscal easing has also hit an apex and a large fiscal cliff looms in 2022 a mid-term election year (Chart 2). Chart 1Yellow…
Yellow…
Yellow…
3. The bulls have taken full control of the equity market and our Risk Appetite Indicator recently touched the four standard deviations line (Chart 2). 4. The ISM manufacturing survey peaked near 65 and the non-manufacturing hit an all-time high (Chart 2). Chart 2…Flags…
…Flags…
…Flags…
5. China’s is in a slowdown mode and BCA’s total social financing projections indicate a further deceleration in the back half of the year (Chart 1). 6. Equity market internals have been signaling trouble since February, warning that this bifurcated market is in desperate need of a breather (Chart 3). 7. The VIX in mid-April had a 15 handle for the first time since early last year, warning that investors are complacent (Chart 3). 8. Similarly, the junk bond option adjusted spread is at cyclical lows, and financial conditions are as good as they get probing all-time lows (Chart 2). 9. SPX profit growth is slated to jump 34% in calendar 2021, according to the latest I/B/E/S estimates with EPS on track to hit an all-time high level of $188 (Chart 3). 10. Finally, valuations remain lofty with the forward P/E ratio hovering near 21 an historically high level (Chart 3). Bottom Line: The easy money has been made since the March 23, 2020 trough when the SPX was 2,000 points lower. Our sense is that the next 10% move in the SPX is lower (close to 3,800) rather than higher and a healthy and much needed reset looms. Thus, we recommend investors book some gains, raise some dry powder and be prepared to deploy fresh capital later this summer. This week we take profits on an early cyclical sector and trim to neutral, and downgrade one of its key industry groups to underweight. Chart 3…Waving
…Waving
…Waving
Don’t Overstate Your Welcome In Financials Last November, we boosted the S&P financials sector to overweight as soon as we could following the Pfizer/BioNTech COVID-19 vaccine efficacy news, and since then this interest rate-sensitive sector has bested the SPX by 20%. Our sense is that the easy money has been made on this position and today we recommend investors lock in profits and downgrade exposure to neutral. There are a few reasons why we are compelled to monetize our handsome gains accrued over the past six months. First, this is a hedge to our rising inflation view, and we would rather stick to overweighting energy and industrials as ways to express our inflation protection theme as opposed to maintaining an above benchmark allocation in financials. The second part of our inflation Special Report on May 10 also warns against hiding in financials during bouts of inflation, further cementing our view of booking these significant relative gains for our portfolio. Second, the Fed’s easing cycle has reached a zenith and at the margin this will weigh on relative financials profits (fed funds rate shown as a year-over-year change and on an inverted scale, bottom panel, Chart 4). The shadow fed funds rate (courtesy of Leo Krippner)1 has troughed and is closing in on the zero line (shadow fed funds rate shown inverted, middle panel, Chart 4). Using the 10-year/shadow fed funds rate yield curve also signals that the yield curve may have peaked already, at least for this early part of the business cycle (top panel, Chart 4). Chart 4Don’t Overstay Your Welcome
Don’t Overstay Your Welcome
Don’t Overstay Your Welcome
Chart 5Gruesome Parallel
Gruesome Parallel
Gruesome Parallel
Third, typically, financials explode right out of the gate following a recession and if we use 2009/10 as a close parallel then there are high odds that financials stocks are entering a rather gruesome period as far as relative returns are concerned. Chart 5 plots relative share prices and has aligned the November 2020 bottom with the March 2009 trough. Early in the year, we posited that the SPX was following the 2009/10 episode to the tee and if history at least rhymes, financials are also in for a rude awakening. Fourth, technicals are overbought and near a level that has marked previous easing off phases in relative share prices (second panel, Chart 6). Moreover, breadth is as good as it gets: not only are the number of financials subgroups trading higher than their 40-week moving average glued to the 100% ceiling, but also earnings breadth has nowhere to go but down (third & bottom panels, Chart 6). However, we refrain from turning outright bearish on this early-cyclical sector as valuations remain bombed out and provide a large enough cushion to absorb any shocks (Chart 7). Chart 6Overstretched…
Overstretched…
Overstretched…
Chart 7…But Undervalued
…But Undervalued
…But Undervalued
In sum, the rising shadow fed funds rate and related flattening of the yield curve, eerie similarities with the 2009/10 episode, overbought technicals, and extended sector breadth, all signal that financials are due for a breather. Bottom Line: We trigger our downgrade alert and crystalize gains in the S&P financials sector of 20% since inception and downgrade exposure to neutral, today. Shy Away From Banks We execute our downgrade in the S&P financials sector to neutral by trimming the S&P banks index to a below benchmark allocation. Investors can treat this downgrade as a hedge to our oil & gas exploration & production and rails overweights, as well as a hedge against a failure of inflation rising further in the coming months. Importantly, there are clear elements of cooling in the red-hot housing market. Housing starts and permits came off the boil last week and failed to live up to economists’ upbeat expectations. Lumber is getting clobbered and entered a bear market having first surged to five standard deviations above its five decade mean. Moreover, the latest news from the University of Michigan survey of consumers’ sentiment on buying conditions for houses (top panel, Chart 8) made for grim reading, signaling that a key bank loan category, mortgage credit, is in for a rough summer/fall season. Chart 8Is Housing Cresting?
Is Housing Cresting?
Is Housing Cresting?
Tack on the nosedive in mortgage applications for purchasing a new home courtesy of rising mortgage rates, albeit from a low base, and factors are falling into place for an underperformance phase in banks (bottom panel, Chart 8). Were it only for housing related credit, we would overlook it as a single yellow flag. However, our credit impulse diffusion indicator – gauging the eight credit categories that the Fed tracks – is sinking like a stone, especially on a 13- and 52-week basis (Chart 9). Such broad based weakness warns that organic growth in bank profits (as opposed to buybacks) will be hard to come by in the coming quarters. Stimulus checks and a sharply rising fiscal deficit have served as a shot in the arm for consumers, businesses, landlords and banks, and have kept the economy going. However, as these liquidity taps dry out come autumn, it will be more difficult to continue to kick the proverbial can down the road. In other words, delinquency rates should tick higher and further infect non-performing loans (Chart 10). Granted, banks had provisioned aggressively last year and have been releasing reserves of late, but at the margin this will likely prove a net negative for their earnings. Chart 9No Credit Pulse
No Credit Pulse
No Credit Pulse
Chart 10NPLs On The Rise
NPLs On The Rise
NPLs On The Rise
Two additional words of caution. First, cyclical momentum is as good as it gets for relative share prices. Banks have run too far too fast and a lot of the good news is already baked in as the middle panel of Chart 11 highlights. Second, while valuations remain bombed out, it is worrisome that banks have failed to make any real progress on narrowing the gap between ROE and P/B metrics since the GFC, unlike following the Savings & Loans and 9/11 catalyzed recessions (bottom panel, Chart 11). The implication is that banks are a value trap rather than a value opportunity. Finally, one key risk to our modestly bearish bank undertone, is the US 10-year Treasury yield. Relative bank performance and interest rates have been joined at the hip since the GFC aftermath as the Fed anchored short rates on the zero lower bound, thus shifting the sensitivity of bank profits to the long end of the curve versus the shape of the curve. If interest rates started galloping higher investors would initially seek the “safety” of bank earnings that would get a fillip from rising net interest margins and put our negative bank view offside (Chart 12). Chart 11Highest Momentum Since the GFC, But Valuations Are Nonresponsive
Highest Momentum Since the GFC, But Valuations Are Nonresponsive
Highest Momentum Since the GFC, But Valuations Are Nonresponsive
Chart 12Risks To Monitor
Risks To Monitor
Risks To Monitor
Netting it all out, early signs of housing related euphoria turning into consternation, lack of an overall bank credit impulse, relative share price overbought conditions, a looming increase in bank non-performing loans as government spending programs are set to expire in the autumn, will more than offset compelling bank valuations and rising interest rates. Bottom Line: Trim the S&P banks index to underweight, today. The ticker symbols for the stocks in this index are: BLBG: S5BANKX – JPM, BAC, C, WFC, USB, PNC, TFC, FRC, FITB, SIVB, KEY, MTB, RF, CFG, HBAN, CMA, ZION, PBCT. Anastasios Avgeriou US Equity Strategist anastasios@bcaresearch.com Footnotes 1 https://www.ljkmfa.com/test-test/international-ssrs/ Current Recommendations Current Trades Strategic (10-Year) Trade Recommendations
Overdose?
Overdose?
Size And Style Views February 24, 2021 Stay neutral cyclicals over defensives January 12, 2021 Stay neutral small over large caps June 11, 2018 Long the BCA Millennial basket The ticker symbols are: (AAPL, AMZN, UBER, HD, LEN, MSFT, NFLX, SPOT, ABNB, V). January 22, 2018 Favor value over growth
Highlights Inflation is on everyone’s mind, … : Inflation has been a hot topic in our meetings with clients and in internal BCA discussions, but it has lately broken out among businesses and the general public. … but investors are mainly concerned with what it means for markets, … : When clients ask if and when inflation could become a problem, they really want to know if and when they should be repositioning their portfolios to prepare for it. … which ultimately brings the discussion back to the Fed: Inflation sensitivities vary among (and within) asset classes, but risk assets as a whole fare much worse when monetary policy settings are tight than when they are easy. If rising inflation drives the Fed to impose restrictive monetary policy, it will bring the curtain down on the equity bull market. Feature Inflation has been a hot topic with clients, for the internet-equipped public (Chart 1) and within BCA, where our latest monthly view meeting was entirely devoted to it. Client questions have addressed three broad themes: Chart 1Trending
Trending
Trending
What constitutes too much inflation? How will you know too much inflation is on the way? How soon could too much inflation arrive? Economists have yet to establish exactly where inflation comes from and their attempts to build models that anticipate it have been woefully unsuccessful. The problem may be that prices are set at the micro level by a confluence of innumerable individual interactions. Just as Hayek pointed out that no top-down committee could determine how to allocate resources efficiently without the signals provided by prices, it’s fiendishly difficult to try to divine their aggregate future direction from macroeconomic inputs. Even if we can’t build an airtight model predicting consumer price moves, however, we can systematically assess several known contributors to inflation to try to gain some advance notice into its movements. Obtaining that advance notice is of great practical significance in the current market environment. In a Goldilocks-and-the-two-tails world where widespread vaccinations have rendered the too-cold left-tail outcome increasingly unlikely, overheating is the only obstacle to the potent-growth/easy-policy backdrop that would be just right for equities and other risk assets over the next twelve months. Troublesome inflation seems to be the only factor that could get the Fed to back off of its pledge to maintain ultra-easy monetary policy for an extended period and we see it as the biggest threat to the equity bull market. We are therefore introducing our inflation checklist and expect to revisit it regularly over the rest of the year and into 2022. It reveals what we’re watching to monitor inflation and how, with some interpretive discretion, we’ll know if it’s poised to break out. It will also allow US Investment Strategy readers to follow along with our thinking in real time. As long as the checklist does not point to a meaningful, persistent move higher in consumer prices, we will likely continue to be constructive on the prospects for financial markets and the economy. Checklist Design Table 1Inflation Checklist
Tracking Inflation
Tracking Inflation
Our inflation checklist (Table 1) tracks price pressures in five broad categories: Labor Market Indicators, Price Indexes, Pipeline Pressures, Inflation Expectations and the Fed’s Reaction Function. We do not have a hard-and-fast scale of the categories’ relative importance, but we are especially alert to signals from the labor market and changes in inflation expectations. It will be hard to achieve persistently uncomfortable inflation readings without an upward inflection in the pace of wage growth and we do not see wage growth getting traction until inflation expectations rise enough to push workers to agitate for it. As we have previously stated, we do not think that core US inflation measures can break out of the range that has held them in check for three decades unless workers, households and businesses adopt a new inflation mindset (Chart 2). Chart 2Volcker's Gift
Volcker's Gift
Volcker's Gift
We do not have a pre-determined rule for how many X’s it will take to signal that policy-altering inflation is on the way. Nor do we have pre-conceived notions about the various combinations of red flags that would herald the onset of a new inflation regime. The purpose of the checklist is to establish a consistent analytical framework for assessing the future direction of inflation and its impact on monetary policy settings. Interpreting the output of that framework will require judgment and we mean to maintain our flexibility in exercising it. The State Of The Labor Market The Phillips Curve, which posits an inverse relationship between unemployment and inflation, has fallen into disrepute with investors. Even the Fed has distanced itself from it, announcing last summer that it would no longer pursue a strategy of pre-emptively tightening policy when the labor market begins to heat up. Asserting that wage growth is inversely related to the unemployment rate simply applies the law of supply and demand to the labor market, and we have no problem with it, although it should be noted that the relationship is not linear. Wages only reliably rise once unemployment breaks below a minimum threshold level, such as NAIRU, the natural rate of unemployment (Chart 3). Chart 3The Unemployment Gap Matters For Wage Growth
The Unemployment Gap Matters For Wage Growth
The Unemployment Gap Matters For Wage Growth
With that empirical relationship in mind, the category's components consider the available supply and utilization of labor inputs; demand for labor; and wage growth, which should reveal something about the current supply-demand balance. The 61.7% labor force participation rate remains far short of its 63.4% pre-pandemic level (Chart 4, top panel) while the prime-age employment-to-population ratio remains below its trough level of the two recessions that preceded the global financial crisis (Chart 4, bottom panel), making it clear that labor supply is still constrained. Chart 4A Lot Of Workers Are Still Idle ...
A Lot Of Workers Are Still Idle ...
A Lot Of Workers Are Still Idle ...
Labor demand, on the other hand, is at levels topping the cyclical peaks of the last 20 years, according to the share of small businesses reporting job openings in the NFIB survey (Chart 5, solid line) and job openings as a share of total employment as reported by the Department of Labor’s Job Openings and Labor Turnover Survey (Chart 5, dashed line). One would expect that the combination of raging demand and constrained supply to lead to higher wages, yet the top wage measures remain quiet (Chart 6). We expect they will until the prime-age employment-to-population ratio starts to make a run at recovering its pre-pandemic level (Chart 7). Chart 5... Even Though Employers Are Looking For Help
... Even Though Employers Are Looking For Help
... Even Though Employers Are Looking For Help
Chart 6Wage Growth Remains Subdued
Wage Growth Remains Subdued
Wage Growth Remains Subdued
Chart 7The Labor Market Still Has A Lot Of Slack
Tracking Inflation
Tracking Inflation
The bottom line is that the labor market is starkly bifurcated as vividly illustrated by the Atlanta Fed’s Labor Market Distributions spider chart (Chart 8). On the demand dimensions on the right side of the chart, the labor market is far ahead of where it was at the end of the last two expansions, but far behind on the supply dimensions at the top and bottom left and wages in the middle left. For now, we tick only the Labor Demand box, as it is the only element of the labor market that is back to full health. We expect that shadow supply, which will likely be released in earnest upon next term’s return of in-person instruction in schools across the country and the expiration of unusually generous unemployment insurance benefits, will keep wages from rising much higher until it is fully absorbed. Chart 8A Tale Of Two Markets
Tracking Inflation
Tracking Inflation
Price Indexes The Fed’s preferred core PCE index remains in check, along with the headline PCE index (Chart 9, top panel), but the more widely followed CPI surprised to the upside in April (Chart 9, bottom panel), especially in month-over-month terms, with the headline index rising 0.8% and the core index rising 0.9% for its largest gain in 39 years. Last week’s report dove into the details of the core CPI print and concluded that it was driven by extreme outliers in a handful of categories that are unlikely to be sustained.1 The magnitude of the upside surprise nonetheless leaves us no choice but to check the Marquee Indexes box until the sequential increases settle down. Chart 9CPI Took Off In April
CPI Took Off In April
CPI Took Off In April
The message from more refined measures like trimmed-mean CPI and PCE is more encouraging (Chart 10). Trimmed-mean indexes are akin to the Olympic judging method in which the top and bottom scores are discarded, and their proponents argue that they provide a truer measure of core inflation than the static series which exclude every food and energy category every month. The trimmed-mean CPI and PCE series are well behaved and suggest that the inflation genie has not yet gotten out of the bottle. Chart 10Outliers May Be Skewing The Core Indexes ...
Outliers May Be Skewing The Core Indexes ...
Outliers May Be Skewing The Core Indexes ...
Pipeline Pressures Price increases across the commodity complex have drawn inflation watchers’ attention. Prices at the pump loom large in consumers’ perceptions of inflation and commodities are inputs in a range of manufactured goods; if manufacturers are able to pass price increases onto end users, commodity price increases may find their way into end-product prices. The BCA pipeline inflation indicator rolls the CRB raw industrials index, the ISM survey’s prices paid and supplier delivery time components, overtime hours worked and capacity utilization into a single measure that has moved in step with CPI. It is currently at its highest level in two decades (Chart 11). Chart 11... But Bottlenecks Are Inflicting Near-Term Upward Pressure
... But Bottlenecks Are Inflicting Near-Term Upward Pressure
... But Bottlenecks Are Inflicting Near-Term Upward Pressure
Exchange rate moves are not as important for US inflation as they are in economies that are more reliant on trade, but they still matter at the margin. When the dollar weakens, the price of imports rises and when it strengthens, the price of imports falls. Trade-weighted indexes are our go-to series for gauging the dollar’s course (Chart 12, top panel), but the DXY index draws a lot of attention from market professionals and it is currently testing a multi-year technical support level (Chart 12, bottom panel). A break below 90 would presage a further fall and may push inflation expectations higher. Chart 12A Weaker Dollar Could Push US Import Prices Higher ...
A Weaker Dollar Could Push US Import Prices Higher ...
A Weaker Dollar Could Push US Import Prices Higher ...
Services inflation is mainly a domestic phenomenon, but goods prices are globally determined. Inflation measures in major international economies can therefore provide some insight into the path of goods prices and the path of US inflation at the margin. Headline and core consumer prices in the Eurozone have yet to stir from their slumber (Chart 13, top panel) while consumer prices in China briefly deflated (Chart 13, bottom panel). The rest of the world is not yet exerting upward pressure on US consumer prices. Chart 13... But There Isn't Much Inflationary Pressure Outside The US
... But There Isn't Much Inflationary Pressure Outside The US
... But There Isn't Much Inflationary Pressure Outside The US
Inflation Expectations Chart 14Investors Vote For Transitory
Investors Vote For Transitory
Investors Vote For Transitory
Expectations inform behavior. If a widespread belief that troublesome inflation is going to return takes hold, individual workers and unions will demand higher wages to maintain their purchasing power, businesses up and down the supply chain will insist on price hikes to protect their margins and consumers may accelerate their big-ticket purchase decisions. Each of these actions adds fuel to the fire, and if economic participants come to believe that a new inflation regime has arrived, it could initiate a self-reinforcing dynamic in which higher prices beget higher prices. Think of it as the flip side of the deflation mindset that has left Japan with relentless disinflation in consumer prices and a relative plunge in asset prices. We are monitoring the inflation expectations curve very closely with the aim of detecting the arrival of a new inflation mindset. If the curve were to shift out – inflation expectations were higher across all time periods – and steepen, with inflation expectations rising across the entire time horizon, participants in the real economy might be on the cusp of changing their behavior to align with expectations. For now, we are encouraged that the inflation expectations curves as derived from the difference in TIPS and nominal Treasury yields (Chart 14, top two panels), and from the CPI swaps market (Chart 14, bottom two panels) suggest that investors agree that inflation pressures are likely to dissipate. We come to that conclusion from the fact that the 2-to-5-year and 5-to-10-year segments of the curve are inverted, which is to say that investors expect near-term inflation will exceed longer-term inflation. Inversion in both segments shows that investors expect a steady decline, with the inflation rate over the next two years exceeding the inflation rate over the next five years and the inflation rate over the next five years exceeding the inflation rate over the next ten years. We place greater reliance on market-determined measures of inflation expectations than survey measures, but we are monitoring a range of consumer and business surveys. The University of Michigan’s consumer sentiment survey shows that households also expect that near-term inflation pressures will not persist. Its respondents see inflation soaring over the next twelve months (Chart 15, top panel) but rising much more modestly over the next five years (Chart 15, bottom panel). Chart 15Households Also Think Acute Inflation Pressures Will Be Short Lived
Households Also Think Acute Inflation Pressures Will Be Short Lived
Households Also Think Acute Inflation Pressures Will Be Short Lived
Fed Reaction Function The investment implications of higher inflation come down to how the Fed reacts to it. For now, the Fed is sticking to its pledge that it has reduced its propensity to tighten policy. It remains outwardly committed to pursuing an average inflation target and to eschewing proactive policy tightening when the labor market appears to be firming. Though we expect that markets will periodically test the Fed when inflation seems to be gathering momentum, we do not yet see any reason to doubt its resolve. We will only check either of the Fed boxes in the event that Fed speakers begin to telegraph a change of direction or if the summary of economic projections (“the dots”) indicates that the bias toward accommodative policy is shifting. We see that bias as nearly fixed in the near term, given that the Fed has gone to considerable lengths to outline its policy goals for participants in the financial markets and the economy. It is not etched in stone, but we don’t foresee a material change in the next few months. Until we do, or until we become convinced that the Fed has allowed itself to get helplessly behind the inflation curve, we expect to stick to our recommendation to overweight risk assets at the expense of Treasuries over the twelve-month cyclical timeframe. Doug Peta, CFA Chief US Investment Strategist dougp@bcaresearch.com Footnotes 1 Please see the May 17, 2021 US Investment Strategy report, "The Data That Cried Wolf," available at www.bcaresearch.com.
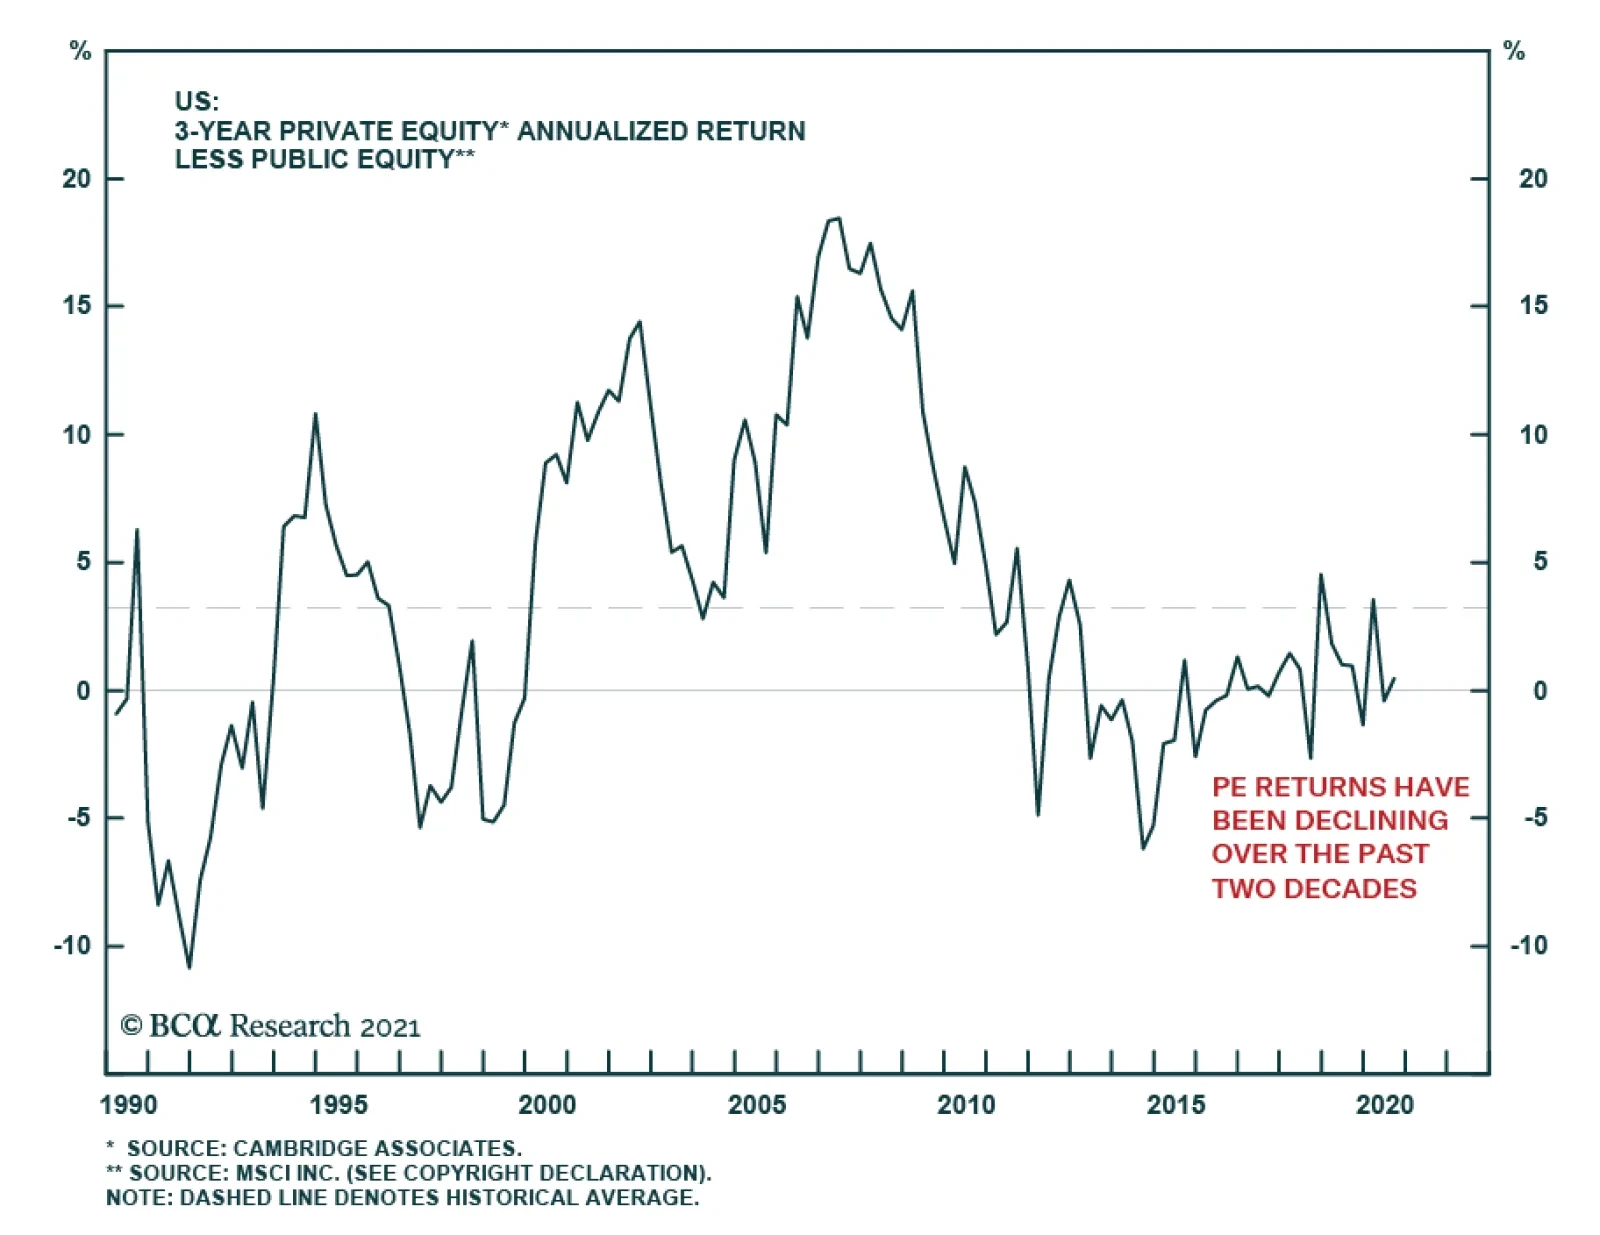
With prospective returns from major asset classes so unattractive, investors continue to pour money into illiquid assets such as private equity (PE). PE funds last year raised $660 billion (compared to only $185 billion in 2010), and have already raised $345…
Trying To Find A New Equilibrium
Trying To Find A New Equilibrium
The SPX has been striving to find direction over the past couple of weeks in the seasonally weak month of May, as “transitory inflation” may actually morph into more semi-permanent inflation. The Fed’s latest minutes signaled that tapering is likely on its way, especially if non-farm payrolls resume increasing month-over-month near the one million mark as the economy will be in full reopening mode this Memorial Day. Historically, there is some turbulence that comes with the transition from ultra-easy monetary policy stance to, at the margin, less easy monetary policy warning that a shakeout equity market phase still looms. Tack on the modestly negative signal from investor positioning in the options market (top panel) and a volatile summer is likely upon us. Finally, news of China’s crackdown on cryptocurrencies has taken a bite out of Bitcoin that has been experiencing wild intra-day swings of late. Some of these apparent liquidation pressures have spilled over to the S&P 500 and, given the recent tight positive correlation between Bitcoin and the SPX (bottom panel), warn that some caution is still warranted in the equity space, at least in the near-term.
Highlights The selloff in crypto-currencies on May 19 may be overblown but the risk of government intervention is a rising headwind for this asset class. While environmental concerns are a threat to Bitcoin, the entire crypto-currency complex faces a looming confrontation over governance. Digital currencies are a natural evolution of money following coinage and paper. Moreover a sizable body of consumers is skeptical of governments and traditional banking. Loose monetary conditions are fueling a speculative mania. However, governments fought for centuries to gain a monopoly over money. As crypto-currencies become more popular, governments will step in to regulate and restrict them. Central bank digital currencies (CBDCs) threaten to remove the speed and transactional advantage of crypto-currencies, leaving privacy/anonymity as their main use-case. Feature The prefix “crypto” derives from the Greek kruptos or “hidden.” This etymology highlights one of the biggest problems confronting the crypto-currency craze in financial markets today. Speed and anonymity are the greatest assets of the digital tokens. But the former advantage is being eroded by competitors while the latter is becoming a political liability. In the 2020s, governments are growing stronger and more interventionist, not weaker and more laissez faire. Chart 1Loose Money Fuels Crypto Mania
Loose Money Fuels Crypto Mania
Loose Money Fuels Crypto Mania
Bitcoin and rival crypto-currency Ethereum fell by 29.5% and 43.2% in intra-day trading on May 19, only to finish the day down by 13.8% and 27.2%, respectively. The market panicked on news that China’s central bank had banned firms from handling transactions in crypto-currencies. What really happened was that China’s National Internet Finance Association, China Banking Association, and Payment and Clearing Association issued a statement merely reiterating a 2013 and 2017 policy that already banned firms from handling transactions in crypto-currencies. These three institutions also warned about financial speculation regarding crypto-currencies.1 The crypto market suffered a spike in volatility because it is in the midst of a speculative mania. In the last five years, total market capitalization of crypto-currencies has risen from around $7 billion to $2.3 trillion,2 recording a 34,000% gain. Some crypto-currencies have even recorded returns in excess of that number over a shorter horizon. Price gains have been driven by retail buyers who may or may not know much about this new asset class (Chart 1). Prior to the May 19 selloff, prices had grown overextended and recent concerns over the environment, sustainability, and governance (ESG) had shaken confidence in Bitcoin and its peers. Chinese authorities have already banned financial firms from providing crypto services in a bid to deter ownership of crypto-currencies. And China is not alone. The latest market jitters are a warning sign that government interference in the crypto-currency market is a real threat. Regulation and sovereign-issued digital currencies are starting to enter the fray. While ultra-dovish central bank policies are not changing soon, and therefore crypto-currency price bubbles can continue to grow, crypto-currencies will remain subject to extreme volatility and precipitous crashes. In this report we argue that the fundamental problem with crypto-currencies is that they threaten the economic sovereignty of nation-states. Environmental degradation, financial instability, and black market crime, and other concerns about cryptos have varying degrees of merit. But they provide governments with ample motivation to pursue a much deeper interest in regulating a technological innovation that has the power to undermine state influence over the economy and society. Government scrutiny is a legitimate reason for crypto buyers to turn sellers. Does The World Need Crypto-Currencies? Broadly speaking, there are two primary justifications for crypto-currencies, centered on a transactional basis: speed and privacy/anonymity. The crux of crypto-currency creation rests on these two use cases.3 The speed of crypto-currencies comes from their ability to increase efficiency in local and global payment systems by facilitating financial transactions without the need of a third party (e.g. a financial institution). Cross-border settlement of traditional (fiat) currency transactions processed through the standard SWIFT communications system takes up to two business days. Most transactions involving crypto-currencies over a blockchain network are realized in less than an hour, cross-border or not.4 The fees involved with third-party payments are often more expensive than transacting with crypto-currencies. Simply put, excluding the “middleman” can save money. This is a selling point in a global market that expects to see retail cross-border transactions reach $3.5 trillion by the end of 2021, of which up to 5% are associated with transaction-based fees.5 But this breakthrough in payment system technology can be overstated and is not the main reason for using crypto-currency. Speculation drives current use, especially given that there is speculative behavior even among those who believe that cryptos are safe-haven assets or promising long-term investments (Chart 2). Chart 2Crypto-Currency Use Driven By Speculation
Cryptocurrencies: They Can Run But They Can’t Hide
Cryptocurrencies: They Can Run But They Can’t Hide
Chart 3Consumers Growing Skeptical Of Banking Regulation
Cryptocurrencies: They Can Run But They Can’t Hide
Cryptocurrencies: They Can Run But They Can’t Hide
If a person wants to buy an item from a company in a distant country, that person could use a crypto-currency just as he or she could use a credit card. Both parties would have a secure medium of exchange but, unlike with a credit card, both would avoid using fiat currencies. Neither party could conduct the same transaction using gold or silver. The crucial premise is the existence of an online community of individuals and firms who for one reason or another want to avoid fiat currencies. From a descriptive point of view, the crypto-currency phenomenon implies a lack of trust in modern governments, or at least their monetary systems, and an assertion of individual property rights. The list of crypto-currencies continues to grow. To date, there are approximately 9,800 of them. Some are trying to prove their economic value or use, while others have been created with no intended purpose or problem to solve. Even so, there has yet to be a crypto-currency that overwhelms the use of slower fiat money. In a recent Special Report, BCA Research’s Foreign Exchange Strategist Chester Ntonifor showed that crypto-currencies still have a long way to go to have a chance at replacing fiat monies. While crypto-currencies are showing signs of significant improvement as mediums of exchange, they still fall short as stores of value and units of account. The other primary case for crypto-currencies is privacy or anonymity. The bypassing of intermediaries implies a greater control of funds by the two parties of a transaction. Crypto-currencies are said to be more “private” compared to fiat money. Fiat money is controlled by governments and banks while crypto-currencies have only “owners.” Crypto-currencies are anonymous because they are stored in digital wallets with alphanumeric sequences – there is a limited personal data trail that follows crypto-currency compared to those of electronic fiat currency transactions. In a post-9/11, post-GFC, post-COVID world where a sizable body of consumers is growing more skeptical of government surveillance and regulation and banking industry practices (Chart 3), crypto-currencies give users more than just a means to transact with. However, privacy is not the same as security. Hacking and fraud can affect cryptos as well as other forms of money and attacks will increase with the value of the currencies. Bitcoin At The Helm Of Crypto-Currency Market Chart 4Bitcoin Slows
Bitcoin Slows
Bitcoin Slows
Bitcoin has cemented its status as the number one currency in the crypto-verse.6 It is considered to be the first crypto-currency created, it is the most widely accepted, it is touted as a store of value or “digital gold,” and it is the most featured in quoting alternative crypto-currency pairs across crypto exchanges. As it stands, Bitcoin accounts for around 42% of total crypto-currency market capitalization.7 This share has declined from around 65% at the start of 2021 on the back of the frenzied rise of several alternative coins.8 But rising risks to Bitcoin’s standing will cause the entire crypto-market to retreat. In a Special Report penned in February, BCA Research’s Chief Global Strategist Peter Berezin argued that Bitcoin is more of a trend than a solution and that its usefulness is diminishing. Bitcoin’s transaction speed is slowing and its transaction cost is rising (Chart 4). Slowing speed and rising cost on the Bitcoin network are linked to a scalability problem. The crypto-currency’s network has a limited rate at which it can process transactions related to the fact that records (or “blocks”) in the Bitcoin blockchain are limited in size and frequency. This means that one of its fundamental justifications, transactional speed, will become less attractive over time, should the network not address these issues. Bitcoin also consumes a significant amount of energy, a controversy that is gaining traction in the crypto-currency market after Elon Musk, the “techno-king” of Tesla, cited environmental concerns in reversing his decision to accept Bitcoin payment for his company’s electric vehicles. Energy consumption rises as more coins are mined, since mining each new Bitcoin becomes more computer-power intensive. The need for computing power and energy will continue to increase until all 21 million Bitcoins (total supply) are mined, which is currently estimated to occur by the year 2140. Strikingly, the energy needed to mine Bitcoin over a year are comparable to a small country’s annual power consumption, such as Sweden or Argentina (Chart 5). Chart 5Bitcoin Consumes More Energy Than A Small Country …
Cryptocurrencies: They Can Run But They Can’t Hide
Cryptocurrencies: They Can Run But They Can’t Hide
Bitcoin also generates significant quantities of electronic waste (Chart 6). Chart 6… And Generates A Lot Of Electronic Waste
Cryptocurrencies: They Can Run But They Can’t Hide
Cryptocurrencies: They Can Run But They Can’t Hide
Bitcoin mining is heavily domiciled in China, which accounts for 65% of global mining activity (Figure 1). China’s energy mix is dominated by coal power, which makes up approximately 65% of the country’s total energy mix even after a decade of aggressive state-led efforts to reduce coal reliance. Of this, coal powered energy makes up approximately 60% of Bitcoin’s energy mix in China.9 With several countries aiming to minimize carbon emissions, and with approximately 60% of Bitcoin mining powered by coal-fired energy globally,10 Bitcoin imposes a major negative environmental impact. Figure 1Bitcoin Mining Well Anchored In Asia
Cryptocurrencies: They Can Run But They Can’t Hide
Cryptocurrencies: They Can Run But They Can’t Hide
Bitcoin does not shape up well when compared to gold’s energy intensity either. Bitcoin mining now consumes more energy than gold mining over a single year. While the energy difference is not large, the economic value is. Gold’s energy consumption to economic value trade-off is lower than that of Bitcoin. The production value of gold in 2020 was close to $200 billion, while Bitcoin was measured at less than $25 billion (Chart 7A). On a one-to-one basis, gold even has a lower carbon footprint than Bitcoin (Chart 7B). Chart 7AGold Outshines Bitcoin On Production Value And Carbon Footprint
Cryptocurrencies: They Can Run But They Can’t Hide
Cryptocurrencies: They Can Run But They Can’t Hide
Chart 7BGold Outshines Bitcoin On Production Value And Carbon Footprint
Cryptocurrencies: They Can Run But They Can’t Hide
Cryptocurrencies: They Can Run But They Can’t Hide
Crypto-currency energy consumption and carbon footprint will attract the attention of government regulators. Of course, not all crypto-currencies are heavy polluters. But if the supply of cryptos is constrained by mining difficulties then they will require a lot of energy. If the supply is not constrained then the price will be low. Government Regulation Is Coming Environmental concerns point to the single greatest threat to crypto-currencies – the Leviathan, i.e. the state. In this sense the crypto market’s wild fluctuations on May 19, at the mere whiff of tougher Chinese regulation, are a sign of what is to come. Governments around the world have so far left crypto-currencies largely unregulated but this laissez-faire attitude is already changing. Environmental regulation has already been mentioned. Governments will also be eager to expand their regulatory powers to “protect” consumers, businesses, and banks from extreme volatility in crypto markets. But investors will underrate the regulatory threat if they focus on these issues. At the most basic level, governments around the world will not sit idly by and lose what could become significant control of their monetary systems. The ability to establish and control legal tender is a critical part of economic sovereignty. Governments won control of the printing press over centuries and will not cede that control lightly. If crypto-currencies are adopted widely, then finance ministries and central banks will lose their ability to manipulate the money supply and the general level of prices effectively. Politicians will lose the ability to stimulate the economy or keep inflation in check. Most importantly, while one may view such threats as overblown, it is governments, not other organizations, that will make the critical judgment on whether crypto-currencies threaten their sovereignty. Throughout the world, most crypto-currency exchanges are regulated to prevent money laundering. Crypto-currencies are not legal tender and, aside from Bitcoin, their use is mostly banned in China (Table 1). However, more specialized regulation that targets energy and economic use has yet to be brought into law across the world. Table 1World Governments Will Not Relinquish Hard-Fought Monopolies Over Money Supply
Cryptocurrencies: They Can Run But They Can’t Hide
Cryptocurrencies: They Can Run But They Can’t Hide
In China, initial coin offerings (ICOs – the equivalent of an initial public offering on the stock market) and trading platforms are banned from engaging in exchanges between the yuan and crypto-currencies or tokens. In fact, China recognizes crypto-currencies only as virtual commodities or virtual property. India is another country where exchanges and ICOs are banned. While crypto-currencies are not banned, they are not legal tender. Indian policymakers have recently proposed banning crypto-currencies, however. The proposed legislation is one of the world’s strictest policies against crypto-currencies. It would criminalize possession, issuance, mining, trading, and transferring crypto-assets. If the ban becomes law, India would be the first major economy to make holding crypto-currency illegal. Even China, which has banned mining and trading, does not penalize possession. In the US, Secretary of the Treasury Janet Yellen has already expressed concerns regarding the illicit use of cryptos for supposed criminal gain.11 She is in alignment with European Central Bank President Christine Lagarde. Because of the anonymity of crypto-currencies, identifying users behind illicit transactions is difficult. This means regulators face headwinds in identifying transactions that are made for criminal gain, as compared to fiat transactions. Governments have long dealt with the anonymity of cash but they have ways of monitoring bank accounts and paper bills. Crypto-currencies are beyond their immediate sight of control and therefore will attract growing scrutiny and legislative action in this regard. The Colonial Pipeline ransomware attack on May 7, which temporarily shuttered about 45% of the fuel supply line for the eastern United States, illustrates the point. The DarkSide group of hackers who orchestrated the attack demanded a ransom payment of $4.4 million worth of Bitcoin, which Colonial Pipeline paid them on May 7. Shortly thereafter, unspecified “law enforcement agencies” clawed back the $4.4 million from the hackers’ account (transferring it to an unknown address) and DarkSide lost access to its payment server, DOS servers, and blog. This episode should not be underrated. It was a successful, large-scale cyber-attack on critical infrastructure in the world’s most powerful country. It highlighted the illicit uses to which crypto-currencies can be put. True, criminals demand ransoms in fiat money as well – and many crypto-currency operators will distance themselves from the criminal underworld. Nevertheless governments will give little slack to an emerging technology that presents big new law enforcement challenges and is not widely used by the general public. Ultimately governments will pursue their sovereign interests in controlling money, the economy, and trade, listening to their banking lobby, expanding their remit to “protect” consumers, and cracking down on illicit activity. Governments are not capable of abolishing crypto-currencies altogether, or the underlying technology of blockchain. But they will play a large and growing role in regulating them. Central Banks Advancing On Digital Currencies Central bank digital currencies (CBDCs) will leave crypto-currencies in the realm of speculative assets. CBDCs are a form of digital money denominated in a country’s national unit of account and represent a liability on a central bank’s balance sheet. This is different from current e-money that represents a claim on a private financial institution’s balance sheet. It is also different from crypto-currencies, because there is a central authority behind a CBDC, unlike with crypto-currencies due to their decentralized nature. In China, the People’s Bank of China (PBoC) has suggested its rollout of a digital yuan is “ready” despite no release to date. Beta testing is ongoing in several provinces. The PBoC’s justification for a digital yuan comes from China’s growing cashless economy. The transition away from cash is largely thanks to mobile payment platforms like Alibaba’s Alipay and Tencent’s WeChat Pay, which, between the two of them, control almost the entire mobile payments market of some 850 million users. There is a significant amount of systemic risk in this system – one reason why Chinese authorities have recently subjected these companies to new scrutiny and regulation. Should Alibaba or Tencent go bankrupt, the local payment system will crash. The PBoC’s efforts will increase competition in the local payments space and reduce this systemic risk. Policymakers are also concerned that as Chinese citizens choose to hold their money in digital wallets provided by Alibaba and Tencent instead of bank accounts, liquidity is being drained from the traditional banking system, putting deposit levels at banks under strain, and posing risks to liability matching. The digital yuan will still involve a third party, unlike crypto-currencies which do not. Doing away with commercial banks is not a reality – indeed the Chinese Communist Party seeks to buttress the state-owned commercial banks in order to maintain control of the economy. What the digital yuan does, and other CBDCs will do too, is utilize blockchain technology, which is faster and more secure than traditional payment networks. In the US, the Fed has been studying the viability of a CBDC US dollar. The Fed has stated that it is carefully exploring whether a CBDC will lead to “safer, less expensive, faster, or otherwise more efficient payments.” While the Fed has yet to find a single standout case for a CBDC US Dollar, Fed Chair Jerome Powell said last year that the US has a “competitive payments market” with “fast and cheap services, particularly in comparison to other nations exploring a CBDC.” To date, the Fed’s observation is that many of the challenges that CBDCs hope to address do not apply to the US, including disuse of physical cash, narrow reach or high concentration of banking, and weak infrastructure for payment systems. Rather, the Fed is more focused on developing the FedNow real-time payment system for private banks. This is much the same as in Europe, where physical cash still plays a major role in day-to-day economic activity and where local payment systems are fast and secure. But central banks around the world continue to engage in work centered around CBDCs (Charts 8A and 8B) – and China’s progress will encourage others to move faster. Advanced economies are mostly interested in creating a safer and more efficient payment system, while emerging and developed economies have interest across several areas such as financial stability, monetary policy setting, and inclusiveness of banking, as well as efficiency and safety (Chart 9). CBDCs are especially attractive to emerging market policy makers at targeting those who lack access to traditional banking. Chart 8ACentral Banks Advancing On CBDC Work
Cryptocurrencies: They Can Run But They Can’t Hide
Cryptocurrencies: They Can Run But They Can’t Hide
Chart 8BCentral Banks Advancing On CBDC Work
Cryptocurrencies: They Can Run But They Can’t Hide
Cryptocurrencies: They Can Run But They Can’t Hide
Chart 9Central Banks CBDC Interest Areas
Cryptocurrencies: They Can Run But They Can’t Hide
Cryptocurrencies: They Can Run But They Can’t Hide
In remote areas, access to banking is scarce and expensive. CBDCs can help solve this problem. Individuals would have CBDC accounts directly on a central bank ledger. They could then access their money and transact through a digital wallet application that is linked to the CBDC account. Giving people access to digital currency would allow them to transact quickly, in remote settings, without the need of hard currency. Monetary policy transmission is also better in advanced economies. In emerging markets, there are bottlenecks in local financial markets. Looser central monetary policy does not always translate into cheaper financing across the economy. In remote and poverty stricken areas, monetary policy transmission is sticky, meaning high costs of borrowing can persist even through accommodative policy cycles. This is a smaller issue in advanced economies. Payment systems in advanced economies are due an overhaul in security and efficiency, and CBDCs and blockchain technology will provide this. CBDCs will prove to be just as efficient to transact with as any crypto-currencies available today. CBDCs will also be legal tender and accepted by all vendors. The anonymity factor will be lost but this will not be a problem for most users (whereas legal issues will become a problem for crypto-currencies). The probability of central banks issuing CBDCs in both the short and medium term, both in the retail and wholesale space, is rising. If advanced economies like those of the G7 issue CBDCs soon, policy makers will undoubtedly ensure the use of it over the currently circulating and partially accepted crypto-currencies. The endgame will leave crypto-currencies in the highly speculative asset class, perhaps even in the black market where anonymity is valued for transactions that wish not to be tracked. Investment Takeaways Prices of crypto-currencies may continue to rise given sky-high fiat money creation amid the COVID pandemic and ultra-low interest rates. Digitalization is the natural next step in the evolution of money from precious metals to paper banknotes to electronic coin. But the market leader, Bitcoin, is encountering more headwinds. The primary case for the use of Bitcoin is challenged due to slowing transaction speeds and rising transaction costs. The virtual currency is primarily mined using coal-powered energy, resulting in growing scrutiny from governments and consumers. Government regulation is entering the ring and policymakers will take an increasingly heavy-handed role in trying to ensure that cryptos do not undermine economic sovereignty, financial stability, and law and order. When central banks begin to rollout digital currencies, especially those domiciled in advanced economies, crypto-currencies as medium of exchange will lose much of their allure. Crypto-currencies will remain as anti-fiat currencies and speculative assets. Risks To The View Given the controversy surrounding crypto-currencies, it is only fair to state outright the risks to our view. We would also recommend clients read our colleague Dhaval Joshi’s latest bullish take on Bitcoin. First, scaling up Bitcoin’s network and processing transactions in batches instead of single transactions will resolve transaction time and cost risks, restoring efficiency. This is a clear solution to efficiency concerns. However, scaling and batching transactions are not on the immediate horizon of Bitcoin developers. Bitcoin’s network will still need to undergo another “halving” in order for this risk to subside and for the network to scale. A halving of the network will only occur again in 2024.12 Second, on the environment: Bitcoin mining is not solely dependent on fossil fuel energy that gives it a “dirty” footprint. Renewables already make up some 25% of Bitcoin mining. Increasing the use of renewables in Bitcoin’s energy mix will help lower its environmental impact. However, this is easier said than done. Global renewable energy has yet to scale up to a point where it can consistently out-supply existing fossil-fuel energy. Mining hardware also has its associated carbon footprint that would need to be addressed. And location matters too. Crypto-currency mining farms are large-scale projects. Simply uprooting operations to a country that could lower the carbon footprint of a mining farm or two is not viable due to the costs involved. Hence crypto-currency mining will probably continue to be a “dirty” operation but a rapid shift to renewables would challenge our thesis. Bitcoin’s network is also based off a “proof of work” protocol. Miners must prove that a certain amount of computational effort has been expended for confirming blocks on the network, allowing transactions to be processed. Proof of work is energy intensive. Other crypto-currencies, like Ethereum, will adopt a “proof of stake” protocol. Simply put, transactions are confirmed by users and their stake in the associated crypto-currency. Proof of stake is less energy intensive compared to proof of work. Third, as to government regulation, the longer policymakers take to enact legislation targeting crypto-currencies, the larger their market will grow. Regulation in China and India may set a benchmark for major economies but not all will follow in the Asian giants’ footsteps. Some governments have been slow to study crypto-currencies, meaning legislation aimed at governing or regulating them may still be long in coming. Innovation is a good thing and free economies will not wish to restrain crypto-currencies or blockchain technology unduly, for fear of missing out. Fourth, on CBDCs, some central banks may only adopt them based on their respective economic needs. However, rising crypto-currency populism drives associated economic risks which can force the hands of central banks to adopt CBDCs in lieu of said needs. Each country faces unique challenges. Some central banks may not want to be left behind even if they believe their policy framework is facilitating economic activity efficiently. While the Fed has stated that it will not adopt a CBDC for the primary reason of ensuring payment security since it believes it already has a safe system in place, this view will change. The Fed could justify a move to a CBDC US dollar on the single basis of transitioning to a more sophisticated technology for the future. The Fed will not want to be caught behind the curve considering the PBoC is priming its digital yuan for release soon. Technological leadership is a strategic imperative of the United States and that imperative applies to financial technology as well as other areas. Guy Russell Research Analyst GuyR@bcaresearch.com Matt Gertken Vice President Geopolitical Strategy mattg@bcaresearch.com Footnotes 1 Muyao Shen, “China Reiterates Crypto Bans From 2013 and 2017”, coindesk, May 18, 2021, coindesk.com. 2 As of May 11, 2021. 3 There are several other reasons or “problems” that crypto-currencies are created for or to solve, but speed and privacy form the basis of crypto-currencies first coming into existence. 4 Not all crypto-currencies transact in less than an hour. But there are many that transact in several minutes and in some cases, mere seconds. As the leading crypto-currency, Bitcoin takes approximately one hour for a transaction to be fully verified over its network. 5 “McKinsey’s Global Banking Annual Review”, McKinsey, Dec. 9, 2020, mckinsey.com. 6 We use Bitcoin as an example to understand the risk and impact of forthcoming government regulation and competition. Because of Bitcoin’s status, any significant risks that threaten the crypto-currency’s standing as the number one currency will threaten the entire market. 7 As of May 20, 2021. Figure varies daily. See www.coinmarketcap.com for more information. 8 Alternative currencies such as Ethereum, Ripple, Binance Coin, Dogecoin, and Cardano have chipped away at Bitcoin’s crypto-market dominance through 2021. 9 According to The Center For Alternative Finance, The University Of Cambridge. 10 According to The Center For Alternative Finance, The University Of Cambridge. 11 Data on the use of crypto-currencies for illicit activitiessays otherwise. Of all crypto-currency transactions, it is estimated that only 2.1% are used for illicit activities. See “2021 Crypto Crime Report”, Chainalysis, chainalysis.com. 12 A Bitcoin halving is when the reward for mining Bitcoin transactions is cut in half. This event also cuts Bitcoin's inflation rate and the rate at which new Bitcoins enter circulation, in half. Bitcoin last halved on May 11, 2020.
Highlights The drubbing that cryptocurrencies have received over the past two weeks is just a taste of things to come. Crypto markets will continue to face tighter regulation, as this week’s announcements from China and the US Treasury underscore. The hope that cryptocurrencies can ever truly “go green” is wishful thinking. Given their decentralized nature, cryptocurrencies require real resources to be expended to permit secure transactions to take place. In addition to their technical limitations, cryptocurrencies face a fundamental constraint, which we dub the “Crypto Impossibility Theorem.” The Crypto Impossibility Theorem states that cryptocurrencies will be viable only if they offer a higher return than equities. The assumption that cryptos can generate a return in excess of equities is almost certain to be false since it would require that cryptocurrency holdings rise more quickly than income in perpetuity. In the near term, the pain in crypto markets could drag down other speculative assets such as tech stocks. In the long term, diminished investor interest in cryptos will benefit the stock market, as investor attention focuses back on equities. Cryptos: Can’t Have It All Investors who track the cryptocurrency market might be aware of the “blockchain trilemma.” It posits that cryptocurrencies can possess only two of the following three attributes: decentralization, security, and scalability. Bitcoin is both highly decentralized and reasonably secure. However, because control of the Bitcoin blockchain is distributed across thousands of individual computer nodes, it is also very slow. The Bitcoin network can barely process five transactions per second, compared to over 20,000 for the Visa network (Chart 1). The average fee for a Bitcoin transaction is around $30, a number that has risen over the past few years (Chart 2). Chart 1Speed Of Transactions, Or Lack Thereof
Speed Of Transactions, Or Lack Thereof
Speed Of Transactions, Or Lack Thereof
Chart 2Rising Cost Per Transaction
Rising Cost Per Transaction
Rising Cost Per Transaction
The elaborate puzzles that the Bitcoin algorithm must solve to verify transactions are extremely energy intensive. Bitcoin mining consumes more energy than entire countries such as Sweden, Argentina, and Pakistan (Chart 3). About two-thirds of Bitcoin mining currently takes place in China, often using electricity generated by burning coal. Chart 3Bitcoin And Ethereum: How Dare You!
The Crypto Impossibility Theorem
The Crypto Impossibility Theorem
Some claim that Bitcoin and other cryptocurrencies are shifting to renewable energy sources, a trend that will continue in the years ahead. However, this argument misses the point, which is that the “proof of work” mechanism that underpins Bitcoin requires that real resources be expended. Suppose that all Bitcoin mining could be performed entirely for free using solar energy. This would reduce the cost of running a “mining rig,” incentivizing more mining. The Bitcoin algorithm operates in such a way that the difficulty of mining coins increases as the total computational power of all miners grows. In this computational rat race, miners would need to purchase more servers with ever more powerful specifications to keep up with their competitors. And semiconductors do not grow on trees. It takes real resources to produce them. As this recent Bloomberg article pointed out, Taiwan Semiconductor generates almost 50% more greenhouse emissions than General Motors. Like Bitcoin, Ethereum uses the “proof of work” mechanism to verify transactions. There have been active discussions to shift Ethereum to a “proof of stake” mechanism, which would greatly expedite transactions.1 However, some have argued that a proof of stake system would degrade security, allowing for “double-spend attacks” where someone transfers coins to someone else but then spends the coins before the transaction is completed. The Crypto Impossibility Theorem We will not delve any further into the technical nature of the blockchain trilemma other than to note that it poses a serious challenge to the entire cryptocurrency project. Instead, let us highlight another obstacle that has received less attention – one that could be even more damaging for the prospects of cryptocurrencies in the long run. Let us hyperbolically call it the “Crypto Impossibility Theorem.” The Crypto Impossibility Theorem states that a cryptocurrency will be viable only if it offers a higher return than equities. As we discuss below, the assumption that cryptos can generate a return in excess of equities is almost certain to be false since it would require that cryptocurrency holdings rise more quickly than income in perpetuity. This implies that the value that investors currently attach to cryptos will turn out to be illusory. To see the theorem in action, recall that money serves three functions: As a unit of account, as a medium of exchange, and as a store of value. It is doubtful that anyone seriously thinks that the price tag on a box of cereal will ever be displayed in units of Bitcoin, ether, or any of the various dog coins currently in vogue. Thus, we can scratch “unit of account” off the list of possible crypto uses. What about medium of exchange? One can imagine a scenario where the prices of goods and services are still listed in dollars, but one may transfer the equivalent in cryptocurrencies to purchase them. However, this raises an obvious question: Why would anyone choose to hold a cryptocurrency if wages and prices are denominated in fiat currencies such as US dollars or euros? The only possible answer is that people must see cryptocurrencies as fulfilling the third function of money, namely being a store of value. Would people be willing to hold cryptocurrencies if their prices generally moved sideways? It is doubtful. Cryptocurrencies are risky. Cryptocurrency accounts are not subject to deposit insurance. Crypto prices are also extremely volatile. During the pandemic, the S&P 500 fell by 34%, but the price of Bitcoin sank by an even greater 53%. Other cryptocurrencies fared even worse. In contrast, the trade-weighted US dollar strengthened by about 4% while gold prices only fell marginally (Chart 4). Thus, to incentivize people to hold cryptos, the prospective capital gain has to be large enough to offset the inherent volatility in owning these currencies. Chart 4Cryptocurrencies Fared Badly During Last Year’s Equity Sell-Off
The Crypto Impossibility Theorem
The Crypto Impossibility Theorem
This is where the Crypto Impossibility Theorem comes in. Unlike dividend-paying stocks, cryptocurrencies do not provide any income to their holders. Thus, even if cryptos were just as risky as stocks, the price of cryptos would still need to rise more than the price of stocks in order to ensure that investors remain indifferent between the two asset classes. In practice, as the experience of the pandemic demonstrates, cryptos are even riskier than stocks. Thus, the expected return on cryptos has to exceed the expected increase in stock prices by more than the dividend yield. The problem for crypto holders is that this is not mathematically possible. Even if one controls for the rise in price-earnings multiples over time, equity returns have generally exceeded nominal GDP growth (Table 1). Hence, if cryptos need to offer superior returns to equities, and if the return on equities is at least equal to nominal GDP growth, then the market capitalization of cryptocurrencies will not only end up rising faster than for stocks, it will rise faster than aggregate national income. In a digital world where people need ever-less money to facilitate transactions, there is no good reason to expect this to happen. Table 1Equity Returns And GDP Growth
The Crypto Impossibility Theorem
The Crypto Impossibility Theorem
A Fashion Choice Crypto-optimists might argue that the required rate of return to holding cryptos will decline as the market matures. This is wishful thinking. Equities derive their value from the fundamentals of a company’s business. In contrast, cryptocurrencies have no intrinsic value. Their value is whatever others are willing to pay for them. Not only does this make cryptocurrencies inherently more risky than equities, it also makes them highly susceptible to fashion trends. It is not surprising that many upstart cryptocurrencies have crafted ties with celebrities and other “influencers.” The whole point is to get enough people interested in a cryptocurrency to generate a feedback loop of wider adoption, thus allowing the currency’s early backers to cash out. The drubbing that cryptocurrencies have received over the past two weeks is just a taste of things to come. In this sense, cryptocurrencies are even more vulnerable to affinity scams than other assets such as precious metals. While apocalyptic warnings of “currency debasement” have long been used to sell bullion, at least with gold and silver, you truly do get something that is in short supply. In the case of cryptocurrencies, while the supply of any individual cryptocurrency may be limited, the overall supply is unbounded. This means that the average price of each currency is likely to rise much less than the aggregate value of all cryptocurrencies, making the entire asset class even less viable over time. Cryptogeddon The drubbing that cryptocurrencies have received over the past two weeks is just a taste of things to come. As Matt Gertken and Guy Russell discuss in this week’s Geopolitical Strategy report, crypto markets will continue to face tighter regulation (Table 2). Just this week, China reiterated its ban on financial companies offering cryptocurrency services. As part of its broader effort to crack down on tax evasion, the US Treasury Department also announced that it will require any cryptocurrency transfer worth $10,000 or more to be reported to the IRS. Table 2Regulation Of Cryptos: What Can And Cannot Be Done
The Crypto Impossibility Theorem
The Crypto Impossibility Theorem
The blockchain trilemma will make it impossible for cryptos to overcome ESG concerns, while the Crypto Impossibility Theorem will prevent cryptocurrencies from ever being stable stores of value. In the meantime, an ebbing of input price inflation will take some of the wind out of the sails from the argument that cryptos are an indispensable hedge against the “inevitable” debasement of fiat monies. Chart 5 shows that DRAM prices have rolled over. Lumber prices have dropped 11% so far this week. Corn, soybean, and steel prices have also backed off their highs. Cryptos are like sharks; they need to move forward or they will sink. Back when they were unknown to most investors, a speculative case could have been made for buying cryptos. However, that case vanished earlier this year when the aggregate value of cryptocurrencies briefly surpassed the entire stock of US dollars in circulation (Chart 6). Even with the recent correction, there are 17 cryptocurrencies with market capitalizations above $10 billion (Table 3). Chart 5To The Moon And Back?
To The Moon And Back?
To The Moon And Back?
Chart 6Aggregate Value Of Cryptos Briefly Surpassed The Entire Stock Of US Dollars In Circulation
Aggregate Value Of Cryptos Briefly Surpassed The Entire Stock Of US Dollars In Circulation
Aggregate Value Of Cryptos Briefly Surpassed The Entire Stock Of US Dollars In Circulation
Table 3Close To 20 Cryptos Have A Market Cap In Excess Of US$10bn
The Crypto Impossibility Theorem
The Crypto Impossibility Theorem
What will the ongoing crypto collapse mean for the broader investment landscape? In the near term, the pain in crypto markets could drag down other speculative assets such as tech stocks. In the long term, diminished investor interest in cryptos will benefit the stock market, as investor attention focuses back on equities. For the broader economy, the impact of a crypto bear market will be limited. The banking system has very little exposure to cryptos. There will be a modest adverse wealth effect from falling crypto prices. However, the inability of a few laser-eyed crypto traders to buy their Lambos is hardly going to matter much against the backdrop of strong stimulus-fueled consumption growth in the US and a number of other economies. Investors should continue to overweight stocks in a global asset portfolio, favoring value over growth, cyclicals over defensives, and non-US stocks over their US peers. Peter Berezin Chief Global Strategist pberezin@bcaresearch.com Footnotes 1 Proof of Work (PoW) and Proof of Stake (PoS) are two methods used to ensure the integrity of a coin’s ledger or record of transactions. PoW achieves this by requiring miners (those who add transactions to the ledger) to solve a time-consuming mathematical puzzle. PoS achieves this through a different mechanism, where anyone who stakes their own coin can be randomly selected to add new transactions to the ledger. Those holding or “staking” more coin have a higher probability of being selected. Global Investment Strategy View Matrix
The Crypto Impossibility Theorem
The Crypto Impossibility Theorem
Special Trade Recommendations
The Crypto Impossibility Theorem
The Crypto Impossibility Theorem
Current MacroQuant Model Scores
The Crypto Impossibility Theorem
The Crypto Impossibility Theorem
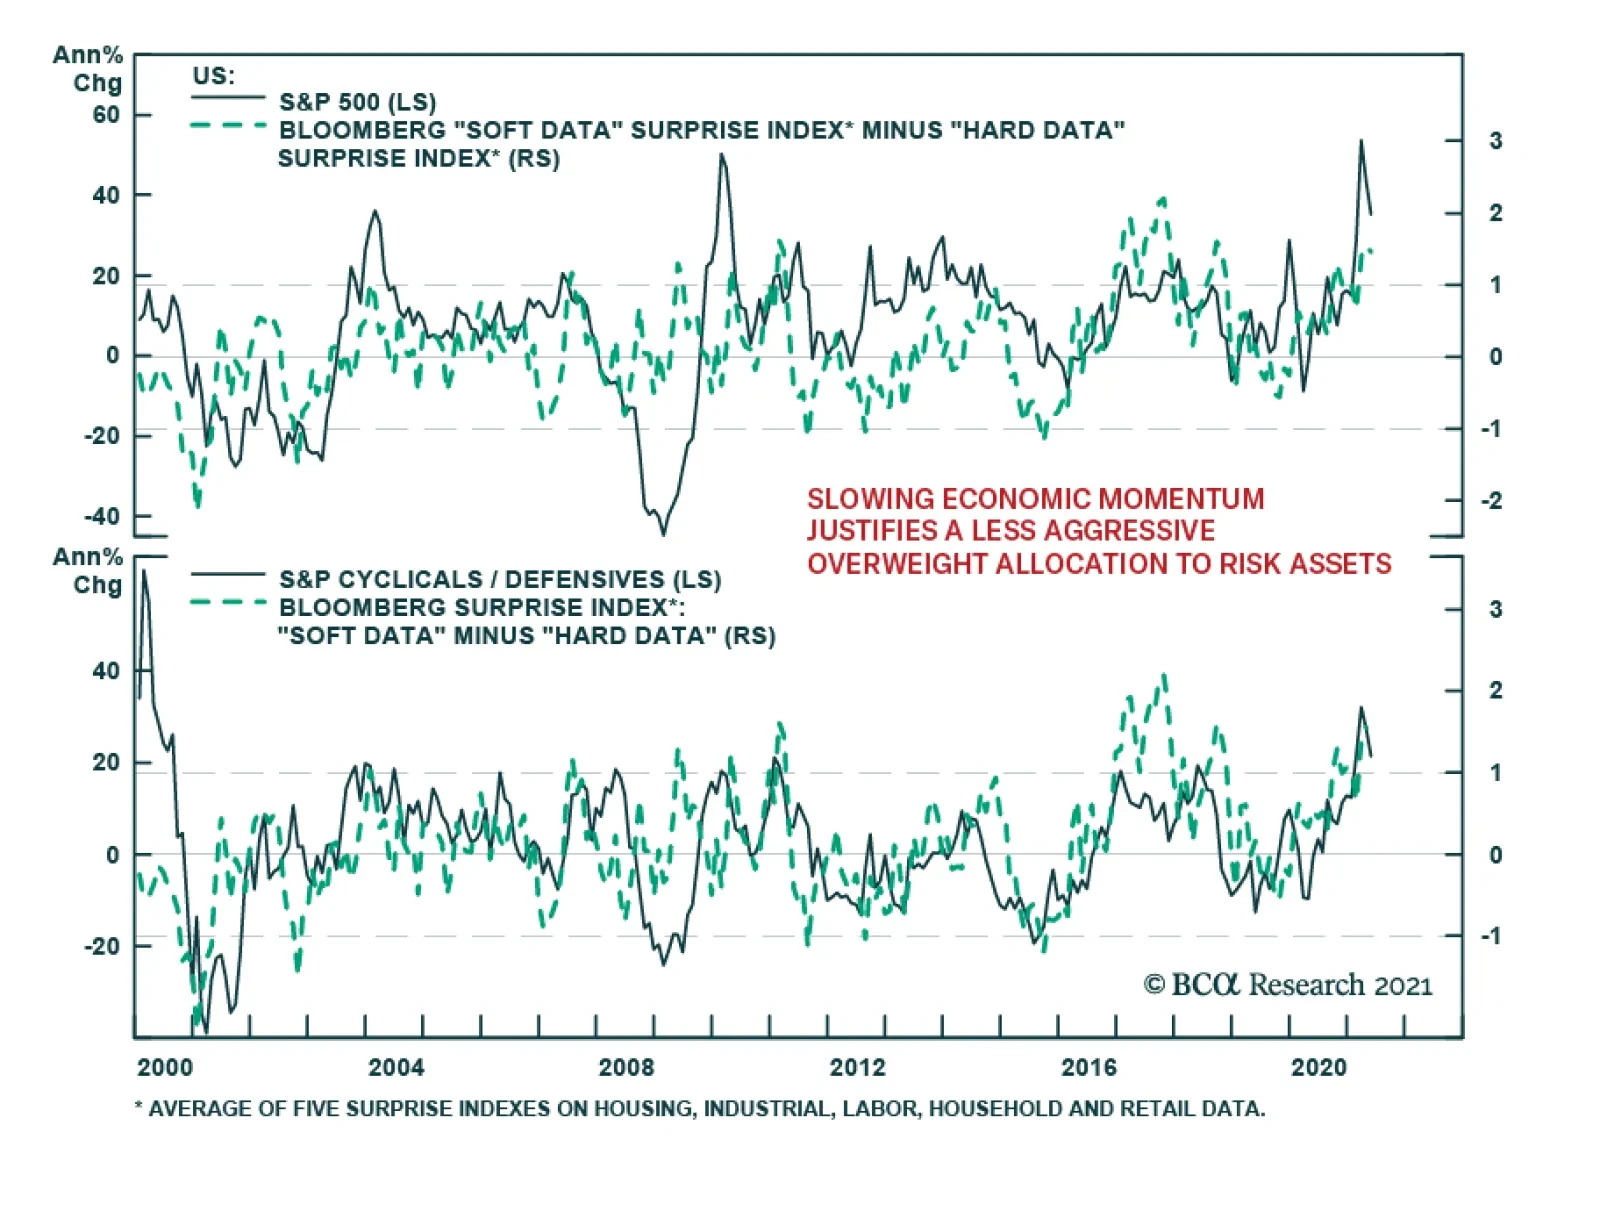
Since last July, the margin of positive surprises from US data releases has been steadily retreating. On Thursday, Citigroup’s US Economic Surprise Index fell below the zero line for the first time since last June – indicating that incoming data is now…
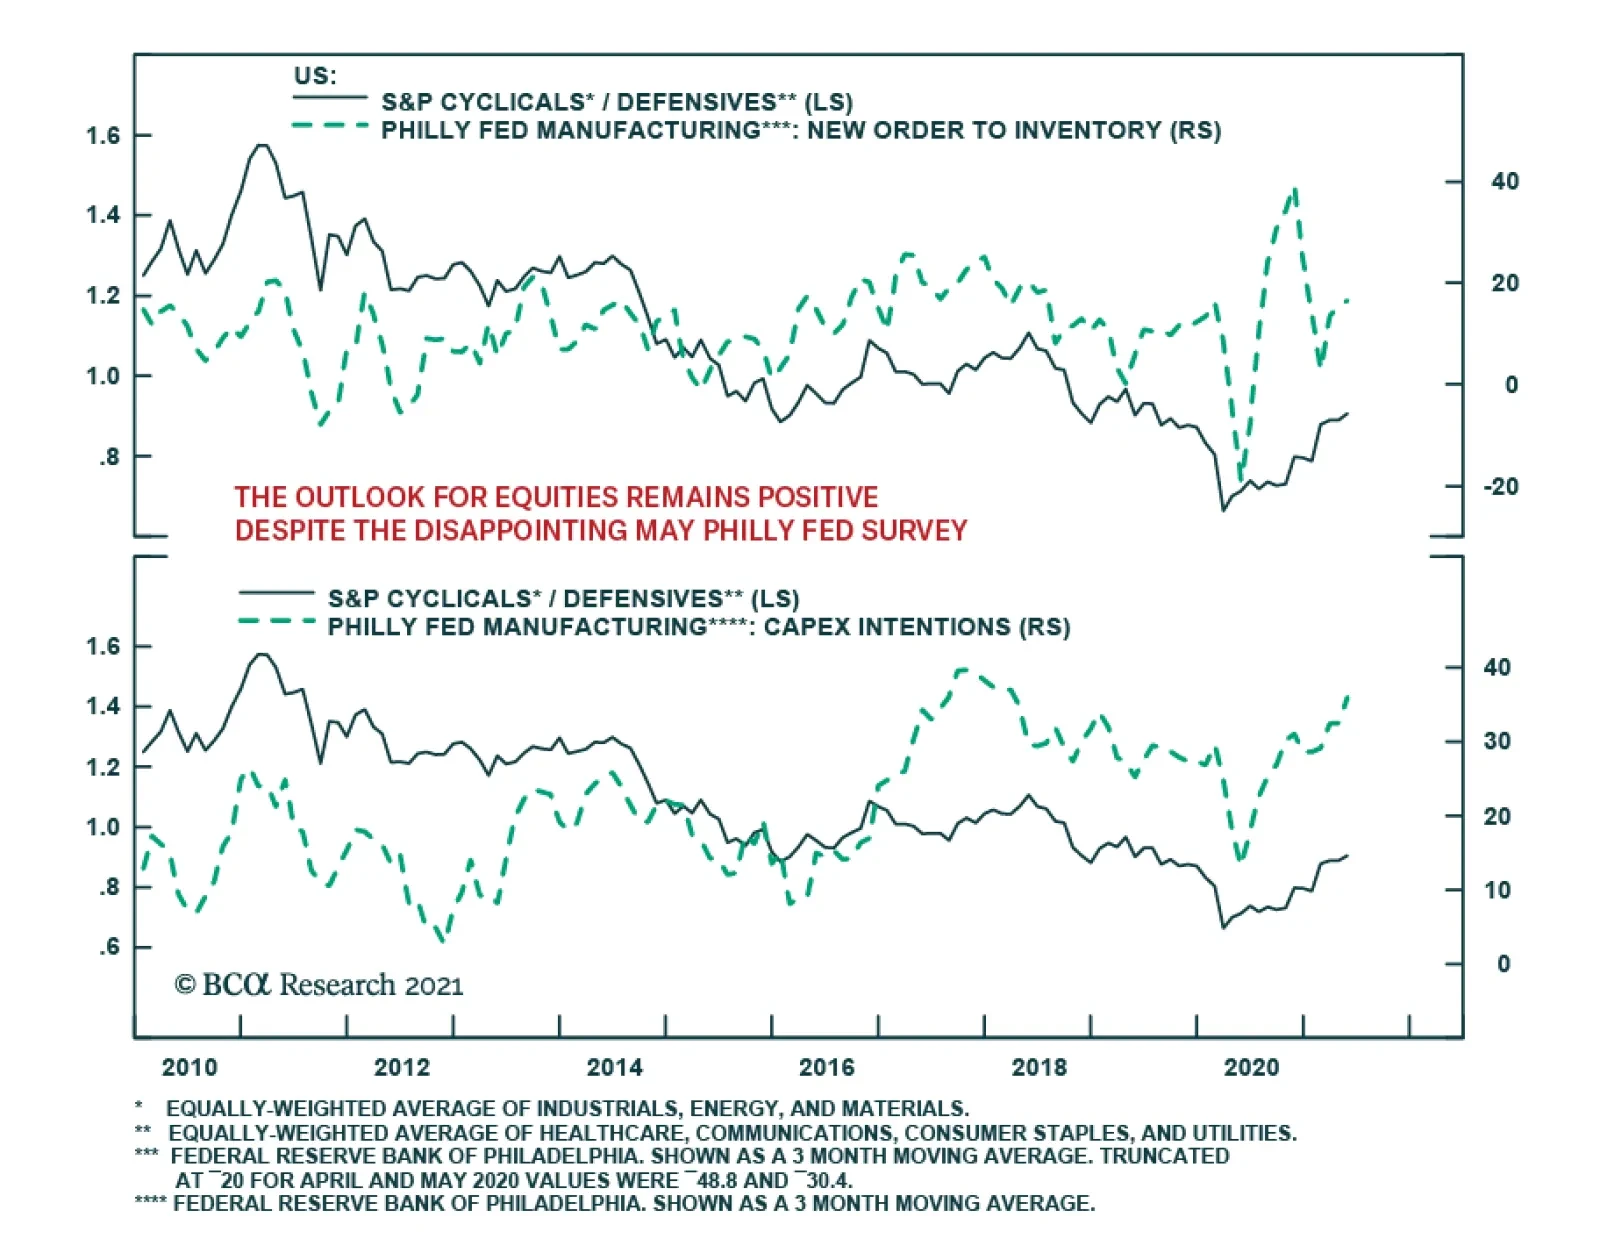
The May Philly Fed Business Outlook survey was a significant disappointment. The current conditions index fell 18.7 points to 31.5, below expectations of a much more muted deceleration to 41.5. Similarly, the expectations index eased to 52.7 from 66.6. The…
Highlights Global oil markets will remain balanced this year with OPEC 2.0's production-management strategy geared toward maintaining the level of supply just below demand. This will keep inventories on a downward trajectory, despite short-term upticks due to COVID-19-induced demand hits in EM economies and marginal supply additions from Iran and Libya over the near term. Our 2021 oil demand growth is lower – ~ 5.3mm b/d y/y, down ~ 800k from last month's estimate – given persistent weakness in realized consumption. We have lifted our demand expectation for 2022 and 2023, however, expecting wider global vaccine distribution and increased travel toward year-end. The next few months are critical for OPEC 2.0: The trajectory for EM demand recovery will remain uncertain until vaccines are more widely distributed, and supply from Iran and Libya likely will increase this year. This will lead to a slight bump in inventories this year, incentivizing KSA and Russia to maintain the status quo on the supply side. We are raising our 2021 Brent forecast back to $63/bbl from $60/bbl, and lifting our 2022 and 2023 forecasts to $75 and $78/bbl, respectively, given our expectation for a wider global recovery (Chart of the Week). Feature A number of evolving fundamental factors on both sides of the oil market – i.e., lingering uncertainty over the return of Iranian and Libyan exports and the strength of the global demand recovery – will test what we believe to be OPEC 2.0's production-management strategy in the next few months. Briefly, our maintained hypothesis views OPEC 2.0 as the dominant supplier in the global oil market. This is due to the low-cost production of its core members (i.e., those states able to attract capital and grow production), and its overwhelming advantage in spare capacity, which we reckon will average in excess of 7mm b/d this year, owing to the massive production cuts undertaken to drain inventories during the COVID-19 pandemic. Formidable storage assets globally – positioned in or near refining centers – and well-developed transportation infrastructures also support this position. We estimate core OPEC 2.0 production will average 26.58mm b/d this year and 29.43mm b/d in 2022 (Chart 2). Chart of the WeekBrent Prices Likely Correct Then Move Higher in 2022-23
Brent Prices Likely Correct Then Move Higher in 2022-23
Brent Prices Likely Correct Then Move Higher in 2022-23
Chart 2OPEC 2.0 Will Maintain Status Quo
OPEC 2.0 Will Maintain Status Quo
OPEC 2.0 Will Maintain Status Quo
The putative leaders of the OPEC 2.0 coalition – the Kingdom of Saudi Arabia (KSA) and Russia – have distinctly different goals. KSA's preference is for higher prices – ~ $70-$75/bbl (basis Brent) to the end of 2022. Higher prices are needed to fund the Kingdom's diversification away from oil. Russia's goal is to keep prices closer to the marginal cost of the US shale-oil producers, who we characterize as the exemplar of the price-taking cohort outside OPEC 2.0, which produces whatever the market allows. This range is ~ $50-$55/bbl. The sweet spot that accommodates these divergent goals is on either side of $65/bbl for this year. OPEC 2.0 June 1 Meeting Will Maintain Status Quo With Brent trading close to $70/bbl, discussions in the run-up to OPEC 2.0's June 1 meeting likely are focused on the necessity to increase the 2.1mm b/d being returned to the market over the May-July period. At present, we do not believe this will be necessary: Iran likely will be returning to the market beginning in 3Q21, and will top up its production from ~ 2.4mm b/d in April to ~ 3.85mm b/d by year-end, in our estimation. Any volumes returned to the market by core OPEC 2.0 in excess of what's already been agreed going into the June 1 meeting likely will come out of storage on an as-needed basis. Libya will likely lift its current production of ~ 1.3mm b/d close to 1.5mm b/d by year end as well. We are expecting the price-taking cohort ex-OPEC 2.0 to increase production from 53.78mm b/d in April to 53.86mm b/d in December, led by a 860k b/d increase in US output, which will take average Lower 48 output in the US (ex-GOM) to 9.15mm b/d by the end of this year (Chart 3). When we model shale output, our expectation is driven by the level of prompt WTI prices and the shape of the forward curve. The backwardation in the WTI forward curve will limit hedged revenues at the margin, which will limit the volume growth of the marginal producer. We expect global production to slowly increase next year, and the year after that, with supply averaging 101.07mm b/d in 2022 and 103mm b/d in 2023. Chart 3US Crude Output Recovers, Then Tapers in 2023
US Crude Output Recovers, Then Tapers in 2023
US Crude Output Recovers, Then Tapers in 2023
Demand Should Lift, But Uncertainties Persist We expect the slowdown in realized DM demand to reverse in 2H21, and for oil demand to continue to recover in 2H21 as the US and EU re-open and travel picks up. This can be seen in our expectation for DM demand, which we proxy with OECD oil consumption (Chart 4). EM demand – proxied by non-OECD oil consumption – is expected to revive over 2022-23 as vaccine distribution globally picks up. As a result, demand growth shifts to EM, while DM levels off. China's refinery throughput in April came within 100k b/d of the record 14.2mm b/d posted in November 2020 (Chart 5). The marginal draw in April stockpiles could also signify that as crude prices have risen higher, the world’s largest oil importer may have hit the brakes on bringing oil in. In the chart, oil stored or drawn is calculated as the difference between what is imported and produced with what is processed in refineries. With refinery maintenance in high gear until the end of this month, we expect product-stock draws to remain strong on the back of domestic and export demand. This will draw inventories while maintenance continues. Chart 4EM Demand Will Recovery Accelerates in 2022-23
EM Demand Will Recovery Accelerates in 2022-23
EM Demand Will Recovery Accelerates in 2022-23
Chart 8China Refinery Runs Remain Strong
China Refinery Runs Remain Strong
China Refinery Runs Remain Strong
COVID-19-induced demand destruction remains a persistent risk, particularly in India, Brazil and Japan. This is visible in the continued shortfall in realized demand vs our expectation so far this year. We lowered our 2021 oil demand growth estimate to ~ 5.3mm b/d y/y, which is down ~ 800k from last month's estimate, given persistent weakness in realized consumption. Our demand forecast for 2022 and 2023 is higher, however, based on our expectation for stronger GDP growth in EM economies, following the DM's outperformance this year, on the back of wider global vaccine distribution year-end (Table 1). Table 1BCA Global Oil Supply - Demand Balances (MMb/d, Base Case Balances)
OPEC 2.0's Production Strategy In Focus
OPEC 2.0's Production Strategy In Focus
Our supply-demand estimates continue to point to a balanced market this year and into 2022-23 (Chart 6). Given our expectation OPEC 2.0's production-management strategy will remain effective, we expect inventories to continue to draw (Chart 7). Chart 6Markets Remained Balanced
Markets Remained Balanced
Markets Remained Balanced
Chart 7Inventories Continue To Draw
Inventories Continue To Draw
Inventories Continue To Draw
CAPEX Cuts Bite In 2023 In 2023, we are expecting Brent to end the year closer to $80/bbl than not, which will put prices outside the current range we believe OPEC 2.0 is managing its production around (Chart 8). We have noted in the past continued weakness in capex over the 2015-2022 period threatens to leave the global market exposed to higher prices (Chart 9). Over time, a reluctance to invest in oil and gas exploration and production prices in 2024 and beyond could begin to take off as demand – which does not have to grow more than 1% p.a. – continues to expand and supply remains flat or declines. Chart 8By 2023 Brent Trades to /bbl
By 2023 Brent Trades to $80/bbl
By 2023 Brent Trades to $80/bbl
Chart 9Low Capex Likely Results In Higher Prices After 2023
OPEC 2.0's Production Strategy In Focus
OPEC 2.0's Production Strategy In Focus
Bottom Line: We are raising our 2021 forecast back to an average of $63/bbl, and our forecasts for 2022 and 2023 to $75 and $78/bbl. We expect DM demand to lead the recovery this year, and for EM to take over next year, and resume its role as the growth engine for oil demand. Longer term, parsimonious capex allocations likely result in tighter supply meeting slowly growing demand. At present, markets appear to be placing a large bet on the buildout of renewable electricity generation and electric vehicles (EVs). If this does not occur along the trajectory of rapid expansion apparently being priced by markets – i.e., the demand for oil continues to expand, however slowly – oil prices likely would push through $80/bbl in 2024 and beyond. Robert P. Ryan Chief Commodity & Energy Strategist rryan@bcaresearch.com Ashwin Shyam Research Associate Commodity & Energy Strategy ashwin.shyam@bcaresearch.com Commodities Round-Up Energy: Bullish The Colonial Pipeline outage pushed average retail gasoline prices in the US to $3.03/gal earlier this week, according to the EIA. This was the highest level for regular-grade gasoline in the US since 27 October 2014. According to reuters.com, the cyberattack that shut down the 5,500-mile pipeline was the most disruptive on record, shutting down thousands of retail service stations in the US southeast. Millions of barrels of refined products – gasoline, diesel and jet fuel – were unable to flow between the US Gulf and the NY Harbor because of the attack, which was launched 7 May 2021 (Chart 10). While most of the system is up and running, problems with the pipeline's scheduling system earlier this week prevented a return to full operation. Base Metals: Bullish Spot copper prices remained on either side of $4.55/lb (~ $10,000/MT) by mid-week following a dip from the $4.80/lb level (Chart 11). We remain bullish copper, particularly as political risk in Chile rises going into a constitutional convention. According to press reports, the country's constitution will be re-written, a process that likely will pave the way for higher taxes and royalties on copper producers.1 In addition, unions in BHP mines rejected a proposed labor agreement, with close to 100% of members voting to strike. In Peru, a socialist presidential candidate is campaigning on a platform to raise taxes and royalties. Precious Metals: Bullish According to the World Platinum Investment Council, platinum is expected to run a deficit for the third consecutive year in 2021, which will amount to 158k oz, on the back of strong demand. Refined production is projected to increase this year, with South Africa driving this growth as mines return to full operational capacity after COVID-19 related shutdowns. Automotive demand is leading the charge in higher metal consumption, as car makers switch out more expensive palladium for platinum to make autocatalysts in internal-combustion vehicles. Ags/Softs: Neutral Corn prices continued to be better-offered following last week's WASDE report, which contained the department's first look at the 2021-22 crop year. Corn production is expected to be up close to 6% over the 2020-21 crop year, at just under 15 billion bushels. On the week, corn prices are down ~ 15.3%. Chart 10
RBOB Gasoline at a High
RBOB Gasoline at a High
Chart 11
Political Risk in Chile and Peru Could Bolster Copper Prices
Political Risk in Chile and Peru Could Bolster Copper Prices
Footnotes 1 Please see Copper price rises as Chile fuels long-term supply concerns published 18 May 2021 by mining.com. Investment Views and Themes Strategic Recommendations Tactical Trades Commodity Prices and Plays Reference Table Trades Closed in 2021 Summary of Closed Trades
Higher Inflation On The Way
Higher Inflation On The Way
Neutral
Revisiting Home Improvement Retailers
Revisiting Home Improvement Retailers
Home improvement retailers (HIR) were among the lucky ones that were allowed to keep their doors open during the pandemic. As a result, these big box retailers benefitted from the lockdown as people used their stimulus checks and newly available free time, thanks to the work from home trend, to remodel their homes. Now that other retailers are opening their doors, the allure of being outright bullish the S&P HIR index has diminished (bottom panel). Add to this the fact that a great deal of future demand was pulled forward for HIR stores, and there is likely little upside left in the S&P HIR index. In addition, rates are moving higher at the margin, and energy costs are also breaking out. Taken together they form our consumer drag indicator and the implication is that the path of least resistance is lower for relative profit growth estimates (middle panel). While the sector faces some headwinds, we remain neutral this consumer discretionary sub-industry and are not ready just yet to downgrade exposure. One offsetting factor is soaring lumber prices that are buttressing profits given that HIR make a set margin on lumber-related sales (not shown). Bottom Line: Stay neutral the S&P home improvement retail index, but stay tuned. The ticker symbols for the stocks in this index are: BLBG: S5HOMI – HD, LOW.