United States
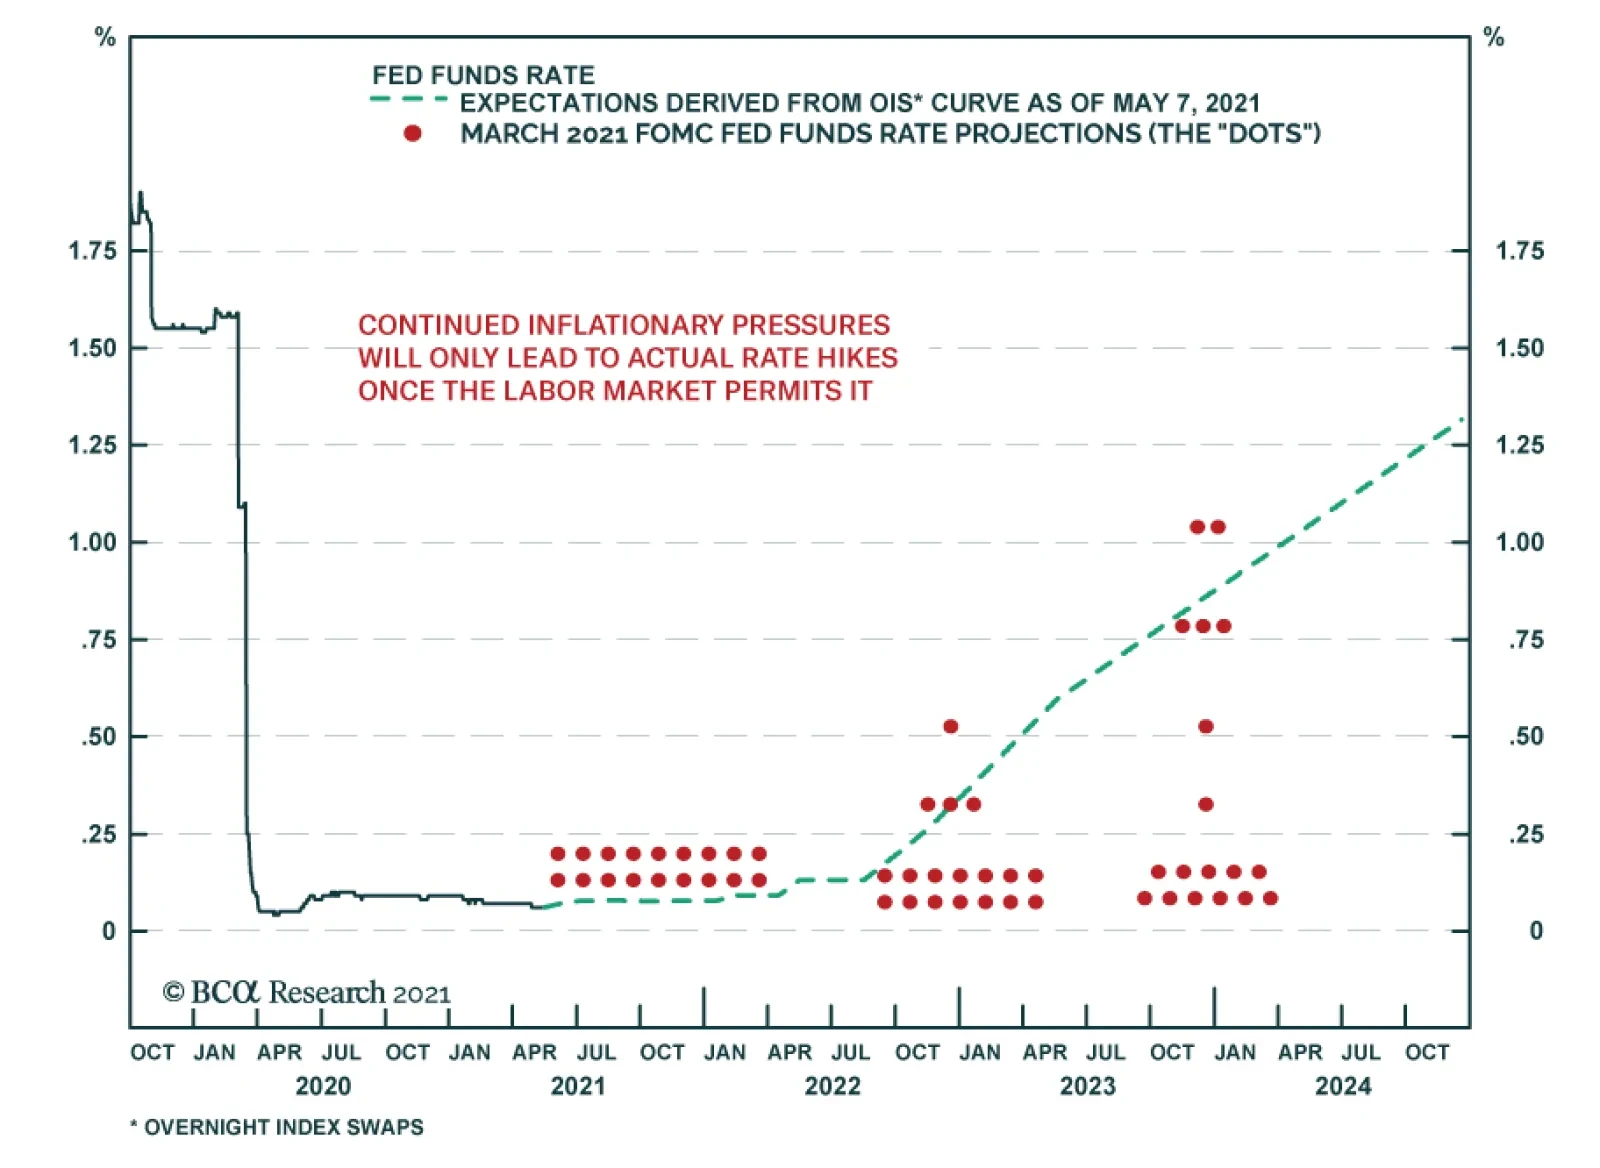
The minutes from the April FOMC meeting, released on Wednesday, were a mixed bag for the market. They echoed statements made by Fed officials in recent communication. Meeting participants noted that “indicators of economic activity and employment had…
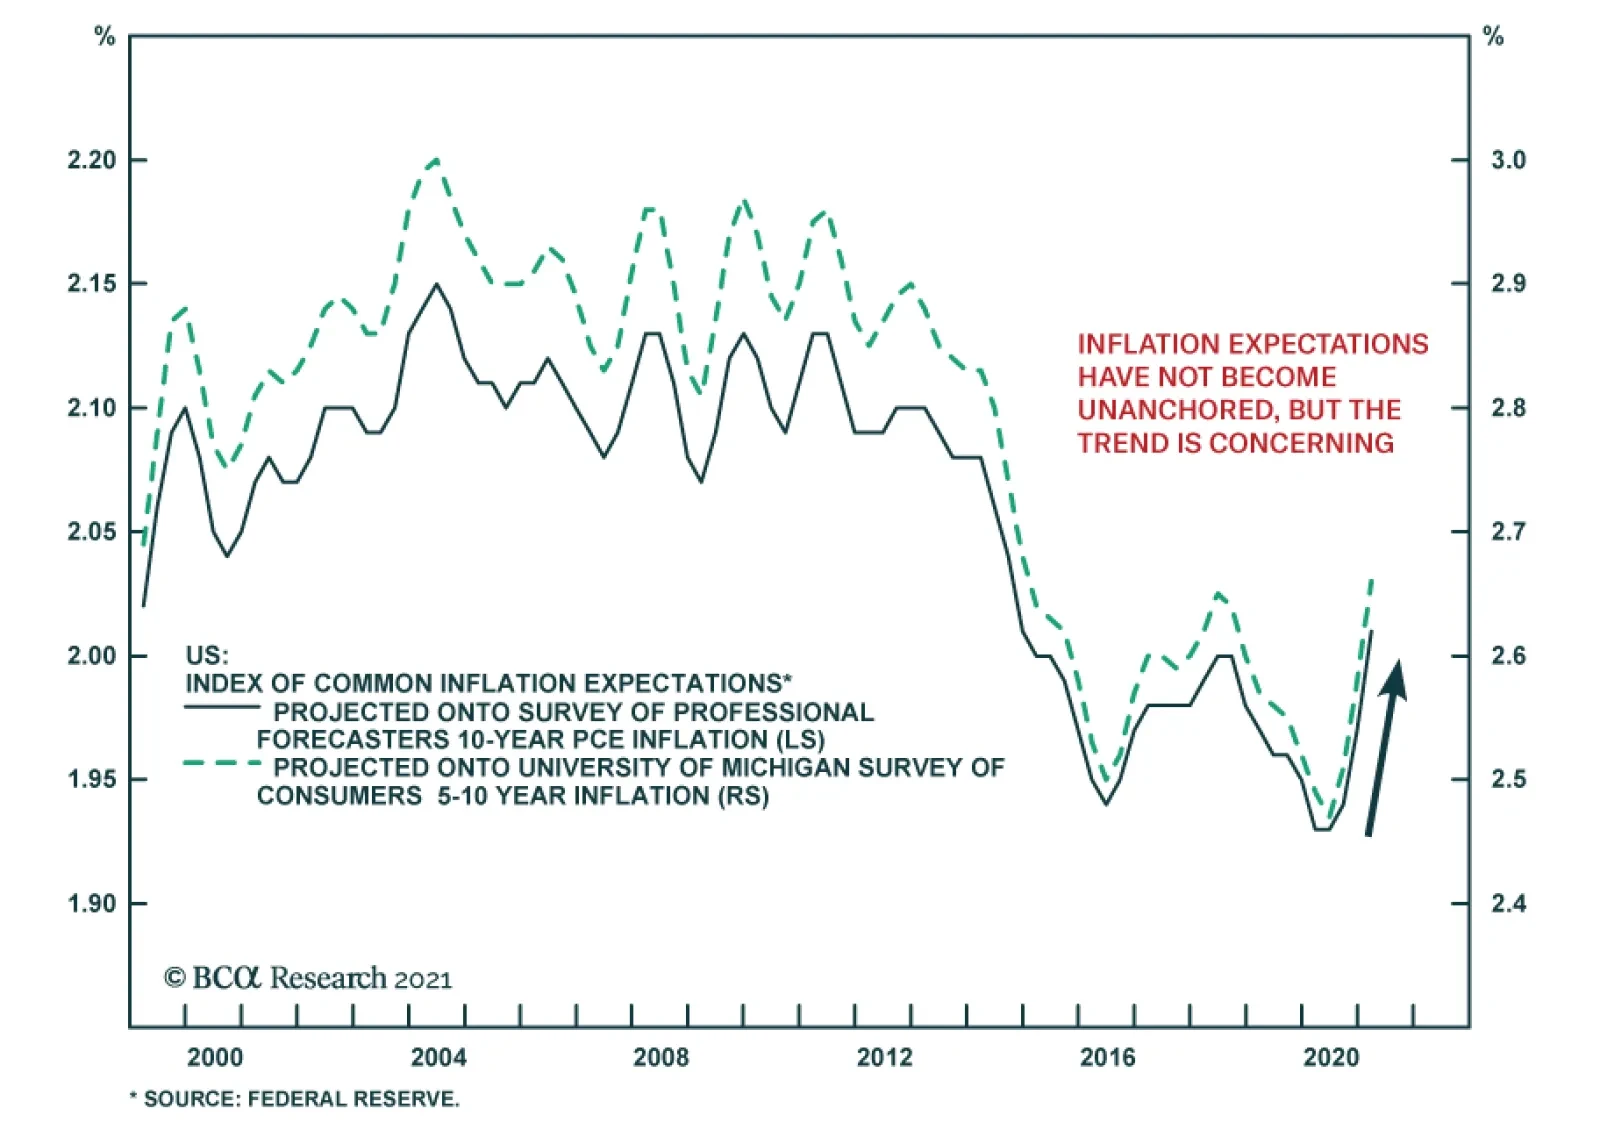
BCA Research has maintained the view that near-term inflationary pressures will prove transitory. The presence of significant economic slack justifies this outlook: employment is still 5% below pre-pandemic levels. Moreover, the factors that are…
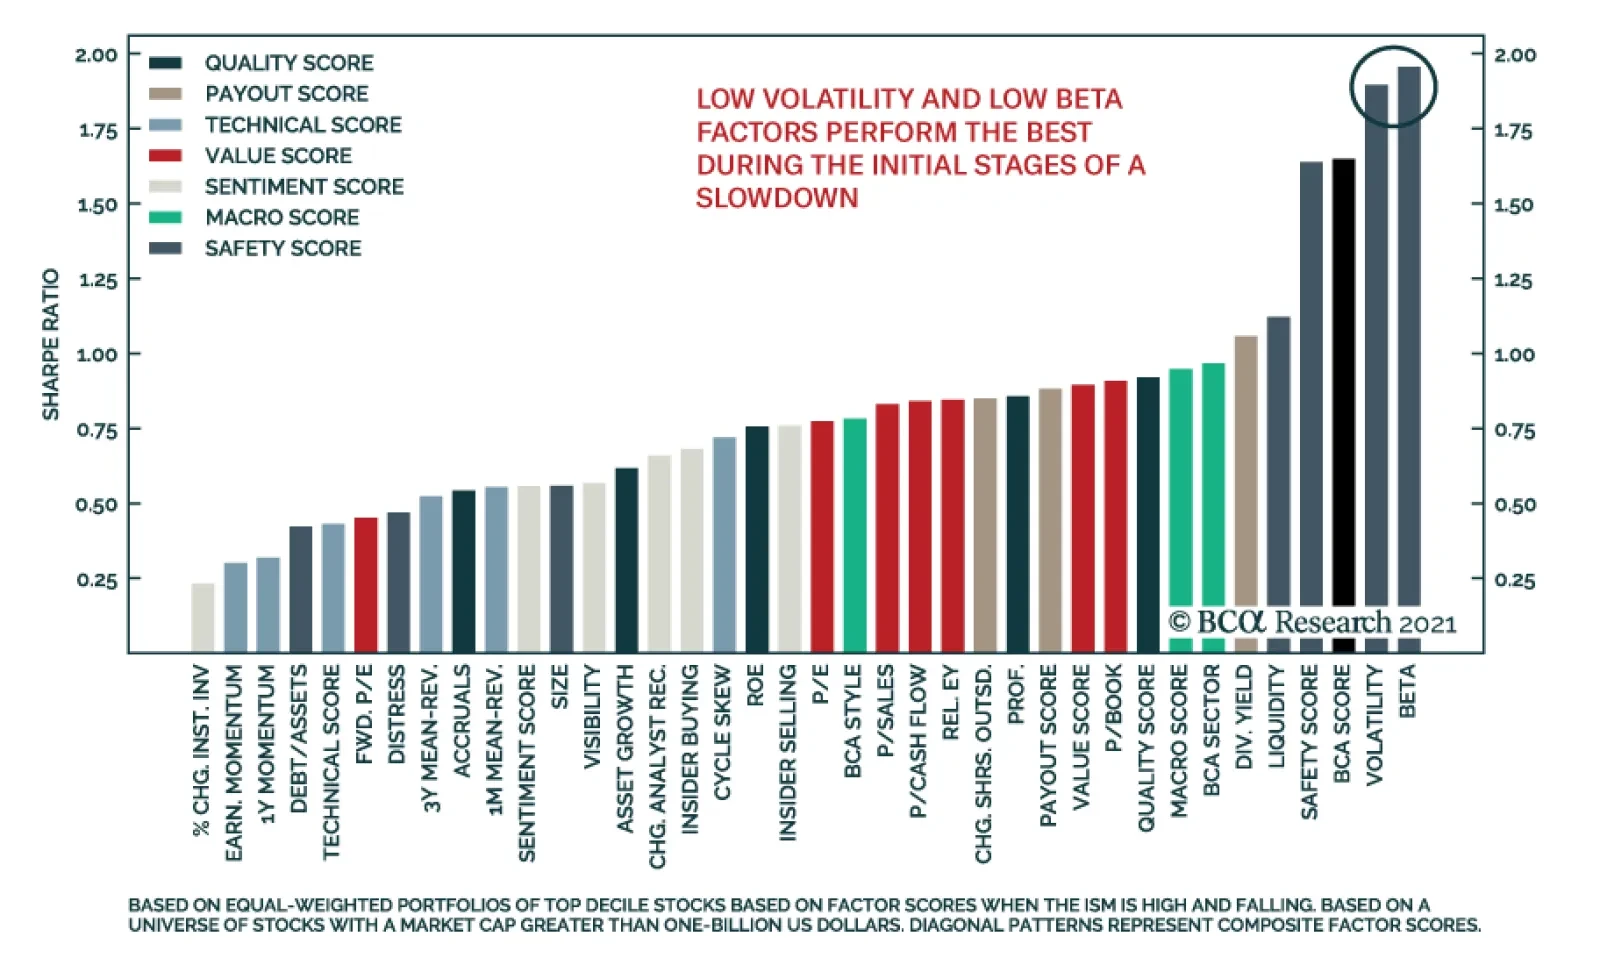
According to our colleagues at BCA Research’s Global Investment Strategy service, US growth has likely peaked as economic momentum slows over the coming quarters. However, given that the slowdown is likely to be relatively benign, they continue to recommend a…

On Shaky Ground
On Shaky Ground
Underweight High-Conviction While our underweight homebuilders call has been offside of late, we are sticking with it given the recent turn in some crucial data series. Interest and mortgage rates are a key determinant for the industry’s relative performance, and given the sell-off in the bond market, it is only a question of when, not if, US building permits will play catch up to the downside (mortgage rates shown inverted, middle panel). If rising mortgage rates (although from a low base) is not enough to cool down the US housing market, then an astronomical rise in lumber prices will likely weigh on it soon. As a reminder, framing lumber accounts for 15-20% of the total cost of building a home (bottom panel). Before long, this input cost inflation will eat into homebuilders’ margins and thus cut into profits. Bottom Line: We reiterate our cyclical and high-conviction underweight stance in the S&P homebuilding index. The ticker symbols for the stocks in this index are: BLBG: S5HOME – LEN, PHM, DHI, NVR.
US growth is set to slow from an exceptionally strong pace, but it will remain robust thanks to a number of factors. US households were sitting on more than $2 trillion in excess savings as of the end of April. Even a partial depletion of these excess savings…
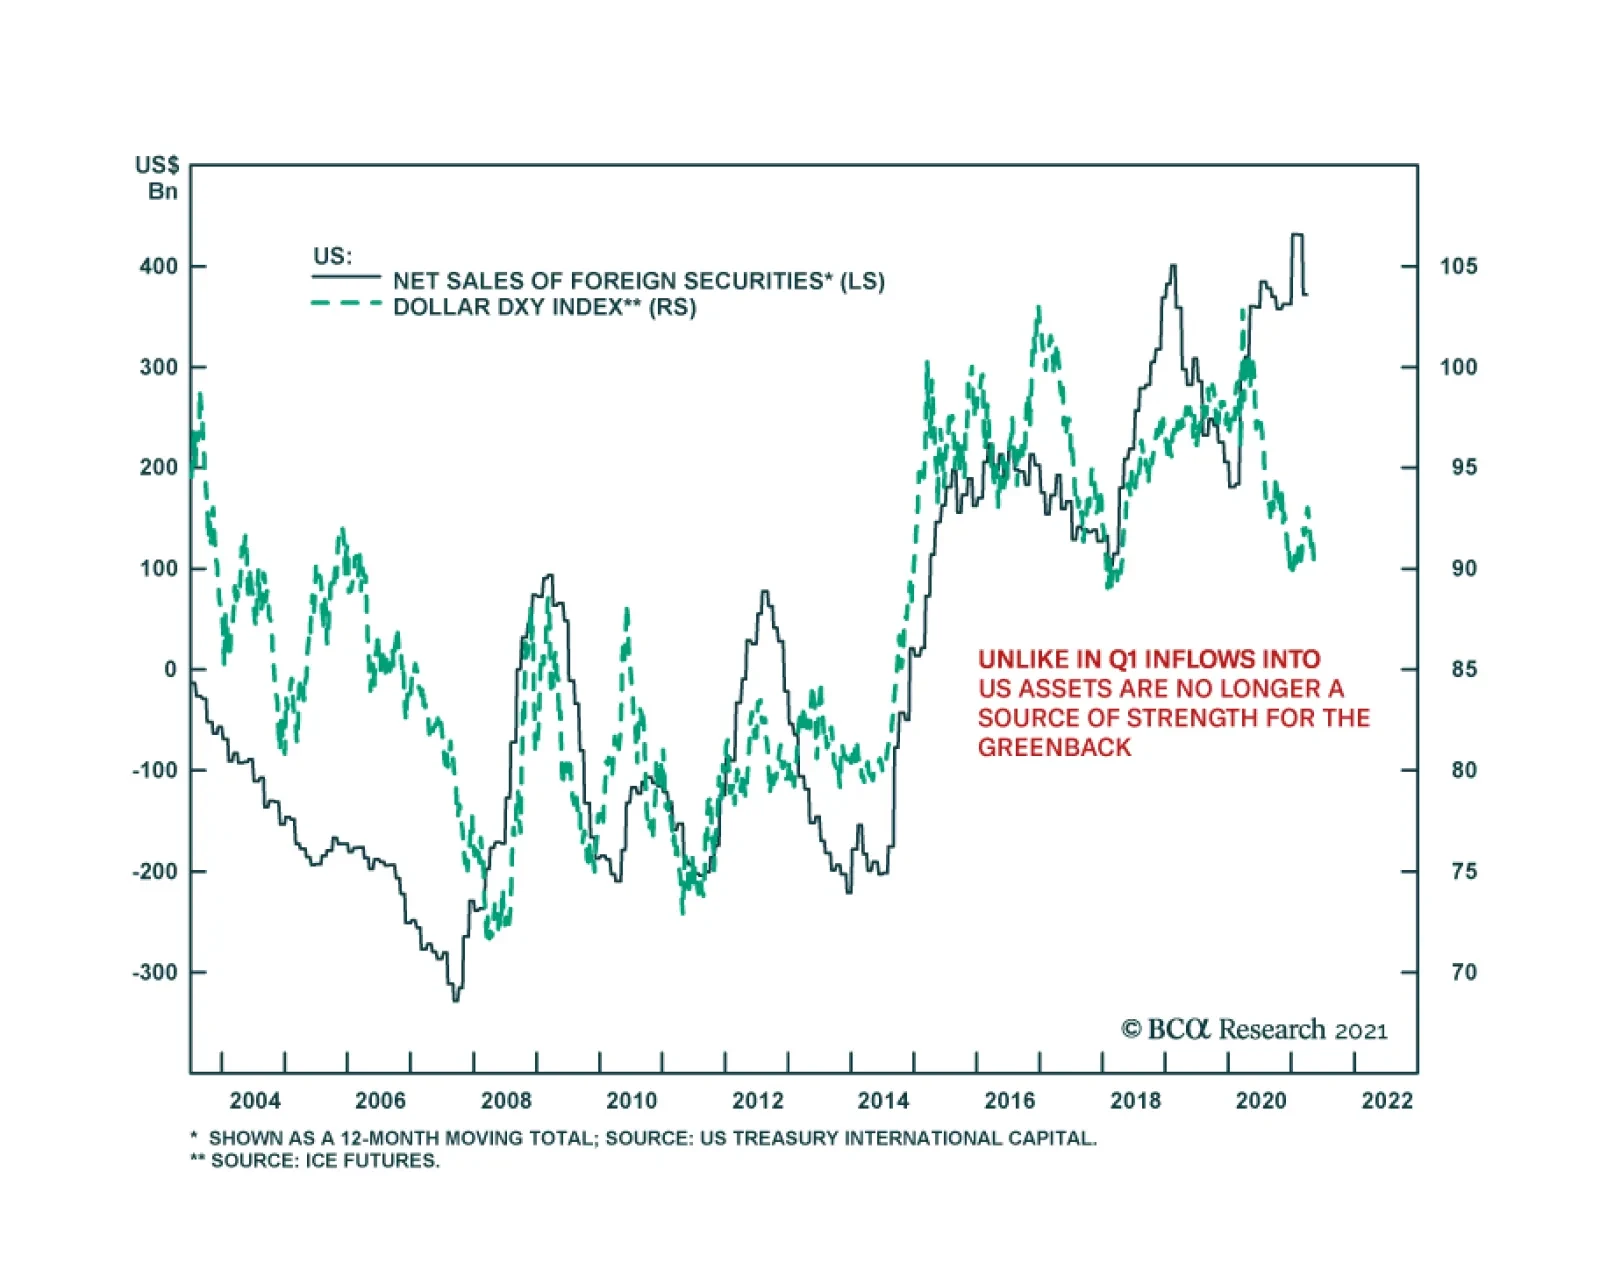
The US dollar was down across the board on Tuesday, and the DXY slipped to 89.79 – the lowest level since January 6th. This performance comes despite the latest data from the US Treasury International Capital (TIC) system which shows that inflows into US…
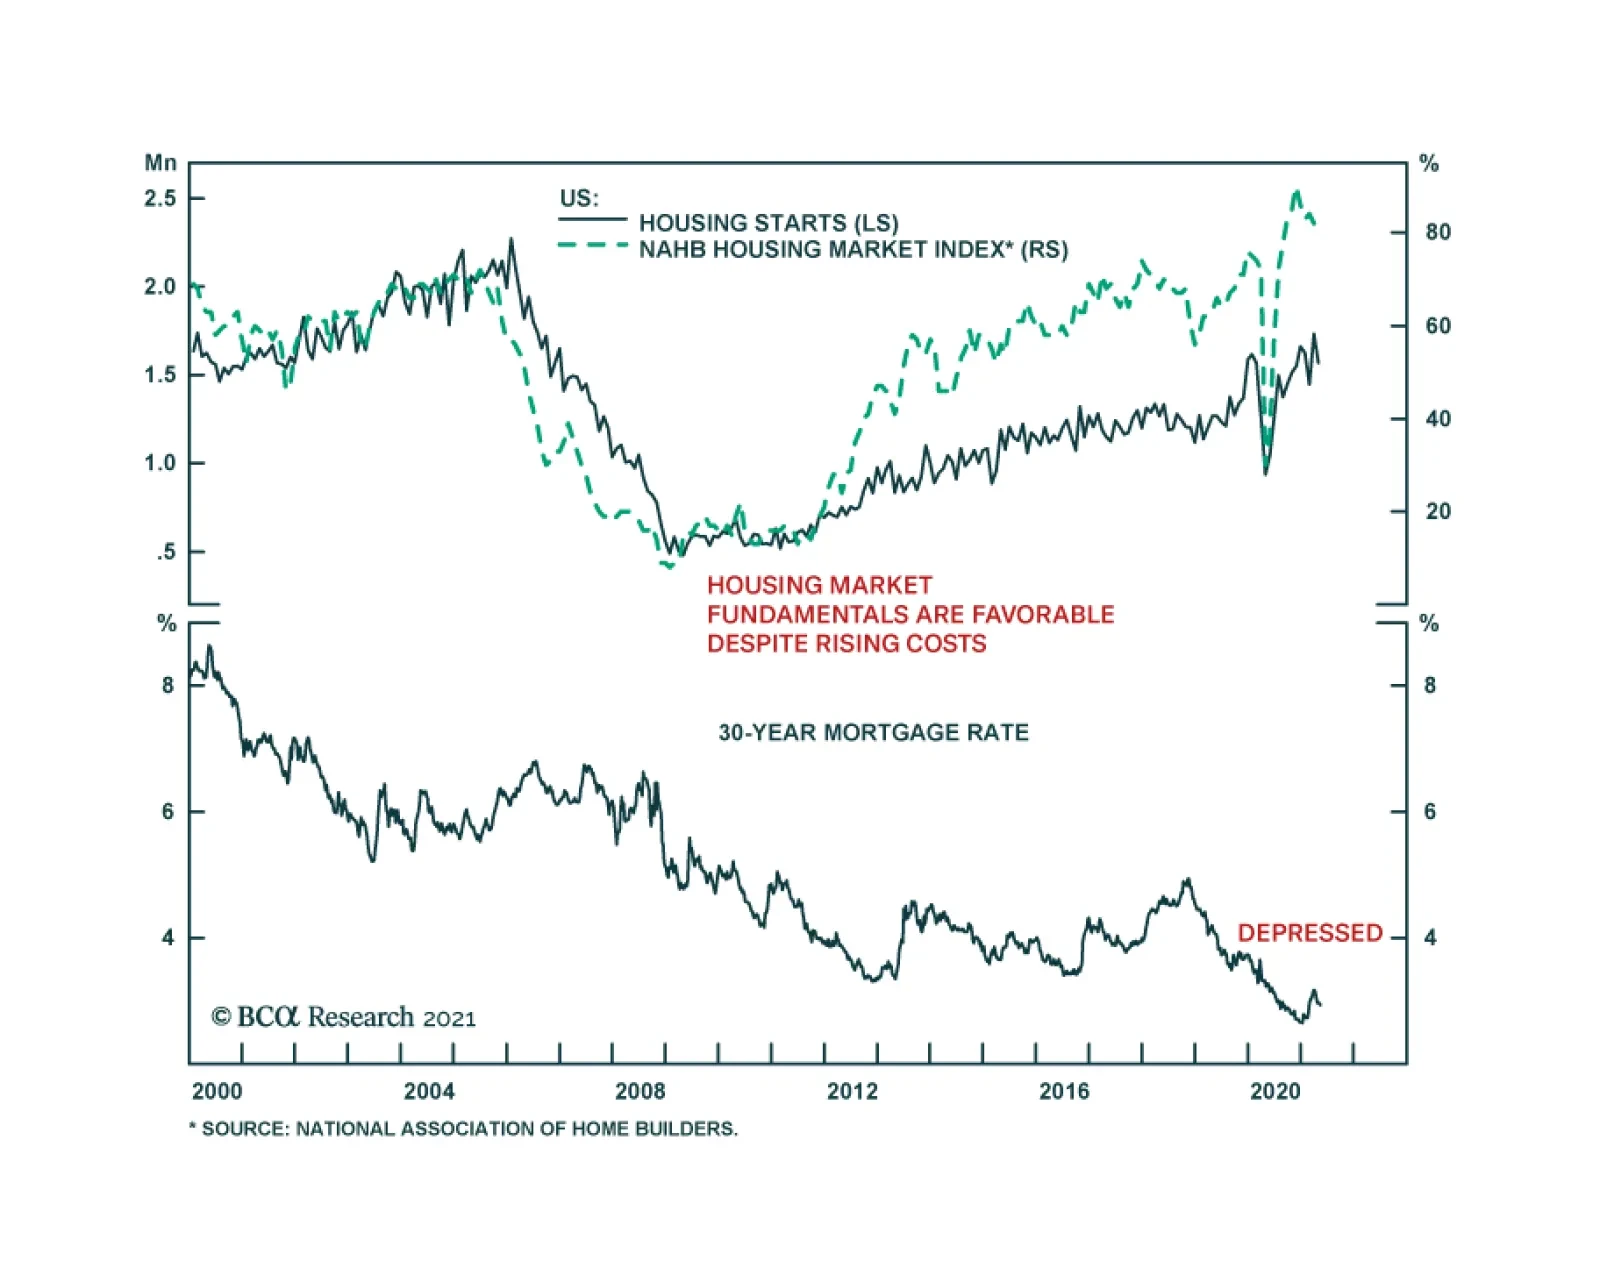
US housing data disappointed in April. Housing starts fell 9.5% m/m following a 19.8% boom in March, missing expectations of a more muted 2.0% m/m decline. Similarly, building permits only rose 0.3% m/m. Part of the pullback can be explained by a…
Chart 1Chart 1
Chart 1
Chart 1
Not only did the pandemic claim millions of human lives and cause irreparable suffering, but it also permanently damaged a number of macro series and indicators, some of which we highlight in today’s Sector Insight report. Easy monetary and fiscal policies especially given the proverbial helicopter drop (stimulus checks) made nearly every consumer series unusable be it unit labor costs, average hourly earnings, unemployment insurance claims, etc. Chart 1 highlights that retail sales, the savings rate, and select inflation data are also rendered useless. As it is widely quoted in the media, the rise in fiscal spending was World War II-like, but M1 money supply plotted on a year-over-year growth rate basis dwarfs government largess (Chart 2). With all that money having to flow somewhere, select commodities are going through five standard deviation moves relative to their 50-year mean! Nevertheless, WTI crude oil trumps all else: it managed the unthinkable and traded down to roughly negative $40/bbl, before rebounding to the current $65/bbl level (Chart 3). Finally, BCA’s boom/bust indicator is just that, bust as the COVID-19 recession wreaked havoc to a previously dependable indicator which gauged different stages of the business cycle (Chart 3). Bottom Line: Further mean reversion looms in economic data across the board including a 4-6% fiscal cliff that will likely come in 2022 (as we highlighted in yesterday’s Webcast) making us wary about the near-term prospects of the US equity market that has likely priced in all the good news. Chart 2Chart 2
Chart 2
Chart 2
Chart 3Chart 3
Chart 3
Chart 3
Dear Client, This week, the US Bond Strategy service is hosting its Quarterly Webcast (May 19 at 10:00 AM EDT, 3:00 PM BST, 4:00 PM CEST, 11:00 PM HKT). In addition, we are sending this Quarterly Chartpack that provides a recap of our key recommendations and some charts related to those recommendations and other areas of interest for US bond investors. Please tune in to the Webcast and browse the Chartpack at your leisure, and do let us know if you have any questions or other feedback. To view the Quarterly Chartpack PDF please click here. Best regards, Ryan Swift, US Bond Strategist
BCA Research’s US Investment Strategy service expects the US economy to grow well above its trend in 2021 and 2022, supported by lavish fiscal transfers and extremely accommodative monetary policy. The team does not consider the recent employment and…