United States

Highlights Important leading indicators of Eurozone activity point to record growth in the coming quarters. Progress on the vaccination front, global pent-up demand, and easing fiscal policy will fuel the Euro Area recovery. Consensus growth expectations for the Eurozone do not reflect this upbeat outlook; hence, European economic surprises will remain firm. Robust economic surprises will help European stocks, especially small-cap ones. They will also allow for a stronger EUR/USD and rising German 10-year yields. The UK economy is strong, and the BoE will be among the first central banks to tighten policy meaningfully. However, investors understand the UK’s strength well. While the cyclical outlook for the pound is bright against both the USD and the EUR, the GBP is vulnerable to some near-term profit taking. Downgrade UK small-cap stocks to neutral on a tactical basis. Feature The case for the Eurozone’s recovery is only growing stronger. However, consensus growth forecasts for the Euro Area remain modest. Faced with this dichotomy, the European economy has ample room to generate positive surprises in the coming months. This process will support European financial assets, small-cap stocks in particular. This contrasts with UK assets, where investors have already embedded generous growth assumptions in response to the country’s rapid pace of vaccination. A tactical downgrade of UK small-cap equities is appropriate. Surprise! Two indicators from outside the Eurozone point to an elevated likelihood that the European economy will generate some exceptionally strong growth numbers over the coming 12 months. First, the Swiss KOF Economic Barometer hit an all-time high in April. The KOF series is an excellent leading indicator of Switzerland’s economic activity, and it currently forecasts record GDP growth and PMIs for that country (Chart 1). This message of strength for Switzerland bodes well for the Eurozone. While the Swiss market is defensive, owing to its heavy exposure to healthcare and consumer staple stocks, the Swiss economy is pro-cyclical. Exports represent 60% of GDP, and exports to the Eurozone account for 40% of this total. Moreover, the growth-sensitive machinery, consumer goods, and chemicals categories account for almost 50% of shipments. Based on these observations, the KOF Economic Barometer forecasting ability unsurprisingly extends beyond Swiss economic variables; it also anticipates positive growth for the Global Manufacturing PMI, the Euro Area Manufacturing PMI, and the Eurozone’s forward earnings (Chart 2). Chart 1Climbing Swiss Peaks
Climbing Swiss Peaks
Climbing Swiss Peaks
Chart 2A Good Sign For The Eurozone
A Good Sign For The Eurozone
A Good Sign For The Eurozone
Second, an aggregation of Swedish economic data confirms the KOF indicator’s message and also calls for record economic activity in Europe. Our Swedish Economic Diffusion Index, which incorporates 14 data series from the Nordic country, points toward a further acceleration in the Euro Area PMIs relative to the US (Chart 3). It is also consistent with a pick-up in the performance of European equities relative to the US. These important indicators of the European economy reflect a variety of forces at play that increasingly point toward stronger growth. Among them, the improvement in the pace of vaccination is crucial to lifting the mood across the continent. As the top panel of Chart 4 illustrates, the number of daily vaccine doses administered across major Euro Area economies is accelerating sharply. While it took three months to inoculate 20% of the population, it only took one month to raise the vaccinated population to nearly 40% (Chart 4, bottom panel). Chart 3Sweden Leads The Eurozone
Sweden Leads The Eurozone
Sweden Leads The Eurozone
Chart 4Accelerating Vaccinations
Accelerating Vaccinations
Accelerating Vaccinations
Euro Area fiscal policy is also moving in a more growth-friendly direction. The Italian Budget announced on April 26 will add EUR248 billion in spending over the next six years. For the moment, Germany has abandoned its debt brake, and, as we wrote three weeks ago, the September election is likely to reify this outcome and further ease fiscal policy in Europe’s biggest economy. Spain is the second largest recipient of the NGEU funds, and it is expected to increase fiscal spending by EUR167 billion over the coming six years. In addition, France has yet to give clear hints about its plan, but next year’s elections are likely to result in further stimulus measures as well. Thus, fiscal easing in Europe will only increase from this point on (Chart 5). Chart 5The Expanding European Stimulus
A Surprising Dance
A Surprising Dance
Accumulated pent-up demand remains another potent fuel for growth in the Euro Area. Unlike in the US, spending on durable goods in the Eurozone has not overtaken its pre-pandemic levels (Chart 6). Furthermore, global inventory-to-sales ratio are low, which hints at a coming inventory restocking cycle. These two trends will benefit Euro Area economic activity. The service sector recovery has more to go. Despite some recent improvements, the Eurozone’s Service PMI remains depressed compared to that of the US (Chart 7, top panel). However, the acceleration in the European vaccination campaign and the continued injection of fiscal support at the same time as the lockdowns ebb should result in a significant catch up in service activity in the Euro Area. Thus, the double-dip recession is on the verge of ending and giving way to a robust GDP expansion (Chart 7, bottom panel). Chart 6Ample European Pent-up Demand
Ample European Pent-up Demand
Ample European Pent-up Demand
Chart 7The Service Sector Recovery Is Paramount
The Service Sector Recovery Is Paramount
The Service Sector Recovery Is Paramount
Even though the recovery in GDP growth will lead to strong positive economic surprises for the Euro Area, consensus growth expectations for the region remain conservative. According to Bloomberg, Eurozone annual GDP growth is expected to reach 12.6% in Q2 because of an extremely strong base effect. However, growth will decelerate suddenly and hit 2.3% in Q3 and 4.3% in Q4. Growth is anticipated to be 4.1% in 2022. These are low thresholds to beat, and thus, economic surprises will remain positive. Chart 8Decomposing The Surprises
Decomposing The Surprises
Decomposing The Surprises
The source of positive economic surprises is likely to be broad-based. If the service sector recaptures some of its previous shine, the Surveys and Business Cycle component and the Labor Market component of the Bloomberg surprises index will improve and remain positive for many months (Chart 8). Moreover, the absorption of pent-up demand will allow the Retail and Wholesale as well the Personal/Household components to remain robust or firm up further. Finally, the strength of the global manufacturing sector and the elevated potential for a global inventory restocking will allow the Industrial component to firm up anew. Bottom Line: The European economy is in a good place to validate the upbeat message from the KOF Economic Barometer or the Swedish Economic Diffusion Index. Since expectations for European economic activity are still limited for the second half of 2021, this strong growth performance will result in positive economic surprises. Investment Implications The heightened odds that Europe will generate significant positive economic surprises for the coming quarters means that investors’ perspective of the Euro Area will gradually improve. While this process will ultimately curtail the ability of Europe to beat expectations, it will also lift Eurozone assets. If our forecast is correct that European economic surprises will largely be positive over the coming 6 to 12 months, then European equities are more likely to generate generous returns than otherwise. Table 1 highlights that positive changes in the Economic Surprise Index (ESI) on a 3-month, 6-month, and 12-month horizon coincide with returns of the Euro Area MSCI equity benchmarks that have positive batting averages of 72%, 70%, and 73%, respectively. Moreover, the average and median returns are significantly higher than when the ESI deteriorates. Table 1Forecasting Strong Surprises Means Forecasting Strong Equity Returns
A Surprising Dance
A Surprising Dance
The signal from the ESI is weaker if we do not make forecasts about its direction. The batting averages of subsequent 3-month and 6-month equity returns following an improving ESI are 63% and 69%, respectively, and the median subsequent returns are higher than if today’s ESI is deteriorating, but not to the same extent as when we make a forecast of the ESI. 12-month returns for the Eurozone MSCI index have a 58% chance of being positive, if the ESI increases over a 12-month window, which is lower than the 63% batting average if the ESI worsens. Moreover, average and median 12-month expected returns are somewhat higher if the ESI has been deteriorating rather than improving over the past 12-month period. European small cap equities will be prime beneficiaries of the coming growth outperformance. From an economic perspective, this makes sense because small-cap stocks are geared more toward domestic growth than large-cap equities, which are dominated by multinationals. Table 2 shows that 3-month, 6-month, and 12-month periods of improvement in the surprise index precede an outperformance of small-cap relative to large-cap stocks over similar windows of time. Thus, the current positive level of the European ESI and its ability to rise further should favor small-cap European equities. Table 2Favor Small-Cap Stocks
A Surprising Dance
A Surprising Dance
Table 3A Bullish Backdrop For EUR/USD
A Surprising Dance
A Surprising Dance
The same exercise shows that the outlook also favors the euro. European economic surprises should continue to outpace the US, because Eurozone growth will catch up to the US, but investors already have much loftier expectations for US activity than for the Euro Area. Table 3 illustrates that periods when the Eurozone’s ESI is greater than that of the US, EUR/USD generates a positive 3-month return 65% of the time, with a median gain of 1.3%. When the US ESI is higher, the EUR/USD depreciates 55% of the time, with a median loss of -0.5%. Chart 9Rising German Yields?
Rising German Yields?
Rising German Yields?
Finally, the potential for stronger European ESI is negative for Bunds. Speeches by various members of the European Central Bank Governing Council indicate that the ECB will tolerate higher yields, if they reflect stronger economic activity. As the European vaccination campaign advances and the fiscal stimulus increases, the need to maintain depressed Bunds yields recedes. Hence, a continuation of positive ESI readings is now more likely to boost these yields. Additionally, the gap between the European ESI and the US one will remain positive, thus, a period of rising German yields relative to the US is more likely (Chart 9). Bottom Line: The ability of the European economy to continue to surprise positively should generate attractive equity returns on the continent. Moreover, this economic backdrop is consistent with an outperformance of small-cap equities, as well as an appreciating EUR/USD. Under these circumstances, Bunds yields should experience more upside. Country Focus: The UK’s Outlook Is Brightening, Unsurprisingly Last week, the Bank of England left the total size of its asset purchase program in place at GBP875 billion, even if the weekly pace of purchases was slowed to GBP3.4 billion from GBP4.4 billion. The BoE also raised its 2021 growth forecast to 7.5%, from 5% in February. The BoE is joining the Bank of Canada as one of the first central banks to taper its asset purchase program. It will also be one of the first central banks to increase interest rates, after the Norges Bank, but ahead of the Fed. In a way, the UK shares many similarities with our recent positive depiction of the Swedish economy. Chart 10Support For Household Net Worth
Support For Household Net Worth
Support For Household Net Worth
The rapid pace of vaccination in the UK allows for a vigorous economic recovery. In all likelihood, the UK economy will have contracted in Q1 2021 because of the severe lockdowns that prevailed then; however, these lockdowns are being eased and economic fundamentals point up. Our Global Fixed Income and Foreign Exchange strategists recently demonstrated that house prices are increasing on the back of rising mortgage approvals and falling household debt-servicing obligations (Chart 10). The robust readings of the RICS House Prices survey only confirm the positive outlook for housing prices. Expanding house prices will elevate consumption. An appreciating housing stock boosts the wealth of households and leads to higher UK consumer confidence. Moreover, business confidence is improving; the rise in capex intentions not only indicates that investments will increase, but is also a precursor to climbing job vacancies (Chart 11). Brighter labor market prospects often result in rising consumption, especially if wages firm up, as we argued seven weeks ago. The current bout of economic strength points to some upside in UK inflation as well. The elevated PMI readings and the rapid increase in construction activity are reliable forecasters of higher CPI prints (Chart 12). However, this not a uniquely British phenomenon, and it remains to be seen how durable this rising inflation will be. Chart 11UK Consumption Will Rise More
UK Consumption Will Rise More
UK Consumption Will Rise More
Chart 12Accelerating UK Inflation
Accelerating UK Inflation
Accelerating UK Inflation
Despite this positive economic outlook, investors should adopt a more cautious tactical stance toward UK markets. The problem for British assets is that investors have understood UK’s vaccination strength so well that they embed much optimism in the price of financial instruments levered to domestic economic activity. In contrast to the Eurozone, Bloomberg consensus forecast anticipate Q2 year-on-year GDP growth of 20.7%, 6.1% for Q3 and 6.5% for Q4. Cable is particularly ripe for some near-term profit taking. Our Intermediate-Term Technical Indicator and the 52-week rate of change of GBP/USD, as well as net speculative positions and sentiment, all point to a correction in that pair (Chart 13). Moreover, the 13-week momentum measure for EUR/GBP shows that the rapid decline in this cross is also overdone. As a result, BCA’s Foreign Exchange strategists closed their short EUR/GBP position to book some gains. It is also time to downgrade British mid- and small-cap stocks from our current overweight stance, at least on a tactical basis. Compared to large-cap UK stocks, small-cap names have moved in a parabolic fashion, and the ratio’s elevated 52-week rate-of-change measure warns of a pullback, especially in light of the deterioration in near-term momentum (Chart 14). The message from technical indicators is particularly concerning, because the forward earnings of small-cap stocks are plunging relative to large cap ones (Chart 15). Additionally, valuation multiples on UK small-cap stocks have vastly outpaced those of their larger counterparts, despite a rapid decline in relative RoE (Chart 16). Chart 13Cable Is Ripe For Some Near-Term Profit Taking
Cable Is Ripe For Some Near-Term Profit Taking
Cable Is Ripe For Some Near-Term Profit Taking
Chart 14UK Small-Cap Stocks Are Technically Vulnerable
UK Small-Cap Stocks Are Technically Vulnerable
UK Small-Cap Stocks Are Technically Vulnerable
Chart 15Deteriorating Profit Performance
Deteriorating Profit Performance
Deteriorating Profit Performance
Chart 16Quite The Valuation Premium
Quite The Valuation Premium
Quite The Valuation Premium
Ultimately, these cautious views are of a short-term nature. BCA’s Foreign Exchange strategists remain upbeat on the pound on a 12- to 24-month basis. Cable continues to trade at a deep discount to our purchasing-power parity estimate, which adjusts for the composition of price indexes in the UK and the US (Chart 17). Moreover, real short rate differentials still favor GBP/USD. The pound also trades at a discount to the euro based on long-term valuation metrics. Most importantly, real interest rates differentials at both the short- and long-end of the curve, as well as the outlook for the evolution of monetary policy in the UK relative to the Euro Area, indicate a significantly lower EUR/GBP (Chart 18). Chart 17Despite Nera-term risks, Cable's Cyclical Underpinning Is Strong
Despite Nera-term risks, Cable's Cyclical Underpinning Is Strong
Despite Nera-term risks, Cable's Cyclical Underpinning Is Strong
Chart 18Lower EUR/GBP Ahead
Lower EUR/GBP Ahead
Lower EUR/GBP Ahead
For small-cap equities, the cyclical picture is more complex. On the one hand, their domestic exposure and a higher pound over the coming 12 to 24 months should help them, unlike the large-cap UK stocks, which derive most of their income from abroad and are negatively affected by a higher GBP. On the other hand, UK small-cap stocks have become so expensive that we need to see how an appreciating pound will boost their earnings relative to large-cap stocks before adjusting our neutral stance. Bottom Line: The strong UK economy will allow the BoE to be one of the first major DM central banks to tighten policy. This will support a further appreciation of the pound against both the dollar and the euro over the coming 12 to 24 months. Nonetheless, the GBP has been overbought on a tactical basis and is vulnerable to a near-term pullback. Similarly, compared to large-cap equities, we are downgrading small-cap UK stocks from overweight to neutral on a tactical basis. Mathieu Savary, Chief European Investment Strategist Mathieu@bcaresearch.com Jeremie Peloso, Associate Editor JeremieP@bcaresearch.com Cyclical Recommendations Structural Recommendations Trades Currency Performance
A Surprising Dance
A Surprising Dance
Fixed Income Performance Government Bonds
A Surprising Dance
A Surprising Dance
Corporate Bonds
A Surprising Dance
A Surprising Dance
Equity Performance Major Stock Indices
A Surprising Dance
A Surprising Dance
Geographic Performance
A Surprising Dance
A Surprising Dance
Sector Performance
A Surprising Dance
A Surprising Dance
Closed Trades
BCA Research’s Global Investment Strategy service concludes that inflation might not rise much until the labor market has severely overheated. The Phillips curve was reasonably steep between the mid-1960s and mid-1980s. As such, a falling output gap…
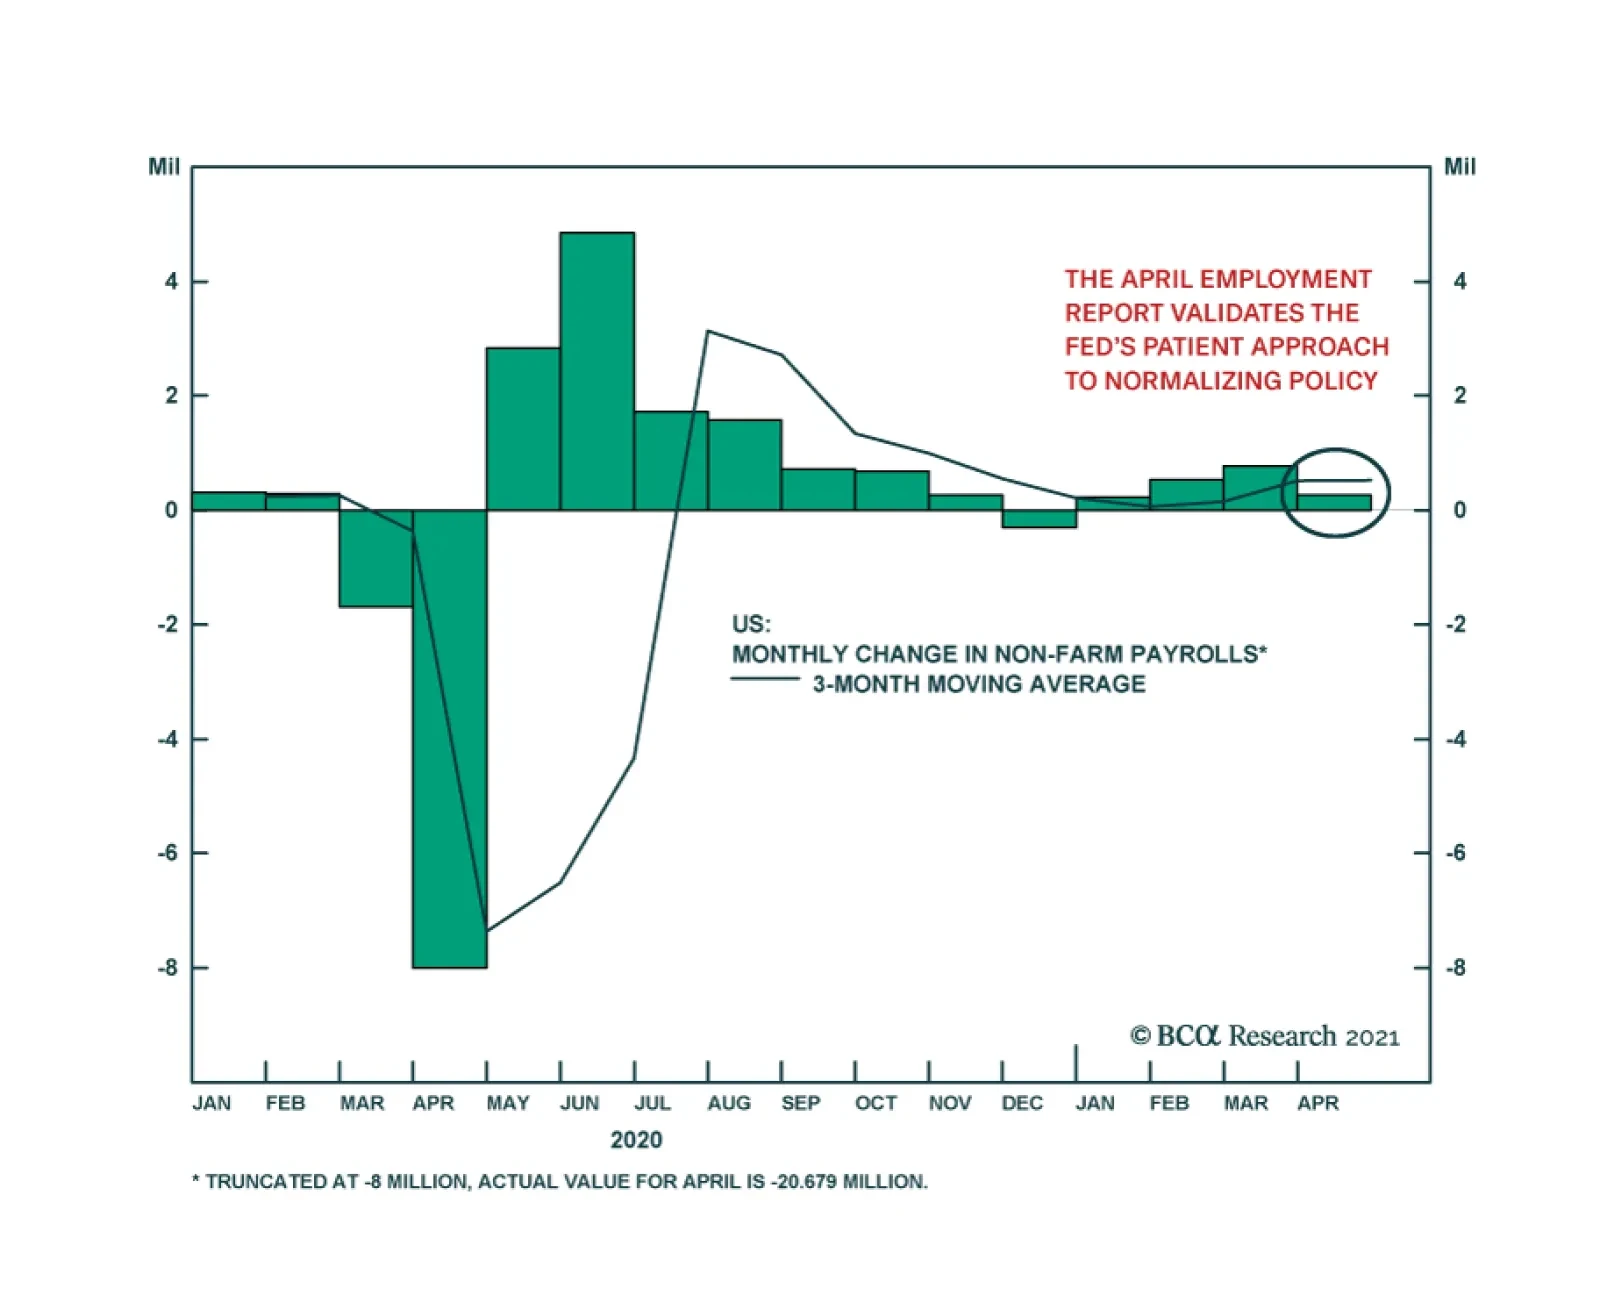
Friday’s US employment report was a monumental miss. Total nonfarm payroll employment increased by 266 thousand in April, a fraction of the 1 million expected by the consensus. Adding to the downbeat tone of the report is the 146 thousand downward revision to…
Highlights The modern-day version of the Phillips curve posits that core inflation is determined by long-term inflation expectations and the amount of slack in the economy. In practice, using the Phillips curve to forecast inflation is complicated by uncertainty over: 1) the true size of the output gap; 2) the degree to which changes in the output gap affect inflation; and 3) the drivers of long-term inflation expectations. While economists should be humble in forecasting inflation trends, the bulk of the evidence suggests that core inflation will remain subdued for the next two-to-three years. However, when inflation eventually does begin to rise, it could happen faster and more forcefully than expected. For the time being, inertia in inflation expectations will allow the Fed and other central banks to maintain a highly accommodative monetary stance. This will keep a lid on bond yields, while fueling further gains in equity prices. Today’s goldilocks environment will give way to a period of stagflation in the second half of the decade, however. The Phillips Curve: Flat… For Now It has become fashionable to criticize the Phillips curve. The reason is understandable: Wild swings in the unemployment rate over the past few decades have failed to translate into meaningful changes in inflation. As we argue in this report, however, it is too early to write off the Phillips curve. Perhaps not today, perhaps not tomorrow, but at some point, it will come roaring back. Investors need to be on guard for when it happens. Conceptually, the modern-day version of the Phillips curve posits that core inflation is a function of long-term inflation expectations and the amount of slack in the economy. Mathematically, it can be written as:
Dissecting The Phillips Curve
Dissecting The Phillips Curve
Where πt is core inflation at time t, πe is expected long-term inflation, y is GDP, ȳ is the potential (or “full employment”) level of GDP, and α is a parameter specifying how sensitive inflation is to changes in the output gap, yt – ȳt. A positive output gap implies that output is above potential while a negative gap implies output is below potential. The equation reveals three sources of uncertainty about inflation: 1) the true size of the output gap; 2) the degree to which changes in the output gap affect inflation; and 3) the drivers of long-term inflation expectations. Let’s examine all three sources of uncertainty in order to gauge where the balance of risks to inflation lie over the coming months and years. 1. What Is The Current Size Of The Output Gap? Chart 1Prime-Age Employment-To-Population Ratios Remain Below Pre-Pandemic Levels
Prime-Age Employment-To-Population Ratios Remain Below Pre-Pandemic Levels
Prime-Age Employment-To-Population Ratios Remain Below Pre-Pandemic Levels
The short answer is that no one knows. The employment-to-population ratio in the OECD for workers between the ages of 25-to-54 was still more than two percentage points below pre-pandemic levels as of the end of last year (Chart 1). The labor market has tightened since then, especially in the US. However, even if US payrolls rise by 1 million in April as per Bloomberg consensus estimates, total employment would still be down 4.7% from January 2020. Admittedly, other data point to a much tighter labor market. US small businesses surveyed by the NFIB have been reporting grave difficulty in finding qualified workers (Chart 2). The job openings rate is at an all-time high, while the quits rate is near pre-pandemic levels (Chart 3). Chart 2US: Temporary Labor Shortage (I)
US: Temporary Labor Shortage (I)
US: Temporary Labor Shortage (I)
Chart 3US: Temporary Labor Shortage (II)
US: Temporary Labor Shortage (II)
US: Temporary Labor Shortage (II)
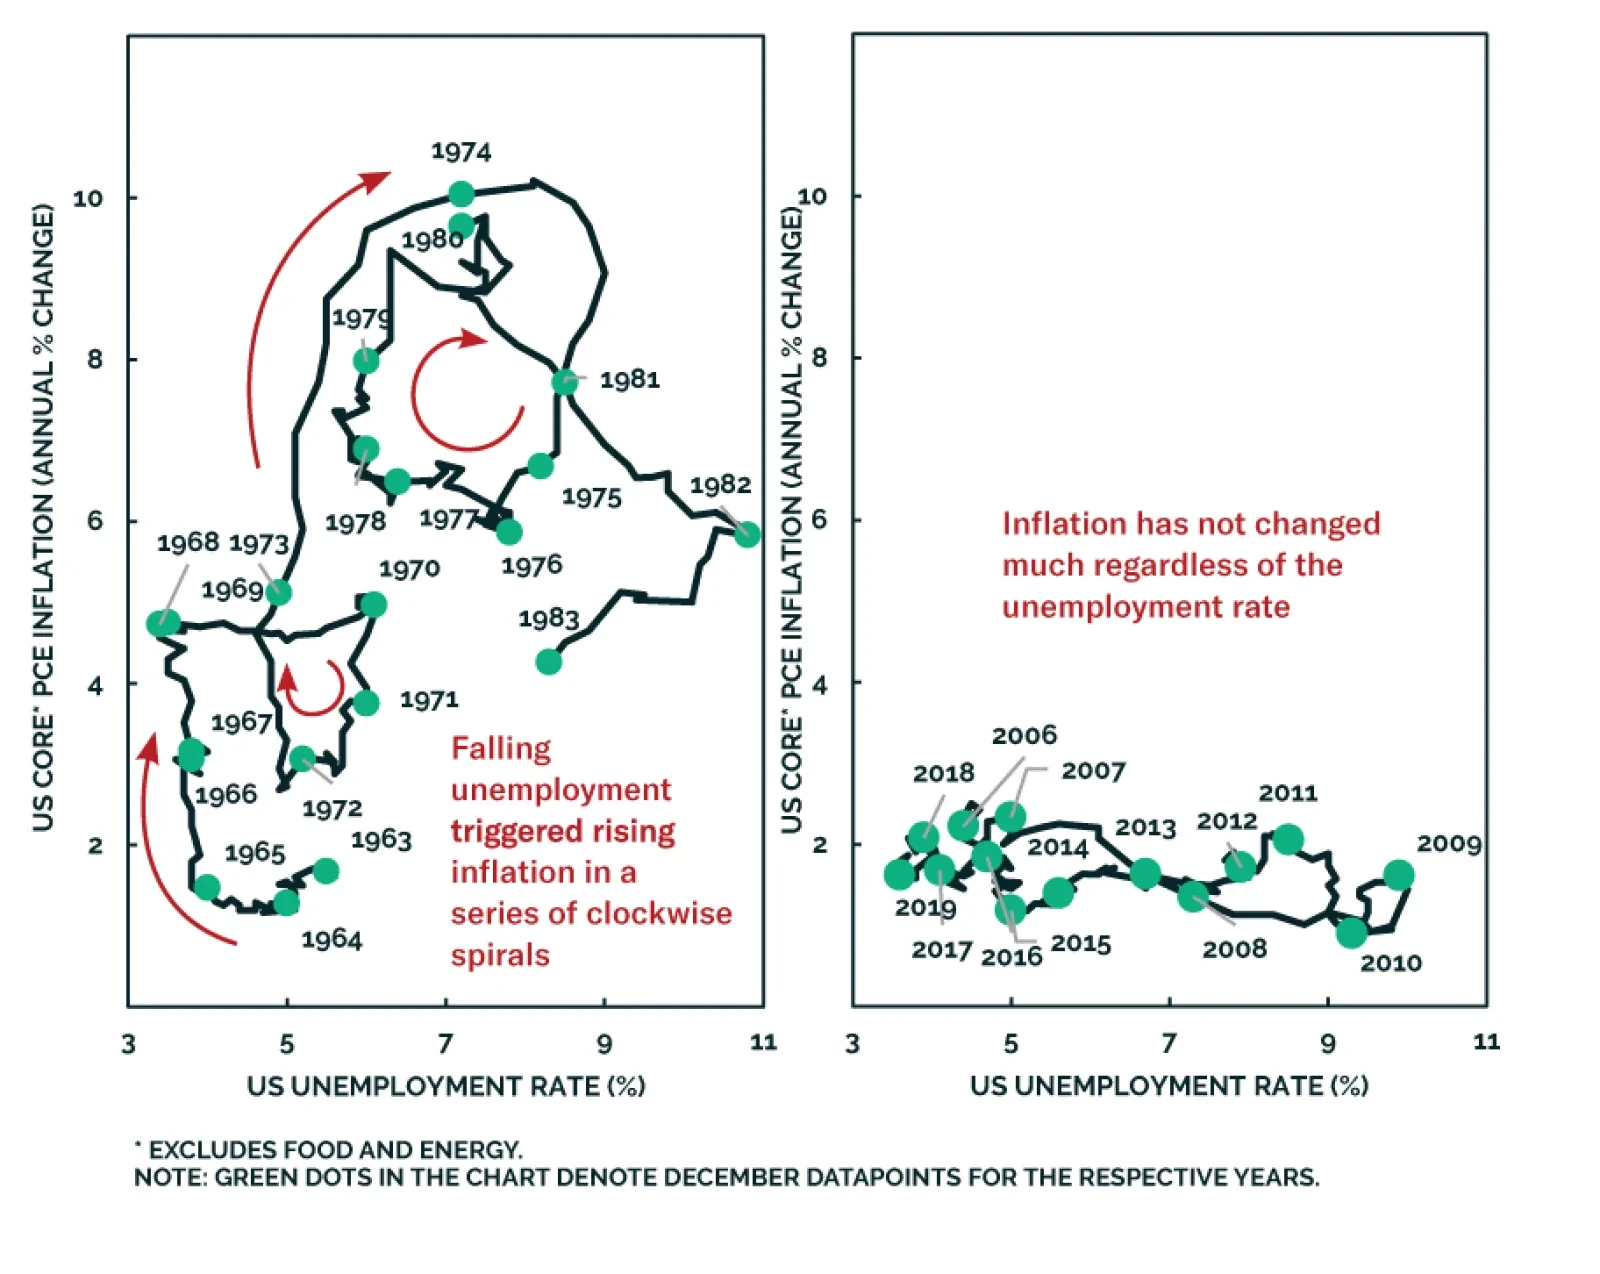
How does one square widespread stories of labor shortages with the fact that total employment remains depressed? A pessimistic interpretation is that the pandemic pushed up structural unemployment. We are skeptical of this thesis. A similar narrative was invoked shortly after the Great Recession to justify tighter fiscal policy and an early start to rate hikes. In the end, not only did the unemployment rate return to pre-GFC levels, but it dropped to a 50-year low. A more plausible explanation is that many service sector workers are currently reluctant to re-enter the labor market due to lingering fears about the pandemic, and in some cases, the need to remain home to look after young children studying remotely. In addition, generous unemployment benefits – which for more than half of US workers exceed their take-home pay – have reduced the incentive to work. Expanded unemployment benefits will expire in September. As the pandemic winds down and schools fully reopen, more workers will rejoin the labor force. Bottom Line: Temporary dislocations are curbing labor supply. However, the level of employment will probably not return to its pre-pandemic trend for another 12 months in the US. It will take even longer to get back to full employment in the euro area and Japan. 2. How Do Changes In The Output Gap Affect Inflation? The Phillips curve was reasonably steep between the mid-1960s and mid-1980s. As such, a falling output gap generally corresponded to rising inflation and vice versa. The result was a series of “clockwise spirals” in inflation-unemployment space, as illustrated in Charts 4A & 4B. Chart 4AThe Phillips Curve Was Steep In The 1960s-1980s
Dissecting The Phillips Curve
Dissecting The Phillips Curve
Chart 4BThe Phillips Curve Has Been Flat In Recent Decades
Dissecting The Phillips Curve
Dissecting The Phillips Curve
Starting in the 1990s, the Phillips curve flattened out. By the time of the Great Recession, the slope of the curve was indistinguishable from zero. Will the Phillips curve remain flat? Over the next two years, the answer is probably yes. However, looking beyond then, it is likely to re-steepen again. Chart 5 shows that the “wage version” of the Phillips curve never became very flat. Even after the mid-1980s, there was still a consistently strong negative correlation between wage growth and the unemployment rate. Chart 5The Wage Version Of The Phillips Curve Is Alive And Well
The Wage Version Of The Phillips Curve Is Alive And Well
The Wage Version Of The Phillips Curve Is Alive And Well
Chart 6Inflation Started Accelerating Quickly Only When Unemployment Reached Very Low Levels In The 1960s
Inflation Started Accelerating Quickly Only When Unemployment Reached Very Low Levels In The 1960s Inflation Started Accelerating Quickly Only When Unemployment Reached Very Low Levels In The 1960s
Inflation Started Accelerating Quickly Only When Unemployment Reached Very Low Levels In The 1960s Inflation Started Accelerating Quickly Only When Unemployment Reached Very Low Levels In The 1960s
Why, then, did stronger wage growth fail to translate into rising price inflation over the past three decades? To a large extent, the answer is that the Fed began to hike interest rates every time the labor market showed signs of overheating. Higher rates, in turn, led to asset busts. During the 1991 recession, it was the commercial real estate bust; in 2001, it was the dotcom bust; and in 2008, it was the housing bust. All three asset busts led to recessions and higher unemployment before wage growth could seep into inflation. What is different this time is that the Fed is a lot more patient. This means that the economy may eventually overheat to a degree not seen in recent history. How long will that take? Probably a few more years. Consider the case of the 1960s. The unemployment rate was at or below its full employment level for four straight years before inflation took off in 1966 (Chart 6). The shortage of workers spawned a major wage-price spiral. Workers demanded higher wages in response to rising prices, which forced firms to further lift prices in order to defend profit margins. Chart 7US Wage Barometers Disaggregated
US Wage Barometers Disaggregated
US Wage Barometers Disaggregated
The US is nowhere near that point now. While some measures of wage growth have accelerated, this mainly reflects a “composition bias” in the way wage indices are constructed. The pandemic led to significant job losses in low-wage sectors such as retail and hospitality, which skewed the calculation of average hourly wages and median weekly earnings to the upside. Cleaner measures of wage growth, such as the Employment Cost Index or the Atlanta Fed Wage Tracker, have been fairly stable over the course of the pandemic1 (Chart 7). Bottom Line: There is good reason to think that the Phillips curve is “kinked”, meaning that inflation might not rise much until the labor market has severely overheated. For now, no major economy is near the kink. 3. Will Long-Term Inflation Expectations Stay Well Anchored? One of the distinguishing features of the clockwise spirals in Chart 4 is that they trace out a series of “higher highs” and “higher lows” for inflation during the period between the mid-1960 and early-1980s. In essence, what happened back then was that inflation would rise, prompting the Fed to step on the brakes ever so gingerly. Inflation would then decline modestly, but not by enough to bring it back to its original level. The “stickiness” of inflation during that era highlights the importance of inflation expectations. In the context of the Phillips curve, a change in long-term inflation expectations could, at least theoretically, affect realized inflation independent of what happens to the output gap. In practice, however, the size of the output gap is likely to influence inflation expectations and vice versa. A persistently positive output gap will cause inflation to consistently exceed its long-term expected value. As Milton Friedman and Edmund Phelps pointed out more than four decades ago, this will eventually prompt businesses and the public to revise up their expectations of inflation. Unless the central bank lifts interest rates by enough, a rise in inflation expectations could spur people to increase spending in advance of higher prices. This could cause the economy to further overheat, leading to even higher inflation expectations. In other words, a positive output gap could lead to higher inflation expectations, and higher inflation expectations, in turn, could push aggregate demand even further above potential. Suppose that people jettison the expectation of a stable long-term inflation rate and adopt an “adaptive” approach whereby they assume that inflation this year simply will be what it was last year. This is equivalent to replacing πe in the Phillips curve equation with πt-1, yielding:
Dissecting The Phillips Curve
Dissecting The Phillips Curve
This is the “accelerationist” version of the Phillips curve. It says that the output gap determines the change in inflation rather than the level of inflation. With an accelerationist Phillips curve, inflation can increase without bound if the central bank tries to keep output above its potential level. The transition to an accelerationist Phillips curve appears to have happened in the 1970s. As my colleague Jonathan Laberge has argued, and as recent empirical work has emphasized, changes in inflation expectations generally have a larger impact on realized inflation than changes in the output gap. In particular, it is difficult to explain the Volcker disinflation solely based on the movement in the unemployment rate. Inflation continued to fall even after the unemployment rate peaked in December 1982. The surprising decline in inflation following the recession even prompted two young economists working at the Council of Economic Advisors, Paul Krugman and Larry Summers, to pen a memo entitled “The Inflation Timebomb?” in which they predicted a “significant reacceleration of inflation in the near future”. Chart 8Long-Term Inflation Expectations Remain Well Anchored Today
Long-Term Inflation Expectations Remain Well Anchored Today
Long-Term Inflation Expectations Remain Well Anchored Today
Why did inflation keep falling in the 1980s as the economy recovered? A plausible theory is that Paul Volcker’s appointment to Fed chair marked a “regime shift” in the conduct of monetary policy. No longer would the Fed stand idly by as inflation galloped higher. Even if it took double digit interest rates and a deep recession, the Fed would do what was needed to break the back of inflation. This allowed the accelerationist Phillips curve of the 1970s to transition to its modern-day version characterized by low and stable inflation expectations. What does all this mean for today? Both survey and market-based measures of long-term inflation expectations remain well anchored (Chart 8). Given that inflation expectations have been low and stable for the past few decades, it may take even more overheating than what occurred in the 1960s to unmoor them. Such an unmooring of inflation expectations is not impossible, however. The Fed seems eager to overheat the economy. Fiscal policy is likely to remain highly accommodative long after the pandemic restrictions ease. Meanwhile, as we discussed in an earlier report, many of the structural factors that have suppressed inflation could go into reverse. Bottom Line: Inflation expectations are likely to remain well anchored for the next two years. However, they could become unmoored later on if monetary and fiscal policy remain highly accommodative. Concluding Thoughts There is a lot of concern over inflation these days. We would fade these concerns, at least for the time being. The much-discussed spike in manufacturing input prices is nothing new. The exact same thing happened in 2008 and 2011 (Chart 9). Pundits who hyperventilated about soaring inflation were proven wrong back then and they are likely to be proven wrong again this year. Chart 9Wholesale Inflation Rose (Briefly) In 2008 And 2011 Too
Wholesale Inflation Rose (Briefly) In 2008 And 2011 Too
Wholesale Inflation Rose (Briefly) In 2008 And 2011 Too
Chart 10The Most Refined Measures Of Core Inflation Paint A Benign Picture
The Most Refined Measures Of Core Inflation Paint A Benign Picture
The Most Refined Measures Of Core Inflation Paint A Benign Picture
The pandemic distorted prices in all sorts of unprecedented ways. This means that looking at standard measures of core inflation may be misleading. It is much better to consider more refined measures of core inflation that go beyond simply stripping out the effects of volatile food and energy prices. Chart 10 shows that trimmed-mean inflation, median price inflation, and sticky price inflation all suggest that underlying inflation remains well contained. Continued low inflation will allow the Fed to maintain a highly accommodative monetary policy. This will keep a lid on bond yields, while fueling further gains in equity prices. When will it be time to worry? When the labor market starts to overheat to the point that a wage-price spiral erupts. As discussed above, that is not a near-term risk. However, such a spiral could occur in two-to-three years, setting the stage for a period of stagflation in the second half of the decade. Peter Berezin Chief Global Strategist pberezin@bcaresearch.com Footnotes 1 Unlike the widely followed average hourly wage series published every month in the payrolls report, the quarterly Employment Cost Index (ECI) does control for shifts in the weights of different industries in total employment. Thus, an increase in the relative number of low-paid hospitality workers would depress average hourly wages, but would not affect the ECI. Nevertheless, the ECI does not control for the possibility that the composition of the workforce within industries may change over time. The Atlanta Fed's Wage Tracker does overcome this bias because it uses the same sample of workers from one period to the next. Global Investment Strategy View Matrix
Dissecting The Phillips Curve
Dissecting The Phillips Curve
Special Trade Recommendations
Dissecting The Phillips Curve
Dissecting The Phillips Curve
Current MacroQuant Model Scores
Dissecting The Phillips Curve
Dissecting The Phillips Curve
Upgrade Pharma Equities To Neutral
Upgrade Pharma Equities To Neutral
This Monday we closed both our cyclical and high-conviction S&P pharmaceuticals underweights for a combined gain of 23%, since inception. We did not wish to overstay our welcome in this defensive industry as not only is the bearish story well-known and fully reflected in bombed out technicals (bottom panel) and valuations (not shown), but our short-term cautious outlook is also forcing us to add some defensive exposure to our portfolio. Encouragingly, our macro EPS growth models signal that pharma profits have a strong pulse and will outshine the overall market in the coming year, meaning that an underweight stance is no longer warranted and instead investors should augment exposure back up to a benchmark allocation (middle panel). Bottom Line: We crystalized 23% in combined gains (cyclical and high-conviction list) in the S&P pharma index and lifted exposure to neutral. The ticker symbols for the stocks in this index are: BLBG: S5PHARX– JNJ, PFE, MRK, LLY, BMY, ZTS, CTLT, VTRS, PRGO. Please refer to this past Monday’s Strategy Report for additional details.
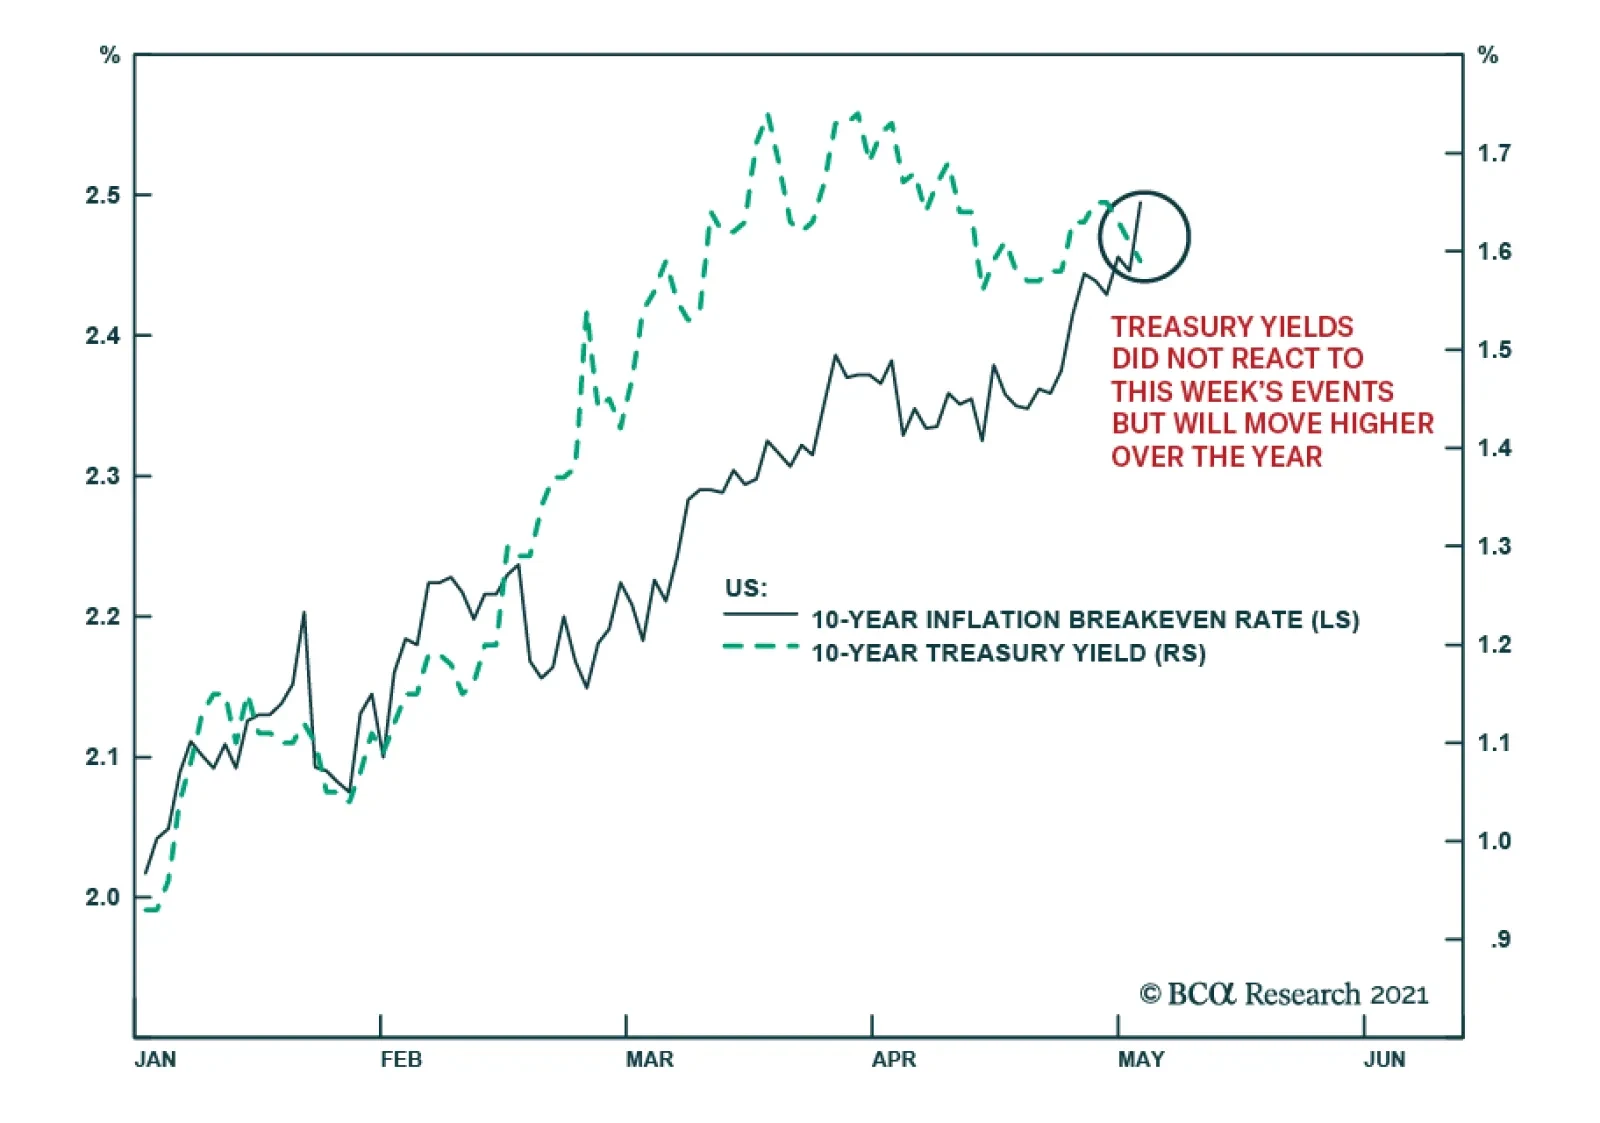
US Market moves have been interesting this week. On Tuesday, comments by Treasury Secretary Janet Yellen that “interest rates will have to rise somewhat to make sure that our economy doesn’t overheat” were not taken well by investors. US equities initially…
Highlights US natural gas prices will remain well supported over the April-October injection season, as the global economic expansion gains traction, particularly in Europe, which also is refilling depleted storage levels. China's natgas demand is expected to rise more than 8% yoy, and EM Asia consumption also will be robust, which will revive US liquified natural gas (LNG) exports. Exports of US light-sweet crude into the North Sea Brent pricing pool – currently accounting for close to half the physical supply underpinning the global oil-price benchmark – also will increase over the course of the year, particularly in the summer, when maintenance will markedly reduce the physical supply of crudes making up the Brent index. At the margin, coal demand will increase in the US, as industrial natgas demand and LNG exports incentivize electric generators to favor coal. Higher-than-expected summer temperatures in the US also would boost coal demand. This will be tempered somewhat in Europe, where carbon-emissions rights traded through €50/MT for the first time this week on the EU's Emission Trading System (ETA). We expect US LNG and oil exports to revive this year (Chart of the Week) and remain long natgas in 1Q22. Feature The importance of US LNG and crude oil exports out of the US Gulf to the global economy is only now becoming apparent. As demand for these fossil fuels grows and the supply side continues to confront a highly uncertain risk-reward tradeoff, their importance will only grow. In natgas markets, US LNG cargoes out of the US Gulf balanced demand coming from Asia and Europe this past winter, which was sharply colder than expected and stretched supply chains globally. As a widening economic recovery from the COVID-19 pandemic spurs industrial, residential and commercial demand, and inventories in Europe and Asia are re-built in preparation for next winter, US LNG exports will be called upon to meet increasing demand, particularly since they are priced attractively vs regional importing benchmarks, with differentials vs the US presently $4+/MMBtu vs Europe and $5+/MMBtu vs Asia (Chart 2).1 Chart of the WeekUS LNG, Oil Export Growth Will Rebound
US LNG, Oil Export Growth Will Rebound
US LNG, Oil Export Growth Will Rebound
Chart 2Lower US Natgas Prices Encourage LNG Exports
Importance Of US Gas, Oil Exports Increases Daily
Importance Of US Gas, Oil Exports Increases Daily
In oil markets, an ongoing kerfuffle in the pricing of Brent Blend brought about by falling North Sea crude oil production makes American light-sweet crude oil exports from the Gulf (i.e., WTI produced mostly in the Permian Basin) account for almost half of the physical supplies in this critical benchmark-pricing market.2 US LNG Exports Will Increase US natural gas prices will remain well supported as the global economic expansion gains traction, and the US and Europe open the April-October injection season well bid (Chart 3). US inventories are expected to end the Apr-Oct injection season at just over 3.7 TCF according to the EIA, very close to where they ended the 2020 injection season. Chart 3US, Europe Rebuild Storage
Importance Of US Gas, Oil Exports Increases Daily
Importance Of US Gas, Oil Exports Increases Daily
Higher US LNG exports, industrial, commercial and residential demand will be offset by lower consumption from electric generators this year, netting to a slight decline in overall demand. The EIA expects generators to take advantage of lower generating costs to be had burning coal to produce electricity, a view we share given the current differentials in the forward curves for each fuel (Chart 4).3 On the supply side, the EIA's expecting output to remain unchanged from last year at just under 91.5 BCF/d in 2021. Higher LNG exports, even as generator demand is falling, pushes prices higher this year – averaging $3.04/MMBtu this year – which leads to a slight increase in output in 2022. For our part, we continue to expect higher prices during the November-March heating season than currently are clearing the market and remain long 1Q22 $3.50/MMBtu calls vs. short $3.75/MMbtu calls. As of Tuesday night, when we mark to market, this position was up 20.8% since inception on 8 April 2021. Chart 4Lower Prices Will Favour Increased Coal Demand
Lower Prices Will Favour Increased Coal Demand
Lower Prices Will Favour Increased Coal Demand
Natgas demand could surprise on the upside during the injection season if air-conditioning demand comes in stronger than expected and production remains essentially unchanged this year. This could reduce LNG exports and slow the rate of inventory refill in the US, which could further advantage coal as a burner fuel for generators in the US. The US National Weather Service's Climate Prediction Center expects above-average temperatures for most of the US population centers this summer (Chart 5). This could become a semi-permanent feature of the market if current temperature trends persist (Chart 6). Based on analyses’ run by the NOAA's National Centers for Environmental Information, 2021 "is very likely to rank among the ten warmest years on record," with lower (6%) odds of ranking in the top five hottest years on record.4 Chart 5Odds Of Hotter Summer Rising
Importance Of US Gas, Oil Exports Increases Daily
Importance Of US Gas, Oil Exports Increases Daily
Chart 6Higher Global Temperatures Could Become A Recurring Phenomenon
Importance Of US Gas, Oil Exports Increases Daily
Importance Of US Gas, Oil Exports Increases Daily
The Crude Kerfuffle As the Chart of the Week shows, US exports of light-sweet crude oil peaked at ~ 3.7mm b/d in February 2020, just before the COVID-19 pandemic hit the world full force. Exports out of the US Gulf – i.e., WTI priced against the Midland, TX, gathering hub – accounted for ~ 95% of these volumes. With exports currently running ~ 2.5mm b/d, more than 1mm b/d of readily available export capacity remains in place. Additional volumes will be developed as dredging of the Corpus Christi, TX, progresses. While the surge in US crude oil production has subsided in the wake of the pandemic, it most likely will revive as the markets return to normal operating procedure, additional dredging operations are completed, and storage facilities are built out.5 Existing and additional export capacity of the US's light-sweet crude could not arrive at a more opportune time for the Brent market, which remains in a state of uncertainty as to whether markets will have to adjust to CIF contracts or a work-around to the existing FOB pricing regime, which can be augmented to accommodate increasing WTI volumes.6 This will have to be sorted, as this is the future of the market's most important pricing index (Chart 7). The buildout in crude-oil exporting capacity – and natgas LNG exporting capacity, for that matter – ideally accommodates shale-oil- and -gas assets, which can be ramped up quickly to meet demand, and ramped down quickly as demand falters. The quick payback – 2 to 3 years – on these investments allow the producers to expand and contract output without the massive risks longer-lived conventional assets impose. As OPEC 2.0's spare capacity is returned to the market, this will be a welcome feature of a market that most likely will require oil and gas supplies for decades, despite the uncertainty attending oil-and-gas capex during the transition to a low-carbon energy future. Chart 7Permian Replaces North Sea Losses
Permian Replaces North Sea Losses
Permian Replaces North Sea Losses
Bottom Line: As the future of hydrocarbons evolves, the LNG and crude oil exported from the US Gulf will occupy an increasingly important role in these markets. Oil and gas producers are making capex decisions under increasingly uncertain conditions, which favor exactly the type of resources that have propelled the US to the position of the world's largest producer of these fuels – i.e., shale-oil and -gas. Production from these resources can be ramped up and down quickly as prices dictate, and have quick paybacks (2-3 years), which means capital is not tied up for decades as a return is earned.7 Robert P. Ryan Chief Commodity & Energy Strategist rryan@bcaresearch.com Ashwin Shyam Research Associate Commodity & Energy Strategy ashwin.shyam@bcaresearch.com Commodities Round-Up Energy: Bullish OPEC 2.0 begins returning 2mm b/d to the market this month, expecting to be done by July. Half of these volumes are accounted for by Saudi Arabia, which voluntarily cut output by 1mm b/d earlier in the year to help balance the market. In line with our maintained hypothesis that OPEC 2.0 prefers prices inside the $60-$70/bbl price band, we expect the return of curtailed production to be front-loaded so as to bring prices down from current levels approaching $70/bbl for Brent (Chart 8). If, as we expect, demand recovers sooner than expected as Europe leans into its vaccination program, additional barrels will be returned to the market to get prices closer to a $60-$65/bbl range. Base Metals: Bullish The International Copper Study Group (ICSG) forecast copper mine production will increase by ~ 3.5% in 2021 and 3.7% in 2022, after adjusting for historical disruption factors. This forecasted increase – after three years of flat mined production growth – is due to a ramp-up of recently commissioned and new copper mines becoming operational in 2021. An improvement in the pandemic situation by 2022 will also boost mined copper production, according to the ICSG. 2020 production remained flat as recoveries in production in some countries due to constrained output in 2019 balanced the negative impacts of the pandemic in others. In Chile, the largest copper producer, state-owned Codelco and Collahuasi reported strong results in March. However, this was countered by a continued downturn at BHP’s Escondida. The world’s largest copper mine saw a drop in production for the eighth consecutive month. This mixed output resulted in a decline in total production of 1.2% year-on-year in March. Precious Metals: Bullish COMEX palladium touched a record high during intraday trading on Tuesday, reaching $3,019/oz due to continued tight market conditions (Chart 9). On the supply side, Nornickel is recovering from flooded mines, which occurred in February. By mid-April, one of the two affected mines was operating at 60% capacity; however, the company's other mine is only expected to come back online by early June. On the demand side, strength in US vehicle sales and a global economic recovery from the pandemic buoyed the metal used in catalytic converters. Palladium prices closed at $2,981.60/oz on Tuesday. Ags/Softs: Neutral Corn again traded above $7/bu earlier in the week on the back of drought-like dry weather conditions in Brazil's principal growing regions and surging US exports, according to Farm Futures. Chart 8
Brent Prices Going Up
Brent Prices Going Up
Chart 9
Palladium Prices Going Up
Palladium Prices Going Up
Footnotes 1 Stronger demand from China – where consumption is expected to rise more than 8% yoy – and EM Asia will continue to support LNG demand through the year. S&P Global Platts Analytics expects Chinese natural gas demand to reach 12,713 Bcf in 2021, up 8.4% from the previous year. Chinese national oil company Sinopec is slightly more conservative in its outlook, expecting gas demand of ~ 12,006-12,184 Bcf in 2021, up 6-8% from 2020. China’s average annual increase in natural gas demand is expected to exceed 716 Bcf in the 14th FYP and reach 15,185 Bcf in 2025. 2 Please see CIF Brent Benchmark? published 3 March 2021 by the Oxford Institute for Energy Studies for a discussion. 3 In Chart 3, we plot a rough measure of coal- vs natgas-fired generation economics for these fuels based on their average operating heat rates published by the EIA. We would note that a carbon tax would erase much of the benefit accruing to coal at this point in time. 4 Please see NOAA's Global Climate Report - March 2021. 5 Please see Low Rider - Corpus Christi's Ship Channel Dredging Will Streamline Crude Oil Exports published by RBN Energy 3 May 2021. 6 The OIES analysis cited above concludes, "… the volumes of the FOB deliverable crudes are diminishing and some change, bolstering the contract is certainly needed. The most likely compromise is to retain the existing FOB Brent with an inclusion of CIF WTI Midland assessment, netted back to an FOB equivalent North Sea value." We agree with this assessment. Please see CIF Brent Benchmark? published 3 March 2021 by the Oxford Institute for Energy Studies, p. 8. 7 Please see Is shale activity actually profitable? Size matters, says Rystad published 7 February 2019. Investment Views and Themes Strategic Recommendations Tactical Trades Commodity Prices and Plays Reference Table Trades Closed in 2021 Summary of Closed Trades
Higher Inflation On The Way
Higher Inflation On The Way
Closing Our Millennials Basket For A 69% Gain
Closing Our Millennials Basket For A 69% Gain
Not so long ago, we added an 18% trailing stop to our Millennials Basket cyclical overweight that has a heavy tech exposure, and recent price action pushed this share price ratio close to our stop. We decided not to fight the tape and close this cyclical overweight that has generated 69% <i>alpha</i> for our portfolio, since inception. Importantly, given that the 10-year US Treasury yield tends to lead our Millennials Basket by approximately half a year, the current message is that the latter will likely continue to come off the boil. Once yields stabilize at a new equilibrium level likely higher than the recent 1.75% peak, we will look to reopen this trade. Bottom Line: Close the USES Millennial Basket cyclical overweight for a relative gain of 69%, since inception. We continue to recommend an above benchmark allocation from a secular stance.
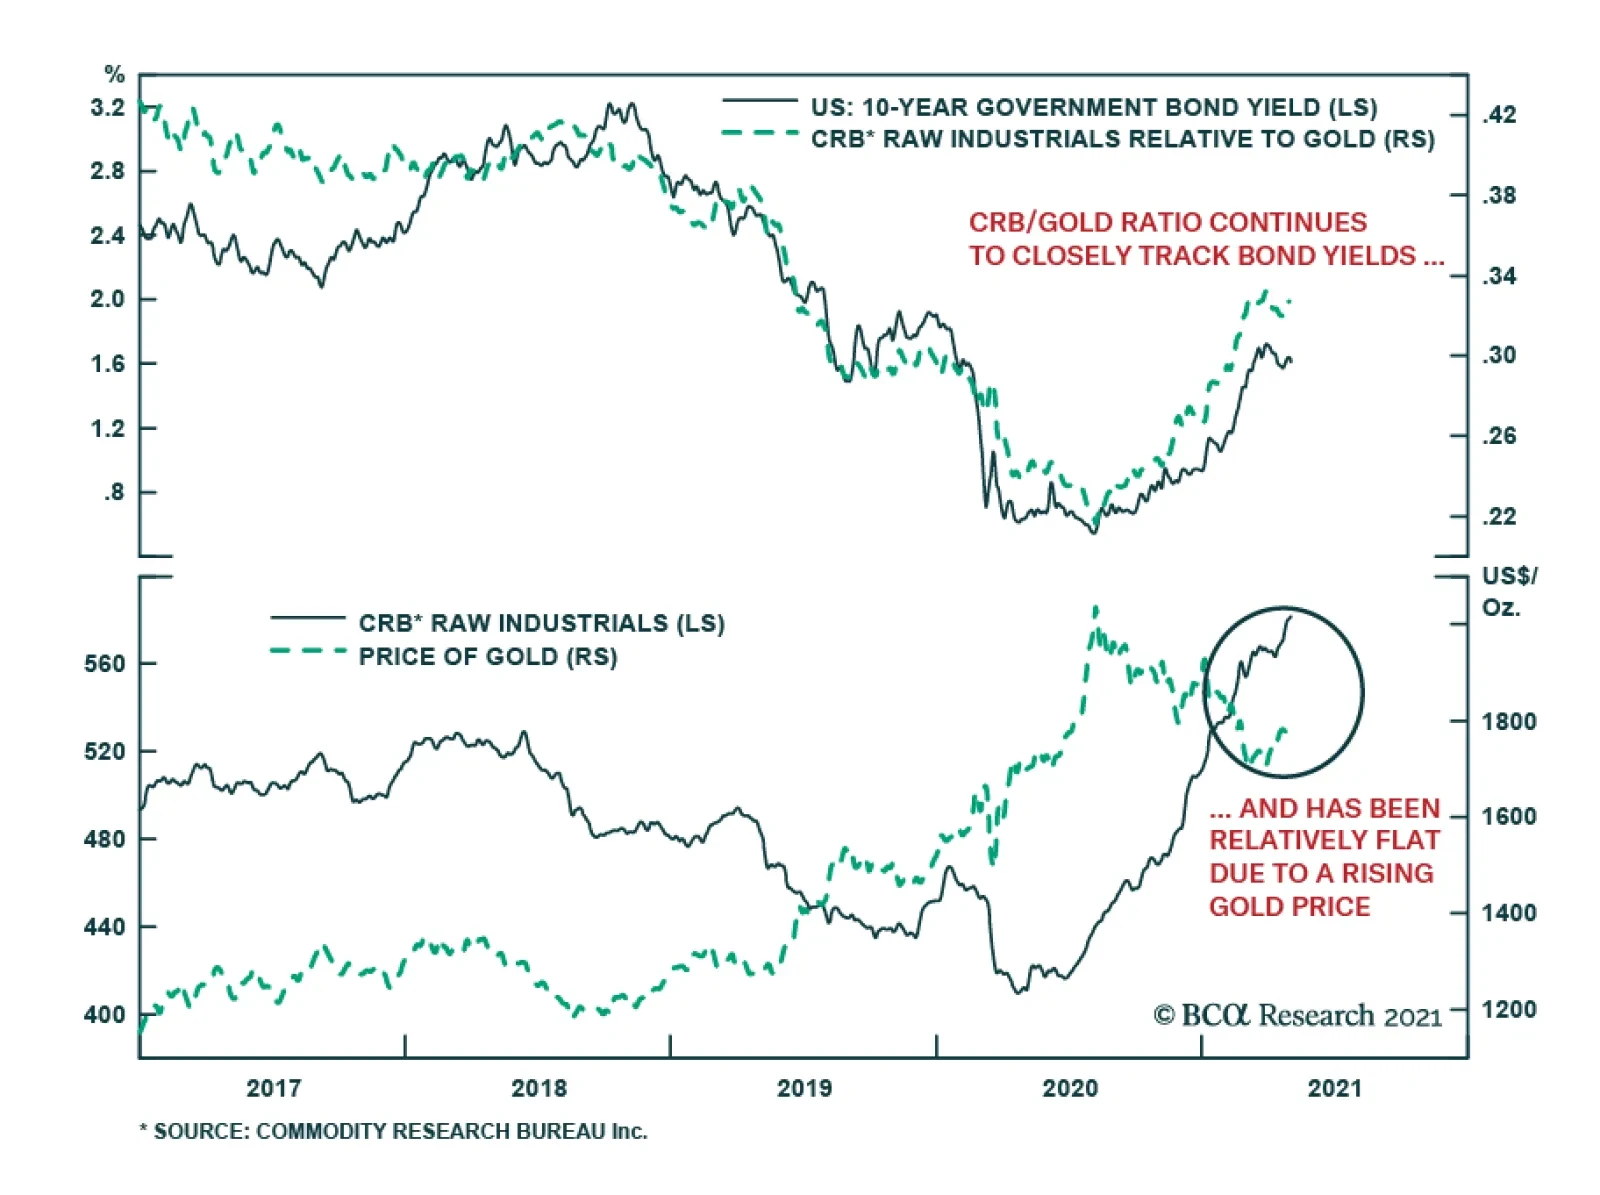
Commodity prices have been on a tear recently and evidence of rising inflation continues to pop up. On the surface, rising commodity prices and mounting inflationary pressures are a recipe for higher bond yields. But puzzlingly, this is not what’s occurred.…
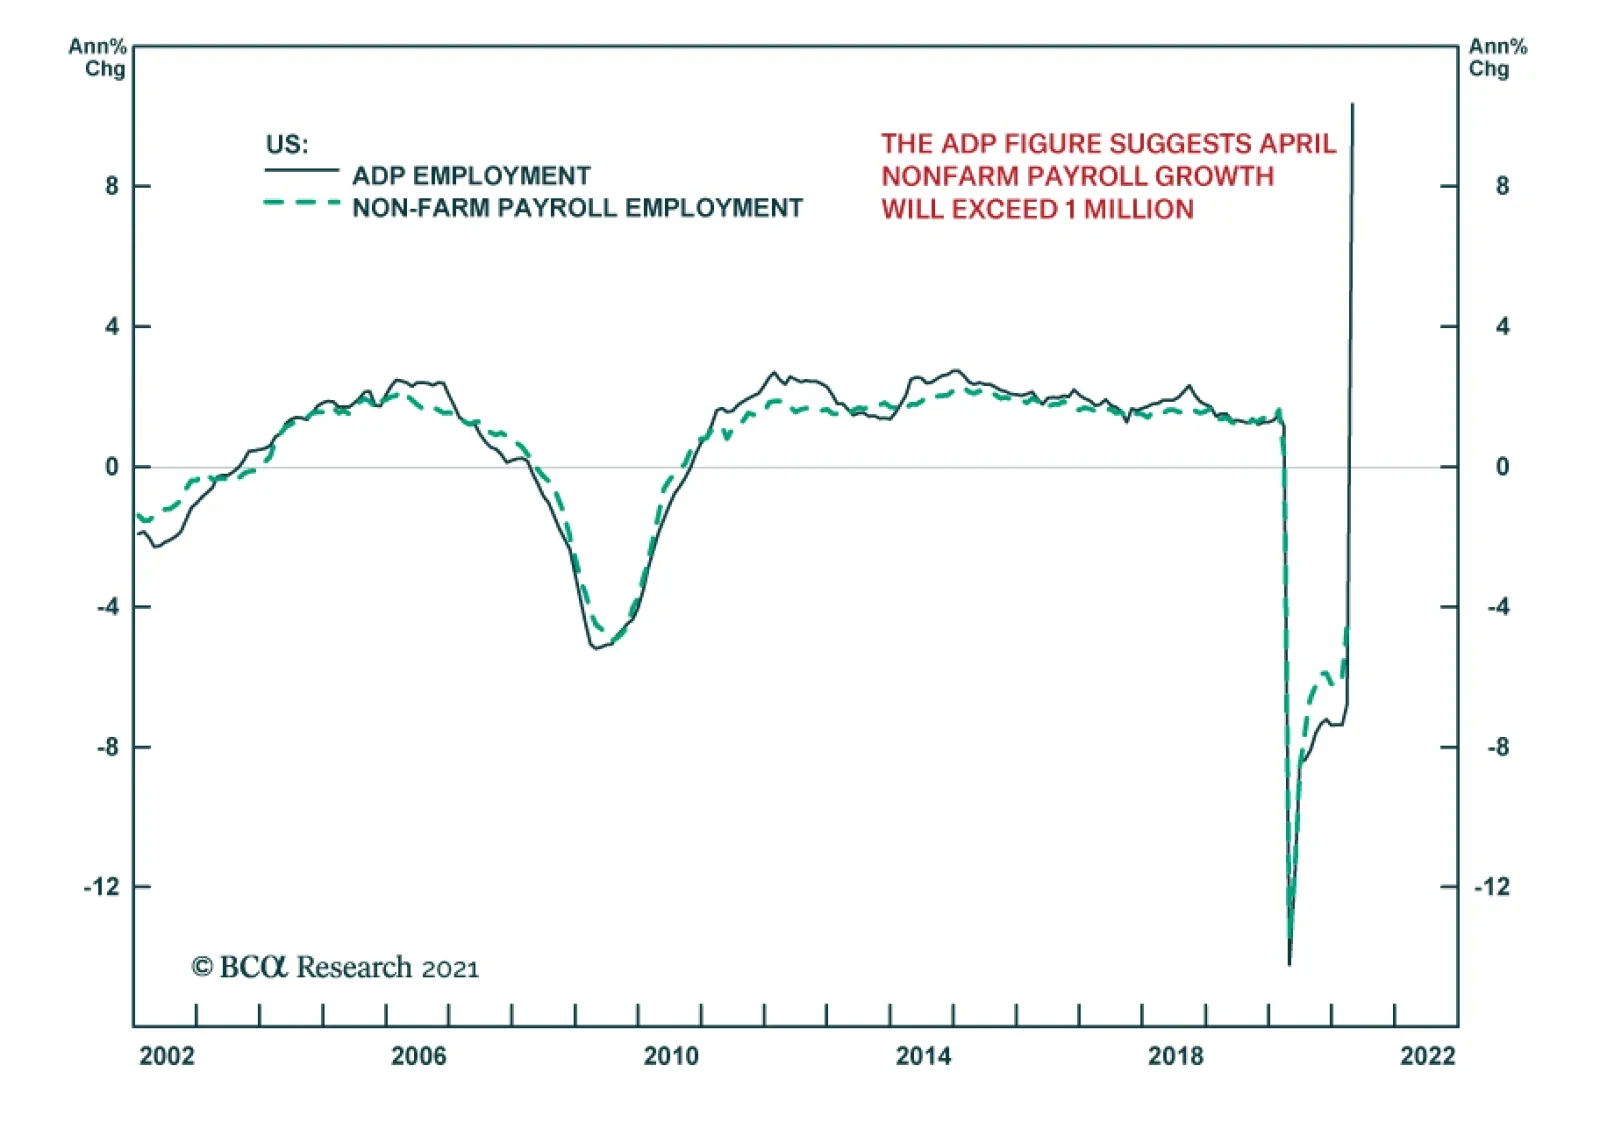
Wednesday’s ADP figure suggests that Friday’s payrolls report will show another month of strong labor market gains in April. The ADP release featured a 742 thousand jump in jobs. Although it is below the anticipated 850 thousand increase, it is an…