United States
BCA Research’s US Political Strategy service believes that President Biden’s political capital is high enough for him to accomplish a major legislative achievement. President Biden’s popularity is “fair to middling” as his honeymoon comes to an end.…
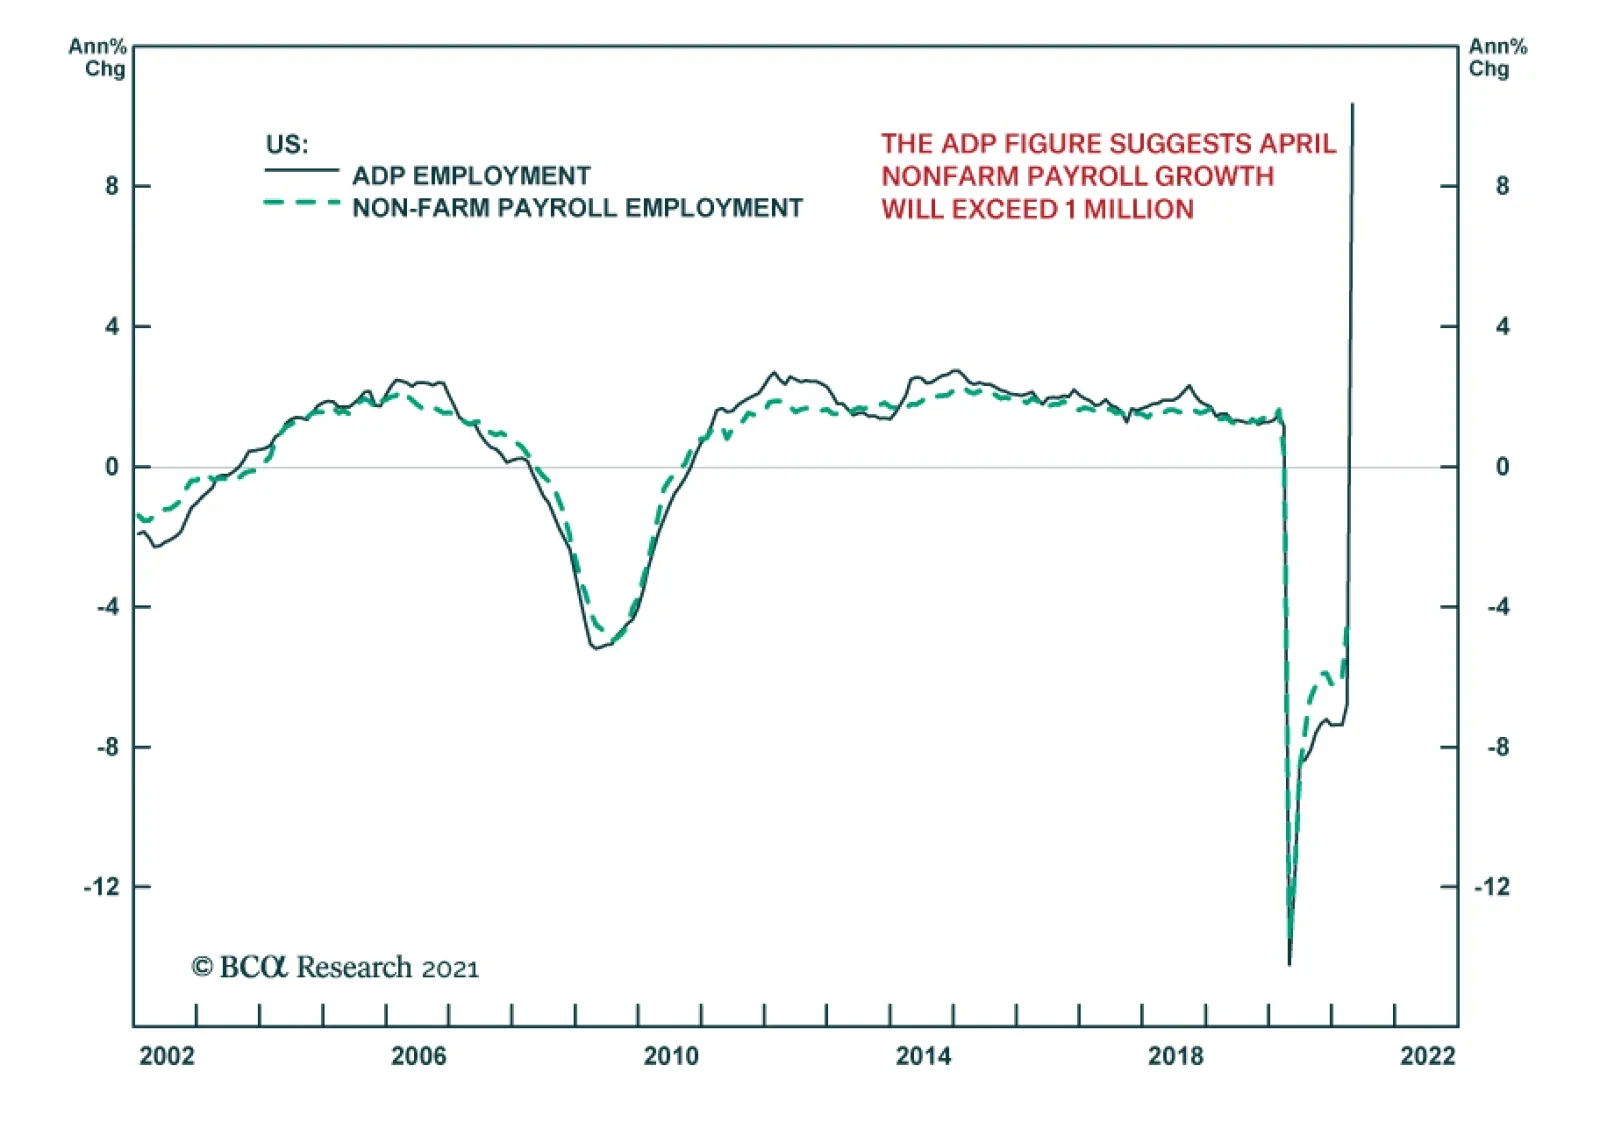
Wednesday’s ADP figure suggests that Friday’s payrolls report will show another month of strong labor market gains in April. The ADP release featured a 742 thousand jump in jobs. Although it is below the anticipated 850 thousand increase, it is an…

Biden’s first 100 days can be summed up as the return of Big Government, i.e. “the Leviathan.” But markets are not afraid of one-off corporate tax hikes that only partially reverse the previous administration’s tax cuts amid a brand new stimulus-charged economic cycle. Biden’s approval rating after his first 100 days is comparable to that of Presidents Bill Clinton and George W. Bush, suggesting that he can accomplish a major legislative achievement. The $2.3 trillion American Jobs Plan will be watered down in Congress but not to a great extent. Green energy investments and funding for research and development will survive. Thus Biden’s plan will sow the seeds of a productivity mini-boom, if not a structural boom, in the 2020s. Republicans are favored to win the midterm elections in 2022 but investors should not make any decisions based on that expectation. The risk of Democrats keeping the House of Representatives – and therefore having a new chance to surprise with taxes in the second half of Biden’s term – is much greater than the historical pattern suggests. Stick with our long materials versus tech trade. Stick with short health care trades. Go long renewable energy stocks. Feature President Biden passed the 100 day mark at the end of April. The most striking characteristic of his administration is the giant deficit spending. Biden marks the symbolic return of the “leviathan,” i.e. the state, to American political economy. Normally the budget deficit tracks closely with the unemployment rate because rising unemployment causes tax revenue to fall and government spending to rise. The divergence between the deficit and unemployment became pronounced in 2016 and revealed the structural forces – e.g. slow growth, disinflation, high debt, inequality, populism – driving US policymakers to abandon fiscal discipline. But the 2016-20 political cycle combined with the pandemic broke the dam and the divergence is now gigantic (Chart 1). Chart 1Biden's First 100 Days: An Historic Divergence
Biden's First 100 Days: An Historic Divergence
Biden's First 100 Days: An Historic Divergence
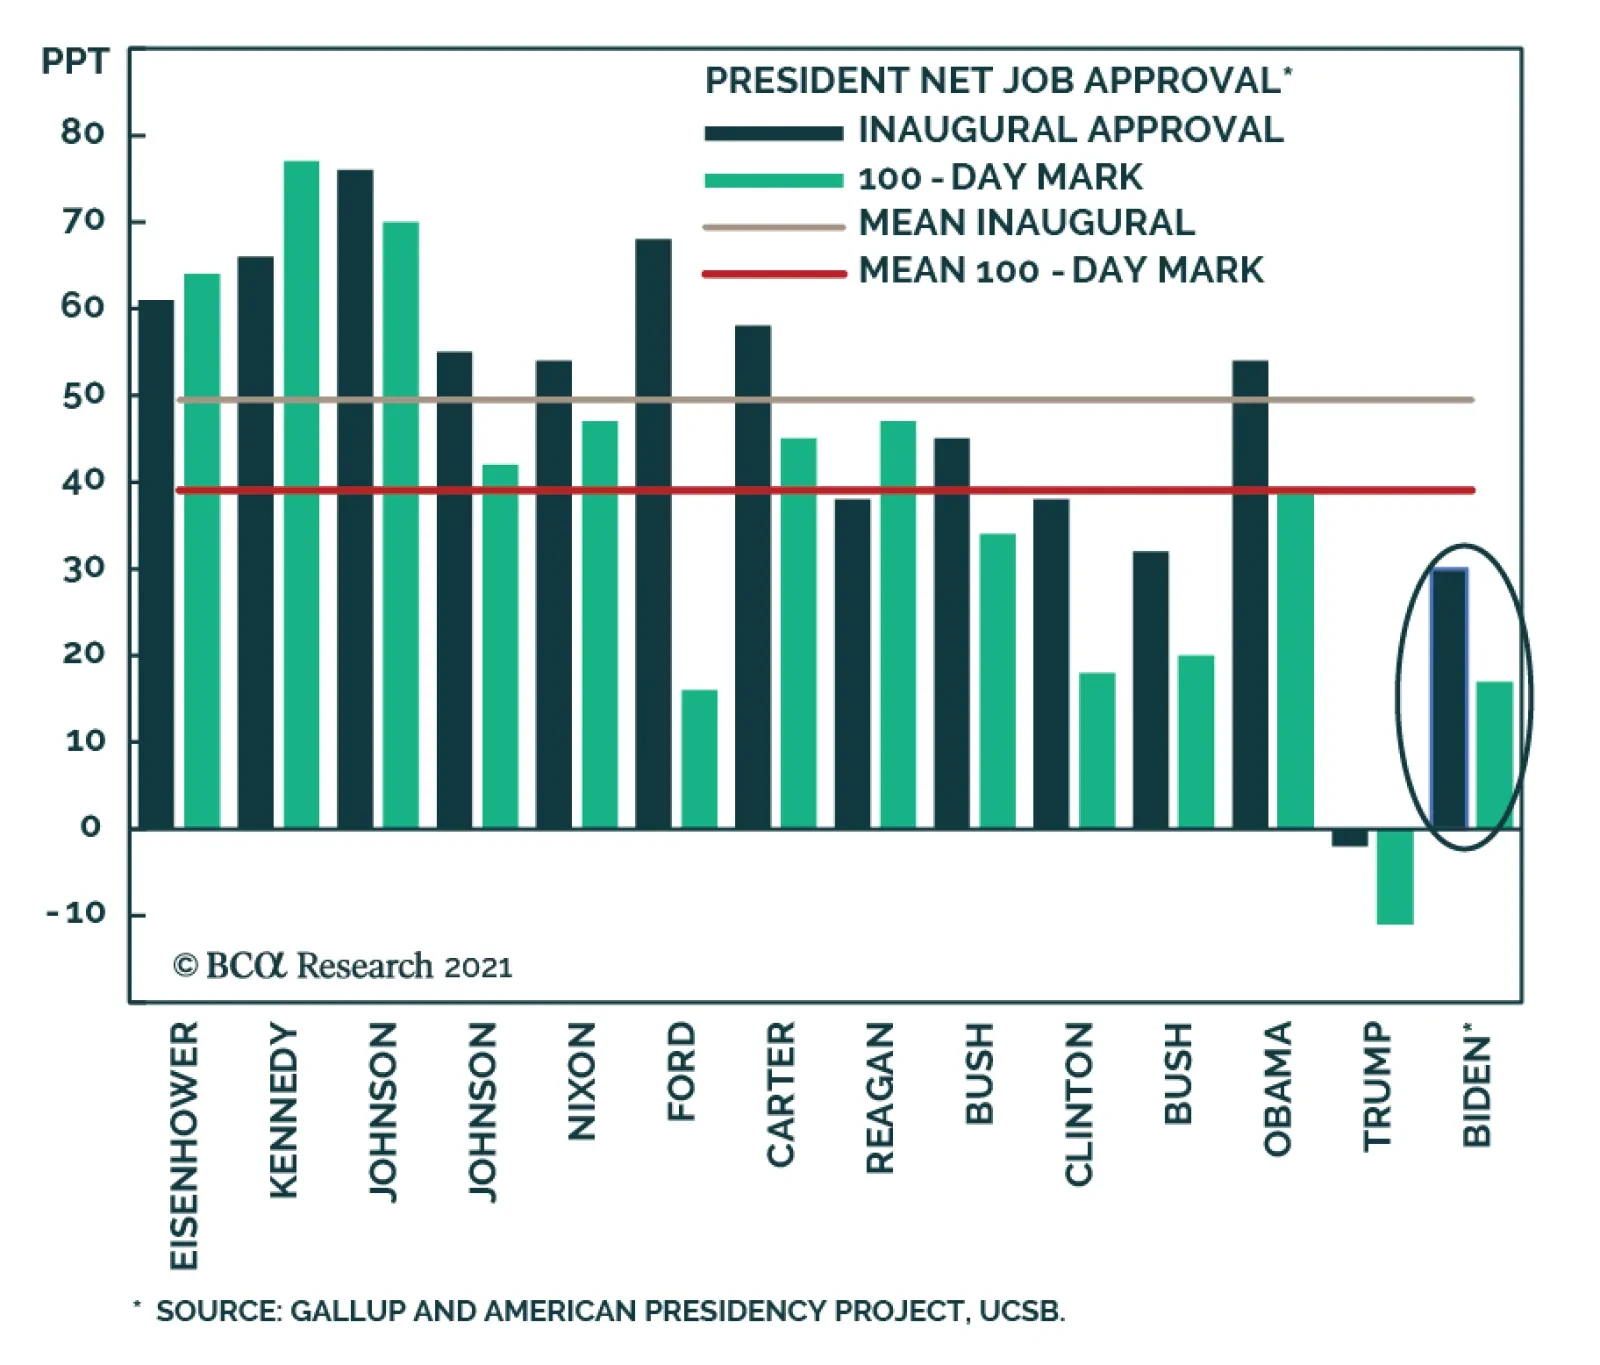
All else equal, the implication is inflationary, though inflation will respond to a range of factors on different time frames. Signs of inflation today may well be under control, as Federal Reserve Chairman Jay Powell and Secretary of Treasury Janet Yellen believe, but over the long run we take the inflation risk seriously as the policy elite has fundamentally shifted to be vigilant about deflation, not inflation. Biden’s Approval Is “Just Enough” Biden’s popularity is “fair to middling” as his honeymoon comes to an end. His approval rating clocks in right between that of Presidents Barack Obama and Donald Trump (Chart 2A). He is not as popular and charismatic as Obama and not as unpopular and controversial as Trump. His approval among Democratic voters is higher than that of Obama, similar to Trump among Republicans, due to the fact that the US has hit historic levels of political polarization (Chart 2A, second panel). His embrace of left-wing policy is keeping him in good standing among Democratic voters but may become a liability during the 2022 midterm election (more on that below). Chart 2ABiden’s Approval Rating: Fair-To-Middling
Leviathan: Biden's First 100 Days
Leviathan: Biden's First 100 Days
Chart 2BBiden Close To Clinton, Bush At 100 Days
Leviathan: Biden's First 100 Days
Leviathan: Biden's First 100 Days
American presidential approval ratings have fallen continuously for decades and they typically fall after inauguration. This is true of Biden but he looks more like Presidents Bill Clinton or George W. Bush than Trump. His approval is likely to stay over 50% for the foreseeable future due to a supercharged economic recovery (Chart 2B). Trump stands out conspicuously in this chart for his negative net approval, which implies that on a relative basis Biden will be more capable in conducting policy. And yet Trump got his signature piece of legislation – the Tax Cut and Jobs Act – through Congress, which has some bearing on Biden’s proposals. Our political capital index (Appendix) shows that Biden will benefit from consumer confidence and wage growth shooting up, business sentiment strengthening, and polarization slightly abating due to a slight rise in Republican approval. While Biden’s Democratic Party has only the narrowest of majorities in the Senate, Biden’s signature legislative proposal – the American Jobs Plan – still has an 80% chance of passing in some form. Senate minority leader Mitch McConnell of Kentucky declared this week that Biden will not get any Republican votes for this package of infrastructure and corporate tax hikes but budget reconciliation is a ready way for the bill to pass on a partisan basis. Biden’s fiscal blowout should be seen as the culmination of a popular shift against fiscal discipline (or “austerity”) that took root in the middle of the last decade and was also expressed by Republican support for the big-spending President Trump. But it is more extravagant than what the Republicans proposed or would have been able to get had Trump been elected. Chart 3 highlights the difference between the Democratic and Republican spending proposals for the early 2021 COVID-19 relief bill and infrastructure plan. Chart 4 highlights the corporate tax increases Biden has proposed in excess of the Trump rate. Chart 3Biden’s Spending In Excess Of Republican Plans
Leviathan: Biden's First 100 Days
Leviathan: Biden's First 100 Days
Chart 4Biden’s Taxes In Excess Of Republican Plans
Leviathan: Biden's First 100 Days
Leviathan: Biden's First 100 Days
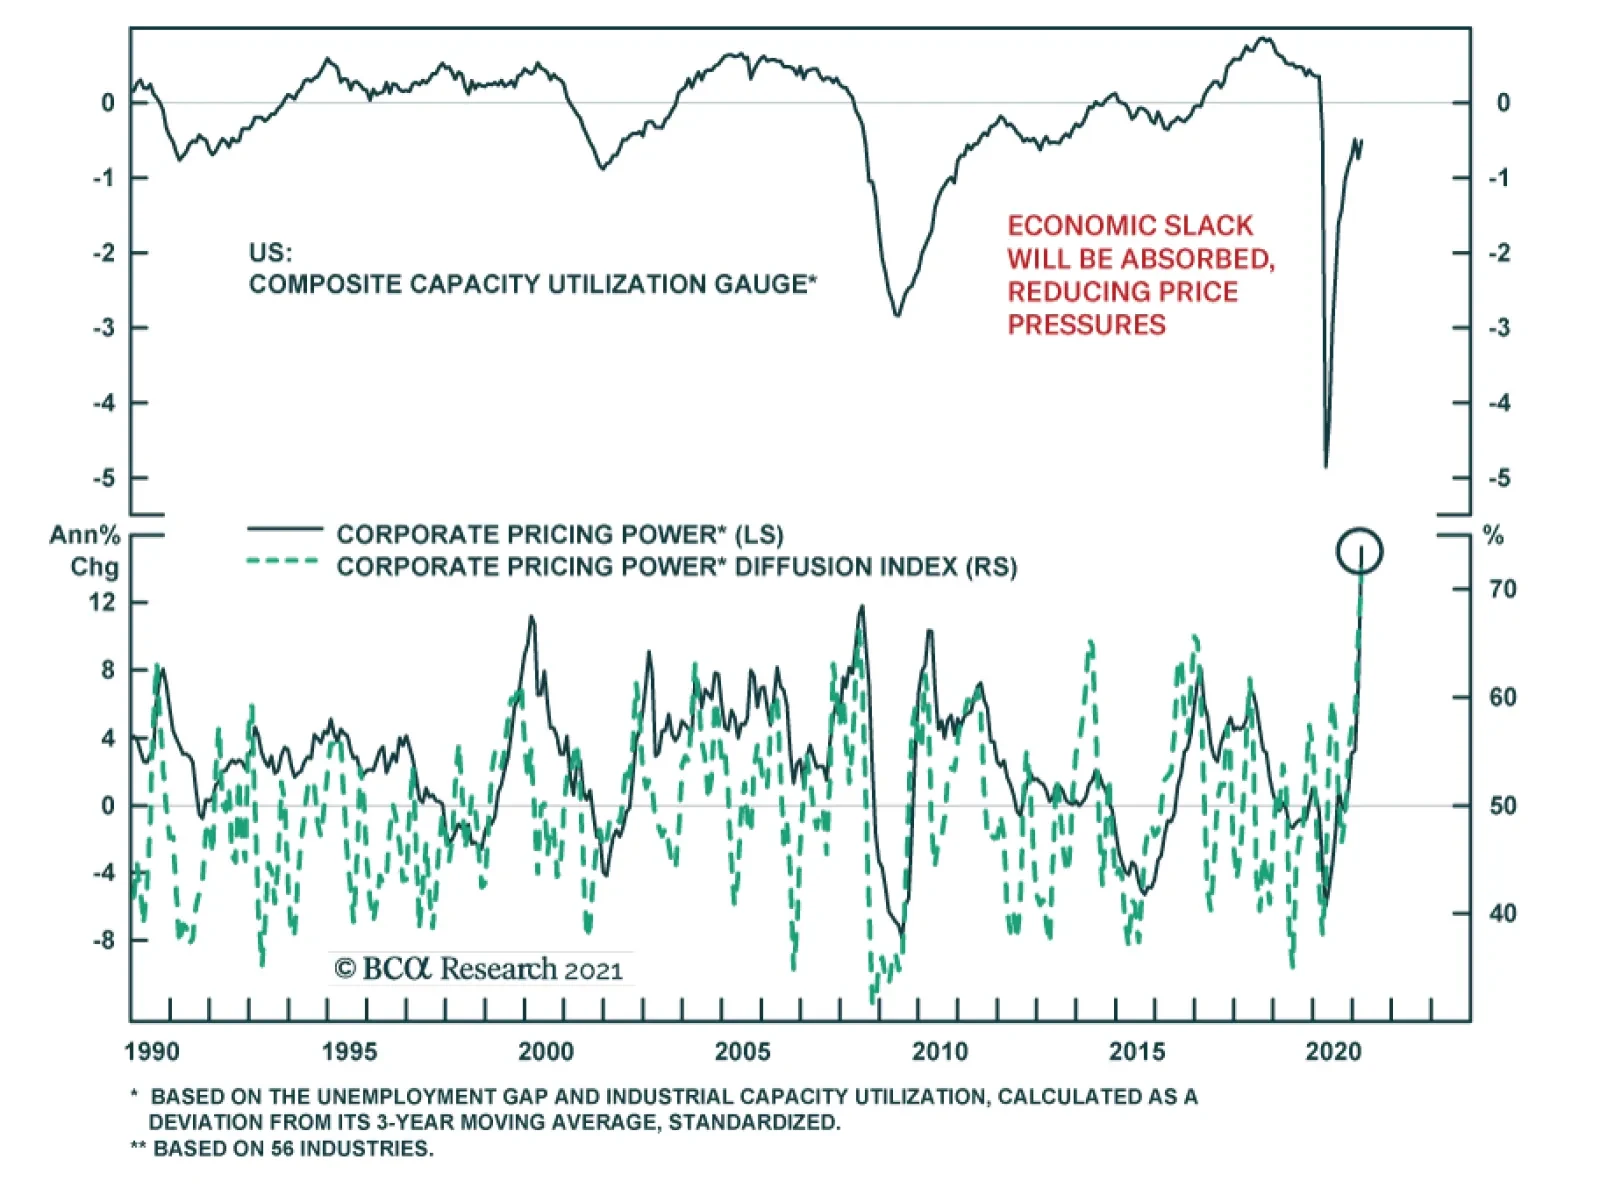
From an investment point of view, now is the perfect time to raise corporate taxes as the early cyclical surge in economic activity will prevent the one-off hit to earnings, which should be around 5%-8% according to our Global Investment Strategy, from hindering the stock market for long. The output gap, apparent from still relatively low industrial capacity utilization, will rapidly be plugged regardless of the tax hikes, as is evident from the surge in retail sales and core capital goods new orders and the decline in fuel inventories (Chart 5). The hyper-stimulated economy has been a key reason for our argument that Biden will mostly get what he wants, in terms of corporate taxes, since growth will be fine. The public is positively crying out for taxing corporations, as we showed in our April 7 missive and other reports. Chart 5The Output Gap Will Close Quickly
The Output Gap Will Close Quickly
The Output Gap Will Close Quickly
Given that Biden’s political capital is only “just enough,” and that it is falling over time, many investors believe that Biden’s major legislative proposals will be watered down beyond recognition. They will be watered down but the reconciliation process ensures that Democrats will pass at least one bill and that it will largely gratify the party’s preferences. And any watering down will affect tax hikes more so than spending, since tax hikes are the most controversial parts of the bill for moderate Senate Democrats. As Table 1 reveals, an infrastructure package with half the revenue increase is a $1.3 trillion addition to the budget deficit over the eight-to-15 year life-cycle of the bill, as opposed to a fictitious $341 billion in the event that all tax hikes pass Congress. Hence the paring back of Biden’s ambitions does not imply fiscal restraint and is not bullish for US Treasuries. Table 1Watering Down Biden’s Proposals Not Good For Deficit
Leviathan: Biden's First 100 Days
Leviathan: Biden's First 100 Days
A Productivity Boomlet How can we benchmark the magnitude of the structural transformation taking place in the US as a result of Biden’s Leviathanic spending proposals? From the perspective of government spending as a contributor to economic output, the Leviathan shrank in the decades after President Lyndon B. Johnson’s “Great Society” and Vietnam debacle. But from the perspective of government accounts, Big Government never actually went away (Chart 6), as Reagan used spending to win the Cold War and Clinton only enjoyed the briefest hiatus from deficits in the 1990s. From these charts we can conclude that Biden’s administration will create unprecedented spending and deficits that, taken with an extremely accommodative Fed, will increase the risk of substantially higher inflation over the 2020s. Chart 6Johnson’s ‘Great Society’ Versus Biden’s ‘Green Society’
Leviathan: Biden's First 100 Days
Leviathan: Biden's First 100 Days
Chart 7US Adds To Expansive Social Safety Net
Leviathan: Biden's First 100 Days
Leviathan: Biden's First 100 Days
Biden is not fighting an economic depression and world war, like Franklin D. Roosevelt, although the US has experienced a Great Recession and is entering a new cold war with China. So the shift should be seen as a generational change in the role of government and not as an ephemeral, four-year trend. This is true notwithstanding the fact that the US already spends a lot on health and education (Chart 7) and not as an ephemeral, four-year trend. The element of international competition is critical to the unique components of Biden’s spending package. Biden jettisoned the health care debates of the Obama era – to our surprise – and instead inaugurated the American foray into the global green energy race. Looking at the OECD’s measure of the “greenness” of global fiscal stimulus – and supplementing it with Biden’s proposed jobs plan – the US compares favorably with the EU and China (Chart 8). Chart 8US Enters The Green Energy Race
Leviathan: Biden's First 100 Days
Leviathan: Biden's First 100 Days
True, climate policy is more controversial in the US, which means it may well be frozen after Biden’s major bill. The EU and China will spend more on renewable energy and environmental protection because they are net energy importers and manufacturing powers. But the US is highly unlikely to exit the green race in the future, as younger generations care about it more than their elders and it is connected to the US strategic imperative of technological leadership. Biden will have opened up a new field of national policy, regardless of where on the field the players will fight over the ball at any given time. Biden is also pumping federal money into research and development, another area of geopolitical competition (Chart 9). The takeaway is that Biden’s first year in office – which may be his most consequential year in terms of legislation, particularly if he is a one-term president – is sowing the seeds for a productivity boom, or at least a mini-boom, in the coming years (Chart 10). The pace of productivity growth in the coming years is a matter of speculation and the long term trend is down. But the expected cyclical increase should be supplemented with the knowledge that the US is now aggressively monetizing debt, aggressively pursuing industrial policy and technological advancement, and aggressively competing with geopolitical rivals like China (and even allies like the EU). The likelihood of productivity breakthroughs may go up in such an extraordinary context. We cannot know but we cannot discount the possibility. Chart 9US Doubles Down On Tech Race
Leviathan: Biden's First 100 Days
Leviathan: Biden's First 100 Days
Chart 10Productivity Will Rise Cyclically But What About Structurally?
Productivity Will Rise Cyclically But What About Structurally?
Productivity Will Rise Cyclically But What About Structurally?
Vaccines And Immigration Elsewhere Biden’s first 100 days are less specific to his administration. The US is performing very well on the pandemic, both in innovating vaccines and distributing them, but an objective analysis will force Biden to share the credit with the Trump administration (Chart 11). On immigration, by comprehensively weakening enforcement and raising refugee allowances, all in the midst of a surging American economy, Biden will be vulnerable to Republican accusations of encouraging a humanitarian crisis on the border, vitiating rule of law, and making a cynical ploy to expand the Democratic voter base. The number of southwest border encounters by the Customs and Border Protection agency began to skyrocket over the past year – and as such it reflects structural factors that would have troubled a second Trump administration as well. But the election seems to have had an impact based on the inflection point in the data at the end of 2020 (Chart 12). Chart 11COVID-19 Vaccination Campaign On Track
COVID-19 Vaccination Campaign On Track
COVID-19 Vaccination Campaign On Track
Chart 12Immigration: Biden's Fatal Flaw?
Immigration: Biden's Fatal Flaw?
Immigration: Biden's Fatal Flaw?
Regardless, Biden has made the decision to cater to the pro-immigration side of his party and will now own this trend. It will be a unifying force for Republicans, although they remain deeply split over a range of issues and are not any closer to healing their wounds. The market impact is limited in the short run. In the medium run, if unchecked immigration feeds the nativist and populist elements of the Republican Party, then Biden’s decision could have a substantial impact on future US policy by generating a backlash. Our best guess at the moment is that Biden’s actions will reinforce the Republican Party’s embrace of Trump’s policy platform. Since Biden is not making major bipartisan legislative efforts to reform immigration comprehensively, the great immigration debate will return in 2024 or thereafter. Public opinion suggests Republican nativism is out of fashion but a large influx of immigrants could opinion over time as today’s issues fade. Thus Biden’s successes on economic recovery today are sowing the seeds of his party’s biggest vulnerability in domestic policy in future. But admittedly it is too soon to say whether this weakness will be effectively exploited by the opposition. In the meantime investors and corporations will cheer the prospect of cheap and abundant labor. An Overlooked Market Risk From The Midterm Elections This overview of Biden’s honeymoon period naturally refers to the 2022 midterm elections in several places. The Republicans will not be able to repeal Biden’s laws if they take the House of Representatives – or less likely the Senate – in the 2022 vote. But they will be able to grind proposals to a halt. The fate of Biden’s third major legislative proposal, the $1.8 trillion American Families Plan, will hang in the balance, as will green energy subsidies, the child tax credit, and various social initiatives. Much has been made about the 2020 US census and the reapportionment of seats in the House of Representatives according to the population. States that have a single party in control of the governor’s mansion and the legislature can gerrymander or redraw congressional districts as they please to favor their party. Table 2 shows that this partisan process could easily yield two Republican seats on a net basis. This is less than expected but Republicans only need a net of five seats to reclaim the House. Table 2US Census And Reapportionment Favors Republicans Slightly
Leviathan: Biden's First 100 Days
Leviathan: Biden's First 100 Days
Redistricting is an important theme because it perpetuates political polarization. But it is not important in determining who will win the House in 2022. The House has changed hands numerous times despite gerrymandered districts. Midterms almost always work against the president’s party. Only in 1934, during the Great Depression, and 2002, immediately after the Twin Towers were attacked, did voters strengthen a first-term president’s hold on Congress. Judging by Biden’s approval rating, Democrats would be lined up for a loss of far more than five seats on a net basis in 2022. They could lose 20 or more (Chart 13). As noted in the previous section, Republicans may find a rallying point on immigration. Chart 13Midterm Elections Dominated By Opposition Party – And Need For Checks And Balances
Leviathan: Biden's First 100 Days
Leviathan: Biden's First 100 Days
Having said that, investors should not make any decisions based on the midterm election. While Republicans have a 95% chance of winning the House according to the modern historical pattern, they have a lower 73% chance according to the online political betting hub Predictit.org, and we would side with the latter or even lower, at this early stage in the political cycle. The pandemic and social unrest of 2020, combined with the slow-growth 2010s and trade war, create a context of upheaval that is not entirely dissimilar to the exceptional midterm elections of 1932 and 2002. Biden’s rescue packages and the economic recovery will be a huge boon for the Democratic Party in 2024 and it is possible that they will reap some benefits even in 2022. This is especially the case because Trump and his allies will challenge establishment and elitist Republicans in the primary elections, which could result in Republicans losing five-to-nine seats. If they put up Trumpists in competitive, purple, or suburban districts, voters will swing toward moderate Democrats over populist Republicans in order to preserve the “bread and butter” gains of Biden’s agenda. The bottom line is that Republicans are favored to take the House in 2022 but the 75% odds are much more realistic than the 95% historical probability and possibly even too high. Gridlock would freeze Biden’s spend-and-tax agenda in place but the absence of gridlock would come as a surprise to investors who counted on a Republican victory. Tax hikes on wealthy individuals and capital gains – as projected in the American Families Plan – could still be on the table after the midterm. These tax hikes would still be unlikely to overturn the equity bull market but they could cause investors to reassess the overall policy setting for the worse. The implication would be that the 2020 political change marked a more lasting leftward shift in US policy. For example, taxes could go up beyond what Biden currently projects. Midterm risks should not trouble investors in the near term but they should be on the radar, particularly as the Republican primaries get underway next year and as investors get a better read on inflation in the wake of Biden’s mammoth spending. Investment Takeaways We would draw a few main investment takeaways from Biden’s first 100 days. In the short run, we would call attention to the “buy the rumor, sell the news” behavior exhibited by financial markets during President Trump’s first year in office with full party control of Congress. US equities stood to benefit from tax cuts, especially relative to the rest of the world, which would not receive tax cuts but could face trade tariffs. This expectation played out after Trump’s election but the market sold upon the news of his inauguration. It played out again after Republicans failed to repeal Obamacare, suggesting they might fail to cut taxes. The market correctly bid up US equities on the rumor that the GOP would then turn its full attention to cutting taxes. US equities outperformed until the end of the year when the tax cuts became a fait accompli, at which point the news was sold (Chart 14, top panel). The implication today is that US stocks, especially cyclical stocks and infrastructure-related plays, will continue generally to rally ahead of Biden signing the American Jobs Plan into law, likely around November. Obviously a correction could occur at any time but upon the signing of the law one should not be surprised to see some serious profit-taking. An analogy can also be drawn to renewable energy plays after the Democrats’ “Blue Sweep” in 2020. Markets have largely discounted the surge in renewable energy plays that occurred upon the recession in 2020 and the rising likelihood that Trump would lose reelection (Chart 14, bottom panel). This creates a buying opportunity for a long-term theme. Republicans will not be able to repeal Biden’s green projects and there is some risk that Democrats retain legislative control. And younger generations, even Republicans, are favorable toward the greening of society. Therefore we recommend going long US renewable energy stocks. It also follows that cyclical and value stocks have not yet exhausted their run against defensives and growth stocks. We will therefore hang onto our long materials / short Big Tech trade until we see more substantial signs that near-term disinflationary risks will derail this trade (Chart 15). We will also stick with our short managed health care trade – and our preference for health care equipment and facilities within the health care sector – despite the Democrats’ tentative decision to sideline the health care policies that would have hit the health insurers and Big Pharma. Chart 14Investment Takeaways: Buy The Green Hype (For Now)
Investment Takeaways: Buy The Green Hype (For Now)
Investment Takeaways: Buy The Green Hype (For Now)
Chart 15Housekeeping: Stick With Materials Over Tech
Housekeeping: Stick With Materials Over Tech
Housekeeping: Stick With Materials Over Tech
In the long run, we would point out that the shift away from Reaganism toward Johnsonianism – the return of Leviathan – is a lasting trend that will bring significant change to the US policy setting. These are mostly but not all inflationary. Larger immigration and a productivity boost are not inflationary. But large deficits, tax hikes, and wage pressures are inflationary. Therefore the risk of inflation has gone up in a historic way even though the magnitude of the risk can be overstated in the short term – when there is still slack in the economy – and there are still disinflationary factors that could work against the risk as events unfold. We remain cyclically bullish. Matt Gertken Vice President Geopolitical Strategy mattg@bcaresearch.com Appendix Table A1USPS Trade Table
Leviathan: Biden's First 100 Days
Leviathan: Biden's First 100 Days
Table A2Political Risk Matrix
Leviathan: Biden's First 100 Days
Leviathan: Biden's First 100 Days
Table A3Political Capital Index
Leviathan: Biden's First 100 Days
Leviathan: Biden's First 100 Days
Table A4APolitical Capital: White House And Congress
Leviathan: Biden's First 100 Days
Leviathan: Biden's First 100 Days
Chart A4BPolitical Capital: Household And Business Sentiment
Leviathan: Biden's First 100 Days
Leviathan: Biden's First 100 Days
Table A4CPolitical Capital: The Economy And Markets
Leviathan: Biden's First 100 Days
Leviathan: Biden's First 100 Days
Last September, we showed five reasons, from our pool of short-term indicators we track, not to chase equities higher and warned investors that a pullback was in the cards. Subsequently, the SPX fell 10% from peak-to-trough and suffered its first correction since the March 23, 2020 bottom. Fast-forward to today, and a number of our short-term indicators are flashing red again. While overbought conditions are a notch below the extremes printed last September, we still take this opportunity to revisit and update five of our near-term technical indicators in no particular order. Reason #1: The 200-day Moving Average Moving averages are a reliable tool to put the speed of any rally in perspective and to gauge investor sentiment. Chart 1 shows the SPX and NASDAQ 100 (NDX) price ratios with respect to their 200-day moving averages as Z-scores. Whenever both the SPX and NDX crossed above the one standard deviation (STDEV) line, a sizable pullback was quick to follow. While the NDX retraced below the one STDEV line recently, this week’s price action pushed the ratio back above the one STDEV line sounding the alarm. The implication is that the probability of a pullback is rising rapidly. Chart 1
Reason 1
Reason 1
Reason #2: Bollinger Bands For the second reason, we look at price deviations from the moving average through a different lens – Bollinger bands (BBs). A traditional (20,2) BB includes a 20-period moving price average, as well as 20-period two STDEV lines. Chart 2 shows the S&P 500 together with its (20,2) BBs, on a monthly time frame. Whenever the market spikes above the two STDEV line, a sizable correction ensues. Currently, the market is squarely above the two STDEV line, which has historically been a precursor to a 5-10% drawdown. Chart 2
Déjà Vu: Five Reasons Not To Chase Equities In the Near-Term
Déjà Vu: Five Reasons Not To Chase Equities In the Near-Term
Reason #3: Market Breadth In addition to looking at popular market breadth indicators such as a percent of stocks above a moving average and new highs/new lows series, we also take a look at the Hindenburg Omen indicator that is a breadth indicator partially based on the new highs/new lows calculation. A more in-depth explanation can be found here. Similarly to the aforementioned Reason #1, the best signal is given when the indicator flashes red for both NYSE and NASDAQ exchanges. Chart 3 shows that when implementing this approach, there has only been one false/positive – the Trump’s tax cut rally. Currently, the indicator represents another warning sign: it produced a sell signal in March. While this can prove another false/positive, given the plethora of other warnings, we doubt this will be the case. Chart 3
Reason 3
Reason 3
Reason #4: Options/Volatility Markets Next, options related volatility reveals more broad equity market vulnerabilities. Specifically, the VIX and the VXN which by construction are inversely correlated with the S&P 500 and NASDAQ 100, respectively, serve as an excellent timing tool. We look at the 20-day moving correlation of those respective variables, and a reliable sell signal is given once both (VIX, SPX) and (VXN, NDX) 20-day moving correlations shoot into positive territory (Chart 4). True, this signal has not been triggered just yet with the (VXN, NDX) pair lagging behind. But the positive print that happened this Monday in the (VIX, SPX) pair was enough to rattle the market yesterday, which could be a precursor to a larger correction. Chart 4
Reason 4
Reason 4
Reason #5: Lack Of Leadership The last reason for near-term cautiousness is the lack of leadership from a key cyclical sub-sector. Weakness in anticipatory semiconductors is far too pronounced to be written off as an industry-only event. Chart 5 depicts how the current divergence between relative semi prices and the SPX is eeriely similar to the one in late-2018. Finally, Chart A1 in the Appendix on the next page examines the relationship between semis and the SPX on a longer timeframe. Bottom Line: There are rising odds of a sizable SPX pullback. Investors who cannot stomach a likely volatility bout can buy some protection in the form of VIX futures (we are long the June expiry contract) in order to withstand a possible 10% SPX correction. Short-term caution on the prospects of the broad equity market that remains fully valued is still warranted. Chart 5
Reason 5
Reason 5
Appendix Chart A1
Appendix
Appendix
Highlights A slower money and credit growth in China will eventually generate disinflationary pressures by weighing on demand for commodities. The PBoC has shifted its inflation anchor and policy framework to target core CPI and the PPI rather than headline CPI. Beijing is scaling back its fiscal supports and cooling the property sector to tackle local government and housing sector debt issues. In the next six to nine months we favor companies and sectors that will benefit from global economic recovery rather than China’s domestic demand. We are long CSI500 relative to China’s A shares. The CSI500 has a larger exposure to the global economy and lower valuation relative to China’s broad onshore market. Feature As a follow up to last week’s report, we look at another topic raised in recent client meetings: whether rapidly rising producer prices in China will morph into a broad-based inflationary risk and how macroeconomic policies will evolve to counter such a risk. Clients who believe that the ongoing producer price inflation is transitory cited China’s low consumer price inflation, and slowing money and credit growth, as leading indicators of budding disinflationary pressures. Advocates of sustained inflation pointed to robust recoveries and demand among advanced economies, extremely accommodative monetary conditions worldwide, massive fiscal stimulus in the US, a weak US dollar, and supply constraints. It remains to be seen what the worldwide pandemic’s impact will be on the balance between global production capacity and aggregate demand. In this report we analyze the PBoC’s inflation target and policy framework, and conclude that while China’s monetary policy has not become more hawkish, policy tightening seems to be taking place on the fiscal front. Is Inflation In China A Risk? It is debatable whether the strong rebound in GDP growth in Q4 last year and in Q1 this year has closed China’s output gap and will lead to widespread inflation. Given data distortions due to low-base effects from the previous year and uncertainty about China’s productivity and labor force growth, any calculation of the output gap will be unreliable. In addition, China’s employment statistics lack cyclicality and cannot be used to gauge inflationary pressure stemming from wage growth and unit labor costs. Chart 1A Rollover In Credit Growth Will Weigh On Chinese Demand For Commodities
A Rollover In Credit Growth Will Weigh On Chinese Demand For Commodities
A Rollover In Credit Growth Will Weigh On Chinese Demand For Commodities
Our cyclical view of inflation is therefore based on the framework that the ongoing moderation in China's money and credit growth will eventually generate disinflationary pressures by weighing on the country’s demand for and price of commodities (Chart 1). Furthermore, behind a resilient PPI, there are suggestions that the strength in China’s economy is still bifurcated. A narrow-based uptrend in the PPI lacks the ground for sustained inflation, and is unlikely to trigger a general tightening in monetary policy. While mounting global prices for raw materials propelled strong upstream PPI, producer prices for consumer goods and core consumer price inflation remain very subdued (Chart 2). The inconsistency in producer prices among various industries highlight the unevenness of the economic recovery and, importantly, persistently muted household consumption (Chart 3). Chart 2A Bifurcated Economic Recovery
A Bifurcated Economic Recovery
A Bifurcated Economic Recovery
Chart 3A Muted Recovery In Household Consumption
A Muted Recovery In Household Consumption
A Muted Recovery In Household Consumption
Chart 4Weak Price Transmission From Upstream To Downstream Industries
Weak Price Transmission From Upstream To Downstream Industries
Weak Price Transmission From Upstream To Downstream Industries
The transmission from upstream industrial PPI to the middle and downstream sectors has also been weak (Chart 4). It is evidenced in the faster growth of manufacturing output volume compared with price increases (Chart 5). This contrasts with the previous inflationary cycles, as well as mining and ferrous metals where surging prices for raw materials have way surpassed recovery in output volume (Chart 6). Given that price changes are more important to corporate profits than volume changes, Chinese middle-to-downstream industries face downward pressure on their profit margins and will likely deliver disappointing profits, despite a strong rebound in production. Chart 5China's Manufacturing Recovery: Stronger Volume Than Prices
China's Manufacturing Recovery: Stronger Volume Than Prices
China's Manufacturing Recovery: Stronger Volume Than Prices
Chart 6China's Upstream Industries: Prices Surged Faster Than Production
China's Upstream Industries: Prices Surged Faster Than Production
China's Upstream Industries: Prices Surged Faster Than Production
Furthermore, PMI input prices, which lead core CPI by about nine months, rolled over in April (Chart 7). While it is too soon to conclude that input prices have peaked, it is implied that upward pressure on core CPI from input prices may start to ease in 2H21. Bottom Line: So far there is no sign that elevated upstream producer prices will create sustainable inflationary pressure on consumer prices. Hence our view is that the PBoC will not respond to a rising PPI by further tightening monetary policy. Chart 7PMI Input Prices Have Rolled Over
PMI Input Prices Have Rolled Over
PMI Input Prices Have Rolled Over
Chart 8Core CPI And PPI Have Been The PBoC's Inflation Targets Since 2015
Core CPI And PPI Have Been The PBoC's Inflation Targets Since 2015
Core CPI And PPI Have Been The PBoC's Inflation Targets Since 2015
The PBoC’s Inflation Target Since 2015, China’s monetary tightening cycles have closely correlated with a combination of the core CPI and PPI instead of headline CPI (Chart 8). The shift to targeting core CPI and PPI occurred despite the central bank’s frequent mention of headline CPI as its inflation target. The reasons for the shift are twofold. First, swings in food and fuel prices have become much larger since 2014, often dominating fluctuations in headline CPI (Chart 9). Secondly, the price swings were often driven by supply-side factors and did not reflect changes in demand. Therefore, monetary policies could do little to mitigate inflationary or deflationary pressures. Furthermore, the PPI seems to play a greater role in the PBoC’s monetary policymaking than the headline and core CPI (Chart 10). The tighter relationship between the de facto policy rate and the PPI is not surprising, given that China’s ex-factory price inflation reflects changes in corporate pricing, profit, and inventory cycles – all are driven by the country’s money supply and credit cycles. Chart 9Large Swings In Food And Energy Prices Distorted Headline CPI In Recent Years
Large Swings In Food And Energy Prices Distorted Headline CPI In Recent Years
Large Swings In Food And Energy Prices Distorted Headline CPI In Recent Years
Chart 10PPI Plays A Greater Role In The PBoC's Monetary Policymaking
PPI Plays A Greater Role In The PBoC's Monetary Policymaking
PPI Plays A Greater Role In The PBoC's Monetary Policymaking
The relationship between the 7-day repo rate - the de jure policy rate - and the PPI has broken down since 2015 (Chart 11). Meanwhile, the 3-month repo rate has maintained a close relationship with the PPI (Chart 10, bottom panel). The change in the relationship is because the PBoC shifted its policy to target interest rates instead of the quantity of money supply since 2015 (Chart 12). Moreover, since 2016 the PBoC has generated monetary policy tightening measures through changes in its Macro Prudential Assessment Framework (MPA) rather than directly through interest rate hikes. Chart 11Relationship Between The 7-Day Repo Rate And The PPI Has Broken Down Since 2015...
Relationship Between The 7-Day Repo Rate And The PPI Has Broken Down Since 2015...
Relationship Between The 7-Day Repo Rate And The PPI Has Broken Down Since 2015...
Chart 12...Due To Monetary Policy Regime Shifted
...Due To Monetary Policy Regime Shifted
...Due To Monetary Policy Regime Shifted
Bottom Line: The PBoC has shifted its inflation anchor and policy framework since 2015. Core CPI and the PPI are now the main inflation targets. A Quiet Fiscal Tightening? Despite a jump in the PPI, the 3-month repo rate fell sharply in the past two months (Chart 10 on page 6, bottom panel). It is possible that the PBoC considers escalating producer prices as transitory and, therefore, intends to keep its overall policy stance unchanged. However, the PBoC’s relaxed policy response towards inflation risk may be explained by Beijing’s quiet tightening on the fiscal front. Chart 13The Central Bank Has Made Little Interbank Liquidity Injections Lately
The Central Bank Has Made Little Interbank Liquidity Injections Lately
The Central Bank Has Made Little Interbank Liquidity Injections Lately
The PBoC can hold its policy rates steady by supplying adequate liquidity to the interbank system through open market operations or by reducing the demand for liquidity. On a net basis, the PBoC has recently injected very little liquidity into the interbank system, implying that banks’ liquidity demand has likely softened (Chart 13). This might be a sign of weakening credit origination. In a previous report we discussed how fiscal stimulus has become a more relevant driver of China’s credit origination since the onset of the 2014/15 economic downcycle. A rising 3-month SHIBOR can be the result of rapid fiscal and quasi-fiscal expansions, which occurred in Q3 last year. A flood of local government bond issuance drained liquidity from commercial banks, which boosted the banks’ needs to borrow money from the interbank system and pushed up interbank rates. Despite higher interest rates, credit growth soared in Q3 as fiscal multiplier provided an imminent and powerful reflationary force to the economy. In contrast, local government bond issuance was down sharply in the first four months of this year, compared with 2019 and 2020. Local governments sold 222.7 billion yuan of special-purpose bonds (SPBs) from January to April, a plunge from 730 billion yuan of debt sold in the same period in 2019 and 1.15 trillion yuan in 2020. The total local government bond issuance in Q1 this year has also been 36% and 44% lower than in Q1 2019 and 2020, respectively. A lack of local governments’ appetite to borrow coupled with a shortage in profitable infrastructure projects might have contributed to the sharp drop in bond issuance this year. Local government financing and spending have been under increased scrutiny this year. Following the State Council Executive Meeting in late March, in which Premier Li Keqiang pledged to reduce government leverage ratio and raise regulatory standards on infrastructure investment, Beijing suspended two high-speed rail projects that were initiated by provincial governments. Messages from Politburo’s meeting last week reinforced our view that policymakers may be scaling back fiscal support while further tightening regulations in the property sector. Both aspects have the potential to cool China’s demand for industrial metals and global industrial material prices (Chart 14 and Chart 15). Chart 14A Slowdown In Chinese Manufacturing Demand Will Have A Greater Impact On Global Industrial Material Prices
A Slowdown In Chinese Manufacturing Demand Will Have A Greater Impact On Global Industrial Material Prices
A Slowdown In Chinese Manufacturing Demand Will Have A Greater Impact On Global Industrial Material Prices
Chart 15Lower Housing Demand In China Will Help To Cool Industrial Metal Prices
Lower Housing Demand In China Will Help To Cool Industrial Metal Prices
Lower Housing Demand In China Will Help To Cool Industrial Metal Prices
We expect the intensity of policy tightening to reach its peak between mid-year to third-quarter 2021. It is unclear at this point whether policymakers are willing to allow local governments to significantly undershoot their SPB quota for this year. Local governments reportedly experienced a shortage in profitable investment projects towards the end of last year, and thus, parked more than 10% of proceeds from 2020 SPB issuance at the central bank. The central government may be taking a wait-and-see attitude this year, and saving more fiscal dry powder for later this year when the economic slowdown becomes more meaningful. Bottom Line: Beijing is pulling back its fiscal supports and cooling the property sector to tackle local government and housing sector debt issues. The deleveraging efforts will curb China’s demand for commodities, and may work to ease inflationary pressure on prices for raw materials. Investment Conclusions The outlook for China’s risk asset prices remains bearish, at least in the next six months. If the credit and fiscal impulse slow enough to depress corporate pricing power, inflation will not be a problem because disinflationary pressures will resurface. However, the growth of corporate profits will disappoint (Chart 16). Beijing may be saving more fiscal dry powder for later this year. Still, SPBs are only a small part of local governments’ financing source for infrastructure projects. Given the central government’s renewed focus on reducing public debt, policymakers are unlikely to unleash fiscal power to significantly boost infrastructure spending or economic growth. In the next six to nine months, we favor companies and sectors that will benefit from global economic recovery rather than China’s domestic demand. With this week's report, we initiate a long position on the CSI500 index, which has a larger exposure to the global market and lower valuation relative to China’s broad onshore market (Chart 17). Chart 16Aggregate Corporate Profit Growth Will Slow Even Though Inflation Is No Longer An Issue
Aggregate Corporate Profit Growth Will Slow Even Though Inflation Is No Longer An Issue
Aggregate Corporate Profit Growth Will Slow Even Though Inflation Is No Longer An Issue
Chart 17Long CSI500/Broad Market
Long CSI500/Broad Market
Long CSI500/Broad Market
Jing Sima China Strategist jings@bcaresearch.com Cyclical Investment Stance Equity Sector Recommendations
Yet Another Blockbuster Quarter for S&P 500 Earnings
…
Market commentary is rife with references to evidence of rising inflationary risk in the US economy. This is not unfounded. Monday’s ISM report highlighted supply chain bottlenecks, raw material shortages, and labor market challenges as dominant forces…
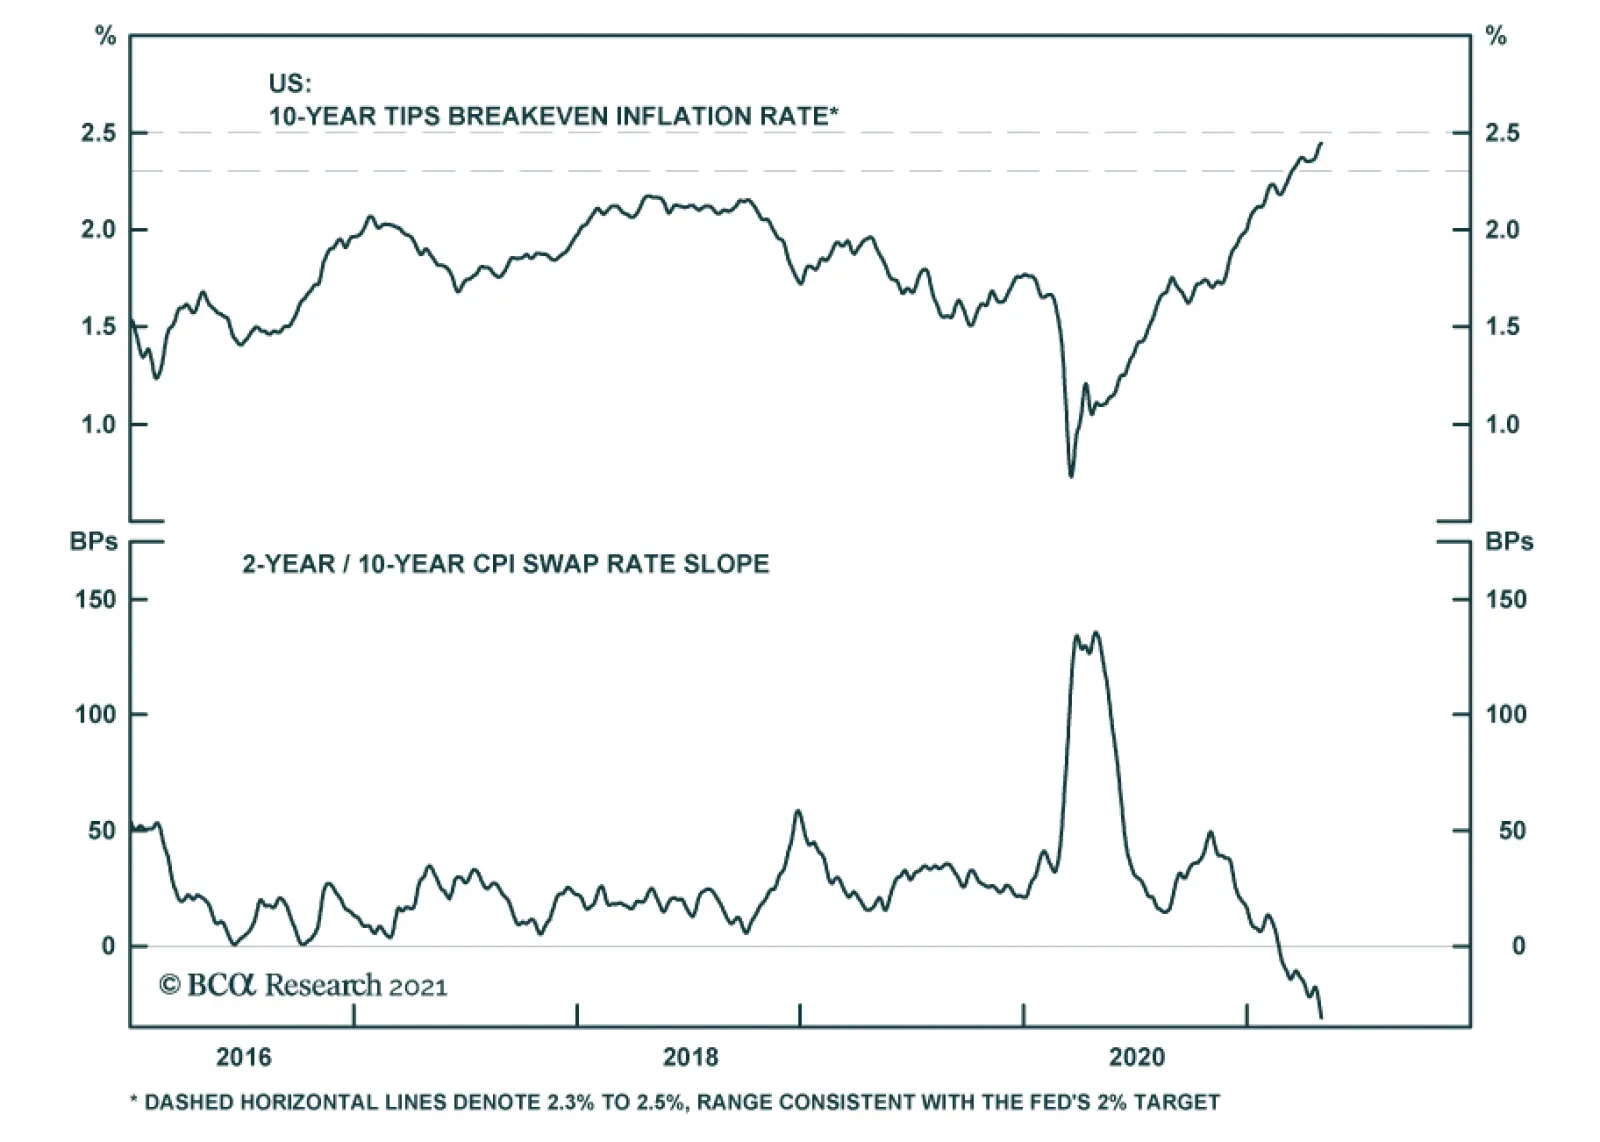
BCA Research’s US Bond Strategy service is downgrading TIPS from overweight to neutral. There are two reasons for this downgrade. First, long-maturity breakevens are consistent with the Fed’s target. At 2.43%, the 10-year TIPS breakeven…
Highlights Chart 1Inflation Pressures Building
Inflation Pressures Building
Inflation Pressures Building
As expected, base effects kicked in and pushed 12-month core PCE inflation from 1.37% to 1.83% in March. But a favorable comparison to last year’s depressed price level only explains part of inflation’s jump. Core PCE also rose at an annualized monthly rate of 4.4% in March, one of the highest readings seen during the past few years (Chart 1). Jerome Powell spoke about the Fed’s view of inflation at last week’s FOMC press conference and he reiterated that the Fed views current upward price pressures as transitory, the result of both base effects and temporary bottlenecks resulting from an economic re-opening where demand recovers more quickly than supply. Powell’s message is that the Fed won’t lift rates until the labor market returns to “maximum employment” and it won’t start tapering asset purchases until it sees “substantial further progress” toward that goal. Our view remains that the Fed will see enough improvement in the labor market to start tapering asset purchases in late-2021 or early-2022. It will also begin lifting rates before the end of 2022. As a result, we continue to recommend below-benchmark portfolio duration. Feature Table 1Recommended Portfolio Specification
Fed Won’t Catch Inflation Fever
Fed Won’t Catch Inflation Fever
Table 2Fixed Income Sector Performance
Fed Won’t Catch Inflation Fever
Fed Won’t Catch Inflation Fever
Investment Grade: Neutral Chart 2Investment Grade Market Overview
Investment Grade Market Overview
Investment Grade Market Overview
Investment grade corporate bonds outperformed the duration-equivalent Treasury index by 13 basis points in April, bringing year-to-date excess returns up to +111 bps. The combination of above-trend economic growth and accommodative monetary policy supports positive excess returns for spread product versus Treasuries. At 149 bps, the 2/10 Treasury slope is very steep and the 5-year/5-year forward TIPS breakeven inflation rate sits at 2.26% – almost, but not quite, equal to the lower-end of the 2.3% - 2.5% range that the Fed considers “well anchored”. The message from these two indicators is that the Fed is not yet ready to turn monetary policy more restrictive. Despite the positive macro back-drop, investment grade corporate valuations are extremely tight. The investment grade corporate index’s 12-month breakeven spread is down to its 1st percentile (Chart 2). This means that the breakeven spread has only been tighter 1% of the time since 1995. The same measure shows that Baa-rated bonds have only been more expensive 2% of the time (panel 3). We don’t anticipate material underperformance versus Treasuries, but we see better opportunities outside of the investment grade corporate space. Specifically, we advise investors to favor both tax-exempt and taxable municipal bonds over investment grade corporates with the same credit rating and duration (see page 9). We also prefer USD-denominated Emerging Market Sovereign bonds over investment grade corporates with the same credit rating and duration (see page 8). Finally, the supportive macro environment means we are comfortable adding credit risk to a portfolio. With that in mind, we encourage investors to pick up the additional spread offered by high-yield corporates (see page 6). Table 3ACorporate Sector Relative Valuation And Recommended Allocation*
Fed Won’t Catch Inflation Fever
Fed Won’t Catch Inflation Fever
Table 3BCorporate Sector Risk Vs. Reward*
Fed Won’t Catch Inflation Fever
Fed Won’t Catch Inflation Fever
High-Yield: Overweight Chart 3High-Yield Market Overview
High-Yield Market Overview
High-Yield Market Overview
High-Yield outperformed the duration-equivalent Treasury index by 70 basis points in April, bringing year-to-date excess returns up to +335 bps. In a recent report, we looked at the default expectations that are currently priced into the junk index and considered whether they are likely to be met.1 If we demand an excess spread of 100 bps and assume a 40% recovery rate on defaulted debt, then the High-Yield index embeds an expected default rate of 3.2% (Chart 3). Using a model of the speculative grade default rate that is based on gross corporate leverage (aka pre-tax profits over debt) and C&I lending standards, we can estimate a likely default rate for the next 12 months using assumptions for profit and debt growth. The median FOMC forecast of 6.5% real GDP growth in 2021 is consistent with 31% corporate profit growth. We also assume that last year’s debt binge will be followed by relatively weak corporate debt growth in 2021. According to our model, 30% profit growth and 2% debt growth is consistent with a default rate of 3.4%, very close to what is priced into junk spreads. Given that the large amount of fiscal stimulus coming down the pike makes the Fed’s 6.5% real GDP growth forecast look conservative, and the fact that the combination of strong economic growth and accommodative monetary policy could easily cause valuations to overshoot in the near-term, we are inclined to maintain an overweight allocation to High-Yield bonds. MBS: Underweight Mortgage-Backed Securities outperformed the duration-equivalent Treasury index by 11 basis points in April, bringing year-to-date excess returns up to +26 bps. The nominal spread between conventional 30-year MBS and equivalent-duration Treasuries tightened 5 bps in April. This spread remains wide compared to levels seen during the past few years, but it is still tight compared to the recent pace of mortgage refinancings (Chart 4). The conventional 30-year MBS option-adjusted spread (OAS) currently sits at 11 bps. This is considerably below the 51 bps offered by Aa-rated corporate bonds, the 33 bps offered by Agency CMBS and the 24 bps offered by Aaa-rated consumer ABS. All in all, the value in MBS is not appealing compared to other similarly risky sectors. In a recent report, we looked at recent MBS performance and valuation across the coupon stack.2 We noted that high coupon MBS have delivered strong excess returns versus Treasuries since bond yields troughed last August, while low coupon MBS have lagged (panel 4). This divergence occurred because the higher coupon securities are less negatively convex and thus their durations didn’t extend as much during the back-up in yields. Looking ahead, we recommend favoring 4% and 4.5% coupons and avoiding 2%, 2.5% and 3% coupons. The higher OAS and less negative convexity of those higher coupon securities will cause them to outperform in an environment of flat or rising bond yields. Lower coupon MBS only look poised to outperform in an environment of falling bond yields, which is not our base case. Chart 4MBS Market Overview
MBS Market Overview
MBS Market Overview
Government-Related: Neutral The Government-Related index outperformed the duration-equivalent Treasury index by 6 basis points in April, bringing year-to-date excess returns up to +72 bps (Chart 5). Sovereign debt underperformed duration-equivalent Treasuries by 19 bps in April, dragging year-to-date excess returns down to +21 bps. Foreign Agencies outperformed the Treasury benchmark by 2 bps on the month, bringing year-to-date excess returns up to +34 bps. Local Authority bonds outperformed by 41 bps in April, bringing year-to-date excess returns up to +329 bps. Domestic Agency bonds outperformed by 5 bps, bringing year-to-date excess returns up to +19 bps. Supranationals outperformed by 3 bps, bringing year-to-date excess returns up to +16 bps. We recently took a detailed look at USD-denominated Emerging Market (EM) Sovereign valuation.3 We found that, on an equivalent-duration basis, EM Sovereigns offer a spread advantage over investment grade US corporates. Attractive countries include: Mexico, Russia, Indonesia, Colombia, Saudi Arabia, Qatar and UAE. We prefer US corporates over EM Sovereigns in the high-yield space where there is still some value left in US corporate spreads and where the EM space is dominated by distressed credits like Turkey and Argentina. Chart 5Government-Related Market Overview
Government-Related Market Overview
Government-Related Market Overview
Municipal Bonds: Overweight Chart 6Municipal Market Overview
Municipal Market Overview
Municipal Market Overview
Municipal bonds outperformed the duration-equivalent Treasury index by 17 basis points in April, bringing year-to-date excess returns up to +308 bps (before adjusting for the tax advantage). We took a detailed look at recent municipal bond performance and valuation in last week’s report and came to the following conclusions.4 First, the economic and policy back-drop is favorable for municipal bond performance. The recently passed American Rescue Plan includes $350 billion of funding for state & local governments, a bailout that comes after state & local government revenues already exceeded expenditures in 2020 (Chart 6). President Biden has also proposed increasing income tax rates. Though these increases may not pass before the 2022 midterm, the threat of higher tax rates could increase interest in municipal bonds. Second, Aaa-rated municipal bonds look expensive relative to Treasuries (top panel). Muni investors should move down the quality spectrum to pick up additional yield. Third, General Obligation (GO) and Revenue munis offer better value than investment grade corporates with the same credit rating and duration, particularly at the long-end of the curve. Revenue munis in the 12-17 year maturity bucket offer a before-tax yield pick-up versus corporates, while GO munis offer a breakeven tax rate of just 7% (panel 2). Fourth, taxable munis offer a yield advantage versus investment grade corporates (panel 3), one that investors should take advantage of. Finally, high-yield muni spreads are reasonably attractive relative to high-yield corporates, offering investors a breakeven tax rate of 19% (panel 4). Despite the attractive spread, we only recommend a neutral allocation to high-yield munis versus high-yield corporates since high-yield munis’ deep negative convexity makes the sector prone to extension risk if bond yields should rise. Treasury Curve: Buy 5-Year Bullet Versus 2/10 Barbell Chart 7Treasury Yield Curve Overview
Treasury Yield Curve Overview
Treasury Yield Curve Overview
The Treasury curve bull-flattened in April, even as the economic data continued to surprise on the upside. The 2/10 Treasury slope flattened 9 bps to end the month at 149 bps. The 5/30 slope flattened 5 bps to end the month at 144 bps (Chart 7). As we showed in a recent report, the Treasury curve continues to trade directionally with yields out to the 10-year maturity point.5 Beyond 10 years, the curve has transitioned into a bear-flattening/bull-steepening regime where higher yields coincide with a flatter curve and vice-versa (bottom panel). For now, we are content to stick with our recommended steepener: long the 5-year bullet and short a duration-matched 2/10 barbell. However, we will eventually be close enough to an expected Fed liftoff date that the 5/10 slope will follow the 10/30 slope and transition into a bear-flattening/bull-steepening regime. When that happens, it will make more sense to either position in a steepener at the front-end of the curve (long 3-year bullet / short 2/5 barbell) or a flattener at the long-end of the curve (long 5/30 barbell / short 10-year bullet). We don’t yet see sufficient evidence of 5/10 bear-flattening to shift out of our current recommended position and into these new ones, and so we stay the course for now. TIPS: Overweight Neutral Chart 8TIPS Market Overview
TIPS Market Overview
TIPS Market Overview
TIPS outperformed the duration-equivalent nominal Treasury index by 52 basis points in April, bringing year-to-date excess returns up to +394 bps. The 10-year and 5-year/5-year forward TIPS breakeven inflation rates rose 4 bps and 5 bps on the month, respectively. At 2.43%, the 10-year TIPS breakeven inflation rate is near the top-end of the 2.3% to 2.5% range that is consistent with inflation expectations being well anchored around the Fed’s target (Chart 8). Meanwhile, at 2.26%, the 5-year/5-year forward TIPS breakeven inflation rate is just below the target band (panel 3). This week, we are downgrading our TIPS allocation from overweight to neutral for two reasons. First, as noted above, long-maturity breakevens are consistent with the Fed’s target. The Fed has so far welcomed rising TIPS breakeven inflation rates, but it will have an increasing incentive to lean against them if they continue to move up. Second, TIPS breakevens and CPI swap rates are even higher at the front-end of the curve – the 1-year CPI swap rate is currently 2.93% – and there is a good chance that those lofty expectations will not be confirmed by the realized inflation data. In addition to shifting from overweight to neutral on TIPS versus nominal Treasuries, we also book profits on our inflation curve flattener trade (panel 4) and on our real yield curve steepener (bottom panel). The inflation curve will likely stay inverted, but it will have difficulty flattening further unless short-maturity inflation expectations move even higher. The real yield curve may continue to steepen as bond yields rise, but without additional inflation curve flattening it is better to position for that outcome along the nominal Treasury curve. ABS: Overweight Chart 9ABS Market Overview
ABS Market Overview
ABS Market Overview
Asset-Backed Securities outperformed the duration-equivalent Treasury index by 4 basis points in April, bringing year-to-date excess returns up to +19 bps. Aaa-rated ABS outperformed by 4 bps on the month, bringing year-to-date excess returns up to +13 bps. Non-Aaa ABS outperformed by 2 bps on the month, bringing year-to-date excess returns up to +58 bps. The stimulus from last year’s CARES act led to a significant increase in household savings when individual checks were mailed last April. This excess savings has still not been spent and already the most recent round of stimulus is pushing the savings rate higher again (Chart 9). The large stock of household savings means that the collateral quality of consumer ABS is very high, with many households using their windfalls to pay down debt (bottom panel). Investors should remain overweight consumer ABS and should also take advantage of the high quality of household balance sheets by moving down the quality spectrum. Non-Agency CMBS: Neutral Chart 10CMBS Market Overview
CMBS Market Overview
CMBS Market Overview
Non-Agency Commercial Mortgage-Backed Securities outperformed the duration-equivalent Treasury index by 44 basis points in April, bringing year-to-date excess returns up to +121 bps. Aaa Non-Agency CMBS outperformed Treasuries by 36 bps in April, bringing year-to-date excess returns up to +50 bps. Meanwhile, non-Aaa Non-Agency CMBS outperformed by 70 bps, bringing year-to-date excess returns up to +365 bps (Chart 10). Though returns have been strong and spreads remain attractive, particularly for lower-rated CMBS, we continue to recommend only a neutral allocation to the sector because of the structurally challenging environment for commercial real estate. Even with the economic recovery well underway, commercial real estate loan demand continues to weaken and banks are not making lending standards more accommodative (panels 3 & 4). Agency CMBS: Overweight Agency CMBS outperformed the duration-equivalent Treasury index by 38 basis points in April, bringing year-to-date excess returns up to +87 bps. The average index option-adjusted spread tightened 4 bps on the month and it currently sits at 33 bps (bottom panel). Though Agency CMBS spreads have completely recovered to their pre-COVID levels, they still look attractive compared to other similarly risky spread products. Stay overweight. Appendix A: Butterfly Strategy Valuations The following tables present the current read-outs from our butterfly spread models. We use these models to identify opportunities to take duration-neutral positions across the Treasury curve. The following two Special Reports explain the models in more detail: US Bond Strategy Special Report, “Bullets, Barbells And Butterflies”, dated July 25, 2017, available at usbs.bcaresearch.com US Bond Strategy Special Report, “More Bullets, Barbells And Butterflies”, dated May 15, 2018, available at usbs.bcaresearch.com Table 4 shows the raw residuals from each model. A positive value indicates that the bullet is cheap relative to the duration-matched barbell. A negative value indicates that the barbell is cheap relative to the bullet. Table 4Butterfly Strategy Valuation: Raw Residuals In Basis Points (As Of April 30TH, 2021)
Fed Won’t Catch Inflation Fever
Fed Won’t Catch Inflation Fever
Table 5 scales the raw residuals in Table 4 by their historical means and standard deviations. This facilitates comparison between the different butterfly spreads. Table 5Butterfly Strategy Valuation: Standardized Residuals (As Of April 30TH, 2021)
Fed Won’t Catch Inflation Fever
Fed Won’t Catch Inflation Fever
Table 6 flips the models on their heads. It shows the change in the slope between the two barbell maturities that must be realized during the next six months to make returns between the bullet and barbell equal. For example, a reading of 47 bps in the 5 over 2/10 cell means that we would only expect the 5-year to outperform the 2/10 if the 2/10 slope steepens by more than 47 bps during the next six months. Otherwise, we would expect the 2/10 barbell to outperform the 5-year bullet. Table 6Discounted Slope Change During Next 6 Months (BPs)
Fed Won’t Catch Inflation Fever
Fed Won’t Catch Inflation Fever
Appendix B: Excess Return Bond Map The Excess Return Bond Map is used to assess the relative risk/reward trade-off between different sectors of the US bond market. It is a purely computational exercise and does not impose any macroeconomic view. The Map’s vertical axis shows 12-month expected excess returns. These are proxied by each sector’s option-adjusted spread. Sectors plotting further toward the top of the Map have higher expected returns and vice-versa. Our novel risk measure called the “Risk Of Losing 100 bps” is shown on the Map’s horizontal axis. To calculate it, we first compute the spread widening required on a 12-month horizon for each sector to lose 100 bps or more relative to a duration-matched position in Treasury securities. Then, we divide that amount of spread widening by each sector’s historical spread volatility. The end result is the number of standard deviations of 12-month spread widening required for each sector to lose 100 bps or more versus a position in Treasuries. Lower risk sectors plot further to the right of the Map, and higher risk sectors plot further to the left. Chart 11Excess Return Bond Map (As Of April 30TH, 2021)
Fed Won’t Catch Inflation Fever
Fed Won’t Catch Inflation Fever
Ryan Swift US Bond Strategist rswift@bcaresearch.com Footnotes 1 Please see US Bond Strategy Weekly Report, “That Uneasy Feeling”, dated March 30, 2021. 2 Please see US Bond Strategy Weekly Report, “A New Conundrum”, dated April 20, 2021. 3 Please see US Bond Strategy Weekly Report, “Searching For Value In Spread Product”, dated January 26, 2021. 4 Please see US Bond Strategy Weekly Report, “Making Money In Municipal Bonds”, dated April 27, 2021. 5 Please see US Bond Strategy Weekly Report, “The Fed Looks Backward While Markets Look Forward”, dated March 23, 2021.
Tech titans (AAPL, MSFT, AMZN, GOOGL & FB) peaked last September at roughly 26% market cap weight in the SPX, and have since fallen 300bps despite four of the five stocks recently hitting new all-time highs (AAPL is the last man standing). This portfolio rebalancing that we first recommended in early September away from tech stocks and into other deep cyclicals remains intact, and while recently the tech titans have stabilized, more pain likely looms. The chart shows that the S&P 5 have been perfectly inversely correlated with the 10-year US Treasury (UST) yield. Keep in mind that bonds typically lead stocks: last early-August the 10-year UST yield troughed near 50bps and a month later the tech titans peaked (top panel). The implication is that when the selloff in the bond market resumes it will serve as a catalyst for a catch down phase in the tech titans. Bottom Line: We remain cyclically neutral the S&P tech sector, underweight the S&P communications services sector and continue to recommend investors rebalance away from the tech titans and into the still undervalued S&P industrials and S&P energy sectors. Also, from a structural perspective, we reiterate our long SPY/short QQQ trade. Chart 1
Are Tech Titans In Trouble?
Are Tech Titans In Trouble?