United States
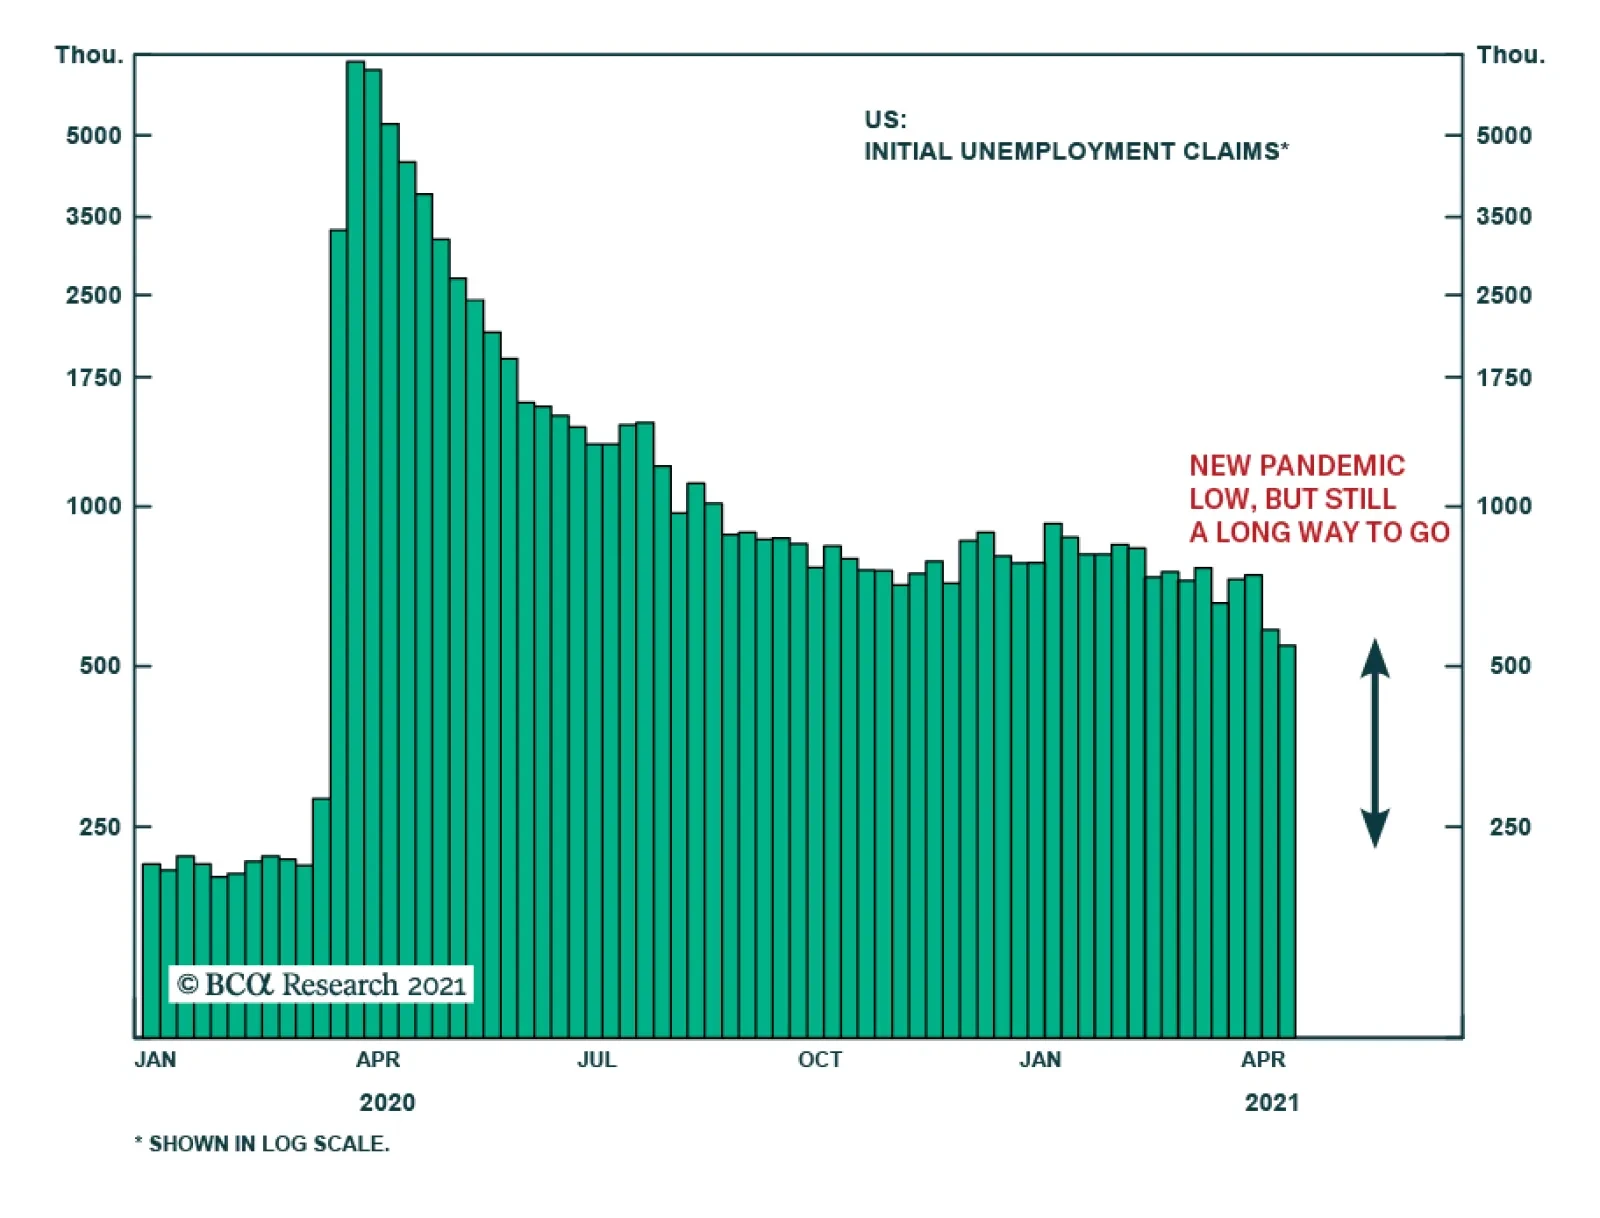
Weekly jobless claims continue to indicate that the US labor market is firming. Initial claims declined to 547 thousand in the week ended April 17. They are down from a revised 586 thousand in the previous week and surprised expectations of an increase to 610…

Pocketing 42% In Combined Gains
Pocketing 42% In Combined Gains
On Tuesday, our 5% rolling stop on the long “Back-To-Work”/short “COIVD-19 Winners” baskets pair trade was triggered. We are obeying the stop and closing the trade for another 20.5% return on top of the previous 21.5%, which brings the total return to 42% in under 9 months. While we are not changing our 2021 overlapping theme of economic reopening that underpinned this trade, we are no longer content with the risk/reward tradeoff, and from a risk management portfolio perspective choose to obey our stop and step aside. Granted, if the share price ratio goes through a meaningful correction catalyzed by the dormant US 10-year Treasury yield, we will reopen this trade once again looking for a new leg higher. Bottom Line: Close the long “Back-To-Work”/short “COIVD-19 Winners” baskets pair trade for a gain of 20.5%, since the second inception, but stay tuned.
While the Fed remains committed to ZIRP for the remainder of the year, already FOMC members started talking about talking about tapering. The next logical step is for tapering to become reality as the year draws to a close or early in 2022. Peering above the 49th parallel, the BoC yesterday opted to taper bond purchases, albeit slightly, and may offer a glimpse of what may also take root in the US in the not too distant future. True, tapering is a good thing as the Central Bank’s (CB) confidence is high that the economy is on a solid footing and no longer needs additional CB support, however if history is an accurate guide, equity investors will have to digest the tapering news once it becomes reality. The chart shows G4 CB liquidity as a 26-week change in the asset side of the balance sheet, and given that some of this excess liquidity seeps over to the US equity market, its withdrawal will likely prove tumultuous. Bottom Line: Near-term caution is warranted on the prospects of the broad equity market that remains fully valued. Please see the next US equity sector Insight.
What To Make Of Waning Global Central Bank Liquidity?
What To Make Of Waning Global Central Bank Liquidity?
The BCA Research Global Asset Allocation (GAA) Forum will take place online on May 18th. We have put together a great lineup of speakers to discuss issues of importance to CIOs and asset allocators. These include the latest thinking on portfolio construction, factor investing, alternatives, and ESG. Our keynote speaker will be Keith Ambachtsheer, founder of KPA Advisory and author of many books on investment management including "The Future of Pension Management: Integrating Design, Governance and Investing" (2016). His presentation will be followed by a panel discussion of top CIOs including Maxime Aucoin of CDPQ, James Davis of OPTrust, and Catherine Ulozas of the Drexel University Endowment. The event is complimentary for all GAA subscribers, who can see a full agenda and register here. Others can sign up here. We hope you can join us on May 18th for what should be a stimulating and informative day of ideas and discussion. Highlights Investors’ hunt for yield over the past few years led them to view leveraged loans as an attractive investment. Characterized by low volatility and attractive risk-adjusted returns, leveraged loans can add value to a portfolio. Leveraged loans tend to outperform their fixed-rate counterparts (for example, high-yield bonds) in an environment of rising rates and an attractive valuation starting point. Only the former criterion is true currently. Risks do exist, however. The increasing share of covenant-lite issues, and rising leverage in the corporate sector are of particular concern. Over the next 6-to-12 months, we do not expect rates to rise substantially, making the asset class somewhat unappealing in the short term. The longer-term outlook is attractive nevertheless, since rates are likely to rise as inflation picks up over the coming years. Feature In today’s environment of ultra-accommodative monetary policy, including low interest rates, and unattractive valuations for fixed-income risk assets, investors have no option but to look beyond conventional fixed-income instruments and dial up their risk appetite. In this Special Report, we run through the mechanics of the leveraged loan market. We analyze historical risk-return characteristics and compare leveraged loans to other assets. We also assess their performance during periods of financial-market stress as well as periods of rising rates and inflation. Finally, we discuss the risks associated with owning leveraged loans. What Are Leveraged Loans? Leveraged loans are a type of syndicated loan made to sub-investment-grade companies. Generally, these firms are highly indebted, with low credit ratings. A syndicated loan is structured, arranged, and administered by one or several commercial or investment banks.1 The majority of these loans are senior secured loans and are based on a floating rate, mostly LIBOR plus a premium (more than 150-200 bps) to account for their riskiness as well as to attract non-bank institutional investors. The interest rates on these loans adjust at regular intervals to reflect changes in short-term interest rates; this constitutes a benefit for investors worried about rising rates. Definitions vary when it comes to categorizing leveraged loans. Some group them based on the borrower’s riskiness and their credit rating. Others consider leverage metrics such as debt-to-capital and debt-to-EBITDA. Other classifications look at the spread at issuance or the purpose of the fund raising, which can include funding mergers and acquisitions (M&A), leveraged buyouts (LBOs), refinancing existing debt, or general funding. Over the past five years, approximately 50% of US leveraged loans issued were for refinancing purposes (Chart 1, panel 1). Within the three categories, LBO financing is deemed the riskiest, and this is reflected in its higher spread (Chart 1, panel 2). The leveraged-loan market became particularly popular in the mid-1980s as M&A activity was soaring (Chart 2). Chart 1Uses Of Leveraged Loans
Is It The Right Time For Leveraged Loans?
Is It The Right Time For Leveraged Loans?
Chart 2The Boom In Corporate Activity In The 1980s Fueled Leveraged Loan Growth
The Boom In Corporate Activity In The 1980s Fueled Leveraged Loan Growth
The Boom In Corporate Activity In The 1980s Fueled Leveraged Loan Growth
There are two common types of financing facilities:2 Term loans: An agreement to borrow a sum of money that is paid back over a certain payment schedule. These loans are mainly provided by non-bank entities. Revolving facilities: A type of loan that can be repeatedly drawn upon and repaid. These loans are mostly originated and held by banks. Estimates for the size of the leveraged-loan market vary depending on which criteria and definitions are used. The size of the leveraged-loan market, following rapid growth since the beginning of the past decade, is estimated to be over $1.2 trillion as of Q2 2020.3 While this represents only a small portion of overall corporate debt (it is only 15% the size of the corporate bond market), the interconnections between key market participants and the role of banks in the market has caught the attention of several regulators such as US Treasury Secretary Janet Yellen, debt investors such as Howard Marks, and international institutions such as the Bank For International Settlements (BIS). The focus of their concerns has been on the declining credit standards for leveraged loans – particularly, the increase in issuance of “covenant-lite” (cov-lite) loans, inconsistent definitions of EBITDA in loan agreements, the growth in use of “EBITDA add backs”,4 and the accuracy of leveraged-loan ratings.5 We discuss some of those concerns in the Risks section. Table 1Risky Loans Are Mainly Held By Non-Bank Entities…
Is It The Right Time For Leveraged Loans?
Is It The Right Time For Leveraged Loans?
Over the past several decades, the role of banks in providing capital to the leveraged loan market has shrunk and has been replaced by non-bank lenders such as mutual funds, hedge funds, insurance companies, and asset managers.6 Data by the Shared National Credit (SNC) program7 shows that non-bank entities in the US now hold close to 83% of all non-investment-grade term loans (Table 1). Moreover, estimates by the Bank of England8 (BoE) show that a quarter of the global stock of leveraged loans (which it estimates at close to $3.4 trillion) is held through collateralized loan obligations (CLOs)9 and approximately half is owned by non-bank institutions. In turn, those non-bank institutions hold a significant portion of CLOs – particularly the riskier tranches. This is not to say that banks are not exposed to leveraged loans. But banks predominantly invest in the highest, AAA, tranche of CLOs, and investment-grade loans.10 Riskier-rated loans are held by CLOs, mutual funds, and other lenders such as hedge funds (Chart 3).11 Chart 3…Particularly Those Rated Below BB
Is It The Right Time For Leveraged Loans?
Is It The Right Time For Leveraged Loans?
Historical Risk And Return Chart 4Leveraged Loans' Relative Performance Moves With Interest Rates
Leveraged Loans' Relative Performance Moves With Interest Rates
Leveraged Loans' Relative Performance Moves With Interest Rates
Since 1997, leveraged loans12 have returned an annualized 4.9%, 25 basis points higher than US Treasurys and approximately 100 and 200 basis points less than US investment-grade and high-yield bonds, respectively. They have underperformed US equities by an annualized 400 basis points over the same period. Declining rates over the past two decades are the most likely reason leveraged loans have underperformed their fixed-rate counterparts. The relative performance of leveraged loans to investment-grade bonds has closely tracked the trajectory of Treasury yields (Chart 4). While the case is not as clear for relative performance against high-yield bonds, the trend is similar. However, on a risk-adjusted return basis, due to reduced volatility, leveraged loans did outperform both equities and high-yield corporate bonds (Table 2). We nevertheless think that volatility is likely understated given the elevated kurtosis. The larger negative skew and excess kurtosis could indicate higher probabilities of large negative returns (Chart 5). Table 2Historical Risk-Return Characteristics
Is It The Right Time For Leveraged Loans?
Is It The Right Time For Leveraged Loans?
Chart 5Leveraged Loans' Returns Exhibit High Kurtosis And Negative Skewness
Leveraged Loans' Returns Exhibit High Kurtosis And Negative Skewness
Leveraged Loans' Returns Exhibit High Kurtosis And Negative Skewness
Why Should Investors Consider Leveraged Loans? Chart 6Rising Rates Support Higher Return From Leveraged Loans...
Rising Rates Support Higher Return From Leveraged Loans...
Rising Rates Support Higher Return From Leveraged Loans...
Our US bond strategists have showed that the odds of leveraged loans outperforming fixed-rate high-yield bonds increase when certain criteria are in place – particularly when valuations are tilted in loans’ favor, and Treasury yields are rising.13 Only the latter criterion is true currently. Year-to-date, leveraged loans have returned 2.2%, higher than the -3.2%, -3.4%, 1.6%, and -3.4% from US Treasurys, investment-grade bonds, high-yield bonds, and emerging markets sovereign debt, respectively (Chart 6). During the same period, Treasury yields rose by 65 basis points. We find that periods of rising Treasury yields are associated with increased flows into the asset class (Chart 7). More interestingly, leveraged loans outperform junk bonds when Treasury yields rise faster than what is discounted in the forwards curve over the following 12 months (Chart 8). Chart 7...As Well As Increased Fund Flows
...As Well As Increased Fund Flows
...As Well As Increased Fund Flows
Chart 8Leveraged Loans Will Benefit If Interest Rates Rise By More Than What Is Discounted In The Forward Curve
Leveraged Loans Will Benefit If Interest Rates Rise By More Than What Is Discounted In The Forward Curve
Leveraged Loans Will Benefit If Interest Rates Rise By More Than What Is Discounted In The Forward Curve
This does not seem to be the case today, however, with the 5-year, 1-year forward about 40 basis points higher than the current 5-year Treasury yield. This is in line with our view that rates are unlikely to rise substantially over the next 6-to-12 months. Inflation, beyond a temporary spike over the next few months, should remain subdued, at least until employment is back to a level which would put upward pressure on wages. This is unlikely before 2023. It is also important to consider the potential trajectory of monetary policy as well as changes in long-term yields. The Fed, through its dot plot, is signaling no increase in the Fed Funds Rate before 2024, but the market is becoming worried about inflationary pressures and pricing in an earlier Fed hike. We believe it unlikely that the Fed will raise rates ahead of what the market expects, unless the labor market returns to “maximum employment” over the next 12 months. The yield on leveraged loans has been lower than on high-yield bonds for most of the period we have data for, except early 2020. Given leveraged loans’ senior position in a firm’s capital structure, it makes sense that their yields are lower. Additionally, the sector composition of the two markets plays a role: Leveraged loans are more exposed to the Technology and Communications sectors and have a limited allocation (averaging 1% over the past seven years) to the Energy sector, unlike high-yield, fixed-rate bonds (where the weight of Energy has averaged 13%) (Chart 9). This was mostly evident when the yield differential collapsed to below -3% during the 2014/2015 oil crash (Chart 10). Chart 9Leveraged Loans’ Sector Weightings
Is It The Right Time For Leveraged Loans?
Is It The Right Time For Leveraged Loans?
Chart 10Loan Spreads Are Not Looking Attractive
Loan Spreads Are Not Looking Attractive
Loan Spreads Are Not Looking Attractive
Chart 11Recent Investor Demand Pushed Up Leveraged Loan Prices
Recent Investor Demand Pushed Up Leveraged Loan Prices
Recent Investor Demand Pushed Up Leveraged Loan Prices
The yield differential has, however, been trending upwards since then, and at current prices, upside may be limited. The recent surge in investor demand has pushed down yields on newly issued leveraged loans, moving the average bid price of leveraged loans above its pre-pandemic high (Chart 11). In the next section, we analyze how leveraged loans have behaved during recessions and other periods of financial market stress. Financial Market Stress Performance In Crises Given the index’s short history, we are able to cover only the past three recessions (the dot-com bubble bust, the Global Financial Crisis (GFC), and the COVID-19 recession). We also look at the 2013 Taper Tantrum and the 2014/2015 oil price shock. In all cases, leveraged loans fell and subsequently recovered along with other fixed-income asset classes. The Taper Tantrum was the most favorable for leveraged loans: 10-year Treasury yields rose by 100 basis points over four months (Chart 12). Table 3 shows that periods of rising rates are a better environment for leveraged loans than those of declining rates. We also looked at a period of Fed tightening and easing cycles – although the timing of easing cycles overlaps with, recessions, dragging down the performance of leveraged loans. We also assess the impact of inflation on leveraged loans using the framework from our Special Report on inflation hedging,14 which decomposed inflation into four quartiles/regimes: Inflation levels below 2.3%, between 2.3% and 3.3%, between 3.3% and 4.9%, and above 4.9%. We add periods of decreasing inflation to our analysis. We note, however, that there was only one period where inflation was over the 4.9% threshold. Chart 12Leveraged Loans Fared Well In Periods Of Credit- And Sector-Specific Distress
Leveraged Loans Fared Well In Periods Of Credit- And Sector-Specific Distress
Leveraged Loans Fared Well In Periods Of Credit- And Sector-Specific Distress
Table 3Leveraged Loans’ Performance During Different Rate Cycles…
Is It The Right Time For Leveraged Loans?
Is It The Right Time For Leveraged Loans?
Table 4…And Inflation Regimes
Is It The Right Time For Leveraged Loans?
Is It The Right Time For Leveraged Loans?
During periods in the first and second inflation quartiles, leveraged loans, in absolute terms, had the highest average annualized returns, 8.1% and 10% respectively. This makes sense since in those regimes, policy rates are low and bond yields begin to rise given robust growth. Leveraged loans, however, underperformed fixed-rate bonds during those periods. Inflation above 3.3% represents an environment in which the economy begins to overheat and growth to falter. This regime saw leveraged loans outperform high-yield bonds by an annualized 1.5%. Periods of declining inflation also showed moderately positive annualized returns for leveraged loans (Table 4). Risks Chart 13Corporate Health Has Worsened...
Corporate Health Has Worsened...
Corporate Health Has Worsened...
The growth of the leveraged loans market reflects multiple trends but, most importantly, a broad increase in corporate leverage, driven by a decline in interest rates and increasing availability of cheap financing. The debt-to-asset ratio of nonfinancial businesses, a gauge of corporate leverage, is at a 20-year high (Chart 13, panel 1). This raises concerns about the overall health of the corporate sector – particularly firms’ ability to service their debt – since the median interest coverage ratio is near a level last seen during the GFC. This measure is even negative for companies within the 25th percentile, meaning companies in that bucket lack funds to maintain their interest payments (Chart 13, panel 2). Trends in the leveraged loan market paint a similar picture. The share of newly issued loans by the most highly levered firms – those with a debt-to-EBITDA ratio of 6x or higher – has reached new highs, hitting 37% of new loans in Q3 2020 (Chart 14). Chart 14…Even For Leveraged Lending
Is It The Right Time For Leveraged Loans?
Is It The Right Time For Leveraged Loans?
Chart 15Cov-Lite Issuances Make Up Almost 80% Of New Issuances
Is It The Right Time For Leveraged Loans?
Is It The Right Time For Leveraged Loans?
The providers of capital are partly to blame. Even with credit standards deteriorating, firms looking for capital were mostly able to find it. The share of cov-lite structures – loans that lack the protective covenants found in traditional loans – continues to grow and now comprises almost 80% of new issuance (Chart 15). Cov-lite loans typically do not have any maintenance covenants, requirements to maintain certain ratios such as leverage or interest-coverage ratios.15 Instead, they feature incurrence covenants which have to be met only if the issuer wants to take particular actions, such as taking on more debt.16 This loosening of credit terms is mostly a function of increased demand, particularly by CLO buyers and other non-bank institutional investors, in an environment of low yields. Some have even warned that vulnerabilities in the leveraged-loan market could cause disturbance to the overall financial system. Particularly, memories of the GFC and worries about the “originate-to-distribute” model – whereby banks originate loans but retain only a fraction on their balance sheets – have led some observers to suggest this could all lead to a risky expansion of credit, and trigger a new financial crisis. Chart 16Leveraged Loans Have Higher Average Credit Ratings…
Is It The Right Time For Leveraged Loans?
Is It The Right Time For Leveraged Loans?
We do not share this skepticism. Banks’ exposure to leveraged loans is mainly via the highest tranches of CLOs. Banks’ liquidity requirements have increased since the GFC, and therefore contagion should be minimal in the event of problems in the loan market. A recent report by the US Government Accountability Office (GAO) did not find evidence that leveraged lending presented a significant threat to financial stability.17 Additionally, almost all leveraged loans are first lien, they have a senior secured position in the capital structure, higher average credit ratings than high-yield bonds (Chart 16), and lower default rates (Chart 17). Moreover, their five-year average recovery rate of 63% tops the 40% of senior unsecured bonds (Chart 18). Chart 17...Lower Default Rates...
...Lower Default Rates,...
...Lower Default Rates,...
Chart 18...And Higher Recovery Rates Than High-Yield Bonds
...And Higher Recovery Rates Than High-Yield Bonds
...And Higher Recovery Rates Than High-Yield Bonds
Conclusion In a period of ultra-low interest rates and stretched valuations for risk assets, leveraged loans have emerged as an interesting asset class for investors. Due to lower volatility, leveraged loans have historically produced higher risk-adjusted returns than fixed-rate high-yield bonds. However, volatility is likely understated given elevated levels of kurtosis. Historically, rising Treasury yields and an attractive valuation starting-point provided a signal for leveraged loans’ outperformance. Only one of those two criteria are currently in place. In the next 6-to-12 months, we do not believe rates will rise substantially, making this asset class somewhat unattractive in the short term. The longer-run outlook for leveraged loans, however, is attractive. As inflation, and therefore rates, rise over the next two-to-three years, a moderate allocation to leveraged loans might be a useful hedge for investors. Amr Hanafy Senior Analyst amrh@bcaresearch.com Footnotes 1 Please see “LCD Loan Primer – Syndicated Loans: The Market and the Mechanics,” S&P Global Market Intelligence. 2 Please see “Leverage Lending FAQ & Fact Sheet,” SIFMA, February 2019. 3 Please see “Federal Reserve Financial Stability Report,” November 2020. 4 “EBITDA add backs” add back expenses and cost savings to earnings and could inflate the projected capacity of the borrowers to repay their loans. 5 Please see Todd Vermilyea, “Perspectives On Leveraged Lending,” The Loan Syndications and Trading Association 23rd Annual Conference, New York, October 24, 2018. 6 Please see “Global Financial Stability Report: Vulnerabilities in a Maturing Credit Cycle, Chapter 1,” IMF, April 2019. 7 The SNC Program is an interagency program designed to review and assess risk in the largest and most complex credits shared by multiple financial institutions. The SNC Program is governed by an interagency agreement among the three federal bank regulatory agencies - the Board of Governors of the Federal Reserve System (FRB), the Federal Deposit Insurance Corporation (FDIC), and the Office Of the Comptroller Of The Currency (OCC). 8 Please see “Financial Stability Report,” Bank of England, August 2020. 9 CLOs are asset-backed securities issued by a special purpose vehicle which acquire a portfolio of leveraged loans. 10 Please see “Turns Out Leveraged Loans Aren’t a Systemic Risk After All,” Bank Policy Institute, February 8, 2020. 11 Please see Seung Jung Lee, Dan Li, Ralf R. Meisenzahl, and Martin J. Sicilian, “The U.S. Syndicated Term Loan Market: Who holds what and when?”, November 25, 2019. 12 For the purpose of this report, we use the S&P/LSTA Leveraged Loan Index, which tracks the market-weighted performance of US dollar-denominated institutional leveraged loan portfolios. 13 Please see US Bond Strategy Report, “The Price Of Safety,” dated January 27, 2015. 14 Please see Global Asset Allocation Special Report, “Investors’ Guide To Inflation Hedging: How To Invest When Inflation Rises,” dated May 22, 2019. 15 Please see Eric Goodison And Margot Wagner, Paul, Weiss, Rifkind, Wharton & Garrison Llp, “Covenant-Lite Loans: Overview,” August 2019. 16 Please see Scott Essexx, Alexander Ott, Partners Group, “The Current State Of The Leveraged Loan Market: Are There Echoes Of The 2008 Subprime Market?”, March 2019. 17 Please see “Financial Stability: Agencies Have Not Found Leveraged Lending To Significantly Threaten Stability But Remain Cautious Amid Pandemic,” United States Government Accountability Office, December 2020.
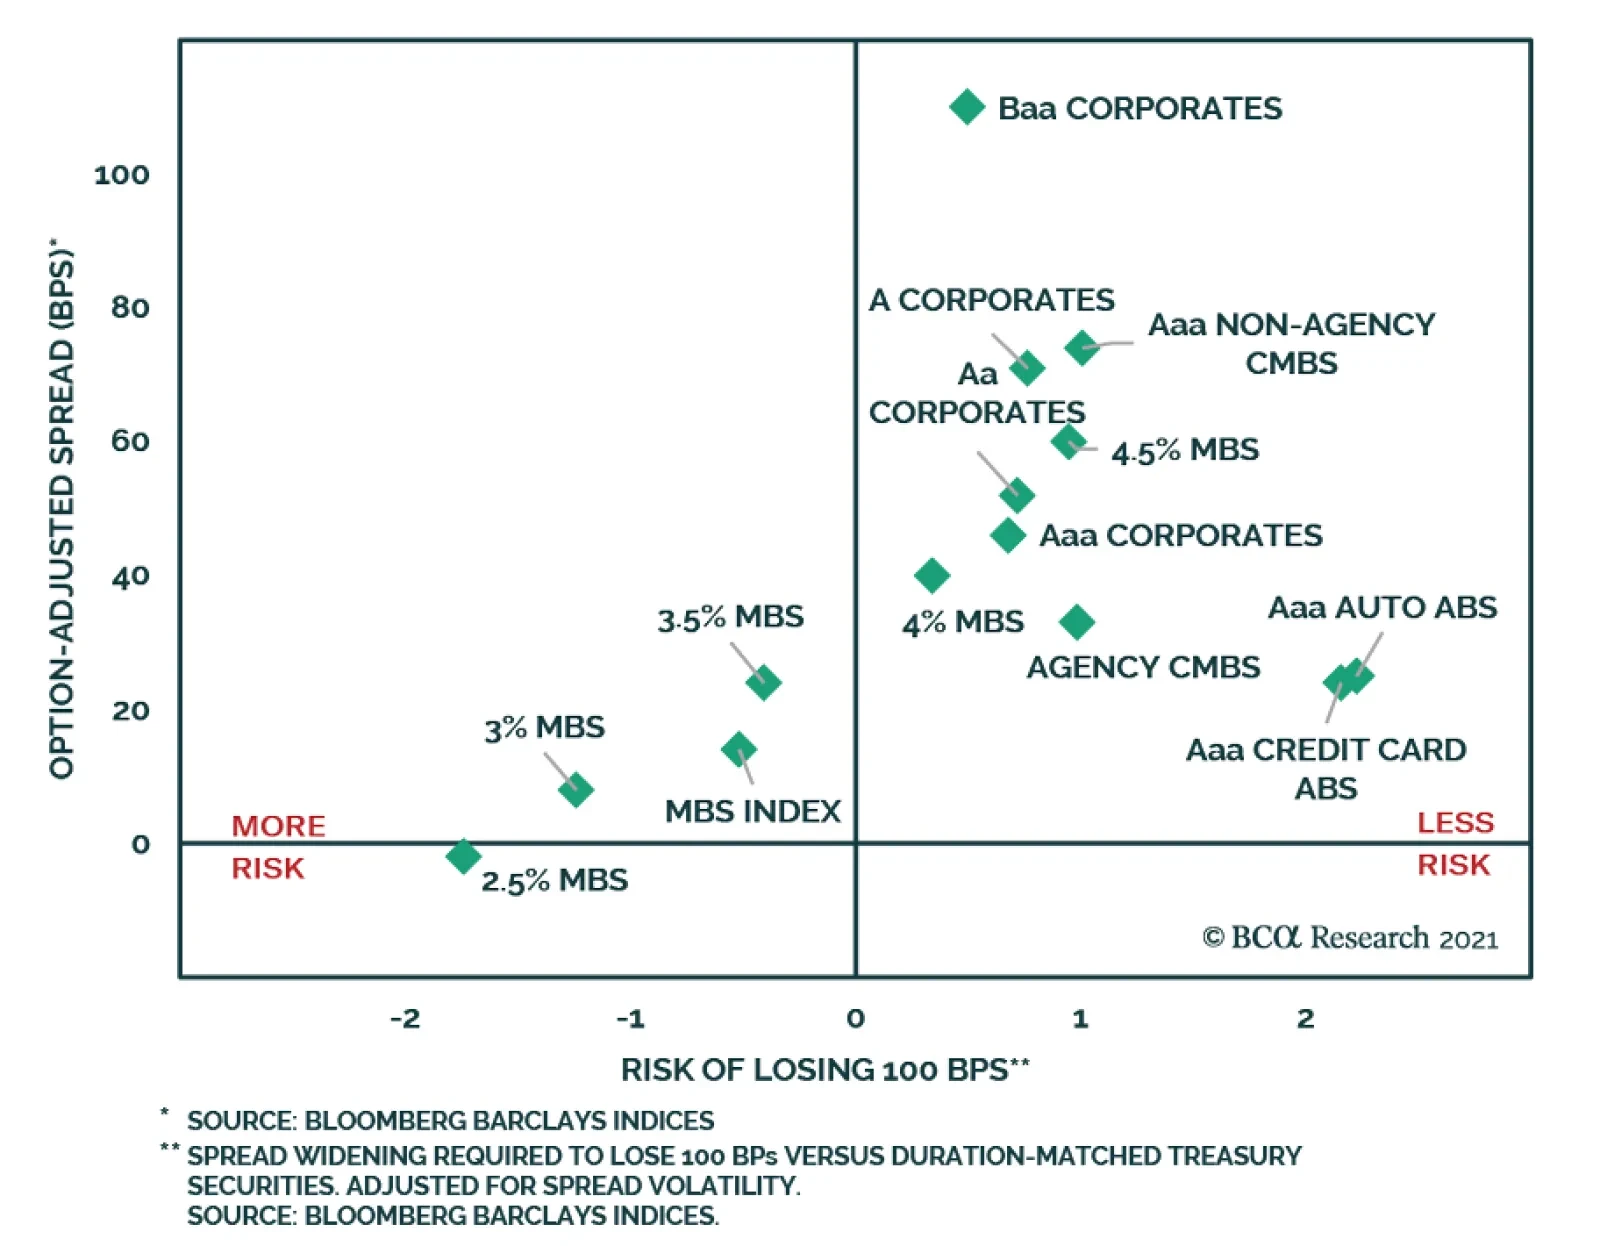
BCA Research’s US Bond Strategy service recommends investors remain underweight MBS within a US bond portfolio, but favor 4% and 4.5% coupons over 2%, 2.5% and 3% coupons within the Agency MBS coupon stack. Agency MBS have not performed well since bond…
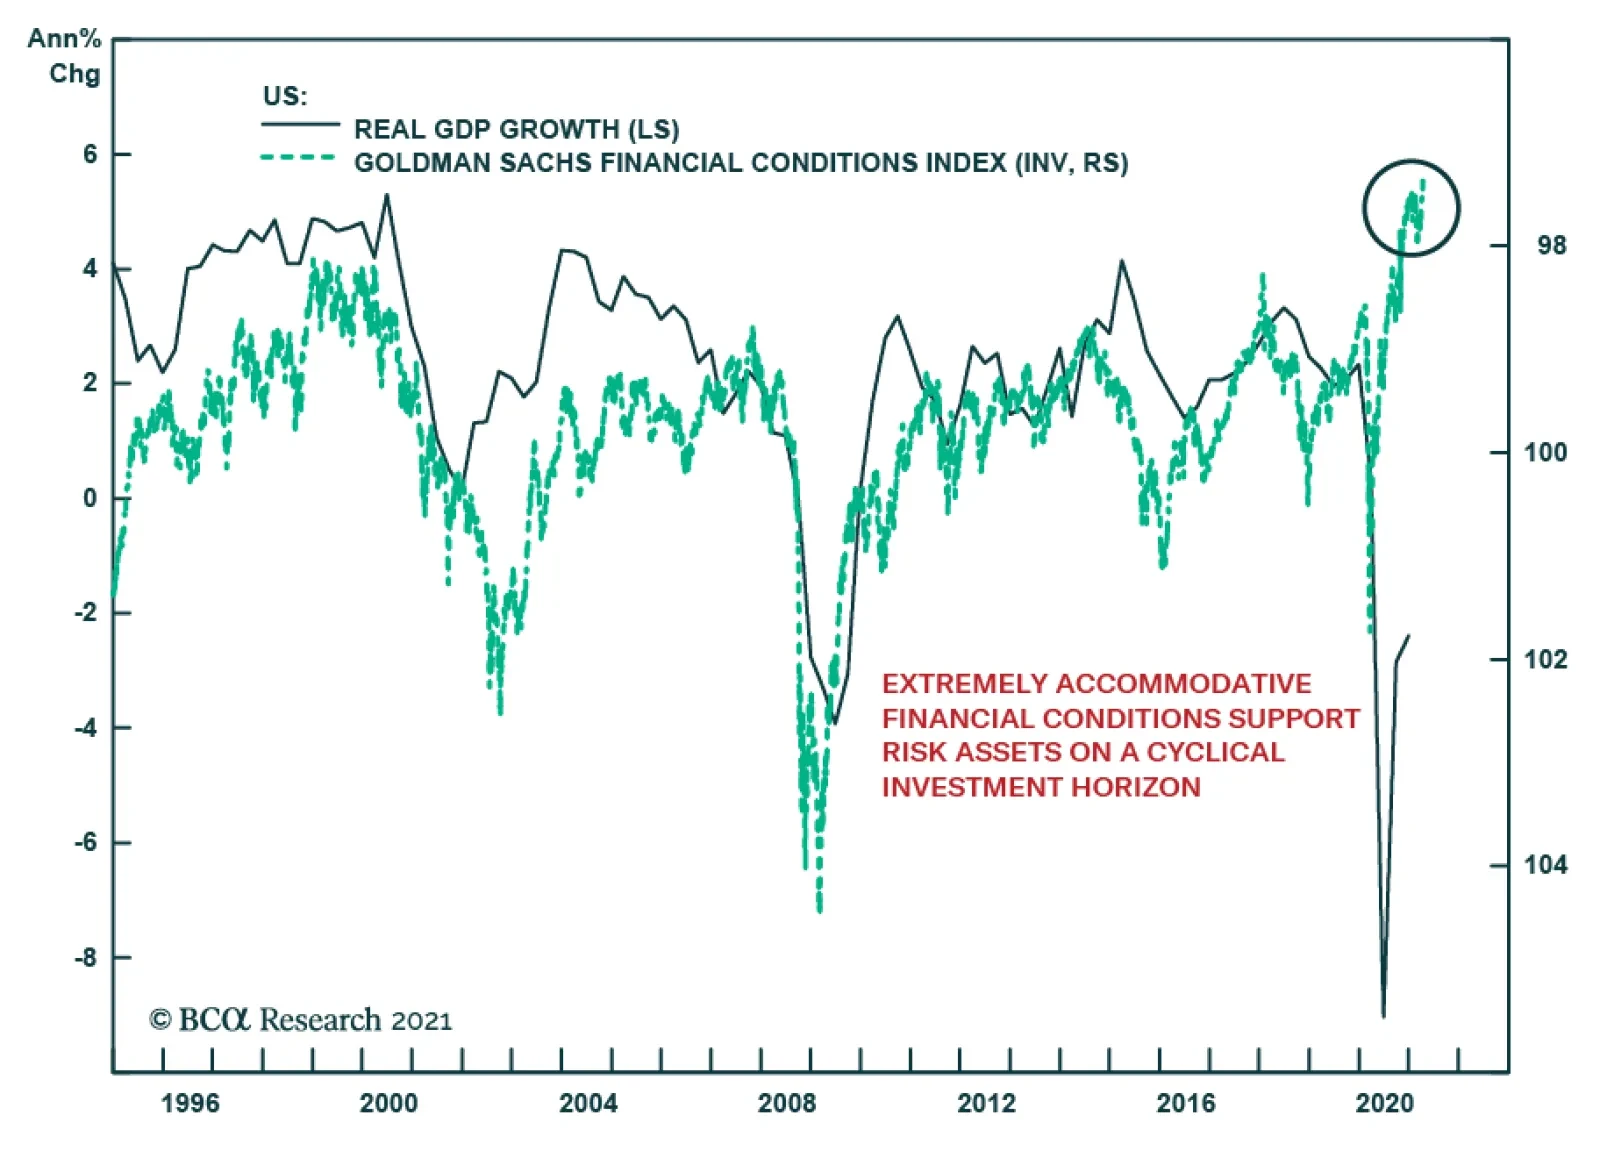
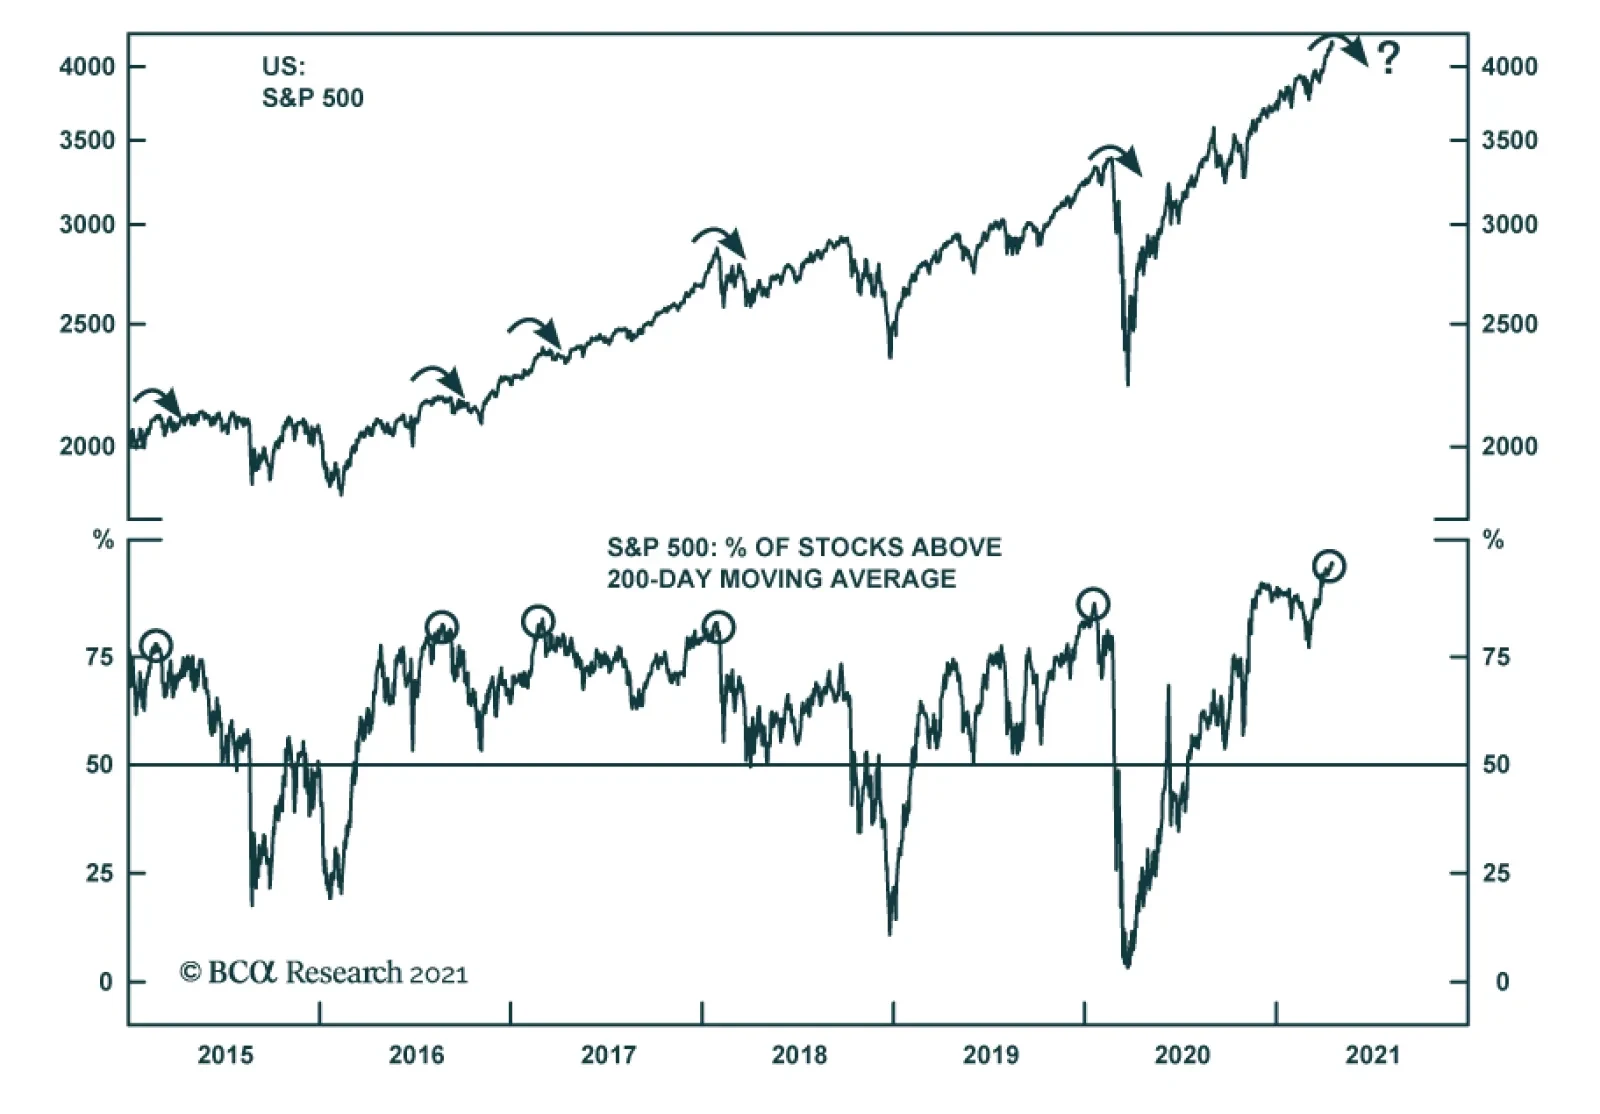
Based on the Goldman Sachs index, financial conditions in the US are the easiest they have been in the history of the series, which dates back to 1981. Our own proprietary measure of US financial conditions is sending a similar message as it stands one…
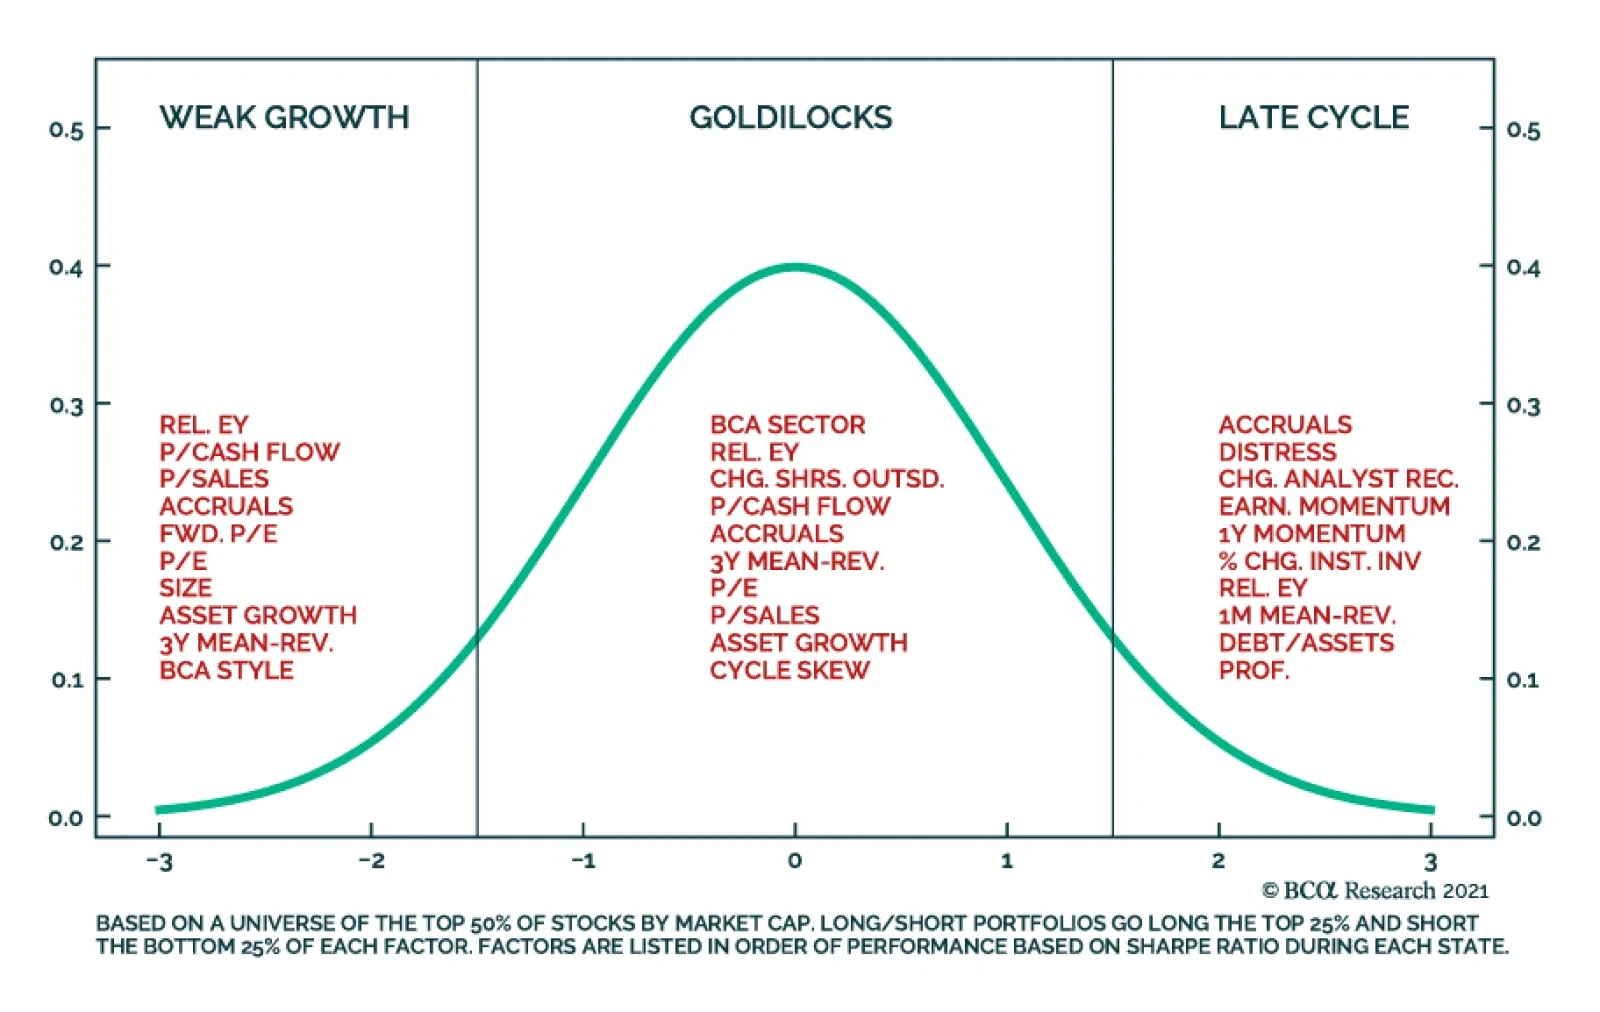
In a recent publication, BCA Research’s US Investment Strategists argued that the US economy is in a “Goldilocks” scenario where economic growth is strong and policy is easy. This state is accompanied by two tail risks: the too-cold left tail where growth is…
Packaging Stocks Are A Buy
Packaging Stocks Are A Buy
Overweight The niche S&P containers & packaging index is often flying below investors’ radars, but an upbeat global macro picture suggests that an overweight stance is warranted. These neglected materials stocks are a play on rising pricing power due to insatiable demand for containerboard and other packaging materials that the pandemic-driven boom in e-commerce has only exacerbated. Already, intermodal rail carloads that gauge the retail industry’s demand and go toe-to-toe with container and packaging manufacturers’ profits, argue for meaningful upside from current levels (middle panel). Similarly, the CASS freight index that tracks the health of different US freight industries is surging and confirms that relative profits will rebound in the back half of the year (bottom panel). Sector-level operating data are also firming. As we showed in this Monday’s Strategy Report, there is a steep divergence between containers & packaging producer prices and employment with the former outpacing the latter. The implication is that a larger fraction of revenues will reach the bottom line and push relative share prices higher. Bottom Line: We reiterate our overweight stance in the S&P containers & packaging index. The ticker symbols for the stocks in this index are: BLBG: S5CONP– WRK, SEE, IP, AVY, BLL, PKG, AMCR.
Global equities tumbled on Tuesday, as the global reflation narrative was once again tested. The S&P 500 slipped nearly 0.7 percent, driven lower by highly cyclical sectors such as energy, financials, consumer discretionary, and industrials.…
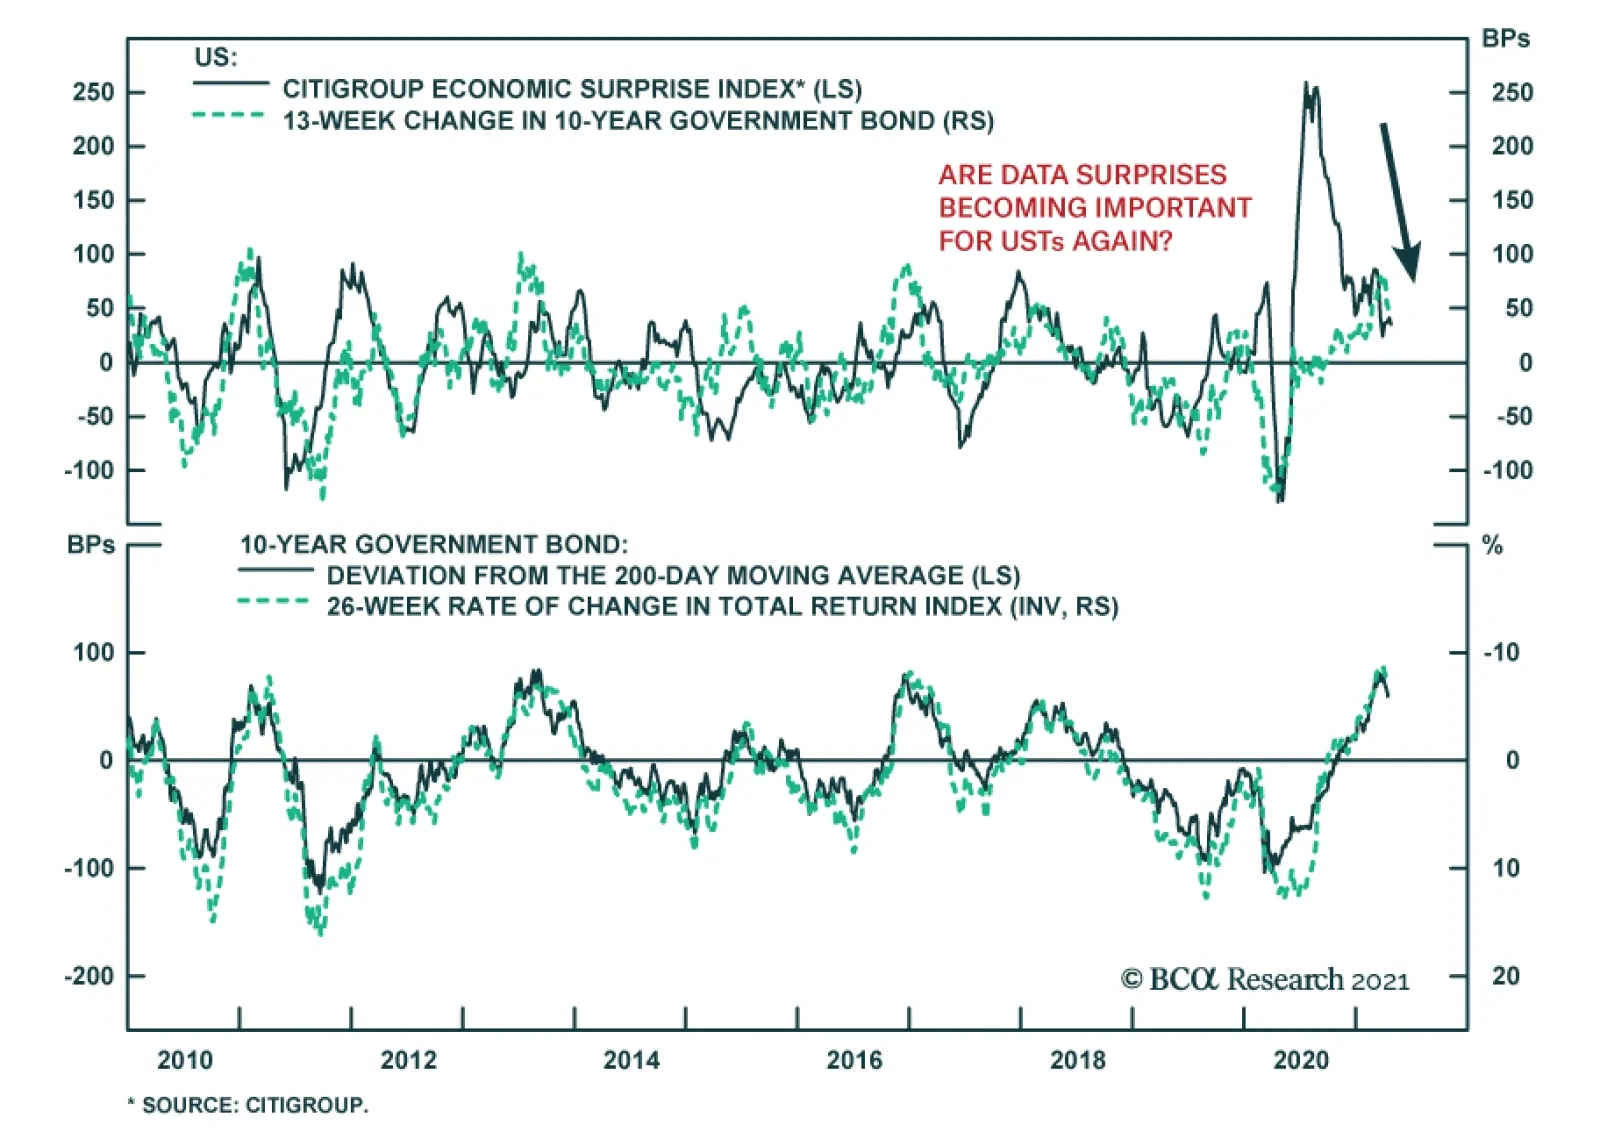
BCA Research’s Global Fixed Income Strategy service concludes that the cyclical rise in yields is not over yet. The overall flow of US economic data has been disappointing versus elevated expectations, as evidenced by the almost uninterrupted decline in…