United States
Ultra-easy monetary policy combined with extremely stimulative fiscal policy have created a fertile environment for stocks to outperform bonds over a 12-month horizon. However, random deflationary shocks along the way are bound to occur, which will cause…

Gradually, Then Suddenly?
Gradually, Then Suddenly?
US equity market euphoria got a jab in the arm yesterday and started to test the resolve of late-comers to the rally. While the self-reinforcing cycle of ultra loose financial conditions along with easy fiscal and monetary policies will continue to underpin markets on a cyclical time horizon, any let up in the near-term in any of these buoyant macro forces can have far reaching effects, especially given lofty valuations and rising complacency. Thus, we remain cautious in the short-term. Not only is this market in a desperate need of a breather given that it once again sits two standard deviations above the 20-month moving average (top panel) – a technical signal that allowed us to caution clients of extreme overbought conditions right before the September 2nd correction – but also a number of other factors are waving yellow flags. First, the US smart money flow index is revealing the fragility hidden beneath the SPX surface. The divergence between this index and the S&P 500 is reminiscent of the 2018 “Volmageddon” correction (third panel). Second, the total US equity call / put ratio is significantly diverging with equity prices, likely as a result of both smart money hedging their longs (second panel) and retail call buying frenzy going on a hiatus. Finally, our US Equity Internal Dynamics Indicator also ticked down of late cementing the argument that, for now, equities are fully priced as we posited in yesterday’s Strategy Report where we updated our SPX dividend discount model (bottom panel). Bottom Line: While we remain cyclically bullish, any mishaps on China’s and/or the Fed’s front will likely serve as a catalyst for a near-term correction.
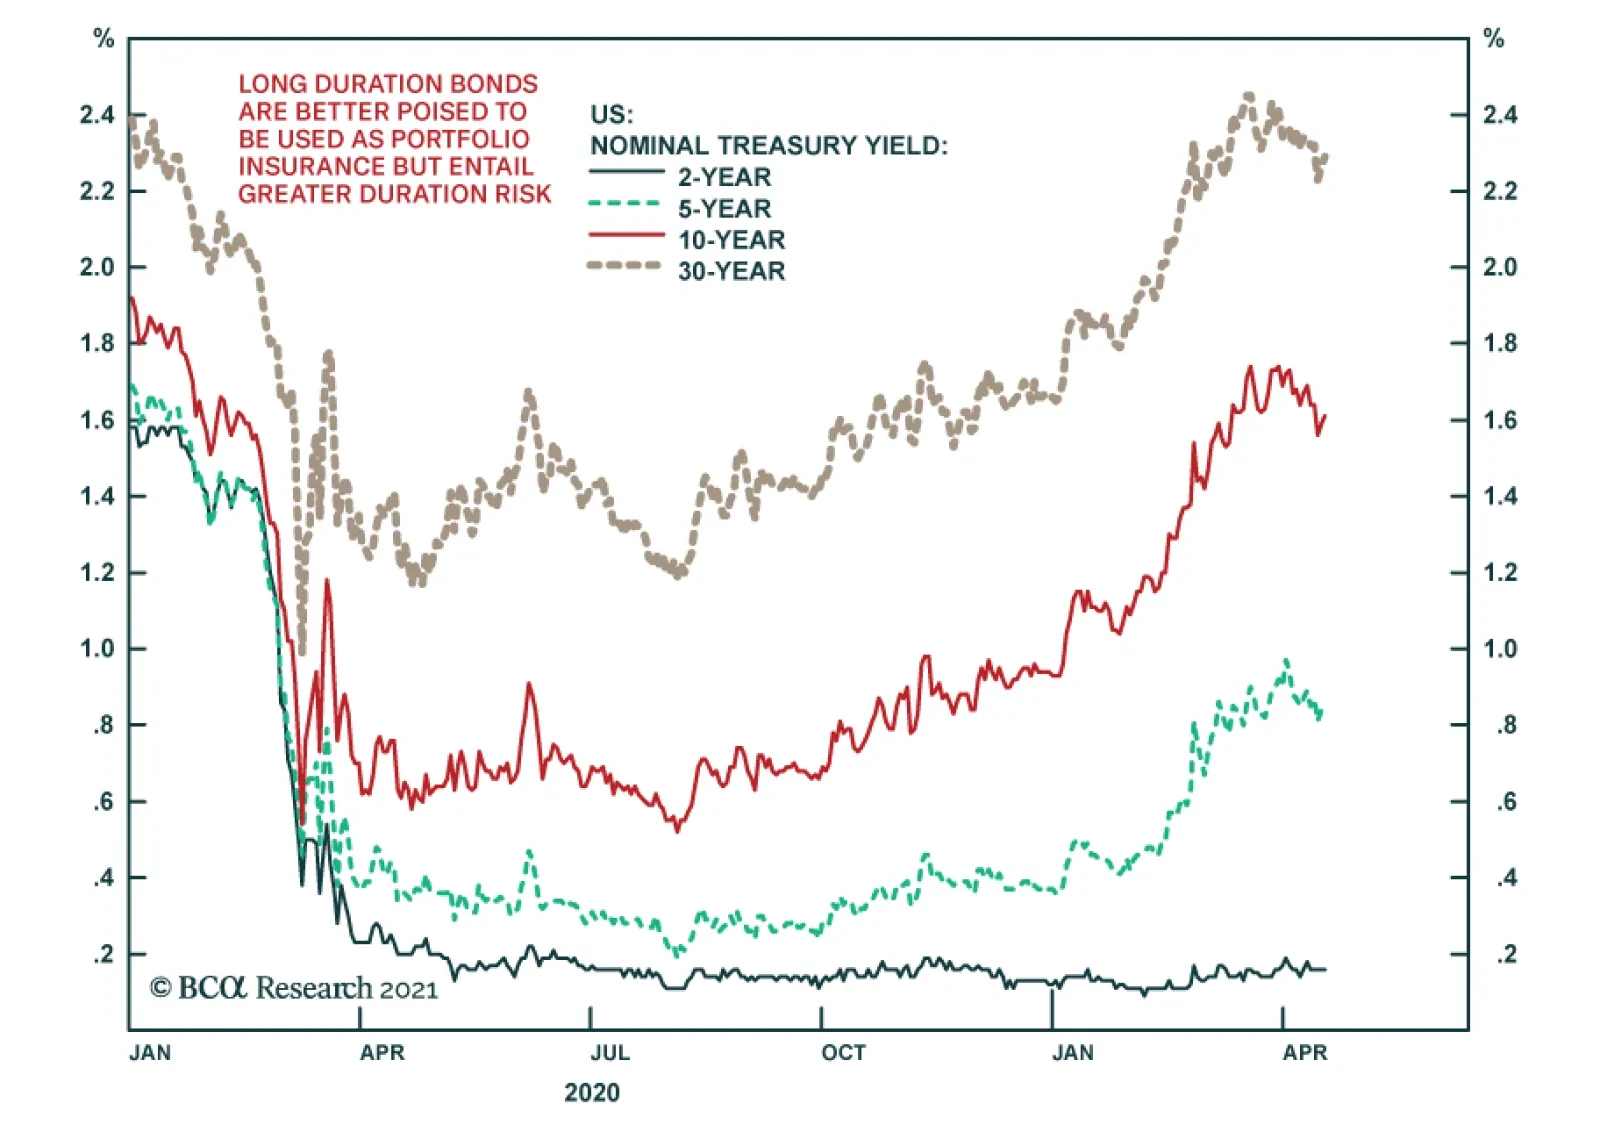
Highlights Duration: The pace of rate hikes currently priced into the market is reasonable. However, we see strong odds that market expectations will move higher in the coming months, the result of continued strong economic data and the Fed starting to talk about tapering its asset purchases. Investors should maintain below-benchmark portfolio duration. MBS: MBS remain unattractive compared to other US spread products. But within an underweight allocation to MBS, an up-in-coupon bias makes sense. Inflation: Year-over-year CPI inflation was pushed higher by base effects in March, but the report also showed evidence of mounting inflationary pressures beyond simple base effects. Feature After a sizeable drop last Thursday, Treasury yields are now significantly off their recent highs. The 10-year Treasury yield peaked at 1.74% on March 31st but ended last week at only 1.59%. What makes the drop puzzling is that yields are down despite a string of very strong US economic data (Chart 1). This recent development bears a resemblance to the famous 2004/05 bond conundrum when Fed Chairman Alan Greenspan struggled to understand why long-maturity Treasury yields were falling even as the Fed lifted short rates.1 Today, investors are also struggling to understand why long-maturity Treasury yields are falling, only this time the “conundrum” is that they are falling in the face of strong economic data. From our perch, both conundrums have the same answer: The market has already discounted a lot of the news. On June 29th, 2004 – the day before the first rate hike of that cycle – the overnight index swap (OIS) curve was priced for 243 bps of Fed rate hikes for the following 12 months. The Fed went on to deliver 200 bps of rate hikes during that timeframe, slightly less than the market expected. In that environment it is entirely consistent that bond yields should fall (Chart 2). Chart 1Yields Down On Strong Data
Yields Down On Strong Data
Yields Down On Strong Data
Chart 2The 2004/05 Bond Conundrum
The 2004/05 Bond Conundrum
The 2004/05 Bond Conundrum
Today, the OIS curve is priced for the Fed to lift rates off the zero bound in December 2022 and for a total of 86 bps of rate hikes by the end of 2023 (Chart 3). Given the Fed’s new Average Inflation Targeting regime, this sort of rate hike cycle will only be achieved if there is a very strong US economic recovery. The incoming US data are so far confirming that narrative but haven’t been strong enough to move rate expectations even higher. Chart 3Market Priced For December 2022 Liftoff
Market Priced For December 2022 Liftoff
Market Priced For December 2022 Liftoff
As we wrote in last week’s report, we think that the market’s current rate hike expectations look reasonable.2 However, we see a meaningful risk that they could move higher in the coming months as the rapid US economic recovery continues and the Fed starts to back away from its extremely dovish messaging. Chart 4US Will Hit 75% Vaccination Well Before September
US Will Hit 75% Vaccination Well Before September
US Will Hit 75% Vaccination Well Before September
For example, Fed Chair Jay Powell has said repeatedly that it is too soon to talk about tapering the Fed’s asset purchases. We worry, however, that this tone might be giving investors a false sense of security. If the economic recovery continues at its current pace, we fully expect the Fed to start talking about tapering this year and to begin the process either by the end of 2021 or in early 2022. Last week, St. Louis Fed President Jim Bullard said he would be comfortable starting discussions about tapering when 75%-80% of the US population has been vaccinated. We estimate that if vaccinations continue at a linear pace, we will hit 75% vaccination by September (Chart 4). Given the exponential trend in vaccinations so far, we are likely to reach 75% well before September. The bottom line is that we see the pace of rate hikes currently priced into the market as reasonable. However, we also see strong odds that market expectations will move higher in the coming months, the result of continued strong economic data and the Fed starting to talk about tapering its asset purchases. Investors should maintain below-benchmark portfolio duration. MBS: Stay Up In Coupon Unsurprisingly, the reflation trade has been beneficial for risk assets. Within US fixed income, spread products have generally outperformed Treasuries since bond yields bottomed last August. However, certain spread sectors have fared better than others. Agency Mortgage-Backed Securities, for example, have not done that well. Conventional 30-year Agency MBS have only outperformed a duration-matched position in Treasury securities by 73 bps since bond yields bottomed on August 4th, 2020 (Chart 5). This compares to 446 bps of outperformance for Aaa-rated corporates, 342 bps of outperformance for Aa-rated corporates (Chart 5, panel 2) and 232 bps of outperformance for Agency CMBS (Chart 5, panel 3). Only notoriously low-risk Aaa-rated consumer ABS have delivered less outperformance than Agency MBS (Chart 5, bottom panel). While Agency MBS have not performed well overall, certain segments of the coupon stack have delivered decent excess returns. Specifically, higher coupon MBS have performed much better than low coupon MBS during the recent back-up in yields. Since last August, 4% coupon MBS have outperformed duration-matched Treasuries by 176 bps and 4.5% coupons have outperformed by 257 bps. Meanwhile, 2.5% coupons have underperformed by 10 bps and 3% coupons have underperformed by 15 bps (Chart 6). Chart 5Spread Product Performance Since Trough In Bond Yields
Spread Product Performance Since Trough In Bond Yields
Spread Product Performance Since Trough In Bond Yields
Chart 6Favor Premium Coupons In Rising Rate Environment
Favor Premium Coupons In Rising Rate Environment
Favor Premium Coupons In Rising Rate Environment
The divergent performance between high and low coupons is easily explained by the risk characteristics of those bonds. Looking at the difference between the 2.5% and 4% coupons, for example, we see that the 2.5% coupons have significantly higher duration and significantly lower convexity (Chart 6, bottom 2 panels). The higher duration means that rising yields hurt 2.5% coupons more and the lower convexity means that rising yields will cause the gap between 2.5% coupon duration and 4% coupon duration to widen further. In short, a rising yield environment is terrible for low-coupon MBS. Conversely, high duration and low convexity are desirable attributes in a falling yield environment. If bond yields fall meaningfully going forward, then low-coupon MBS will outperform the high coupons. Chart 7A shows how option-adjusted spread (OAS) varies with duration across the conventional 30-year Agency MBS coupon stack. We see that the lowest coupons have the highest durations and the lowest OAS. Premium coupons have low durations and high OAS. Chart 7AAgency MBS 30-Year Conventional Coupon Stack: OAS vs. Duration
A New Conundrum
A New Conundrum
Chart 7B shows how OAS varies with convexity across the coupon stack. Here we see that the 2%, 2.5% and 3% coupons have the most negative convexities. This makes sense as those coupons are closest to the current mortgage rate of 3.04%. A further increase in the mortgage rate would make those coupons less likely to refinance, causing durations to extend meaningfully. Conversely, a drop in the mortgage rate would lead to greater refinancings for those coupons, causing durations to shorten. Notice that 1.5% coupon MBS have relatively high convexity. This is because refinancing is already unattractive for those bonds, and the duration of the 1.5% index has already extended. Chart 7BAgency MBS 30-Year Conventional Coupon Stack: OAS vs. Convexity
A New Conundrum
A New Conundrum
Given our view that US Treasury yields will be flat-to-higher for the next 6-12 months, we recommend an up-in-coupon bias within Agency MBS. Specifically, the 2%, 2.5% and 3% coupons have the most scope for duration extension in a rising yield environment and should be avoided. The 4% and 4.5% coupons, on the other hand, are less negatively convex and are better able to weather the storm of rising bond yields. In a flat bond yield environment, the best performing coupons are likely to be those with the widest OAS. This makes the 4% and 4.5% coupons look much more attractive than the 1.5% coupons, even though they have similar convexities. Overall, we recommend owning the 4% and 4.5% coupons within the conventional 30-year Agency MBS coupon stack and avoiding the 2%, 2.5% and 3% coupons. One final point worth making is that we also continue to recommend an underweight allocation to MBS within a US bond portfolio. That is, though higher coupon MBS look better than the low coupons, the entire sector looks unattractive compared to alternatives like consumer ABS, Agency CMBS and even investment grade corporate bonds. Chart 8 shows a version of our Excess Return Bond Map, a visual guide that is useful for quickly assessing the risk/reward trade-off between different US spread products.3 The Map shows OAS as a measure of expected return on the Y-axis, and a proprietary risk measure called the “Risk Of Losing 100 Bps” on the X-axis. A higher number on the X-axis indicates less risk of losing 100 bps and vice-versa. Chart 8Excess Return Bond Map
A New Conundrum
A New Conundrum
Our Bond Map makes it clear that only 4% and 4.5% coupon MBS come close to offering a risk/reward balance that is comparable to other spread sectors. MBS coupons below 4% offer far too little expected return given the amount of risk. Bottom Line: Remain underweight MBS within a US bond portfolio, but favor 4% and 4.5% coupons over 2%, 2.5% and 3% coupons within the Agency MBS coupon stack. March CPI More Than A Base Effect It was well known heading into last week’s March CPI release that the year-over-year inflation number was going to be very strong. This is due to base effects that will persist through to the end of May. That is, 12-month inflation is bound to rise as the negative monthly inflation prints from March, April and May 2020 fall out of the 12-month rolling sample. Year-over-year inflation numbers did indeed rise sharply in March (Chart 9). 12-month headline CPI jumped from 1.68% to 2.64% and 12-month core CPI increased from 1.28% to 1.65%. Base effects exert less influence over the trimmed mean CPI, and that index rose only from 2.04% to 2.12%. The gap between 12-month core CPI and 12-month trimmed mean CPI remains wide, but it should close by May when the impact from last year’s base effects is exhausted (Chart 9, bottom panel). Chart 9Annual Inflation
Annual Inflation
Annual Inflation
Chart 10Monthly Inflation
Monthly Inflation
Monthly Inflation
But base effects were only part of the story last week. Month-over-month inflation also came in very strong for the headline, core and trimmed mean measures. Headline CPI rose 0.62% in March, core CPI rose 0.34% and the trimmed mean rose 0.24% (Chart 10). To put those numbers in context, if those monthly prints are repeated in April and May, 12-month headline CPI will rise to 4.75% by May and 12-month core CPI will rise to 2.79%. Even if we assume more typical 0.15% inflation rates for April and May, we would still expect 12-month headline CPI to reach 3.77% by May and 12-month core CPI to reach 2.41%. Overall, the message from March’s CPI report is that the economy is showing signs of mounting inflationary pressures beyond simple base effects. We have previously written about the ample evidence of bottlenecks in both the goods and service sectors, and we now appear to be seeing those bottlenecks show up in the price data.4 There’s little doubt that 12-month inflation will fall somewhat between May and the end of the year. However, we anticipate that inflation will still be close to the Fed’s target by the end of 2021. This will certainly be the case if the monthly inflation figures remain consistent with March’s print. The main investment implication from this view is that low inflation will not prevent the Fed from tapering its asset purchases either late this year or early next year, and it also won’t prevent the Fed from lifting rates in 2022. Footnotes 1 Greenspan’s remarks: https://www.federalreserve.gov/boarddocs/hh/2005/february/testimony.htm 2 Please see US Bond Strategy Weekly Report, “Overshoot Territory”, dated April 13, 2021, available at usbs.bcaresearch.com 3 For more details on the Bond Map please see page 16 of US Bond Strategy Portfolio Allocation Summary, “It’s A Boom!”, dated April 6, 2021, available at usbs.bcaresearch.com 4 Please see US Bond Strategy Weekly Report, “Limit Rate Risk, Load Up On Credit”, dated March 16, 2021, available at usbs.bcaresearch.com Ryan Swift US Bond Strategist rswift@bcaresearch.com Fixed Income Sector Performance Recommended Portfolio Specification
Highlights Chart of the WeekThe Bond Bear Mantle Being Passed To Canada?
The Bond Bear Mantle Being Passed To Canada?
The Bond Bear Mantle Being Passed To Canada?
US Treasuries: The steady climb of US bond yields has left longer-maturity Treasuries in an oversold position. However, underlying growth and inflation momentum remains bond bearish and the Fed is likely to begin preparing the market later this year for a tapering of asset purchases in 2022. Maintain a medium-term defensive posture towards US Treasuries (below-benchmark duration and an underweight country allocation). Canada: The Canadian economy is gaining significant positive momentum, with an increased pace of vaccinations boosting optimism despite a third wave of COVID-19. We now see a growing risk of the Bank of Canada shifting to a less dovish policy stance sometime in the next few months, led by a tapering of its bond buying – perhaps even before the Fed does the same (Chart of the Week). Downgrade Canadian government bonds to underweight in global fixed income portfolios. US Treasuries: The Pause That Refreshes Chart 2UST Yield Uptrend Has Paused
UST Yield Uptrend Has Paused
UST Yield Uptrend Has Paused
After leading the global government bond market selloff over the past several months, US Treasury yields have calmed down of late. The 10-year Treasury yield is down 14bps from the most recent peak of 1.74% reached March 31, while the 30-year Treasury yield is down 16bps from the peak of 2.45% reached on March 18. These moves have been concentrated in the real yield component, with inflation breakevens stable, as the 10yr and 30yr TIPS yields are down -15bps and -20bps, respectively, since the dates of those peaks in nominal yields (Chart 2). The drift lower in US yields has occurred in the face of an explosive surge in US economic data. Retail sales rose +9.8% in March compared to February and a staggering +27.7% on a year-over-year basis. The Fed’s regional manufacturing surveys showed very robust results for April, with the New York Empire State index hitting the highest level since October 2017 and the Philadelphia Fed headline index surging to a level last seen in 1973. This follows the very strong payrolls and ISM data for March that came out in early April. Yet the US economic data is not unanimously positive. The latest readings from the University of Michigan consumer confidence and NFIB small business optimism surveys both remained well below pre-pandemic peaks (Chart 3). Annual core CPI inflation only inched up 0.2 percentage points in March to 1.6%, a tepid move compared to the base effect driven surge that took year-over-year headline CPI inflation from 1.7% in February to 2.6%. Chart 3Some Mixed Messages From Recent US Data
Some Mixed Messages From Recent US Data
Some Mixed Messages From Recent US Data
Chart 4Fewer Positive US Data Surprises
Fewer Positive US Data Surprises
Fewer Positive US Data Surprises
The overall flow of US economic data has been disappointing versus elevated expectations, as evidenced by the almost uninterrupted decline in the Citigroup US data surprise index since peaking in July of 2020 (Chart 4). This indicator reliably correlated to the momentum of US Treasury yields prior to the COVID-19 outbreak and now, given the bullish growth combination of vaccine optimism and fiscal stimulus, the bond market’s focus is returning to how US data evolves versus expectations - and what that means for the Fed’s future moves on monetary policy. The most senior leadership at the Fed continues to send a consistent message on policy, with no rate hikes expected before 2024 and no hints at when the tapering of quantitative easing (QE) could begin. Yet some Fed officials have started to be a bit more vocal about their comfort level with the current accommodative policy stance and the associated risks to financial stability and inflation. Last week, Dallas Fed President Robert Kaplan noted that he would like to see the Fed begin to withdraw its support for the economy “at the earliest opportunity”. St. Louis Fed President James Bullard was even more specific, noting that once the share of vaccinated Americans reaches “herd immunity” levels of 75-80%, it will be time for the Fed to debate tapering QE. At the moment, however, there is no need for the Fed to move preemptively. Our Fed Monitor - comprised of economic, inflation and financial market data that would signal pressure for the Fed to ease or tighten policy – is at a neutral level (Chart 5). Our 12-month Fed discounter, which measures the change in interest rates over the next year that is priced into the US overnight index swap (OIS) curve, is at 7bps, consistent with a stand-pat Fed. The latest read this month from the New York Fed’s Survey of Primary Dealers (and Survey of Market Participants) showed no change in the median longer-run expectation for the fed funds rate of 2.25% that has prevailed over the past year (middle panel) – despite a sharp recovery in US growth expectations. Chart 5UST Valuations A Bit Stretched
UST Valuations A Bit Stretched
UST Valuations A Bit Stretched
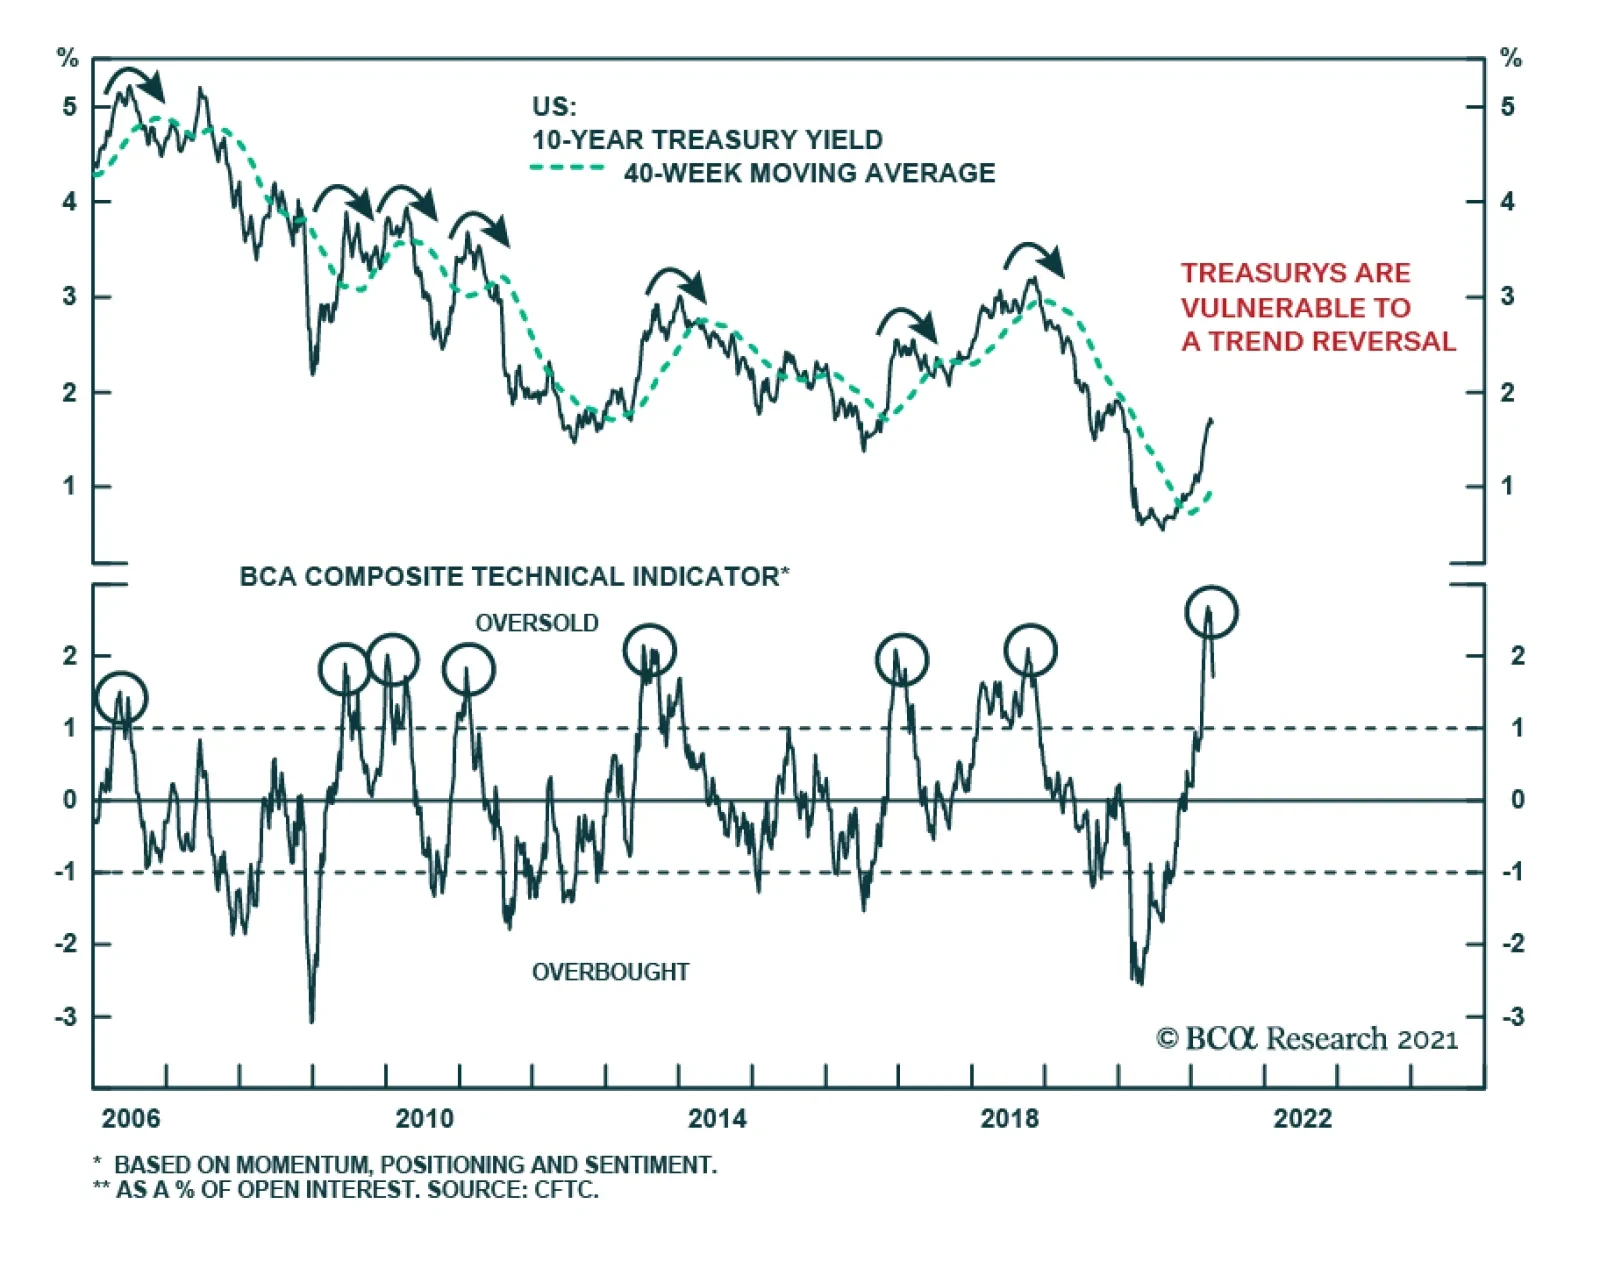
The market pricing of the Fed’s next move is still relatively benign, with liftoff not expected until February 2023. This suggests that a pause in the trend of rising Treasury yields was essentially the market getting a bit ahead of itself in pricing in higher longer-term yields. This can be seen by looking at various valuation measures. For example, the 5-year/5-year forward Treasury yield now sits at 2.4%, which is at the high end of the range of longer-run fed funds rate expectations from the Primary Dealer survey. Also, various measures of the term premium on 10-year Treasury yields have returned to the above-zero levels last seen during the Fed’s 2016-2018 rate hiking cycle – even with the Fed not signaling any need to tighten policy in response to rising inflation expectations. Despite these signs of stretched near-term UST valuation, there is still no sign of major global bond investors being comfortable with increasing exposure to Treasuries. For example, despite yields on 10-year Treasuries (hedged into euros and yen) looking historically attractive compared to the near-zero yields on JGBs and sub-zero yields on German Bunds, the US Treasury’s capital flow data shows that foreign investors remain net sellers of Treasuries (Chart 6). It is possible that those foreign buyers need more evidence of a sustained decrease in US bond volatility before moving money into US Treasuries, where duration losses from higher US yields could wipe out the yield pickup from moving into US bonds. While valuations are a bit stretched for Treasuries, technicals appear very oversold. Both the deviation of the 10-year Treasury yield from its 200-day moving average, and the 6-month rate of change of the Bloomberg Barclays US Treasury total return index, are at levels seen only four previous times since 2010 (Chart 7). The JP Morgan client duration positioning surveys and the Market Vane Treasury sentiment index are also approaching post-2010 bearish extremes. It should be noted that both of those measures reached even more bearish extremes during the latter half of the Fed’s 2026-2018 tightening cycle, so there is potential for Treasury sentiment to become even more bearish once the Fed starts to tighten monetary policy – a scenario looking increasingly likely over the next 6-12 months. Chart 6No Foreign Bid For USTs (Yet)
No Foreign Bid For USTs (Yet)
No Foreign Bid For USTs (Yet)
Chart 7USTs Are Technically Oversold
USTs Are Technically Oversold
USTs Are Technically Oversold
We continue to expect a robust US economy and rising inflation to force the Fed to begin preparing the market in the latter half of 2021 for QE tapering in 2022, with the first rate hike of the next tightening cycle coming in late 2022. As that outcome appears largely consistent with current market pricing, amid oversold technicals, it is likely that Treasury yields will continue to move sideways over at least the next few weeks. Yet there is little to suggest that yields have peaked and are about to enter a new downtrend, given the accelerating pace of US vaccinations that is boosting optimism on an eventual end to the US leg of the pandemic. Stay defensive on US Treasury exposure, as the cyclical rise in yields is not over yet. Bottom Line: The steady climb of US bond yields has left longer-maturity Treasuries in an oversold position. However, underlying growth and inflation momentum remain bond bearish and the Fed is likely to begin preparing the market later this year for tapering of asset purchases in 2022. Maintain a medium-term defensive posture towards US Treasuries (below-benchmark duration and an underweight country allocation). Canada: Downgrade To Underweight In a Special Report published back in February along with our colleagues at BCA Foreign Exchange Strategy, we outlined the case for placing Canadian government debt on “downgrade watch” in global fixed income portfolios.1 We expected Canadian bond yields to continue rising along with the rise in global bond yields and, hence, we maintained our below-benchmark recommended duration exposure within Canada. Chart 8Canada: A High Beta Bond Market Once Again
Canada: A High Beta Bond Market Once Again
Canada: A High Beta Bond Market Once Again
However, we concluded that it was too soon to shift to a full-blown underweight stance on Canadian government bonds with COVID-19 cases still raging through the country, the vaccination program off to a very slow start, and the Bank of Canada (BoC)’s QE program preventing Canadian bonds from returning to their usual “high-beta” status within developed economy bond markets. It now appears that we were too cautious on that front. Canadian government bonds have been one of the worst performing markets year-to-date within the Bloomberg Barclays Global Government bond index, delivering a local currency return of –4.1% - worse than the -3.5% return earned on US Treasuries so far in 2021.2 It is clear that the Canadian government bonds are once again a market more sensitive to global interest rate moves (Chart 8). In that February Special Report, we laid out three factors that could prompt the BoC to move to a less dovish, and more bond bearish, monetary policy stance faster than we expected. Much of that list has already started to come to fruition. 1) Good News On The Vaccine Rollout Sadly, Canada is suffering a third wave of COVID-19 cases that has resulted in the nation’s most populous province, Ontario, implementing the harshest lockdown yet seen during the pandemic. Yet the pace of vaccinations has also been rising with the share of Canadians receiving at least one jab is now 21% (Chart 9) - higher than that of the overall European Union (EU). Canada is now administering more daily vaccinations than both the UK and EU. The quickening pace of vaccinations is already providing a major lift to Canadian economic confidence. The Bloomberg Nanos consumer confidence index is at an all-time high (Chart 10), while the BoC’s Business Outlook Survey for the spring of 2021 was incredibly solid. Two-thirds of firms in that survey expect sales to exceed pre-pandemic levels, even with the latest upturn in COVID-19 cases. Chart 9Canadian Vaccine Rollout Improving
Some Bond Bearish Tales From Both Sides Of The 49th Parallel
Some Bond Bearish Tales From Both Sides Of The 49th Parallel
Chart 10Booming Optimism
Booming Optimism
Booming Optimism
The BoC’s Q1/2021 Consumer Survey showed similar levels of optimism. 74% of Canadians surveyed aged 25-54 are planning to engage in levels of social and economic activities equal to, or greater than, those seen prior to the pandemic once the majority is vaccinated (Chart 11). A net majority (18%) of those surveyed plan to spend more on the types of “high-touch” service spending unavailable during the pandemic, like travel, movies and dining in restaurants, once a majority is vaccinated (Chart 12). Chart 11Canadians Are Ready To Have Fun Once Again
Some Bond Bearish Tales From Both Sides Of The 49th Parallel
Some Bond Bearish Tales From Both Sides Of The 49th Parallel
All of the Canadian survey data is sending a clear message: a faster vaccine rollout will leader to much faster spending by consumers and businesses. 2) Signs Of Financial Stability Risks Highly-indebted Canadians' love affair with real estate has always concerned the BoC. While a combination of cutting policy interest rates to zero and ramping up QE helped stabilize Canadian financial markets during the 2020 pandemic shock, it has also set off a new surge of housing speculation. According to the Bloomberg Nanos consumer survey, 67% of Canadians now expect house prices to appreciate. The demand for homes has given a lift to the Canadian economy through a surge in new housing starts (residential investment is 8% of Canadian real GDP), while pushing national house price inflation back above 10% (Chart 13). Chart 12A Surge In "High-Touch" Spending Awaits Canadian Herd Immunity
Some Bond Bearish Tales From Both Sides Of The 49th Parallel
Some Bond Bearish Tales From Both Sides Of The 49th Parallel
As already indebted Canadian households pile on more debt to partake in another national home-buying party, the BoC must now concern itself with the potential financial stability risks from a too-rapid rise in housing values. Chart 13Yet Another Canadian Housing Boom
Yet Another Canadian Housing Boom
Yet Another Canadian Housing Boom
In a recent speech, BoC Deputy Governor Toni Gravelle noted that the BoC had to introduce QE in 2020 to help fight COVID-related dysfunction across a variety of Canadian financial markets, including government bonds where liquidity dried up.3 Gravelle also noted that the BoC would begin to dial back QE once it was clear that financial markets no longer needed the support from QE. With Canadian equities booming and Canadian corporate bond spreads near the lowest levels of the past decade (Chart 14), it seems clear that the BoC can begin dialing back its government bond purchase program if it is no longer necessary and likely fueling another housing bubble. 3) Additional Large Fiscal Stimulus The governing Canadian Liberal government of Prime Minister Justin Trudeau delivered a massive amount of fiscal stimulus to the pandemic-stricken Canadian economy in 2020. In the 2021/22 federal budget announced yesterday, another huge burst of spending was introduced, equal to C$101bn or 4.2% of Canadian GDP over the next three years. The spending was described as another COVID relief package, but included many long-term programs like national child care, raising the minimum wage and boosting green investments. According to the projections from the latest IMF World Fiscal Monitor, the “fiscal thrust” for Canada – the change in the cyclically-adjusted primary budget balance as a share of GDP - was projected to turn from a stimulus of +9% in 2020 to a drag of -2% in 2021 (Chart 15). The spending announced in the latest budget will effectively eliminate that drag for the next three years. This will provide a major lift to an economy already likely to see booming post-pandemic growth. Chart 14BoC QE No Longer Necessary
BoC QE No Longer Necessary
BoC QE No Longer Necessary
Chart 15No Fiscal Drag Now Expected In 2021
Some Bond Bearish Tales From Both Sides Of The 49th Parallel
Some Bond Bearish Tales From Both Sides Of The 49th Parallel
Chart 16Canadian Real Yields Are Too Low
Canadian Real Yields Are Too Low
Canadian Real Yields Are Too Low
Given the combination of expanding vaccinations, surging confidence, a renewed housing boom and soaring financial markets, it will be difficult for the BoC to maintain its current policy settings for much longer. This is a central bank that engaged in QE reluctantly last year and numerous BoC officials have stated – even in the worst days of the global pandemic - that they would begin to remove accommodation once it was no longer needed. Interest rate markets have already moved to price in a full-blown BoC tightening cycle. The Canadian OIS curve now discounts “liftoff” (a full 25bp rate hike) in October 2022, with 163bps of rate hikes priced in to the end of 2024 (Chart 16). The projected path of rates is below the BoC’s inflation forecasts to 2023. Thus, the implied Canadian real policy rate is expected to remain negative over the next two years – even though the BoC estimates that the neutral policy rate range is 1.75% to 2.75%, or -0.25% to +0.75% in real terms after subtracting the midpoint of the BoC’s 1-3% inflation target band. In other words, Canadian interest rate markets are vulnerable to any BoC shift in a less dovish direction, as seems increasingly likely sometime in the next few months. Our BoC Monitor is rapidly moving out of the “easier policy required” zone (Chart 17), and the rapid improvement in the Canadian employment situation suggests the BoC will be under more pressure to begin signaling a path towards withdrawing policy accommodation. This will start with an announced tapering of QE purchases, perhaps even ahead of any signals from the Fed that it is doing the same (Chart 18). This justifies a more cautious stance on Canadian fixed income exposure. Chart 17Downgrade Canadian Government Bonds To Underweight
Downgrade Canadian Government Bonds To Underweight
Downgrade Canadian Government Bonds To Underweight
Chart 18Could The BoC Start Tapering Before The Fed?
Could The BoC Start Tapering Before The Fed?
Could The BoC Start Tapering Before The Fed?
While a BoC tapering announcement before the Fed would likely put upward pressure on the Canadian dollar versus the US dollar, that would be something the BoC could live with if the economy was rapidly gaining strength – especially as our currency strategists believe the “loonie” to be undervalued. Thus, we are formally downgrading our strategic recommended allocation to Canadian government bonds to underweight (2 out of 5, see table on page 16). We are also maintaining our recommended below-benchmark duration exposure within dedicated Canadian bond portfolios. We are also cutting the allocation to Canada to underweight in our model bond portfolio and placing the proceeds in both, the US and core Europe (see pages 14-15). Bottom Line: The Canadian economy is gaining significant positive momentum, with an increased pace of vaccinations boosting optimism despite a third wave of COVID-19. We now see a growing risk that the Bank of Canada shifts to a less dovish policy stance sometime in the next few months, led by a tapering of its bond buying. Downgrade Canadian government bonds to underweight in global fixed income portfolios. Robert Robis, CFA Chief Fixed Income Strategist rrobis@bcaresearch.com Footnotes 1 Please see BCA Research Foreign Exchange Strategy/Global Fixed Income Strategy Special Report, "Will The Canadian Recovery Lead Or Lag The Global Cycle?", dated February 12, 2021, available at fes.bcaresearch.com and gfis.bcaresearch.com. 2 That Canadian return is virtually the same after hedging into US dollars, hence that local currency return can be compared to the US dollar denominated Treasury market return. 3https://www.bankofcanada.ca/2021/03/market-stress-relief-role-bank-canadas-balance-sheet Recommendations The GFIS Recommended Portfolio Vs. The Custom Benchmark Index
Some Bond Bearish Tales From Both Sides Of The 49th Parallel
Some Bond Bearish Tales From Both Sides Of The 49th Parallel
Duration Regional Allocation Spread Product Tactical Trades Yields & Returns Global Bond Yields Historical Returns

Global fiscal stimulus remains strong and will likely peak this year. Our Geopolitical Strategy service updated its long-running tally of global fiscal stimulus to bring it into line with the latest statistics from the IMF on net national borrowing and…
BCA Research’s US Equity Strategy service recently updated their SPX dividend discount model (DDM). The model – along with their SPX EPS/multiple sensitivity analysis and their SPX forward ERP fair value estimates – points to an SPX fair value near 4,050. …
Highlights Portfolio Strategy Rising demand for packaging materials, increasing industry pricing power along with compelling relative valuations signal that ignored containers and packaging stocks are a hidden gem within the S&P materials sector. Stay overweight. Softening industry activity coupled with an absence of an export relief valve at a time when the economy is on track to fire on all cylinders, compel us to put the S&P soft drinks index on our downgrade watch list. Recent Changes There are no changes to our portfolio this week. Table 1
Metamorphosis On Temporary Hold?
Metamorphosis On Temporary Hold?
Feature Equity market euphoria has taken over with the SPX vaulting to fresh all-time highs on numerous occasions over the past two weeks. An easy Fed and ultra-loose fiscal policies remain the key macro drivers of this bull market. While the economy is on track to boom in 2021, leading economic indicators will soon be running into trouble and will have to come off the boil. The ISM manufacturing and services readings are at nose bleed levels, raising some eyebrows of how much further they can rise (Chart 1). The looming $2.4tn infrastructure bill following on the heels of the $900bn and $1.9tn fiscal easing packages since late-December are also likely fully reflected in the exuberant equity prices. As we showed two weeks ago, already more than two Fed hikes are priced in the OIS market over the next 24 months, and four by the end of 2023 (Chart 2)! Chart 1As Good As It Gets
As Good As It Gets
As Good As It Gets
Chart 2Explaining US Dollar Strength
Explaining US Dollar Strength
Explaining US Dollar Strength
S&P 500 twelve-month and five-year forward EPS estimates have crested and so have net earnings revisions (Chart 3). The SPX’s annual rate of change cannot go any higher for the remainder of the year (second panel, Chart 1) and breadth is as good as it gets with both SPX percent of stocks trading above their 50 and 200 day moving averages closing in on 100% (Chart 4). Chart 3Cresting Euphoria?
Cresting Euphoria?
Cresting Euphoria?
Chart 4Extended Breadth?
Extended Breadth?
Extended Breadth?
The VIX recently melted below 16, junk yields hit all-time lows and the high-yield option adjusted spread multi-year lows (Chart 5). With regard to market internals, looking underneath the SPX hood is revealing. We recently booked handsome gains of 17% in our cyclicals/defensives portfolio bent and moved to the sidelines. This ratio has since ticked down, and so has the small/large ratio. As a reminder, we cemented gains north of 16% early in the year on the size bias and have been neutral since January 12, 2021. Even our long “Back-To-Work”/short “COVID-19 Winners” pair trade has hit a wall and we recently set a 5% rolling stop in order to protect profits of over 20% since our second inception in early February (Chart 6). Chart 5Complacency Reigns Supreme
Complacency Reigns Supreme
Complacency Reigns Supreme
Chart 6Running Out Of Steam
Running Out Of Steam
Running Out Of Steam
Finally, a number of key macro indicators we track are keeping us alert and make us uneasy with the recent stampede into stocks. EURUSD was the first to peak early in January, then gold bullion stalled and finally the South Korean Kospi index peaked. Tack on the recent relative EM stock market underperformance and the risk is that these growth hypersensitive indicators are sniffing out some trouble, potentially an ex-US economic soft-patch. Thus, some caution is warranted until all of these key indicators break out of their recent funk (Charts 7 & 8). Chart 7Three Macro Assets To Closely Monitor
Three Macro Assets To Closely Monitor
Three Macro Assets To Closely Monitor
Chart 8Running Out Of Stimulus
Running Out Of Stimulus
Running Out Of Stimulus
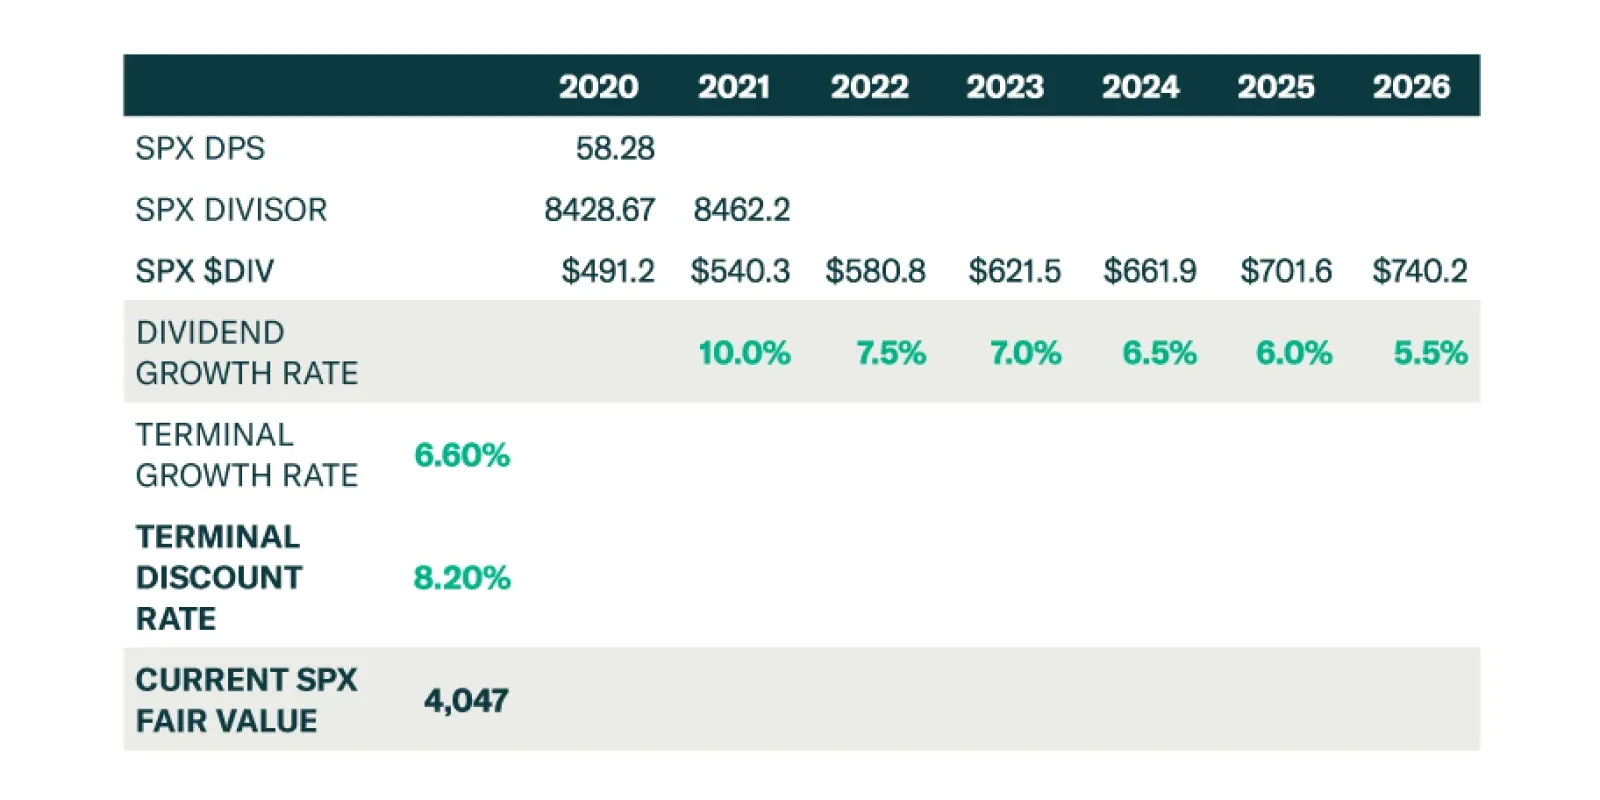
This week we update our SPX dividend discount model (DDM) for the fifth year running, along with the SPX EPS/multiple sensitivity analysis and the SPX forward equity risk premium (ERP). All three ways point to an SPX fair value near 4,050. As a reminder, we have been, and remain, very conservative in our DDM assumptions. Again this year we assume that no buybacks will occur, a long held assumption of ours, i.e. we pencil in a steady divisor in the coming five-year time frame. 2026 is our terminal year when dividend growth settles at 6.6%, 60bps below the long-term average (bottom panel, Chart 9). Our 8.2% discount rate mirrors the corporate junk bond yield historical average. First off, remarkably, the SPX full year 2020 dividend went up 4 cents/share on a year-over-year basis, and blew out even the most optimistic estimates we had last April! While financials chopped their dividends following the Fed’s guidance, the S&P energy sector maintained their dividends as we predicted last spring. Impressively, we posited that XOM and CVX would sustain their dividend aristocrats status (i.e. minimum of 25 consecutive years of rising dividend payouts), which was controversial at the time, and subsequently these two US oil majors diverged from their European peers. Moreover, while a lot of pundits used the GFC as a close parallel, the 9/11 accelerated recession proved the most accurate historical episode from a dividend perspective (bottom panel, Chart 9), and we would not be surprised if a jump in dividend growth similar to the post 9/11 recession takes root. Chart 9Resilient SPX Dividends
Resilient SPX Dividends
Resilient SPX Dividends
Continuing from last year, this year we use two different dividend growth approaches: our own estimates and alternatively the S&P 500 dividend futures derived growth. Tables 2 & 3 summarize the results. Table 2SPX Dividend Discount Model: Using USES Dividend Growth Assumptions
Metamorphosis On Temporary Hold?
Metamorphosis On Temporary Hold?
Table 3SPX Dividend Discount Model: Using S&P Dividend Futures Growth Assumptions
Metamorphosis On Temporary Hold?
Metamorphosis On Temporary Hold?
Table 4SPX EPS & Multiple Sensitivity
Metamorphosis On Temporary Hold?
Metamorphosis On Temporary Hold?
Our own dividend growth estimates result in an SPX 4,050 fair value target (Table 2). Our assumptions are not as pessimistic as the SPX dividend futures, which result in an SPX 2,900 fair value (Table 3, please click here if you would like to receive our DDM and insert your own assumptions). Table 5Forward Equity Risk Premium Analysis
Metamorphosis On Temporary Hold?
Metamorphosis On Temporary Hold?
In order to complement our SPX 4,050 fair value estimate, Tables 4 & 5 highlight our sensitivity analysis and forward ERP fair value estimates. Our starting point is the Street’s $203.1 EPS estimate for calendar 2022 and the backed out SPX forward P/E of 20.3. Similarly, for the forward ERP analysis we use the sell-side’s 2022 EPS estimate along with a forward 10-year US Treasury yield of 2% and an equilibrium ERP near 300bps on the back of: the Fed’s commitment to stay extremely accommodative, melting volatility, collapsing policy uncertainty and soaring ISM manufacturing (Charts 10 & 11). Chart 10Booming Economy…
Booming Economy…
Booming Economy…
Chart 11…Translates Into Melting ERP
…Translates Into Melting ERP
…Translates Into Melting ERP
This dual analysis corroborates the SPX DDM model’s 4,050 fair value and suggests that the SPX is fully valued at the current juncture, leaving little, if any, wiggle room for any mishaps. Our two key macro risks for the remainder of the year remain China’s looming slowdown and the Fed’s tapering, warning that some near-term caution is warranted. This week we update a niche materials subsector and set a downgrade on a consumer staples consumer goods subgroup. Stick With Containers And Packaging Containers and packaging stocks now comprise roughly 13% of the S&P materials index, represent a niche group within a niche sector and were we not already overweight we would not hesitate to commit capital to this index. In a nutshell, Chart 12 captures the attractiveness of container and packaging stocks. These neglected materials stocks are a play on rising pricing power due to insatiable demand for containerboard and other packaging materials. Tack on executives cost discipline and a profit margin expansion story will surprise analysts and investors alike and serve as a catalyst for a durable rerating phase (bottom panel, Chart 12). In more detail, packaged food exports coupled with consumer outlays on food and beverages are soaring. Expanding food manufacturing shipments corroborate this upbeat demand backdrop and signal that the path of least resistance is higher for ultra-pessimistic sell-side analysts’ top and bottom line growth estimates (Chart 13). Chart 12What’s Not To Like?
What’s Not To Like?
What’s Not To Like?
Chart 13Upbeat Demand…
Upbeat Demand…
Upbeat Demand…
Booming intermodal rail carloads gauging the retail industry’s demand also underpin container and packaging manufacturers’ profits (middle panel, Chart 14). Similarly the CASS freight index that tracks the health of different US freight industries is surging and confirms that relative profits will rebound in the back half of the year (bottom panel, Chart 14). Beyond the vigorous recovery in food manufacturing as per the Fed’s latest IP release that is a boon for packaging producers (bottom panel, Chart 15), COVID-19 ramifications also represent a rising source of demand for the industry. COVID-19 has served as an accelerant to the ongoing trend of non-store retail sales grabbing an ever increasing share of total retail sales. As internet sales garner a larger slice of the overall pie, the implication is that demand for boxes and other packaging materials like bubble wrap is increasing at a healthy clip (second panel, Chart 15). Chart 14...Everywhere…
...Everywhere…
...Everywhere…
Chart 15…One Looks
…One Looks
…One Looks
Finally, from a world perspective, global export volumes have vaulted to fresh all-time highs (third panel, Chart 15) and global readings of manufacturing PMIs have reached escape velocity. The upshot is that as trade picks up steam and bottlenecks and shortages get resolved likely in the back half of 2021, export volumes will remain buoyant further boosting the allure of container and packaging equities. Netting it all out, rising demand for packaging materials, increasing industry pricing power along with compelling relative valuations signal that ignored containers and packaging stocks are a hidden gem within the S&P materials sector. Bottom Line: Stay overweight the S&P containers and packaging index. The ticker symbols for the stocks in this index are: BLBG: S5CONP– WRK, SEE, IP, AVY, BLL, PKG, AMCR. Put Soft Drinks On Downgrade Alert Soft drinks have taken a beating recently and we are on the lookout for an oversold bounce before we go underweight this consumer goods sub group, thus today we set a downgrade alert. While PEP’s earnings were on the bright side, leading macro indicators signal that investors will be better off to avoid this defensive consumer staples sub-index. Importantly, safe-haven soft drink stocks that tend to be very stable cash flow generators both in good times and in bad, fare worse during the early stages of an economic expansion. As growth transitions from scarcity to abundance, investors start to shed staples exposure including soft drinks (ISM shown inverted, middle panel, Chart 16). Similarly on the operating front, our Beverage Industry Activity Proxy has crested of late and warns that sinking relative profits growth estimates will likely prove accurate (bottom panel, Chart 16). True, sell-side analysts appear to have thrown in the towel on this consumer goods subgroup with both 12-month and five-year forward profit growth estimates plunging to multi-year lows (middle panel, Chart 17). But, relative valuations have followed down the path of this EPS drubbing, and the relative forward P/E ratio is trading 14% below the historical mean (bottom panel, Chart 17). Chart 16Some Yellow Flags
Some Yellow Flags
Some Yellow Flags
Chart 17De-rating Blues
De-rating Blues
De-rating Blues
Actual profits and revenues have made a full circle owing to the sizable jump during the pandemic induced stay-at-home bonanza, however, such a stellar growth repeat remains elusive for 2021. This is especially true if the export relief valve remains firmly closed for the industry. Already there is a sizable gap between the smart rebound in the Asian currency index, but industry exports are still trying to achieve positive year-over-year momentum (Chart 18). The relative tick down in soft drink industrial production (IP), according to the Fed’s latest IP release, corroborates our view that there is an element of stealing demand from the future due to COVID-19, and top line growth will likely surprise to the down side, especially given the soaring reading from the ISM manufacturing survey (ISM shown inverted, bottom panel, Chart 19). Chart 18Export Valve is Blocked
Export Valve is Blocked
Export Valve is Blocked
Chart 19Roaring Economy Weighs On Defensives
Roaring Economy Weighs On Defensives
Roaring Economy Weighs On Defensives
Nevertheless, we are patient before pulling the trigger and downgrading to a below benchmark allocation, as not only technicals are washed out, but also three additional indicators keep us on the sidelines, at least, for now: First, if there is even a mild economic relapse, the 10-year US Treasury yield will be the first to sniff it out and the recent pause in the bond market’s selloff is cause for minor concern (top panel, Chart 20). Second, industry shipments, while a lagging indicator remain resilient (middle panel, Chart 20). Finally, soft drinks pricing power is also robust and there is tentative evidence that beverage producers have been successful in passing on at least part of their rising input costs – mostly commodity related inflation (bottom panel, Chart 20). Netting it all out, softening industry activity coupled with an absence of an export relief valve at a time when the economy is on track to fire on all cylinders, compel us to put the S&P soft drinks index on our downgrade watch list. Bottom Line: Set a downgrade alert on the S&P soft drinks index. The ticker symbols for the stocks in this index are: BLBG: S5SOFD – KO, PEP, MNST. Chart 20But There Are Some Substantial Offsets
But There Are Some Substantial Offsets
But There Are Some Substantial Offsets
Anastasios Avgeriou US Equity Strategist anastasios@bcaresearch.com Current Recommendations Current Trades Strategic (10-Year) Trade Recommendations
Overdose?
Overdose?
Size And Style Views February 24, 2021 Stay neutral cyclicals over defensives January 12, 2021 Stay neutral small over large caps June 11, 2018 Long the BCA Millennial basket The ticker symbols are: (AAPL, AMZN, UBER, HD, LEN, MSFT, NFLX, SPOT, ABNB, V). January 22, 2018 Favor value over growth
Highlights The five largest banks released a sizable chunk of their pandemic loan-loss reserves, signaling that the credit storm has passed: Excepting Wells Fargo, which is managing its credit loss allowance far more cautiously than its peers, the big banks released about a third of their pandemic reserves and only retain about half of them. Households are in fine fettle and the banks expect they’ll consume avidly as the year progresses: Aggregate debit and credit card spending recovered to pre-pandemic levels in the first quarter and even the ailing travel and entertainment categories showed signs of life. Businesses are not borrowing now, but they will have to if economic growth matches lofty expectations: The biggest companies have met their funding needs amidst the bond issuance bonanza, but businesses will not be able to satisfy the looming demand rush without taking out loans. Banks are ready and eager to lend: Management comments on earnings calls point strongly to easier standards in the coming first quarter senior loan officer survey. Lender willingness will hold down defaults and extend the virtuous phase of the credit cycle. The good times won’t last forever, but the end is not yet in sight. What The Big Banks See Through The Window The first quarter reporting season has begun with last week’s releases from the big banks. We have once again reviewed the SIFI1 banks’ (BAC, C, JPM and WFC) and USB’s earnings calls and financial statements for insight into the broad macro backdrop as revealed by the actions and intentions of their household and business customers, borrower performance, lender willingness and the overall condition of the financial system. As one might expect when economic growth appears to be on the cusp of a major inflection, the banks’ perceptions were nearly uniformly consistent. Table 1Taking Away The Sandbags
The Big Bank Beige Book, April 2021
The Big Bank Beige Book, April 2021
Chart 1Quick Fed Action Brought Down Credit Spreads ...
Quick Fed Action Brought Down Credit Spreads ...
Quick Fed Action Brought Down Credit Spreads ...
Chart 2... And Easing Credit Standards Should Help Hold Them In Place
... And Easing Credit Standards Should Help Hold Them In Place
... And Easing Credit Standards Should Help Hold Them In Place
Everyone’s depositors are flush with cash. Households have just begun to spend it at their pre-pandemic pace and appear to be eager to get back to activities that have been largely off-limits for the last year. Businesses are holding onto their cash for now but they will have to replenish inventories and make other investments to meet the looming crush of demand. The banks themselves are drowning in deposits and pine for a revival of loan demand to provide a productive outlet for them. Credit performance has been vastly better than expected in the first stages of the pandemic and the banks and their auditors are finally convinced that it’s not a mirage. In the first quarter the biggest banks, ex-Wells Fargo, which is taking a markedly more conservative approach than its peers, released roughly a third of the loan-loss reserve bulwarks they built up last year (Table 1). Much of the remaining half of their pandemic reserves are subject to release in subsequent quarters if benign employment and economic trends continue in line with consensus expectations. Ongoing reserve releases are good for the economy on several counts. They demonstrate that the worst-case pandemic scenarios have not come to pass and validate the narrowing of credit spreads (Chart 1). They encourage banks and other lenders to ease their lending standards (Chart 2), ensuring that credit availability will help reinforce the boom. They also promote rising financial asset prices, supporting consumption at the margin via the wealth effect. Investors and regulators may eventually come to rue the layering of pro-cyclical reinforcement but it is highly supportive of risk assets over our default one-year investment horizon. What The Big Banks See In The Mirror In the January edition of the Big Bank Beige Book, we noted that the banks and their investors were grappling with two major pandemic uncertainties. The first – How badly will the value of loan portfolios be impaired? – was largely addressed with the first quarter’s big reserve releases. Assuming that the US is well on its way to subduing COVID by the summer, impairment of legacy loans will be considerably less than expected, though the easing standards currently taking root will eventually give rise to a new wave of credit losses. The latter has nothing to do with the pandemic; it is a natural cyclical ebb and flow first observed at least 5,000 years ago in Ecclesiastes 3:1-8, set to music by Pete Seeger in the early sixties and made ubiquitous on AM and FM radio by The Byrds’ subsequent cover. Chart 3The SIFI Banks Have Had A Great Vaccine Run
The SIFI Banks Have Had A Great Vaccine Run
The SIFI Banks Have Had A Great Vaccine Run
The second question is of passing interest to the overall economy but essential to banks’ near-term earnings prospects: When will loan demand revive? Banks already find their net interest income hemmed in by the tight net interest margins that are part and parcel of zero interest rate policy. Sharply reduced lending volumes make matters worse and parking the excess cash in Treasuries and agency securities is an unappealing option when rates are set to rise over the next couple years. It is possible that the SIFI banks are due for a breather relative to their outperformance versus the overall market (Chart 3, top panel), though they may well have further room to run against pure-play banks that are more dependent on taking deposits and making loans (Chart 3, bottom panel). 1Q21 Big Bank Beige Book Household Borrowing (Chart 4) And Spending (Chart 5) Chart 4Consumer Borrowing Is Still In The Doldrums ...
Consumer Borrowing Is Still In The Doldrums ...
Consumer Borrowing Is Still In The Doldrums ...
Chart 5... But Spending May Already Be Breaking Out
... But Spending May Already Be Breaking Out
... But Spending May Already Be Breaking Out
March was a record month of spending by Bank of America consumers and led to the highest- ever quarter of consumer spending. … [O]ur … customers’ … spending is not only much higher than the prior year when payments began to decline but notably is much higher this year to date than year-to-date 2019. (Moynihan, BAC CEO) [L]ast I saw 30%-odd of the stimulus money has been spent. [T]he other 70% sitting in people’s accounts … [has] to be spent [before outstanding credit card balances can rise]. … You’re starting to see the [card] purchase numbers go up and the [card] payments rate went way up. [Once those numbers become] more constant … [as] you’d expect … the usage rate will go up and start to drive some balance growth. (Moynihan, BAC) Consumer sentiment has returned to more normalized levels, reflecting increased optimism. We’ve seen debit and credit card spend return to pre-pandemic levels, up 9% year-on-year and 14% versus 1Q19, despite T&E [travel and entertainment] remaining significantly lower. That said, we are seeing strong momentum in T&E with spend up more than 50% in March compared to February. (Piepszak, JPM CFO) [W]e do expect there to be significant economic activity in the second half and so [consumer re-leveraging] could come quite naturally but it could come a little bit later given the amount of the deleveraging we’ve seen. But the fact that we already see spend above pre-COVID levels [while] we still have restrictions in place, particularly around [consumers’] T&E, we think that we’ll see spend tick even higher. And that will be a point where perhaps we’ll start to see that re-levering. (Piepszak, JPM) [W]hile we are still seeing the impact of the pandemic and high payment rates on [our own] revenues, consumer spending continues to improve and credit remains healthy, pointing to a recovery as we move through the year. … [Card] purchase[s] are improving slightly faster than our prior expectations and with the vaccine rollout this should support a further recovery in discretionary spend. (Mason, C CFO) Weekly debit card spend was up every week compared to a year ago during the first quarter. ... We are seeing increased consumer spending activity in both travel and restaurants, two categories that have been particularly suppressed since the onset of COVID-19. … Consumer credit card weekly spend continued to strengthen over the course of the first quarter as well and ended the quarter … up 8% compared to the same week in 2019. (Scharf, WFC CEO) Improved economic activity is driving better consumer and business spending trends, which in turn is translating into improving payments volume. In each of our payments businesses, volumes, excluding COVID-impacted travel, hospitality and entertainment sectors, exceeded first quarter 2019 pre-pandemic levels. (Cecere, USB CEO) Our auto lending has been very strong. And I would expect that will continue to be strong. … [T]he encouraging thing is we are seeing a lot of nice green shoots and as consumer spend starts to expand and grow, I think that consumer lending will come back as well. (Dolan, USB CFO) Bank Capacity (Chart 6) And Willingness/Desperation To Lend (Chart 7) Chart 6Drowning In Liquidity
Drowning In Liquidity
Drowning In Liquidity
Chart 7More Lenders Than Borrowers
More Lenders Than Borrowers
More Lenders Than Borrowers
In terms of the commercial side, there are still the affected industries that we’re watching carefully, but everywhere else we’re back to pre-pandemic [underwriting criteria] and in light of the size of our company, in light of the need for loan growth, I think we’ve relaxed a little bit on some hold levels [Ed. Note – “Hold level” appears to be an internal BAC guideline limiting the share of an originated loan that the company will retain on its own balance sheet.], particularly in global markets where they have more of a moving-and-storage mentality around loans and what they [provide to] customers. We’re just taking a few maybe bigger positions than we might have otherwise taken pre-pandemic. But it’s no real change in the underwriting standards, the company is bigger, we have more liquidity, we have more capital, so we think all of this is appropriate. (Donofrio, BAC CFO) It’s a shame [all the effort that is directed to] … managing around capital constraints. This is not the way to run a railroad. We’re spending time on this call on CECL [the new loan-loss reserve standard that was implemented at the beginning of 2020] and SLR [supplemental leverage ratios] and it’s a shame and it distracts from growing the American economy. I’ve mentioned over and over, we have $2.2 trillion of deposits, $1 trillion of loans, $1.5 trillion of cash and marketable securities, much of which cannot be deployed to intermediate or lend. How conservative do you want to get? (Dimon, JPM CEO) Our [consumer] credit portfolio is proving to be quite resilient. We are now focused on loan and revenue recovery, through driving spend activity, re-entering the market for new account acquisitions and investing in lending capabilities and new value propositions. (Mason, C). We’ve got dry powder to put liquidity to work and we’ve [captured some increased share of our institutional clients’ wallets] but we have more dry powder to do [more of it]. (Mason, C) With the improving economic forecast, we are gradually returning to pre-pandemic underwriting policies. (Santomassimo, WFC CFO) Ultimately, … the fact is our card propositions are not competitive [versus] what is available today in the marketplace or where people are going. … [W]e think we have opportunities to make … our products far more attractive for those that currently have them so it becomes their primary product, but also more attractive for the customers that we currently touch [that don’t have our cards]. (Scharf, WFC) The Coming Business Spending Revival [T]hink about the flywheel that we have in the company as a production engine that had to be slowed down in the crisis with 15% unemployment and final demand being crushed in the second quarter last year. Then [think about] turning that crank back up and just watch that flywheel start to take off. That’s why we have good confidence in terms of getting right back on [a solid pace of] loan growth. (Moynihan, BAC) The projected economic growth should [spur] companies to borrow, build inventory, increase hiring and invest and do what they do in their businesses. Global banking loans, after falling in January, appear to have stabilized again in March. We’ll have to see how this plays out, but March was a good sign. (Moynihan, BAC) In order for the economy to expand 7% this year [per our economists’ projections], at some point companies have to access capital to meet that final demand and you [will] see [credit line] usage come up. (Moynihan, BAC) [I]n the commercial bank, given the level of support, the amount of liquidity in the markets, as well as the amount of cash on balance sheets, loan growth has been muted and probably will be for some time, but that’s incredibly healthy ultimately for the recovery. Whether we see [corporate borrowing] pick up later this year or next year remains to be seen, but [any delay] is [attributable to the economy’s underlying strength]. (Piepszak, JPM) Businesses remain strong as well. Most clients still have strong cash positions and [credit] line utilization remains low. Demand for consumer products is high and dealer inventory levels are meaningfully lower versus historical levels. After declining during the second half of the year, commercial loan balances seem to have stabilized. And if the economy continues to pick up, we would expect to see increased loan demand from our commercial customers in the second half of the year. (Scharf, WFC) [T]here are things [businesses] will need to do in order to be able to meet that [expected increase in] consumer demand … in the form of continuing to build their inventories and make some capital investments which they, just like many of us, have been holding off. [T]he timing of that … is probably [going to be] a little bit more subdued simply because of the fact that there is a fair amount of liquidity and deposit balances that exist. They need to burn through that. … So what we’re first going to see is utilizing those deposit balances and then more robust loan growth. And that’s why we think it’s really probably more the second half of the year before that starts to happen. (Dolan, USB) [B]usinesses are becoming much more optimistic, they’re thinking about inventory build and they’re thinking about their capital expenditures. And I think that those are all really good signs. I would also just say, probably more for the second half of the year, that we do see and believe that M&A activity is going to start to strengthen and that will have positive implications with respect to C&I loans. (Dolan, USB) Investment Implications We frankly acknowledge our discomfort with current valuation levels. The S&P 500 is expensive at nearly 23 times forward four-quarter earnings; at a yield of around 1.6%, the 10-year Treasury note is likely to produce a negative real return if held to maturity; and credit spreads are tight enough that they’re beginning to squeak. The current pace of growth is quite robust, however, and it appears nearly certain to accelerate as the economy reopens and consumers begin to deploy the massive hoard of savings they’ve accumulated over the last year-plus. We see many of the tailwinds that the banks cited on their earnings calls. The growth backdrop into 2022 looks so good that maintaining risk-friendly asset allocations still looks like the best course of action for investors with one-year timeframes. The fundamental support is enhanced by extremely accommodative fiscal and monetary policy that has left households, businesses, banks and financial markets swimming in cash. All that money has to go somewhere and we expect that it will continue to support risk assets, even at their currently demanding valuations, for at least the next twelve months. As for the SIFI banks themselves, we think their significant outperformance versus the overall market has come to an end. They are no longer ridiculously inexpensive on a price-to-book basis and their earnings prospects will be limited by the overabundance of capital in the financial system. Traditional intermediation just doesn’t pay very well when every creditworthy borrower has more money than he or she needs. However, the SIFIs’ capital markets exposure does grant them an edge on the pure-play commercial banks, which derive much more of their earnings from taking deposits and making loans, and we do like them relative to the large-cap regional banks. Doug Peta, CFA Chief US Investment Strategist dougp@bcaresearch.com Footnotes 1 Systemically important financial institutions.
The US Treasury market’s dynamics are perplexing. The S&P 500 continues to forge new all-time highs, buoyed by positive economic data showing a firming recovery (most recently: blockbuster retail sales, strong regional Fed surveys, low jobless claims, and…
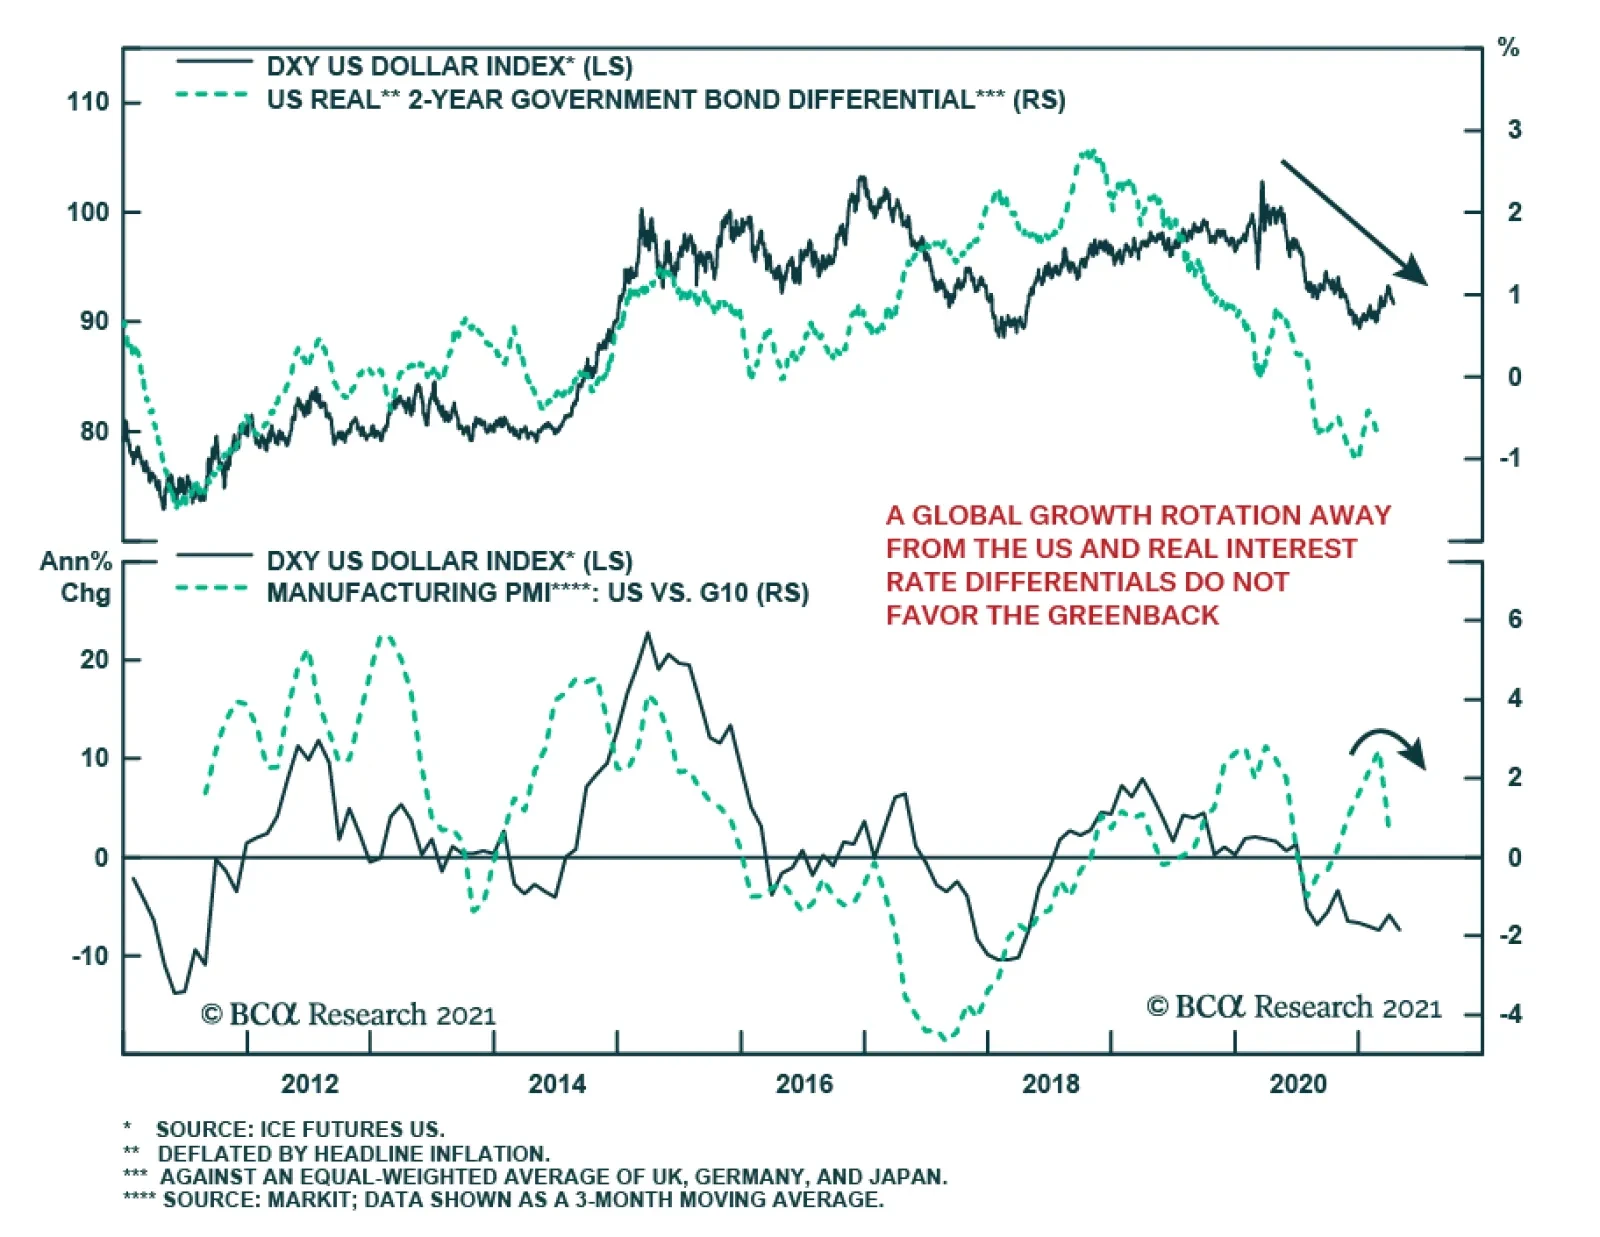
The DXY rallied 3.7% in the year to March 30 but has since lost 1.7%. The same reasons behind the dollar’s Q1 strength explain its recent weakness. Going into the year, technicals showed that the dollar was oversold and hinted toward a stronger dollar.…