United States
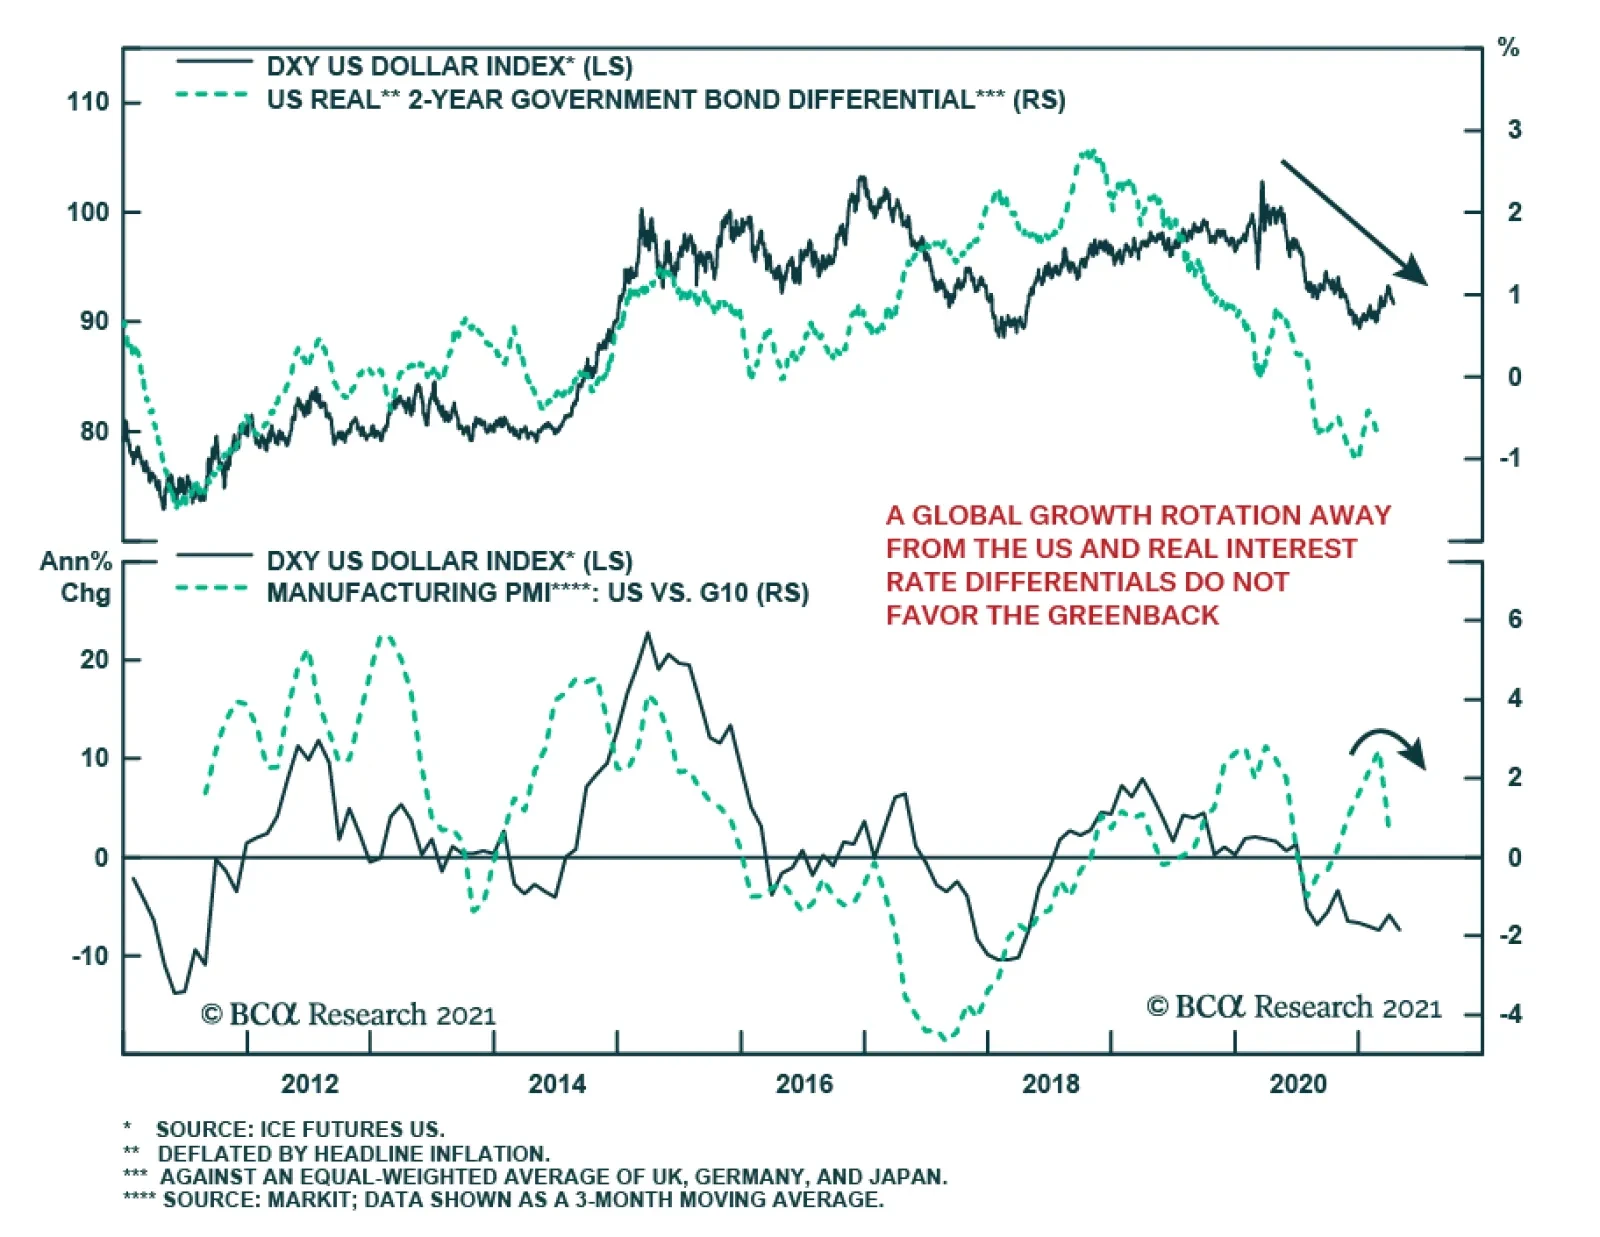
The DXY rallied 3.7% in the year to March 30 but has since lost 1.7%. The same reasons behind the dollar’s Q1 strength explain its recent weakness. Going into the year, technicals showed that the dollar was oversold and hinted toward a stronger dollar.…
The US Treasury market’s dynamics are perplexing. The S&P 500 continues to forge new all-time highs, buoyed by positive economic data showing a firming recovery (most recently: blockbuster retail sales, strong regional Fed surveys, low jobless claims, and…

Highlights There are tentative signs that US growth outperformance is ebbing. The recovery in the manufacturing sector abroad is already taking leadership from the US. This trend will soon rotate to the service sector. As such, long-term investors should begin to accumulate the euro on weakness. The Canadian economy is improving faster than our February assessment. This suggests the CAD could outperform sooner rather than later. Feature Chart I-1The Euro Drives The DXY
Relative Growth, The Euro, And The Loonie
Relative Growth, The Euro, And The Loonie
The US economy has been the growth outperformer this year. As such, yields have been rising faster in the US and the dollar has caught a bid. Since the start of the year, the DXY index has retraced 2.5% of its yearly losses against developed market currencies. Meanwhile, the rally has been a broad-based one with the euro, yen and Swedish krona taking the brunt of the decline (Chart I-1). Our bias is that growth outperformance will rotate from the US to the rest of the world later this year. This should hurt the dollar and benefit procyclical currencies. This week, we look at the euro and loonie, two currencies that should benefit from this shift. EUR/USD And The Manufacturing Cycle The relationship between bond yields and the economy is circular. Long bond yields can be regarded as a key signaling mechanism about the growth prospects of an economy. At the same time, bond yields directly affect financial conditions, especially when they rise too far too fast. From the point of view of short-term currency forecasting, determining the tipping point at which rising yields become restrictive could be extremely beneficial in forecasting relative economic growth. Chart I-2 shows that whenever the relative bond yield between the US and the euro area rises by 1%, near-term relative growth subsequently tips in favor of the latter, with a lag of about 12 months. This is important since the correlation between EUR/USD and relative growth is quite strong in the short term (Chart I-3). As such, while the rise in yields between the US and the euro area can hurt EUR/USD in the short term, it will begin to benefit relative euro/US growth in the longer term. Chart I-2Relative Bond Yields And The Manufacturing Cycle
Relative Bond Yields And The Manufacturing Cycle
Relative Bond Yields And The Manufacturing Cycle
Chart I-3Economic Data Is Surprising To The Upside In The Euro Area
Economic Data Is Surprising To The Upside In The Euro Area
Economic Data Is Surprising To The Upside In The Euro Area
Bond Flows And Other Market Signals Despite the increase in US Treasury yields, we have not seen higher European purchases of US bonds this year (Chart I-4). During the dollar bull market from 2011 to 2020, there was a direct correlation between rising US yields and higher Treasury purchases. One difference this time around is that other safe-haven bond markets like Canada, Australia, New Zealand and even the UK, are sporting attractive yields today. US yields have not risen much against other G10 countries in aggregate. This will continue to dent the extent to which the euro can fall. On the flipside, the upside to the euro could be quite substantial. From a purchasing parity perspective, the euro can rise 15% just to reset its discount relative to the US. PPP adjustments tend to take several years, but if the US continues to pursue inflationary policies, then by definition, the fair value of the euro will also rise (Chart I-5). Chart I-4Europeans Have Not Been Increasing Treasury Holdings
Europeans Have Not Been Increasing Treasury Holdings
Europeans Have Not Been Increasing Treasury Holdings
Chart I-5The Euro Remains Slightly ##br##Undervalued
The Euro Remains Slightly Undervalued
The Euro Remains Slightly Undervalued
Other cyclical factors also suggest that the euro could experience a coiled-spring rebound. Copper prices have surged this year and the traditional relationship with the euro has been offside (Chart I-6). While copper is benefiting from a move away from carbon towards cleaner electricity, the euro can benefit as well. European economies have decades of experience in renewable technology and could begin to see meaningful inflows into these sectors once investment capital is deployed. This makes the Bloomberg forecast of EUR/USD at 1.23 at the end of 2022 too pessimistic (Chart I-7). Chart I-6The Euro Could Have A Coiled-Spring Rebound Soon
The Euro Could Have A Coiled-Spring Rebound Soon
The Euro Could Have A Coiled-Spring Rebound Soon
Chart I-7Sentiment On The Euro Has Been Slightly Reset
Sentiment On The Euro Has Been Slightly Reset
Sentiment On The Euro Has Been Slightly Reset
Finally, we are short EUR/JPY as a tactical hedge with tight stops at 131. We are also lifting our limit-buy on the EUR/USD from 1.15 to 1.16. The Canadian Recovery Is Accelerating Chart I-8The Canadian Business Survey Outlook Was Encouraging
The Canadian Business Survey Outlook Was Encouraging
The Canadian Business Survey Outlook Was Encouraging
The Canadian recovery is taking shape faster than our February assessment, which the latest Business Outlook Survey corroborated. Both investment intentions and future sales growth were quite strong, with the former hitting a multi-decade high (Chart I-8). Notably: Two-thirds of firms see sales exceeding pre-pandemic levels; most firms stated that the second wave is having less or no impact to sales, compared to the first; and capacity constraints remain high in certain industries, but overall inflationary concerns remain relatively subdued. The robustness of the survey took us by surprise, given that a second wave of infections is raging, and most of the country is under lockdown. That said, the strength in investment spending is becoming a key theme in a global context, suggesting Canada could see significant FDI flows in the coming years. Markets have started pricing in a faster pace of rate hikes in Canada (Chart I-9). This has been a rare occurrence over the last decade and, together with our Global Fixed Income Strategy colleagues, we still believe there is less of a chance that Canada leads the hiking cycle. However, this could change if momentum in the economy allows it to surpass US growth. Chart I-9Markets Are Pricing In Faster Hikes In Canada
Markets Are Pricing In Faster Hikes In Canada
Markets Are Pricing In Faster Hikes In Canada
The IMF estimates that Canadian real GDP growth will be 5% this year and 4.7% next year. Growth could be much stronger than these levels, according to the Bloomberg Nanos Confidence Index (Chart I-10). Chart I-10Canadian GDP On The Mend
Canadian GDP On The Mend
Canadian GDP On The Mend
The employment report has improved tremendously since our February assessment (Chart I-11). Looking at the sub-components of the BoC Monitor, the weakness was centered on economic variables. This is changing, as the Canadian unemployment rate is falling faster than the US unemployment rate (Chart I-12). That is a bullish development for the CAD. Chart I-11The Canadian Jobs Recovery Is Robust
The Canadian Jobs Recovery Is Robust
The Canadian Jobs Recovery Is Robust
Chart I-12Canadian Employment Catching Up To The US
Canadian Employment Catching Up To The US
Canadian Employment Catching Up To The US
The Canadian housing market is heating up. Overall, house prices are up 10% with many cities well exceeding these levels (Chart I-13). The path for Canadian housing prices has been as follows: government support and macro prudential measures leading to a convergence in prices between low- and high-priced cities. Specifically, Vancouver (and to a certain extent, Toronto) are seeing softer pricing growth, while other cities recover. However, as prices start to deviate away from nominal incomes in lower-priced cities, the risk of wider macro prudential measures greatly increases. The second point is crucial, since the rise in Canadian home prices has been more pronounced than in other countries, such as Australia or the US. This means that both rising indebtedness and falling affordability are likely to present a key macro risk to the Canadian economy. Residential construction is a non-negligible part of the Canadian economy (Chart I-14). Chart I-13The Canadian Housing Market Has Heated Up
The Canadian Housing Market Has Heated Up
The Canadian Housing Market Has Heated Up
Chart I-14Residential Construction Is Booming
Residential Construction Is Booming
Residential Construction Is Booming
Bottom Line: Recent developments are increasing the odds that the Bank of Canada hikes rates sooner rather than later. This will allow further gains in the CAD. The CAD And Oil Crude oil prices are another hugely important driver for the CAD. In fact, for most of this year, interest rates have not been an important factor as the BoC faded any near-term improvement in the Canadian outlook. The Covid-19 crisis together with slow vaccination progress also hurt the recovery, putting the brakes on an appreciating loonie (Chart I-15). Our commodity strategists predict that Brent crude will hit $75 in 2023. This is higher than the forward markets are discounting. Rising forward prices will be synonymous with a higher CAD. However, Canada sells the Western Canadian Select (WCS) blend, which has historically traded at a significant discount to Brent or WTI (Chart I-16). Rising environmental standards hurt Canada, since WCS has a higher sulphur content. Pipeline capacity also remains a major bottleneck to getting Canadian crude to US refineries. Chart I-15The Loonie Has Lagged
The Loonie Has Lagged
The Loonie Has Lagged
Chart I-16Canadian Oil Prices Could Lag The Recovery
Canadian Oil Prices Could Lag The Recovery
Canadian Oil Prices Could Lag The Recovery
The redeeming feature this time around is that the correlation between the CAD/USD and crude oil prices is rising faster than for other currencies, as the US begins to embark on significant infrastructure projects (Chart I-17). Around 50% of US oil imports come from Canada. The Covid-19 crisis also slowed US oil production relative to Canada, which has helped increase the correlation between oil prices and the currency. Portfolio flows into Canada have been accelerating this year, benefitting oil stocks and the loonie. Chart I-17Sensitivity Of USD/CAD To Oil Has Increased
Sensitivity Of USD/CAD To Oil Has Increased
Sensitivity Of USD/CAD To Oil Has Increased
Investment Conclusions Chart I-18The CAD Is Cheap
The CAD Is Cheap
The CAD Is Cheap
The CAD remains cheap. It is trading at one standard deviation below its long-term mean, on a real effective exchange rate basis (Chart I-18). A return to the mean would generate about 10% upside. Our PPP model is less bullish, suggesting the loonie is cheap by about 5%. This still puts 84-85 cents within striking distance. Should the nascent Canadian recovery morph into a genuine acceleration, the CAD could rally even higher. Chester Ntonifor Foreign Exchange Strategist chestern@bcaresearch.com Currencies U.S. Dollar Chart II-1USD Technicals 1
USD Technicals 1
USD Technicals 1
Chart II-2USD Technicals 2
USD Technicals 2
USD Technicals 2
US economic data has been robust this week: CPI in March rose 2.6% year-on-year and 0.6% month-on-month, both exceeding expectations. PPI in March came in at 4.2% year-on-year and 1% month-on-month, beating expectations. The Empire Manufacturing survey staged a meaningful rebound from 17.4 to 26.3 in April. Retail sales were particularly strong, coming in at 9.8% month-on-month in March. The NAHB housing market index remained strong at 83 in April. The DXY Index fell by 0.5% this week. The drop in bond yields was surprising, given robust data. This is likely a signal that bond short positions are becoming a crowded trade. The DXY index is rolling over in April; a trend that supports its seasonal pattern. Report Links: Arbitrating Between Dollar Bulls And Bears - March 19, 2021 The Dollar Bull Case Will Soon Fade - March 5, 2021 Are Rising Bond Yields Bullish For The Dollar? - February 19, 2021 The Euro Chart II-3EUR Technicals 1
EUR Technicals 1
EUR Technicals 1
Chart II-4EUR Technicals 2
EUR Technicals 2
EUR Technicals 2
Recent data from the euro area have been mildly positive: Retail sales grew by 3% month-on-month in February versus the expected 1.7%. ZEW Economic Sentiment for both Germany and the EU in April came in lower than forecast. Industrial production fell by 1% in February over the prior month. German CPI came in at 0.5% month-on-month, in line with forecasts. The euro rose by 0.5% against the dollar this week, making this a second week of appreciation. The new Covid-19 wave may be a drag on EUR/USD in the near term, but this has also reset sentiment and positioning indicators. Our intermediate-term indicator has rolled over substantially, which is bullish from a contrarian perspective. Report Links: Portfolio And Model Review - February 5, 2021 On Japanese Inflation And The Yen - January 29, 2021 The Dollar Conundrum And Protection - November 6, 2020 JapaneseYen Chart II-5JPY Technicals 1
JPY Technicals 1
JPY Technicals 1
Chart II-6JPY Technicals 2
JPY Technicals 2
JPY Technicals 2
Data out of Japan have been mixed: Machinery orders recorded another month of decline, falling by 8.5% month-on-month in February versus an expected 2.8% increase. However, more positively, machine tool orders grew by 65% year-on-year in March. PPI in February came in at 0.8% month-on-month, better than expectations. The Japanese yen rose by 0.4% against the US dollar this week and remains one of the strongest G10 currencies in April. Our intermediate-term indicator has collapsed and speculators are net short the currency. We remain short EUR/JPY as a portfolio hedge. Report Links: The Dollar Bull Case Will Soon Fade - March 5, 2021 On Japanese Inflation And The Yen - January 29, 2021 The Dollar Conundrum And Protection - November 6, 2020 British Pound Chart II-7GBP Technicals 1
GBP Technicals 1
GBP Technicals 1
Chart II-8GBP Technicals 2
GBP Technicals 2
GBP Technicals 2
Recent data out of the UK have been mildly positive: February GDP rose 0.4% versus the prior month, slightly falling short of the expected 0.6% rise. Both the industrial and manufacturing production and the construction output exceeded expectations in February, growing at 1%, 1.3%, and 1.6% month-on-month. The trade deficit with the EU increased to 16.4B in February. The British pound rose by 0.3% against the US dollar this week, ranking in the middle among G10 currencies and flat against the Euro. We exited our short EUR/GBP trade last week to take profit on UK’s vaccination success and expected catch up phase for other economies. The elevated net speculative positioning on the pound also makes us neutral. Report Links: Portfolio And Model Review - February 5, 2021 The Dollar Conundrum And Protection - November 6, 2020 Revisiting Our High-Conviction Trades - September 11, 2020 Australian Dollar Chart II-9AUD Technicals 1
AUD Technicals 1
AUD Technicals 1
Chart II-10AUD Technicals 2
AUD Technicals 2
AUD Technicals 2
Recent data in Australia were strong: NAB business conditions came in at 25 in March versus 17 in February. The Westpac Consumer Confidence Index for April rose 6.2% month-on-month to 118.8, highest since August 2010. The labor recovery remains on track. 71K new jobs were added in March versus expectations of 35K. The unemployment rate also fell from 5.8% to 5.6%. The Australian dollar remained flat against the US dollar this week. However, the recent robust data, soaring terms of trade, and high bond yields make AUD/USD a suitable recovery trade. That said, given Mexico’s proximity to the US where recent economic data are strong, we are short the AUD/MXN pair. Report Links: The Dollar Bull Case Will Soon Fade - March 5, 2021 Portfolio And Model Review - February 5, 2021 Australia: Regime Change For Bond Yields & The Currency? - January 20, 2021 New Zealand Dollar Chart II-11NZD Technicals 1
NZD Technicals 1
NZD Technicals 1
Chart II-12NZD Technicals 2
NZD Technicals 2
NZD Technicals 2
The was scant data out of New Zealand this week: RBNZ held the official cash rate at 0.25% and its asset purchase program steady against a backdrop of a heated housing market, citing uncertainty over the outlook for growth. The NZIERB Business Confidence came in at -13% for Q1 versus -6% in Q4, a first decline in four quarters. The New Zealand dollar remained flat against the US dollar this week. On the day of the rate announcement, NZD rallied while the OIS curve flattened, which is a perplexing development. We believe the OIS curve had the appropriate response. Near term upside risk for Kiwi is the planned travel bubble with Australia. We are long the AUD/NZD. Report Links: Portfolio And Model Review - February 5, 2021 Currencies And The Value-Versus-Growth Debate - July 10, 2020 Updating Our Balance Of Payments Monitor - November 29, 2019 Canadian Dollar Chart II-13CAD Technicals 1
CAD Technicals 1
CAD Technicals 1
Chart II-14CAD Technicals 2
CAD Technicals 2
CAD Technicals 2
The recent data out of Canada have been strong: The Bank of Canada Business Outlook Survey was robust. The sentiment indicator recorded 2.87 in Q1, up from 1.3 in Q4 and highest since 2018. The March employment report was blockbuster. There were 303K new jobs versus an expectation of 100K. The split between part-time and full-time was healthy, 175K versus 128K. This brought down the unemployment rate to 7.5% in March, beating both forecasts and the February reading of 8.2%. The Canadian dollar rose by 0.3% against the US dollar this week. We spend some time in the front section discussing the Canadian dollar, which could be a little vulnerable in the short term, but could touch 84 cents in the coming 12-months. Report Links: Will The Canadian Recovery Lead Or Lag The Global Cycle? - February 12, 2021 Currencies And The Value-Versus-Growth Debate - July 10, 2020 More On Competitive Devaluations, The CAD And The SEK - May 1, 2020 Swiss Franc Chart II-15CHF Technicals 1
CHF Technicals 1
CHF Technicals 1
Chart II-16CHF Technicals 2
CHF Technicals 2
CHF Technicals 2
There was scant data out of Switzerland this week: The unemployment reading was 3.3% in March, lower than both the forecast and prior month. The Swiss franc was flat against the US dollar this week, remaining a top performer amongst the G10 currencies in April. As we indicated in last week’s report, the Franc may be due for a rebound after its underperformance in the first three months this year. While the CHF may continue its appreciation against the US dollar, we are long EUR/CHF on valuations concern, but are maintaining tight stops at 1.095. Our USD/CHF intermediate-term indicator is also due for a reversal. Report Links: Portfolio And Model Review - February 5, 2021 The Dollar Conundrum And Protection - November 6, 2020 On The DXY Breakout, Euro, And Swiss Franc - February 21, 2020 Norwegian Krone Chart II-17NOK Technicals 1
NOK Technicals 1
NOK Technicals 1
Chart II-18NOK Technicals 2
NOK Technicals 2
NOK Technicals 2
The recent data out of Norway have been mixed: GDP in February fell by 0.5% month-on-month. House prices increased by 3.4% quarter-on-quarter in Q1. March CPI came in at 3.1% year-on-year, versus expectations of a 3.4% increase. CPI disappointment was driven mainly by a 0.6% month-on-month decline in consumer goods prices. The Norwegian krone remained flat against the US dollar this week. Despite the Norges Bank’s expected rate hike this year, the earliest amongst the G10 nations, the NOK may see near term downside risks given the weak inflation data this month and the potential weakening in oil prices due to renewed virus lockdowns globally. Strategically we remain long NOK along with SEK for an eventual decline in the dollar. Report Links: Portfolio And Model Review - February 5, 2021 Revisiting Our High-Conviction Trades - September 11, 2020 A New Paradigm For Petrocurrencies - April 10, 2020 Swedish Krona Chart II-19SEK Technicals 1
SEK Technicals 1
SEK Technicals 1
Chart II-20SEK Technicals 2
SEK Technicals 2
SEK Technicals 2
The recent inflation data out of Sweden have been strong: The CPIF measure, favored by the Riksbank, rose 1.9% year-on-year versus the 1.5% increase in February. The rise was only was 1.4% ex-energy, but most inflation measures have rebounded powerfully from the 2020 lows. The Swedish krona, up by 1.4% against US dollar this week, was a top performing G10 currency both this week and in April. The 5-year and 10-year inflation swaps remain well anchored above the 2% level, suggesting markets are not regarding the increase in Swedish inflation as transitory. This could bring forward rate hike expectations. The higher 2-year real yield in Sweden versus US, due to higher US inflation, will also support the SEK. However, new Covid-19 cases remain a concern. Report Links: Revisiting Our High-Conviction Trades - September 11, 2020 Updating Our Balance Of Payments Monitor - November 29, 2019 Where To Next For The US Dollar? - June 7, 2019 Trades & Forecasts Forecast Summary Core Portfolio Tactical Trades Limit Orders Closed Trades
Set A Downgrade Alert On Financials
Set A Downgrade Alert On Financials
One week following the Pfizer/BioNTech vaccine efficacy news, we boosted the S&P financials sector to overweight and since then financials have bested the SPX by 13%, an impressive run. However, the euphoria surrounding the reopening trade, which the bond market’s sell off best captures, has hit a wall of late, and not only have yields settled lower, but financials stocks have also come off the boil (top panel). Given that financials equities represent the nervous system of the US economy this soft-patch raises the question: is this a genuine pause for breath or have relative share prices already discounted all the good news including the third mega fiscal package announced over the past four months? What is slightly unnerving is that other high frequency economic reopening indicators also wave yellow flags. The value/growth style bias has fallen to a level consistent with a 10-year US Treasury yield near the early January 1.10% breakout level, the small/large size bias has made a mini lamda (Λ) formation and even our long “Back-To-Work”/short “COVID-19 Winners” pair trade is grinding lower (second, third & bottom panels). While the jury is still out, we want to lean on the side of caution and protect handsome profits accrued to our portfolio since the mid-November inception, and thus put the sector on our downgrade watch list and set a trailing stop at the 10% return mark. Bottom Line: Put the S&P financials sector on downgrade alert and set a trailing stop at the 10% return mark. Stay tuned.
Highlights Geopolitical risk is rising once again after a big drop-off in risk during the pandemic and snapback. The Biden administration faces three critical foreign policy tests: China/Taiwan, Russia/Ukraine, and Israel/Iran. Russia could stage a military incursion into Ukraine that would cause a risk-off event. However, global markets would get over it relatively quickly since a total invasion of all Ukraine is unlikely. Iran is nearing the “breakout” threshold of uranium enrichment which will prompt more Israeli demonstrations of its red line against nuclear weaponization. Iran will retaliate. So far our view is on track that tensions will escalate prior to the resolution of a US-Iran deal by August. Taiwan is the most market relevant of all geopolitical risks – but the South China Sea is another scene of US-China saber-rattling. A crisis here is most important if connected to Taiwan. Go long CAD-RUB and CHF-GBP. Feature Chart 1Traffic In The World’s Most Dire Straits
Jaw-Jaw Or War-War?
Jaw-Jaw Or War-War?
British Prime Minister Harold Macmillan, quoting Sir Winston Churchill, once said, “Jaw-jaw is better than war-war.”1 President Joe Biden would undoubtedly prefer jaw-jaw as he faces three imminent foreign policy tests that raise tail-risks of war: Chinese military intimidation of Taiwan, a Russian military build-up on the Ukrainian border, and Iranian acceleration of its nuclear program. All of these areas are heating up simultaneously and a crisis incident could easily occur, causing a pullback in bond yields and equity markets. One way of illustrating the seriousness of these conflicts is to look at the volume of global trade that goes through the relevant geographic chokepoints: the Taiwan Strait, the Strait of Malacca, the Strait of Hormuz, and the Bosphorus Strait (Chart 1). Oil and petroleum products serve as a proxy for overall traffic. The recent, short-lived blockage of the Suez Canal provides an inkling of the magnitude of disruption that is possible if conflict erupts in one of these global bottlenecks. In this report we review recent developments in Biden’s foreign policy tests. Our views are mostly on track. Investors should prepare tactically for more geopolitical risk to be priced into global financial markets, motivating safe-haven flows and potentially a general equity pullback. Cyclically the bull market will continue, barring the worst-case scenarios. Biden’s Three Foreign Policy Tests Biden’s three foreign policy tests are all intensifying as we go to press: China/Taiwan: China is continuing a high-intensity pace of “combat drills” and live-fire drills around the island of Taiwan.2 The US is sending a diplomatic delegation to Taiwan against Beijing’s wishes and is set to deliver a relatively large arms sale to the island. Yet Washington has sent John Kerry, its “climate czar,” to Beijing to set up a bilateral summit between Presidents Biden and Xi Jinping for Earth Day, in a bid to find common ground. Biden’s overarching review of US China policy is due sometime in May. Russia/Ukraine: Russia has amassed more than 85,000 troops on its border with Ukraine and in Crimea, the largest build-up since it invaded Ukraine in 2014-15. Russia has withdrawn its ambassador to Washington and warned that it will retaliate if the US imposes any new sanctions. The US is doing just that, with new sanctions leveled in response to Russian cyberattacks and election interference, including a block on sales of Russian ruble-denominated sovereign bonds from June. Hence Russian retaliation is looming. Israel/Iran: Shortly after the March 23 election, Israel sabotaged the underground Natanz Fuel Enrichment Plant in Iran, prompting the Iranians to declare that they will retaliate on Israeli soil. They also claim they will now enrich uranium to a 60% level, which pushes them close to the 90%-plus levels needed to make a nuclear device. American and Israeli officials had previously signaled that Iran would reach “breakout” levels of weapons-grade uranium between April and August. Negotiations are underway but the process will be beset by attacks. We have written extensively on the Taiwan dynamic this year as it is the most relevant for global investors. In this report we will update the Russian and Iranian situations first and then proceed to China. Bottom Line: Geopolitical risk is back after a reprieve during the pandemic. The new US administration faces three serious foreign policy tests at once. Financial markets have mostly ignored the rise in tensions but we expect safe-haven assets to catch a bid in the near term. However, we have not yet altered our bullish cyclical view. So far we are still in the realm of “jaw-jaw” rather than “war-war,” as we explain in the rest of this report. Stay Short Russia And EM Europe The return of the Democratic Party to power in Washington has led to an immediate increase in US-Russian tensions. The Biden administration is eschewing a diplomatic reset and instead pursuing great power competition. The US is increasing its arms sales and NATO military drills with Ukraine. It is imposing sanctions over Russian cyberattacks and election interference, including taking a long-awaited step against the purchase of ruble bonds. Washington could also force Germany to cancel the Nord Stream II pipeline. However, there are also mitigating signs. President Biden has offered to hold a bilateral summit with President Vladimir Putin in a third country and the two may meet at his Earth Day summit. The US Navy also called back the USS Donald Cook and USS Roosevelt destroyers from going into the Black Sea, after Moscow warned that any American warships in that sea would be in danger, especially if they go near Crimea. Washington’s new volley of sanctions are not truly tantamount to Russian interference in American elections and they do not include new measures on Nord Stream II. An American move to insist that Germany cancel Nord Stream before construction ends would provoke Russia to retaliate. The purpose of Nord Stream is to bypass Ukraine and cement direct economic ties between Russia and Germany. Germany’s government continues to support the project despite Russia’s build-up on the border with Ukraine and suppression of political dissidents. If the US vetoes the pipeline then it is denying Russia access to legitimate trade and restricting Russia’s export options to the Ukrainian route. If the US simultaneously increases military cooperation with Ukraine then it is implicitly trying to control Russia’s energy access to Europe. Russia will likely retaliate by punishing Ukraine. Russia could take aggressive action in Ukraine or elsewhere regardless of what the US does on Nord Stream or in its Ukraine outreach. Russia is struggling with a weak domestic economy and social unrest. Moscow has a record of foreign adventurism when popular support wanes. Moreover legislative elections loom in September. Thus Russia may have an independent reason to stir up conflict in Ukraine, at least for the next half year, that cannot be deterred. Judging by capabilities, Russia has deployed enough troops to stage a military incursion into the breakaway Donbass region of Ukraine. The Russian army build-up on the border is the largest since 2014 – large enough to put most of Russian-speaking Ukraine at risk. A full-scale Russian invasion of all of Ukraine is unlikely but not impossible. It would be extremely costly both in blood and treasure – not only in occupying a hostile Ukraine but also in unifying the West against Russia, the opposite of what Moscow is trying to accomplish (Chart 2). Moscow will want to avoid this outcome unless the US shuts down Nord Stream or tries to bring Ukraine into NATO. Chart 2Russia’s Constraints Over Ukraine
Jaw-Jaw Or War-War?
Jaw-Jaw Or War-War?
From the market’s point of view, intensified fighting in Ukraine between the government and Russian-backed rebels is status quo. This is inevitable and will not have a major impact on global equities. The invasion of Crimea in 2014 led to a maximum 2% drawdown in the S&P 500. It was the shooting down of Malaysian Airline 17, not Russia’s invasion of Ukraine, that shook up financial markets in 2014. Global equities fell by 2.7%, Eurostoxx 500 by 6.2% and Russian equities by 10.7%. Note that the Russian military did ultimately participate in the fighting in 2014-15, it was not only Russian-backed separatists, so global financial markets can stomach that kind of conflict fairly well as long as it is limited to Ukraine, especially disputed regions, and as long as the US and NATO do not get involved. They are disinclined to fight for Ukraine, leaving it vulnerable. A larger flight to safety would occur if Russia pursued the total conquest of all of Ukraine. This is small probability but high impact. It would cause a major global risk-off because it would raise the risk of a larger war on the continent for the first time since World War II. Russia is obsessed with Ukraine from the point of view of grand strategy and national security and will take at least some military action if it deems it necessary. Investors should be prepared for escalation – though neither Washington nor Moscow has yet taken a fatal step. It is important to watch for any aggressive Ukrainian actions but Ukraine is not the main driver of action. The current situation is reminiscent of that in the Republic of Georgia in 2008, when Russia provoked President Mikhail Saakashvili into taking action against separatists that Russia then used as a pretext for intervening and breaking away Abkhazia and South Ossetia. While Ukrainian President Volodymyr Zelenskiy could be baited into a conflict, it is also true that fear of getting baited could result in hesitation that allows Russia to seize the initiative, as occurred in Ukraine in 2014. So for the Ukrainians it is “damned if you do, damned if you don’t.” Russia’s actions will largely depend on its own interests. So far Russian equities have lagged other emerging market equities and the commodity rally, which may partly reflect elevated political and geopolitical risk (Chart 3). The trend for Russian equities can easily get worse from here. Given Russia’s interest in conflict with the West ahead of the September elections, Russian-Ukrainian tensions could persist for most of this year. A major military campaign becomes more probable after mid-May when the weather improves. Russian currency and assets will remain under pressure. We recommend going long the Canadian dollar relative to the Russian ruble. The ruble will underperform commodity currencies as a whole, including the Mexican peso, if Russia intervenes militarily, judging by the Crimea conflict in 2014 (Chart 4). Meanwhile Canadian and Mexican currencies should benefit from the fact that the US economy is hyper-stimulated and rapidly vaccinating. Chart 3Russia Lagged Commodity Rally
Russia Lagged Commodity Rally
Russia Lagged Commodity Rally
Chart 4Favor Loonie And Peso Over Ruble
Favor Loonie And Peso Over Ruble
Favor Loonie And Peso Over Ruble
Chart 5Long DM Europe / Short EM Europe
Long DM Europe / Short EM Europe
Long DM Europe / Short EM Europe
We continue to overweight developed Europe and underweight emerging Europe (Chart 5). Poland, Hungary, the Czech Republic, Romania, and the Baltic states will see a risk premium due to current tensions. The Czech Republic faces considerable political uncertainty surrounding its legislative election in October, an opportunity for Russia to interfere or for anti-establishment (albeit pro-EU) parties to rise to power. What would it take for Biden and Putin to de-escalate? The US and NATO could diminish Ukraine relations, downgrade democracy promotion and psychological counter-warfare, and allow Nord Stream to be completed. Russia could reduce its troop presence on the border and lend a helping hand on the Iranian nuclear deal and Afghanistan withdrawal. This is a risk to our view. Bottom Line: Russia and emerging European markets are some of the few truly cheap markets in the emerging market equity universe (Table 1). Yet the current geopolitical context looks to keep them cheap. For now investors should be prepared for the West’s conflict with Russia to escalate in a major way. At minimum we need to know whether the US will halt Nord Stream II’s construction before taking a more bullish view on EM Europe. Table 1Geopolitical Risk Helps Keep Russia And EM Europe Cheap
Jaw-Jaw Or War-War?
Jaw-Jaw Or War-War?
The worst-case scenario of a full-blown Russian conquest of Ukraine has a small probability but cannot be ruled out. Iran Negotiations: First Explosions, Then A Nuclear Deal Israel has not put together a government after its March 23 election, although Prime Minister Benjamin Netanyahu has the opportunity to lead a government again which means no change in national policy so far. Moreover the Israeli public and political establishment are unified in their opposition to Iran’s regional and nuclear ambitions. Immediately after the Iranians inaugurated new centrifuges at the Natanz nuclear facility, on April 11, the Israelis allegedly sabotaged the facility underground facility in an attack that was supposedly not limited to cyber means and that deactivated a range of centrifuges. An Iranian scientist fell into a crater and hurt himself. The Iranians have vowed retaliation on Israeli soil. More fundamentally their politics are shifting in a hardline direction, to be confirmed with the election of a hawkish president in June, which will exacerbate the mutual antagonism. This power transition is a major reason we have identified the inauguration in August as a key deadline for the US to rejoin the 2015 nuclear deal (the Joint Comprehensive Plan of Action). If the Biden administration cannot get it done by that time then a much more dangerous, multi-year negotiation will get underway. The Israeli attack has not stopped negotiations in the short term, however. The second round of talks begins in Vienna as we go to press. The US has also confirmed it will withdraw from Afghanistan on September 11, which says to Iran that Biden is determined to reduce the US’s strategic footprint in the region, reinforcing the US desire for a deal. The Israelis will continue to underscore their red line against the Iranian nuclear and missile programs in the coming months through clandestine attacks. However, they were not able to stop the US from signing a nuclear deal with Iran in 2015 and they are not likely to stop the US today. They are still bound by a fundamental constraint. Israel needs to maintain its alliance with the United States, which ensures its long-term security against both Iran and the Middle East’s general instability (Chart 6). The Iranians will retaliate against Israel, making it likely that this summer will feature tit-for-tat attacks. These could include critical infrastructure. Iran may also continue its campaign against enemies in Iraq and Saudi Arabia, thus triggering unplanned oil outages and pushing up the oil price. A glance at Israeli, Saudi Arabian, and UAE stock markets suggests that global investors have largely ignored the geopolitical risks so far but may be starting to respond to the likely escalation in conflict prior to any US-Iran deal (Chart 7). Chart 6Israel’s Constraints Over Iran
Jaw-Jaw Or War-War?
Jaw-Jaw Or War-War?
The US, Germany, France, Russia, and China are all officially on board with getting the Iranians back into compliance with the deal. A return to compliance would need to be phased with US sanctions relief. The Iranians demand that the US ease sanctions first, since it was the US that unilaterally walked away from the deal and re-imposed sanctions in 2018. Chart 7Saudi, UAE, Israeli Stocks Signal Danger
Saudi, UAE, Israeli Stocks Signal Danger
Saudi, UAE, Israeli Stocks Signal Danger
Ultimately Biden is capable of making the first move since the American public shows very little concern about Iran. Biden himself is acting on behalf of a strong consensus in Washington that an Iranian deal is necessary to stabilize the region and enable the US to devote more strategic attention to Asia Pacific. Will Russia and China support the Iranian deal, given their simultaneous conflicts with the United States? As long as the US and Iran are satisfied with returning to the existing deal – which begins to expire in 2025 – there is little need for Russia or China to do anything. However, if Washington wants a better deal, then it will have to make major concessions to Moscow and Beijing. A new and better deal would require years to negotiate. Chart 8Russo-Chinese Cooperation Grows
Jaw-Jaw Or War-War?
Jaw-Jaw Or War-War?
Russia and China supported the original nuclear deal because they saw an opportunity to limit the proliferation of nuclear weapons, which dilutes their own power. A Middle Eastern nuclear arms race is not in their interest. Iran is also a useful strategic partner for Russia and China in the Middle East and they are not averse to seeing Iran’s economy grow stronger in order to perpetuate its regime. They are wagering that liberalization of the Iranian economy will not result in liberalization of its politics – it certainly did not in the case of Russia or China – and therefore they will still have an ally but it will be more economically sound and influential. The Russo-Chinese strategic partnership has grown dramatically over the past decade. Both countries share an interest in undermining US global leadership and stoking American internal divisions. Both share an interest in reducing the US military presence near their borders, particularly in strategic territories and seas that they consider essential to their security and political legitimacy. Russia increasingly depends on Chinese demand for its exports and Chinese investment for developing its resources. Neither country trusts the other’s currency for trade but both have a shared interest in diversifying away from the US dollar (Chart 8). Chart 9China Offers Helping Hand On Iran?
China Offers Helping Hand On Iran?
China Offers Helping Hand On Iran?
In cooperating with the US on Iran, Russia and China will expect the US to respect their demands on strategic areas much closer to their core interests. If the Biden administration continues to upgrade its trade and defense relations with Ukraine and Taiwan then Moscow and Beijing will push back aggressively and could at that point prevent or undermine any deal with Iran. China is at least officially enforce sanctions on Iran (Chart 9). Its strategic partnership with Iran is constantly in a state of negotiation – until the US clarifies its sanctions regime. Clearly China hopes to extract concessions from the Americans for cooperation on nuclear threats. This is also the case with North Korea, where a missile crisis would be useful for China’s purposes in creating the need for Chinese arbitration. China sees a chance to persuade Biden to remove restrictions imposed by President Trump. If the Biden administration’s hawkishness on China is confirmed in the coming months, then China’s willingness to cooperate will presumably change. Bottom Line: Israel is underscoring its red lines against Iranian nuclear weaponization and this will cause an increase in conflict this spring and summer. But it is not yet preventing the US and Iran from renegotiating the 2015 nuclear deal. We still expect Biden to agree to a deal by August. Taiwan And The South China Sea For global financial markets the most important test facing Biden lies in the US-China relationship and tensions over the Taiwan Strait. We will not rehash our recent research and arguments on this issue. Suffice it to say that we see a 60% chance of some kind of crisis over the next 12-24 months, including a 5% chance of full-scale war. The odds of total war can rise rapidly in the event of domestic Chinese instability, a game-changing US arms sale, or a Taiwanese declaration of independence. The greatest deterrent to a full Chinese attack on Taiwan – the reason for our current 5% odds – is that it would result in a devastating blowback against the Chinese economy. China’s trade with the developed world, in addition to Taiwan, makes up 63% of exports, or 11% of GDP (Chart 10). Beijing is ultimately willing to pay this price – or any price – to “unify” the country. But it will not do so frivolously. Each passing year gives China greater global economic leverage and greater military capability over Taiwan. Chart 10China’s Constraints Over Taiwan
Jaw-Jaw Or War-War?
Jaw-Jaw Or War-War?
China is increasing its purchases of US treasuries, which waned during the trade war (Chart 11). China often increases purchases when interest rates rise and markets have seen a rapid increase in treasury yields since the vaccine discovery in November. There is no indication from this point of view that China is preparing for outright war with the United States, although this is admittedly a limited measure that could be misleading. What about a crisis other than war? What do we mean when we say “some kind of crisis” over Taiwan? A major gray zone would be economic sanctions or an economic embargo. While China cut back on tourism after Taiwan’s nominally pro-independence party won the election in 2016, and all tourism ground to a halt with COVID-19, there is no evidence of a broader embargo so far (Chart 12). This could change overnight. While US law forbids an embargo on Taiwan, this is precisely an area where Beijing might wish to test the US’s commitment. Chart 11China Buys More US Treasuries
China Buys More US Treasuries
China Buys More US Treasuries
The current high pressure on Taiwan stems in large part from the confluence of new US export controls and the global semiconductor shortage. China cannot yet meet its domestic demand for semiconductors and it cannot develop advanced computer chips fast enough without the US and its allies (Chart 13). Chart 12No Embargo On Taiwan (Yet)
No Embargo On Taiwan (Yet)
No Embargo On Taiwan (Yet)
If the Biden administration pursues a full technological blockade then China may be forced to take tougher action on Taiwan. But if Biden pursues a more defensive strategy then a new equilibrium will develop that spares China the risks of war. Chart 13China's Demand For Semiconductors
China's Demand For Semiconductors
China's Demand For Semiconductors
The US and China are simultaneously escalating their naval confrontation in the South China Sea, particularly around the Philippines. US and Chinese aircraft carrier groups and other ships have been circling each other as Beijing attempts to intimidate the Philippines and shake its trust in the defense treaty with the US. China claims the South China Sea as its own – and its efforts to deny the US access will be met with US assertions of freedom of navigation, which could lead to sunken ships. The strategic importance of the South China Sea is similar to that of the Taiwan Strait: Chinese control of these bodies of water would threaten Taiwan’s, Japan’s, and South Korea’s supply security while weakening America’s strategic position in the region. We have long highlighted the elevated risks of proxy war for Vietnam and the Philippines but these are hardly issues of global concern compared with Northeast Asia’s security. While Taiwan is far more relevant to global investors, due to the semiconductor issue, there are ample opportunities for a crisis to erupt in the South China Sea. A crisis in this sea cannot be dismissed as marginal because it could involve direct US-China conflict or, worst case, it could be a prelude to action on Taiwan, as China would seek to control the approaches to the island. The final risk in this region is that North Korea has restarted ballistic missile tests. As stated above, a crisis would be well-timed from China’s point of view. For investors, however, North Korea is largely a distraction from the critical Taiwan Strait. It could feed into any risk-off sentiment. Bottom Line: US-China relations are still unsettled and a clash could emerge over the South China Sea and Korean peninsula just as it could emerge over the Taiwan Strait. The Taiwan Strait remains the most significant geography. A direct US-China clash in the South China Sea could cause a global selloff but the markets would recover quickly, unless it is linked to a conflict over Taiwan. Investment Takeaways Geopolitical risk is reviving after a reprieve during the COVID-19 pandemic. That does not mean that frictions will lead straight into war. Diplomacy is possible. If the US, China, Russia, and Iran choose “jaw-jaw” over “war-war” then the global equity rally will see another leg up. From a tactical point of view, however, our arguments above should demonstrate that at least one of Biden’s early foreign policy tests is likely to escalate into a geopolitical incident that prompts negative impacts either in regional or global equity markets. Markets are not prepared for these risks to materialize. Standard measures of global policy uncertainty have fallen sharply for most countries. It is notable that two of the few countries in the world seeing rising policy uncertainty are China and Russia. The latter is likely due to domestic instability – which is a major motivator for an aggressive foreign policy (Chart 14). Chart 14AGlobal Policy Uncertainty Will Revive
Global Policy Uncertainty Will Revive
Global Policy Uncertainty Will Revive
Chart 14BGlobal Policy Uncertainty Will Revive
Global Policy Uncertainty Will Revive
Global Policy Uncertainty Will Revive
Global fiscal stimulus remains exceedingly strong – it is likely to peak this year. Chart 15 shows the latest update in fiscal stimulus for select countries, comparing the COVID-19 crisis to the 2008 financial crisis. There are some notable changes to previous versions of this chart, mostly due to revisions in GDP after last year’s shock, revisions in tax revenues due to the rapid economic snapback, and revisions to the timing and size of stimulus packages. The Biden administration’s $2.3 trillion infrastructure plan is obviously not included. The second panel of Chart 15 shows the changes in the IMF’s estimates from October 2020 to April 2021. Essentially the fiscal stimulus in 2020 was overestimated, as many measures did not kick in and the economic snapback was better than expected, whereas the 2021 stimulus is larger than expected. Russia and China are notable for tightening policy sooner than others – leading to a reduction in IMF estimates of fiscal stimulus for both years. Chart 15Revising Our Global Fiscal Stimulus Chart
Jaw-Jaw Or War-War?
Jaw-Jaw Or War-War?
Commodities have been a major beneficiary of the global recovery (Chart 16). Chinese growth is likely to decelerate this year which will spark a pullback, even aside from geopolitical crises. However, from a cyclical perspective commodities, especially industrial metals, should benefit from limited supply and surging demand. Geopolitical crises and even wars would first be negative but then positive for metals. Chart 16Commodities To Benefit From Geopolitical Conflict
Commodities To Benefit From Geopolitical Conflict
Commodities To Benefit From Geopolitical Conflict
Notably the US is embracing industrial policy alongside China and the EU. In particular the US is joining the green energy race with Biden’s $2.3 trillion American Jobs Plan containing about $370 billion in green initiatives and likely to pass Congress later this year. Symbolically Biden will emphasize the US’s attempt to catch up with Chinese and European green initiatives via his hosting of a global summit on April 22-23 for Earth Day. A brief word on the British pound. We took a tactical pause on our cyclically bullish view of the pound in February in anticipation of the Scottish parliamentary election on May 6. A strong showing by the Scottish National Party could lead to a second independence referendum. This party is flagging in the polls but independence sentiment has ticked back up, reinforcing our point that a nationalist surprise could take place at the ballot box (Chart 17). Once we have clarity on the prospect of a second referendum we will have a clearer view on the pound over the medium term. Chart 17Pound Sees Short-Term Risk From Scots Election
Pound Sees Short-Term Risk From Scots Election
Pound Sees Short-Term Risk From Scots Election
Chart 18Long CHF-GBP For A Tactical Trade
Long CHF-GBP For A Tactical Trade
Long CHF-GBP For A Tactical Trade
In the near term, we continue to pursue tactical safe-haven trades and hedges. Our tactical long Swiss franc trade was stopped out at 5% on March 25. But our Foreign Exchange Strategist Chester Ntonifor has since highlighted that the franc is excessively cheap (Chart 18). This time we recommend a tactical long CHF-GBP, which has an attractive profile in the context of geopolitical risk, taken together with the British political risk highlighted above. Matt Gertken Vice President Geopolitical Strategy mattg@bcaresearch.com Footnotes 1 “Jaw-Jaw Is Best, Macmillan Finds,” New York Times, January 30, 1958, nytimes.com. 2 Taiwan – Province of China.
TSMC’s earnings report beat analyst expectations on Thursday with Q1 EPS at 5.4 versus an anticipated 5.3. The world’s largest chipmaker also warned that the chip shortage could continue into 2022 and raised its capex plans to $25-28 billion, a 60% increase…
US retail sales rebounded sharply in March, accelerating 9.8% m/m after weather-related disruptions led to a 2.7% drop in February. The report was strong across the board and showed improvements in all 13 categories. The latest round of stimulus checks…
Highlights Stronger global growth in the wake of continued and expected fiscal and monetary stimulus, and progress against COVID-19 are boosting oil demand assumptions by the major data suppliers for this year. We lifted our 2021 global demand estimate by 640k b/d to 98.25mm b/d, and assume OPEC 2.0 will make the necessary adjustments to keep Brent prices closer to $60/bbl than not, so as not to disrupt a fragile recovery. We are maintaining our 2022 and 2023 Brent forecasts at $65/bbl and $75/bbl. Commodity markets are ignoring the rising odds of armed conflict involving the US, Russia and China and their clients and allies. Russia has massed troops on Ukraine’s border and warned the US not to interfere. China has massed warships off the coast of the Philippines, and continues its incursions in Taiwan’s air-defense zone, keeping US forces on alert. Intentional or accidental engagement would spike oil prices. Two-way price risk abounds. In addition to the risk of armed hostilities, faster distribution of vaccines would accelerate recovery and boost prices above our forecasts. Downside risk of a resurgence in COVID-19-induced lockdowns remains, as rising death and hospitalization rates in Brazil, India and Europe attest (Chart of the Week). Feature Oil-demand estimates – ours included – are reviving in the wake of measurable progress in combating the COVID-19 pandemic in major economies, and an abundance of fiscal and monetary stimulus, particularly out of the US.1 On the back of higher IMF GDP projections, we lifted our 2021 global demand estimate by 640k b/d to 98.25mm b/d in this month’s balances. In our modeling, we assume OPEC 2.0 will make the necessary adjustments to keep Brent prices closer to $60/bbl than not, so as not to disrupt a fragile recovery. In an unusual turn of events, the early stages of the recovery in oil demand will be led by DM markets, which we proxy using OECD oil consumption (Chart 2). Thereafter, EM economies, re-take the growth lead next year and into 2023. Chart of the WeekCOVID-19 Deaths, Hospitalizations Threaten Global Recovery
Upside Oil Price Risks Are Increasing
Upside Oil Price Risks Are Increasing
Chart 2DM Demand Surges This Year
DM Demand Surges This Year
DM Demand Surges This Year
Absorbing OPEC 2.0 Spare Capacity We continue to model OPEC 2.0, the producer coalition led by the Kingdom of Saudi Arabia (KSA) and Russia, as the dominant producer in the market. The growth we are expecting this year will absorb a significant share of OPEC 2.0’s spare capacity, most of which – ~ 6mm b/d of the ~ 8mm b/d – is to be found in KSA (Chart 3). The core producers’ spare capacity allows them to meet recovering demand faster than the US shale producers can mobilize rigs and crews and get new supply into gathering lines and on to main lines. We model the US shale producers as a price-taking cohort, who will produce whatever the market allows them to produce. After falling to 9.22mm b/d in 2020, we expect US production to recover to 9.56mm b/d this year, 10.65mm b/d in 2022, and 11.18mm in 2023 (Chart 4). Lower 48 production growth in the US will be led by the shales, which will account for ~ 80% of total US output each year. Chart 3Core OPEC 2.0 Spare Capacity Will Respond First To Higher Demand
Core OPEC 2.0 Spare Capacity Will Respond First To Higher Demand
Core OPEC 2.0 Spare Capacity Will Respond First To Higher Demand
Chart 4Shale Is The Marginal Barrel In The Price Taking Cohort
Shale Is The Marginal Barrel In The Price Taking Cohort
Shale Is The Marginal Barrel In The Price Taking Cohort
OPEC 2.0’s dominant position on the supply side allows it to capture economic rents before non-coalition producers, which will remain a disincentive to them until the spare capacity is exhausted. Thereafter, the price-taking cohort likely will fund much of its E+P activities out of retained earnings, given their limited ability to attract capital. Equity investors will continue to demand dividends that can be maintained and grown, or return of capital via share buybacks. This will restrain production growth to those firms that are profitable. We expect the OPEC 2.0 coalition’s production discipline will keep supply levels just below demand so that inventories continue to fall, just as they have done during the COVID-19 pandemic, despite the demand destruction it caused (Chart 5). These modeling assumptions lead us to continue to expect supply and demand will continue to move toward balance into 2023 (Table 1). Chart 5Supply-Demand Balances in 2021
Supply-Demand Balances in 2021
Supply-Demand Balances in 2021
Table 1BCA Global Oil Supply - Demand Balances (MMb/d, Base Case Balances)
Upside Oil Price Risks Are Increasing
Upside Oil Price Risks Are Increasing
We continue to expect this balancing to induce persistent physical deficits, which will keep inventories falling into 2023 (Chart 6). As inventories are drawn, OPEC 2.0’s dominant-producer position will allow it to will keep the Brent and WTI forward curves backwardated (Chart 7).2 We are maintaining our 2022 and 2023 Brent forecasts at $65/bbl and $75/bbl (Chart 8). Chart 6OPEC 2.0 Policy Continues To Keep Supply Below Demand...
OPEC 2.0 Policy Continues To Keep Supply Below Demand...
OPEC 2.0 Policy Continues To Keep Supply Below Demand...
Chart 7OECD Inventories Fall to 2023
OECD Inventories Fall to 2023
OECD Inventories Fall to 2023
Chart 8Brent Forecasts Rise As Global Economy Recovers
Brent Forecasts Rise As Global Economy Recovers
Brent Forecasts Rise As Global Economy Recovers
Two-Way Price Risk Abounds Risks to our views abound on the upside and the downside. To the upside, the example of the UK and the US in mobilizing its distribution of vaccines is instructive. Both states got off to a rough start, particularly the US, which did not seem to have a strategy in place as recently as January. After the US kicked its procurement and distribution into high gear its vaccination rates soared and now appear to be on track to deliver a “normal” Fourth of July holiday in the US. The UK has begun its reopening this week. Both states are expected to achieve herd immunity in 3Q21.3 The EU, which mishandled its procurement and distribution likely benefits from lessons learned in the UK and US and achieves herd immunity in 4Q21, according to McKinsey’s research. Any acceleration in this timetable likely would lead to stronger growth and higher oil prices. The next big task for the global community will be making vaccines available to EM economies, particularly those in which the pandemic is accelerating and providing the ideal setting for mutations and the spread of variants that could become difficult to contain. The risk of a resurgence in large-scale COVID-19-induced lockdowns remains, as rising death and hospitalization rates in Brazil, India and Europe attest. Cry Havoc The other big upside risk we see is armed conflict involving the US, Russia, China and their clients and allies. Commodity markets are ignoring these risks at present. Even though they do not rise to the level of war, the odds of kinetic engagement – planes being shot down or ships engaging in battle in the South China Sea – are rising on a daily basis. This is not unexpected, as our colleagues in BCA Research’s Geopolitical Strategy pointed out recently.4 Indeed, our GPS service, led by Matt Gertken, warned the Biden administration would be tested in this manner by Russia and China from the get-go. Russia has massed troops on Ukraine’s border and warned the US not to interfere. China has massed warships off the coast of the Philippines, and continues its incursions in Taiwan’s air-defense zone, keeping US forces on alert. Political dialogue between the US and Russia and the US and China is increasingly vitriolic, with no sign of any leavening in the near future. Intentional or accidental engagement could let slip the dogs of war and spike oil prices briefly. Finally, OPEC 2.0 is going to have to accommodate the “official” return of Iran as a bona fide oil exporter, if, as we expect, it is able to reinstate its nuclear deal – i.e., the Joint Comprehensive Plan of Action (JCPOA) – with Western states, which was abrogated by then-President Donald Trump in 2018. This may prove difficult, given our view that the oil-price collapse of 2014-16 was the result of the Saudis engineering a market-share war to tank prices, in an effort to deny Iran $100+ per-barrel prices that had prevailed between end-2010 and mid-2014. OPEC 2.0, particularly KSA, has not publicly involved itself in the US-Iran negotiations. However, it is worthwhile recalling that following the disastrous market-share war launched in 2014, KSA and the rest of OPEC 2.0 did accommodate Iran’s return to markets post-JCPOA. Robert P. Ryan Chief Commodity & Energy Strategist rryan@bcaresearch.com Ashwin Shyam Research Associate Commodity & Energy Strategy ashwin.shyam@bcaresearch.com Commodities Round-Up Energy: Bullish Brent and WTI prices rallied sharply following the release of the EIA’s Weekly Petroleum Status Report showing a 9.1mm-barrel decline in US crude and product stocks for the week ended 9 April 2021. This was led by a huge draw in commercial crude and distillate inventories (5.9mm barrels and 2.1mm barrels, respectively). These draws came on the back of generally bullish global demand upgrades by the major data services (EIA, IEA and OPEC) over the past week. These assessments were supported by EIA data showing refined-product demand – i.e., “product supplied” – jumped 1.1mm b/d for the week ended 9 April. With vaccine distributions picking up steam, despite setbacks on the Johnson & Johnson jab, the storage draws and improved demand appear to have catalyze the move higher. Continued weakness in the USD also provided a tailwind, as did falling real interest rates in the US. Base Metals: Bullish Nickel prices fell earlier this week, as China’s official Xinhua news agency reported that Chinese Premier, Li Keqiang stressed the need to strengthen raw materials’ market regulation, amidst rising commodities prices, which been pressuring corporate financial performance (Chart 9). This statement came after China’s top economic advisor, Liu He also called for authorities to track commodities prices last week. Nickel prices fell by around $500/ ton earlier this week on this news, and were trading at $16,114.5/MT on the London Metals exchange as of Tuesday’s close. Other base metals were not affected by this news. Precious Metals: Bullish The US dollar and 10-year treasury yields fell after March US inflation data was released earlier this week. US consumer prices rose by the most in nearly nine years. The demand for an inflation hedge, coupled with the falling US dollar and treasury yields, which reduce the opportunity cost of purchasing gold, caused gold prices to rise (Chart 10). This uncertainty, coupled with the increasing inflationary pressures due to the US fiscal stimulus will increase demand for gold. Spot COMEX gold prices were trading at $1,746.20/oz as of Tuesday’s close. Ags/Softs: Neutral The USDA reported ending stocks of corn in the US stood at 1.35 billion bushels, well below market estimates of 1.39 billion and the 1.50 billion-bushel estimate by the Department last month, according to agriculture.com’s tally. Global corn stocks ended at 283.9mm MT vs a market estimate of 284.5mm MT and a Department estimate of 287.6mm MT. Chart 9Base Metals Are Being Bullish
Base Metals Are Being Bullish
Base Metals Are Being Bullish
Chart 10Gold Prices To Rise
Gold Prices To Rise
Gold Prices To Rise
Footnotes 1 Please see US-Russia Pipeline Standoff Could Push LNG Prices Higher, which we published on 8 April 2021 re the IMF’s latest forecast for global growth. Briefly, the Fund raised its growth expectations for this year and next to 6% and 4.4%, respectively, nearly a full percentage-point increase versus its January forecast update for 2021 2 A backwardated forward curve – prompt prices trading in excess of deferred prices – is the market’s way of signaling tightness. It means refiners of crude oil value crude availability right now over availability a year from now. This is exactly the same dynamic that drives an investor to pay $1 today for a dollar bill delivered tomorrow than for that same dollar bill delivered a year from now (that might only fetch 98 cents today, e.g.). 3 Please see When will the COVID-19 pandemic end?, published 26 March 2021 by McKinsey & Co. 4 Please see The Arsenal Of Democracy, a prescient analysis published 2 April 2021 by BCA’s Geopolitical Strategy. The report notes the Biden administration “still faces early stress-tests on China/Taiwan, Russia, Iran, and even North Korea. Game theory helps explain why financial markets cannot ignore the 60% chance of a crisis in the Taiwan Strait. A full-fledged war is still low-probability, but Taiwan remains the world’s preeminent geopolitical risk.” Investment Views and Themes Recommendations Strategic Recommendations Tactical Trades Commodity Prices and Plays Reference Table Trades Closed in 2021 Summary of Closed Trades
Higher Inflation On The Way
Higher Inflation On The Way
Critical Condition
Critical Condition
Underweight (High-Conviction) Pharmaceutical stocks are melting in line with the broader macro-economic rebound, and given our cyclical and structural bullish market outlooks, we continue to recommend investors fade this defensive sector (CLI and ZEW shown inverted, middle & bottom panels). JNJ’s recent negative blood clotting vaccine news further accelerated the wholesale liquidation of this key health care sub-group. Should the number of vaccine-caused fatal cases rise, more and more countries will be banning this US-manufactured vaccine, putting additional earnings strains on drug stocks. As a reminder, we are currently underweight the S&P pharma index both within our cyclical and high-conviction universes and the positions are up 12.4% and 10%, respectively. Bottom Line: Stay underweight the S&P pharma index. The ticker symbols for the stocks in this index are: BLBG: S5PHAR – JNJ, PFE, MRK, LLY, BMY, ZTS, CTLT, VTRS, PRGO.
Highlights Biden will host a global summit for Earth Day on April 22-23, giving public attention to his climate change policy push. Investors should count on Biden’s green infrastructure package becoming the bulk of his climate push, given uncertainty over the 2022 midterm elections. However, over the long run, American public opinion is shifting in favor of renewables and the US will seek to maintain its technological edge via participating in the green tech race. Go long our “Biden Fiscal Advantage Basket” versus the Nasdaq 100. Feature The Biden administration’s $2.3 trillion American Jobs Plan is often referred to as a “green infrastructure” package and in this report we take a look at what makes it green – and what are the investment implications. Biden will virtually host a global climate summit on April 22-23, Earth Day, which the Chinese President Xi Jinping is expected to attend, thus providing momentum to the green investment theme. The stock market anticipated Biden’s electoral victory last year and renewable energy stocks rallied exorbitantly, with ultra-easy monetary and fiscal policy as a fundamental support. The market’s reaction to Biden’s official outline of his plan last month suggests that investors are energized about Biden’s infrastructure package but already suffering from some green fatigue (Chart 1). However, this bill’s passage will initiate the US’s official entrance into the global green energy race and from that point of view renewable plays should recover. Once the American Jobs Plan passes, likely sometime this fall, Biden’s climate agenda will be virtually finished, from an investment perspective. Investors have little visibility beyond 2022 as the president’s party rarely hangs onto the House of Representatives in his first midterm election. However, over the long run, American public opinion is shifting in favor of renewable energy. And Biden also has regulatory tools to push the Democratic Party’s climate agenda from 2022-24 regardless. Chart 1Biden's AJP Already Priced
Biden's AJP Already Priced
Biden's AJP Already Priced
Chart 2Biden’s First Budget: Boom In Non-Defense Discretionary Spending
Biden's Green Initiatives
Biden's Green Initiatives
Biden’s first presidential budget, released on April 13, also highlights the US’s attempt to boost climate policy (the Environmental Protection Agency’s funding would go up by 21%). More broadly it highlights the US’s ongoing sea change in fiscal policy. Discretionary spending turned around under President Trump’s populism and will continue under Biden’s populism. The difference lies in social spending versus defense. Biden proposes a 15.2% increase in non-defense discretionary spending, with education, commerce, health, and environment while the departments of defense and justice see much smaller increases (Chart 2). But we doubt that even defense spending will be curtailed given the US’s global strategic challenges. The president’s budget proposals are drops in the bucket compared to the trillions in his economic stimulus packages. Biden’s American Family Plan will be outlined in detail later this month but it only has a 50/50 chance of passing by the 2022 midterm election. This leaves us with the American Jobs Plan as the real macro policy factor to watch. And in the case of green energy, in particular, the Democrats may not have another opportunity to pass major legislation for many years. The US’s Strategic Basis For Green Energy The American Jobs Plan is billed as a $2.3 trillion green infrastructure package but in reality the package should be broken into traditional infrastructure ($784 billion for roads and bridges), social welfare ($647 billion for elderly care, education, etc), green initiatives ($370 billion for electrical grid and retrofits, etc), tech initiatives ($280 billion for broadband, semiconductors, research and development), and small business support, in order of dollar value (Chart 3). The implication is that climate policy is important but not the top priority. Still, $370 billion is the biggest green package the US has ever launched. It consists of $150 billion for “hard” green infrastructure, such as new electricity grid and $220 billion for “soft” green infrastructure, such as tax credits for buying EVs (Chart 4). Chart 3Biden’s AJP: Green Initiatives Total $370 Billion
Biden's Green Initiatives
Biden's Green Initiatives
Chart 4Biden’s AJP: Green Initiatives Mostly Rebates/Incentive
Biden's Green Initiatives
Biden's Green Initiatives
The US has moved slowly on green energy policy – relative to Europe or China – because it does not face the same strategic necessity. China faces domestic social unrest if it does not reduce pollution, it faces American strategic containment if it does not reduce its dependency on the Middle East (35% of total oil consumption), and it faces the middle-income trap if it does not increase innovation and productivity. Europe is similarly dependent on a geopolitical enemy for its energy supply – Russia provides 35% of its oil consumption and 38% of its natural gas – and it must also increase productivity. Europe and China are net energy importers who have a great strategic interest in making energy supply a matter of manufacturing prowess rather than divine natural resource endowment (Chart 5). The US is late to the green energy game in part because it does not share the same degree of strategic necessity. Like the EU, the US took care of its most pressing pollution problems decades ago. But unlike the EU, the US is a net energy exporter thanks to the fracking revolution. However, the US is not truly energy independent – an Iranian closure of the Strait of Hormuz would cause global oil prices to spike and trigger a recession. And the US also has a powerful strategic interest in maintaining its global leadership and its edge in technology, innovation, and productivity (Chart 6). The US cannot afford to miss out on the green tech race even if starting from a more secure natural resource base. Chart 5US Green Focus Less Motivated By Energy Security Than China, EU
Biden's Green Initiatives
Biden's Green Initiatives
US public opinion is also following European opinion regarding climate change and environmental protection. True, voters are more urgently concerned about the economy, jobs, and health care over the environment – as we showed in our Special Report on health care earlier this year. But the administration has decided not to rehash the health care battles of the Obama administration – having seen Republicans fail to repeal Obamacare – and instead to open up a new policy domain with climate change. Even if the environment is low priority for most voters, they do not oppose green projects in principle – in fact, they favor renewable energy over fossil fuels when it comes to the US’s energy future (Chart 7). And voters strongly favor infrastructure, which means they are more susceptible to green energy projects when presented as part of a broader infrastructure buildout – as opposed to a transformative “Green New Deal” designed to revolutionize every aspect of US life. Chart 6US Green Focus Motivated By Global Innovation/Tech Race
Biden's Green Initiatives
Biden's Green Initiatives
Chart 7US Public Supports Renewable Energy
Biden's Green Initiatives
Biden's Green Initiatives
The US shift to green energy is well underway, with renewables ready to surpass coal in the national energy mix (Chart 8). The natural gas boom of the past decade has worked wonders in reducing coal dependency and hence overall carbon emissions (Chart 9). Chart 8Shift To Renewables Well Underway
Biden's Green Initiatives
Biden's Green Initiatives
Chart 9US Carbon Emissions To Fall Further
Biden's Green Initiatives
Biden's Green Initiatives
Bottom Line: The US does not have the same energy security problems as China and the EU, which is one reason the US trails these competitors in green energy production and policy. But the US has a powerful interest in maintaining its technological edge and productivity growth. So policymakers will continue to push the green agenda even as the public follows Europe in becoming more favorable toward it over the long run. US Climate Policy Will Advance In Fits And Starts The fact that the US lacks the same strategic urgency as Europe and China suggests that the green energy push in the US will progress in fits and starts rather than in a straight line. Popular opinion cited above is supportive enough to allow a political party to push a green agenda if it has control of both the White House and Congress. The Biden administration has moderate-to-strong political capital based on our Political Capital Index (Appendix). But this could change with the next election, which would introduce a ruffle in the current narrative in which Biden saves planet earth. One factor that helps Biden is that his presidency is entirely about economic stimulus and recovery, which enables him to minimize the regulatory and punitive side of his party’s energy agenda. While the American Jobs Plan includes corporate tax hikes, his climate policy in itself is all about spending rather than taxation. There is no carbon pricing scheme anywhere to be seen. And Biden’s Transportation Secretary, Pete Buttigieg (“Mayor Pete,” a center-left politician from Indiana), immediately reversed his recent suggestion that the government levy a gasoline tax or vehicle mileage tax. Biden cannot get any revolutionary green measures passed through the Senate, given that moderate Democrats like Senators Joe Manchin of West Virginia and John Tester of Montana hail from coal-heavy states. The Democrats must also pay heed to the swing states for future elections. Biden only narrowly won his home state of Pennsylvania, after pledging to phase out oil and natural gas in the last presidential debate. True, Biden’s American Jobs Plan will remove subsidies for the oil and gas sector – but these subsidies are not very large. Notably, subsidies for renewables already overwhelm those for traditional infrastructure, even under the Trump administration (Chart 10). Chart 10Subsidy Reform Will Promote Renewables
Biden's Green Initiatives
Biden's Green Initiatives
Chart 11Green Policy At Risk In 2022 Midterm
Biden's Green Initiatives
Biden's Green Initiatives
These points underscore the fact that US climate policy is uncertain over the medium term, when the pandemic fades and the Democrats attempt more ambitious climate proposals. The Republican Party supports the traditional energy sector and is skeptical about climate change. The GOP could easily make a net gain of five seats in the 2022 midterm elections and take back control of the House of Representatives. They would not be able to repeal Biden’s laws or regulations, given his veto and likely Democratic majority in the Senate, but they would be able to pare back green funding. Republicans are not uniform on the issue of climate but more than half of Trump supporters in 2020 considered climate change unimportant. Young party members, moderates, and women were more split on the issue, with 60% of moderate Republicans viewing climate change as somewhat or very important (Chart 11). The takeaway is that Republicans would obstruct but not repeal future climate policy. Climate policy would be limited to Biden’s regulations until at least 2024. Hence investors can expect US climate policy to plow forward in the short run but to encounter resistance in the medium run. This is also likely to be the case as various other crises will emerge and soak up government attention and resources (most likely geopolitical conflicts). Chart 12Green Policy More Likely Over Long Term
Biden's Green Initiatives
Biden's Green Initiatives
Over the long run climate policy will have more reliable support. Younger Republicans support federal environmental policy more than their elders, are increasingly favorable toward government regulation to that end, and prefer renewables to fossil fuels (Chart 12). The millennials and younger generations will make up more than half of the electorate by around 2028. Even then the government’s focus on climate will wax and wane given the other pressing matters of the day. Investment Takeaways A tsunami of money has been created, a lot of it is finding its way into the stock market, and a lot of it is finding its way into green and sustainable energy companies – companies that now have a privileged position in terms of both government support and conspicuous consumption. Combine this with a tidal wave of institutional funds pouring into anything and everything labeled ESG (environmental, social, and governance) – and the stigma attached to climate skepticism and denialism – and investors should fully expect irrational exuberance and stock bubbles. Consider the US’s premier EV maker, Tesla. The vertical run-up in Tesla stock has occurred alongside the run-up in US money supply. Tesla’s price trend conforms with the profile of a range of stock market bubbles of the past (Chart 13), as shown by our US Equity Strategy. Chart 13ALow Rates And Vast Money Growth...
Low Rates And Vast Money Growth...
Low Rates And Vast Money Growth...
Chart 13B...Will Fuel Green Bubble
...Will Fuel Green Bubble
...Will Fuel Green Bubble
That being said, renewables stocks surged throughout 2020 on the back of stimulus and Biden’s likely election – and have since fallen back. They have underperformed cyclical and defensive sectors alike this year to date (Chart 14). As highlighted above, the Democrats’ climate ambitions could yet be pared back in the Senate. However, given the argument in this report, there is sufficient political capital for the climate provisions of the American Jobs Plan to pass. Renewable plays should recover, at least on a tactical, “buy the rumor, sell the news” basis. To play Biden’s American Jobs Plan, our US Equity Strategist Anastasios Avgeriou constructed a “Biden Fiscal Advantage Basket” comprising eight ETFs and one stock, all equal weighted (Chart 15, top panel). Instead of buying specific stocks, Anastasios opted for ETFs so as to diversify away company-specific risk. Chart 14Renewables Corrected But Will Recover
Renewables Corrected But Will Recover
Renewables Corrected But Will Recover
Chart 15Introducing The Biden Fiscal Advantage Basket
Introducing The Biden Fiscal Advantage Basket
Introducing The Biden Fiscal Advantage Basket
The goal was to filter for ETFs that hold mostly US companies and that offered the highest possible liquidity. From a portfolio construction perspective, he aimed to match the different spending segments of Biden’s White House proposal with an ETF. The ticker symbols included in the basket are: PAVE, PHO, QCLN, TAN, WOOD, SOXX, HAIL, GRID and SU. We choose SU as there is no pure play Canadian oil sands ETF trading in USD. Granted there is some replication of stocks included in these ETFs. In certain ETFs there is also a sizable international stock exposure, including EM and Chinese stocks. One final caveat is that these ETFs have a high concentration of technology stocks. Our sense is that this basket should outperform the S&P500 on a cyclical and structural basis albeit not tactically (Chart 15, middle panel). However, given the high-tech exposure, our preferred way to express this trade is via a long/short pair trade versus the QQQ high-tech ETF, which tracks the largest 100 companies on the Nasdaq stock exchange (Chart 15, bottom panel). Table 1 shows a number of related ETFs that did not make the cut but that readers may find intriguing and that deserve further research. Later this month we will publish a joint special report with our US Equity Strategy service, updating our views on Biden’s proposals and elaborating on this equity basket. Table 1Infrastructure and Renewables Related ETFs
Biden's Green Initiatives
Biden's Green Initiatives
More broadly, US equities are still enjoying a positive cyclical backdrop, whereas the passage of the American Jobs Plan later this year has a 50% chance of marking peak stimulus (the American Families Plan may not pass). Tactically, however, we are more cautious. There are also several pronounced foreign policy stress tests facing the Biden administration imminently, including serious Russia/Ukraine, Israel/Iran, and China/Taiwan saber-rattling that we fully expect to engender volatility and safe-haven flows. At least one FOMC member, Saint Louis Fed President Jim Bullard, is now openly thinking about thinking about the Fed’s tapering asset purchases – that is, once the US vaccination rate reaches 75%. Our US Investment Strategy recently showed that this rate of vaccination could be reached as early as September. Matt Gertken Vice President Geopolitical Strategy mattg@bcaresearch.com Jesse Anak Kuri Associate Editor jesse.Kuri@bcaresearch.com Anastasios Avgeriou US Equity Strategist anastasios@bcaresearch.com Appendix Table A1Political Risk Matrix
Biden's Green Initiatives
Biden's Green Initiatives
Table A2Political Capital Index
Biden's Green Initiatives
Biden's Green Initiatives
Table A3APolitical Capital: White House And Congress
Biden's Green Initiatives
Biden's Green Initiatives
Table A3BPolitical Capital: Household And Business Sentiment
Biden's Green Initiatives
Biden's Green Initiatives
Table A3CPolitical Capital: The Economy And Markets
Biden's Green Initiatives
Biden's Green Initiatives
Table A4Biden’s Cabinet Position Appointments
Biden's Green Initiatives
Biden's Green Initiatives