United States
JPMorgan, Goldman Sachs and Wells Fargo kicked off the earnings season on an upbeat note on Wednesday. The first two blew past analyst expectations on the back of their trading and investment banking units. Earnings were also supported by large drawdowns in…
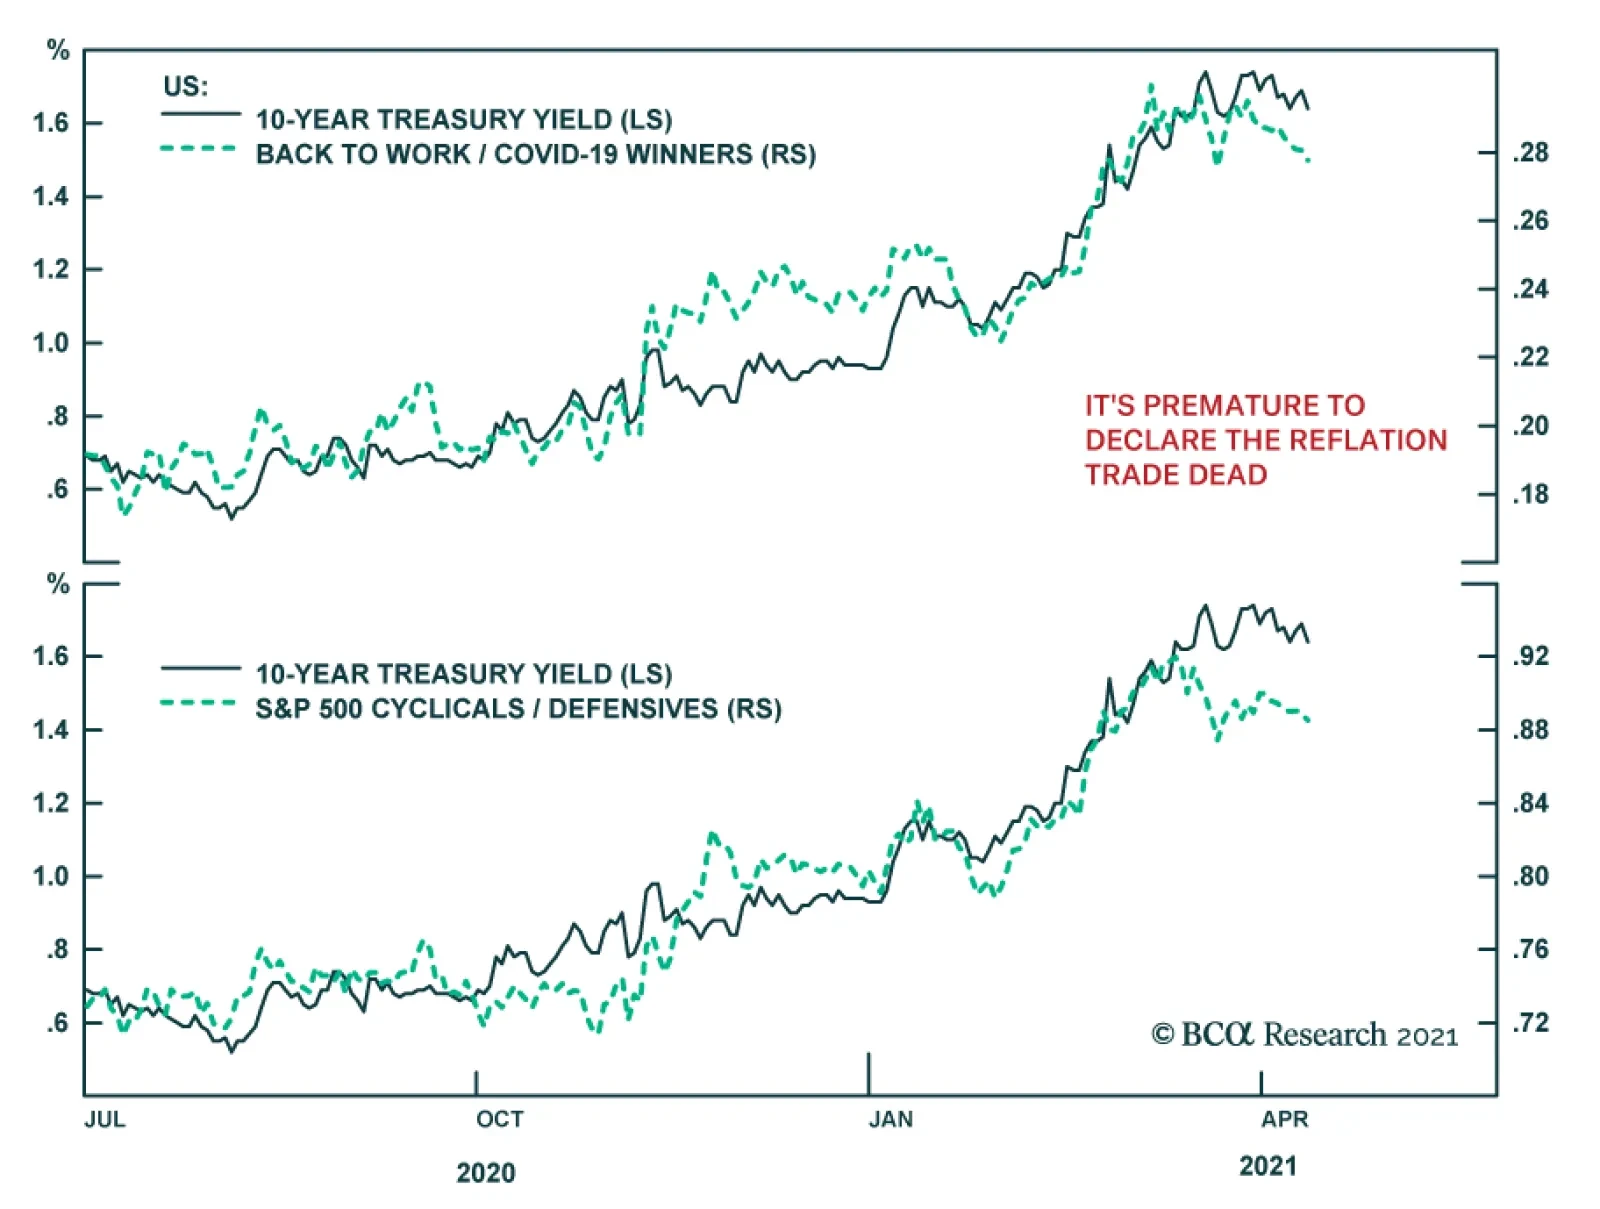
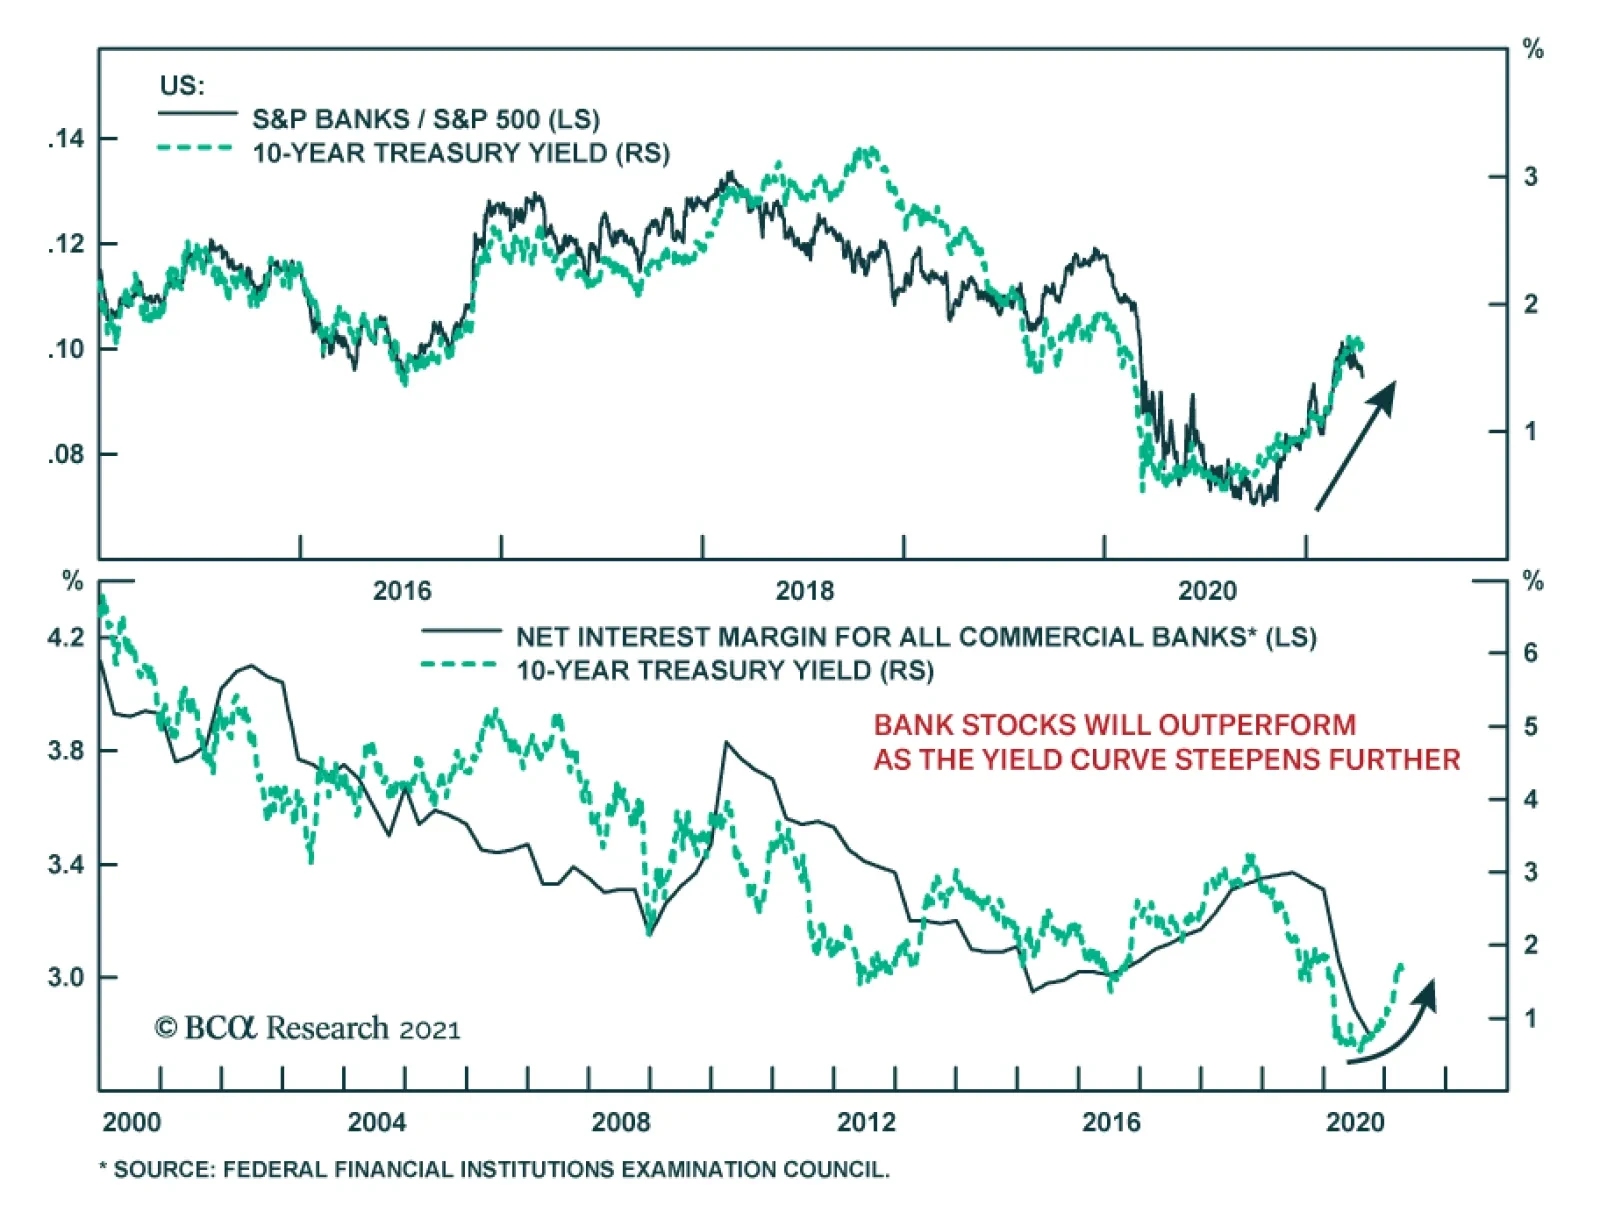
Since late last year, the dominant market narrative has been one of economic reflation. This view has been premised on optimism that vaccination campaigns would successfully suppress the spread of COVID-19 and also on large-scale fiscal stimulus, particularly…
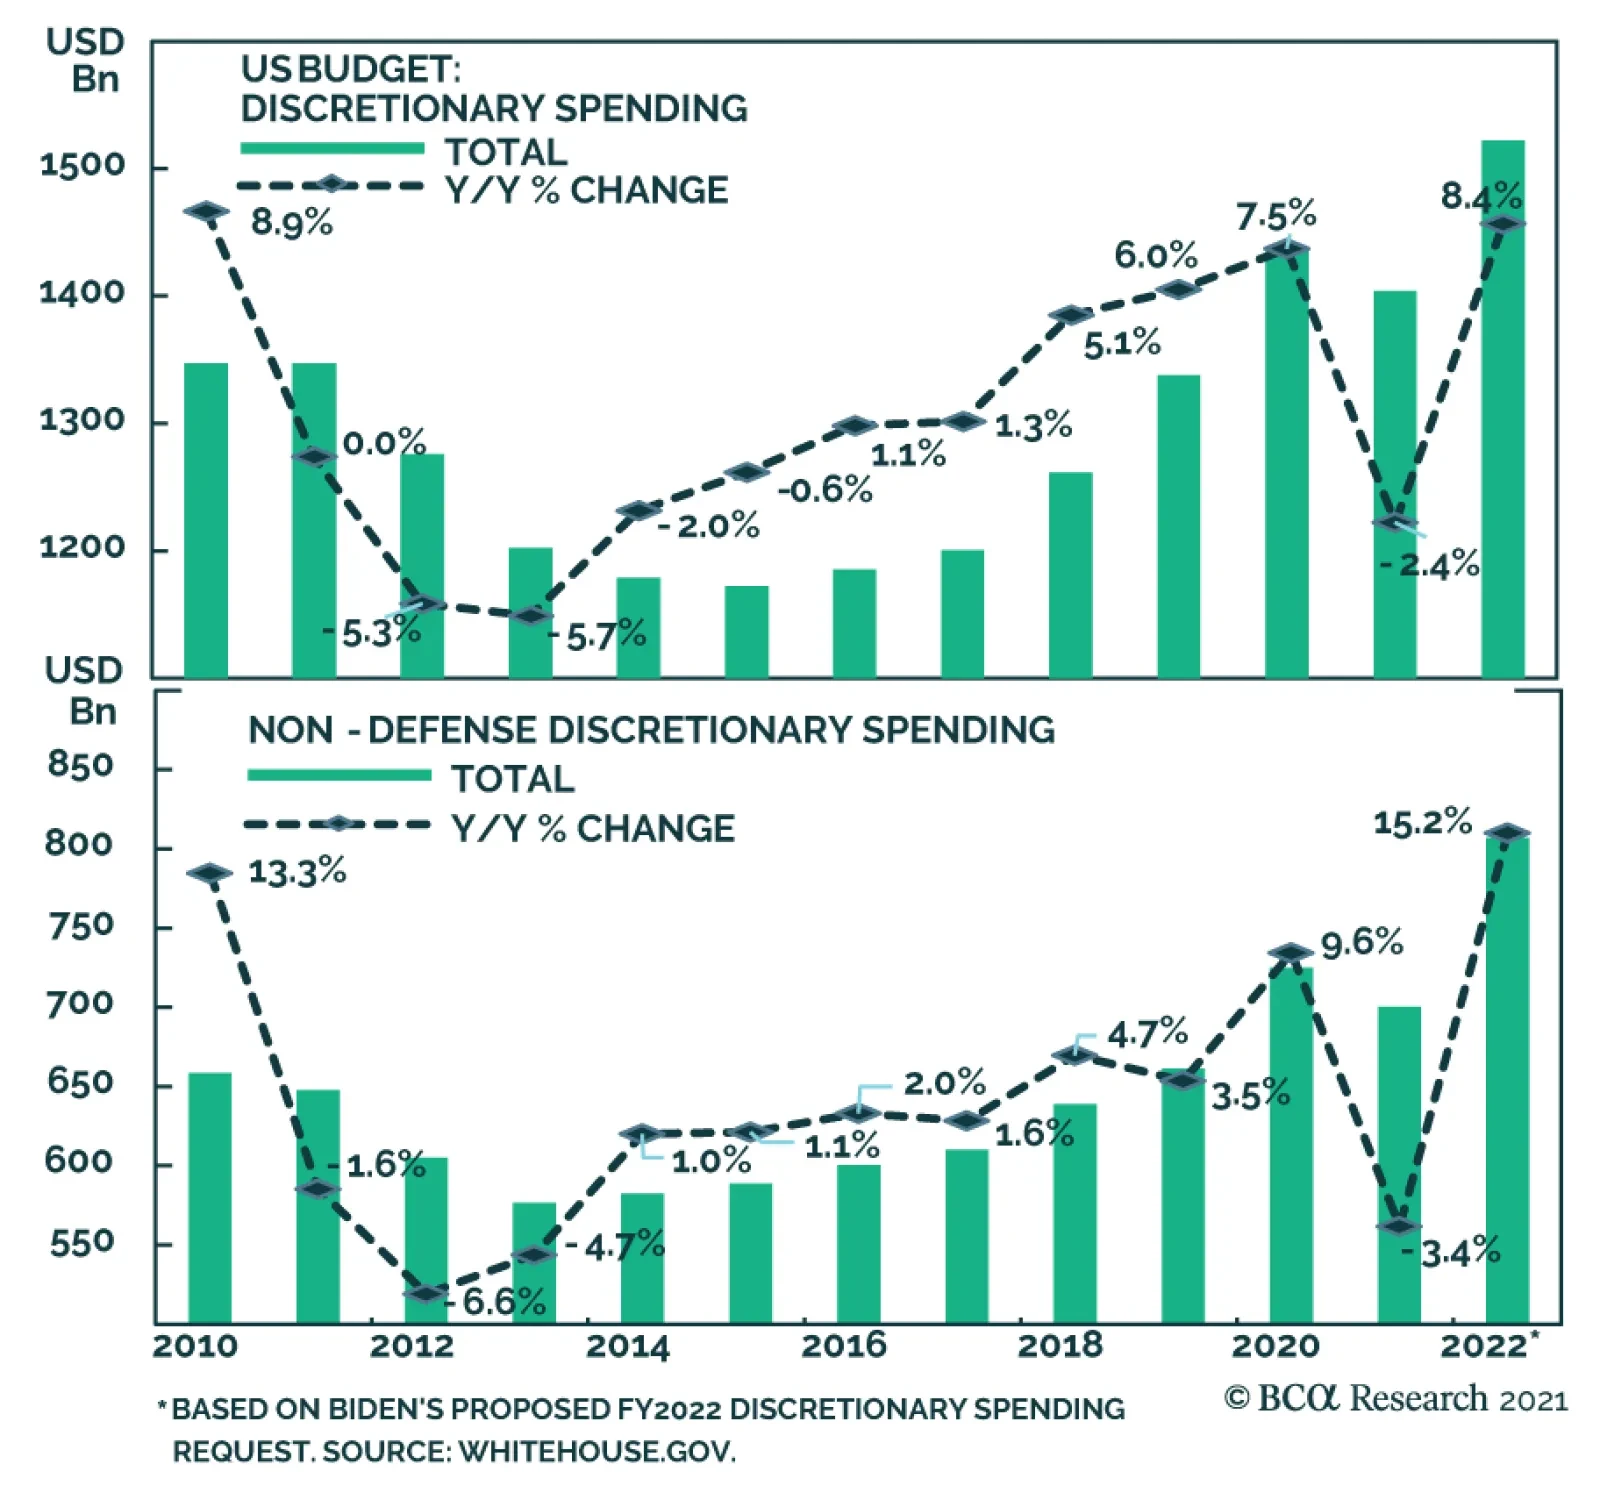
BCA Research’s US Political Strategy service concludes that Biden’s green infrastructure package will become the bulk of his climate push, given uncertainty over the 2022 midterm elections. However, over the long run, American public opinion is shifting in…

Cyclical Software Theme Is Intact
Cyclical Software Theme Is Intact
Overweight Our long-held view that digitalization of the economy is still in the early innings remains intact, and hence we reiterate our cyclical (and structural) preference for software companies. The recent pullback in the relative share price ratio also offers a compelling entry point for investors to further augment their overweight stance. Importantly, generationally low interest rates along with ample software companies’ free cash flow has emboldened the industry to embark on a new M&A frenzy that effectively reduces the supply of stocks available to investors and pushes prices higher (top panel). Already, the average M&A premium paid is probing new highs since the GFC at the same time as the actual count of deals is going through the roof. Both of these dynamics bode well for the future earnings power of software stocks. As a reminder, we are currently employing a barbell portfolio strategy within the GICS1 technology sector by preferring defensive software- and services-related stocks over more aggressive hardware and equipment equities. Bottom Line: Stay overweight the S&P software index. The ticker symbols for the stocks in this index are: BLBG: S5SOFT – MSFT, ADBE, CRM, ORCL, INTU, NOW, ADSK, ANSS, SNPS, CDNS, FTNT, PAYC, CTXS, NLOK, TYL.
Dear Client, Next week I will be hosting a series of Roundtable discussions with BCA’s clients in both Europe and Asia. Our next report published on April 28th will be a recap of my observations from these meetings. Best regards, Jing Sima China Strategist Highlights The sharp uptick in Chinese producer prices should be transitory, unlikely to trigger a policy response. There are two scenarios under which Chinese manufacturers’ profit margins will benefit: either Chinese exporters will raise export prices and pass input costs onto American customers, or the RMB will depreciate versus the US dollar and commodities prices will experience a setback. The second scenario is more likely in the next 3-6 months. After a pandemic-driven boost in 2020, US imports from China will likely moderate in the second half of 2021 and into 2022. President Biden’s grand infrastructure spending plan, even if approved later this year, will not be a game changer for China’s exports or economy. The strength in the USD may intensify in the near term, and Chinese policymakers will be happy to allow the RMB to depreciate mildly. Stay underweight Chinese stocks. Feature Last week’s China’s producer price index (PPI) was more elevated than the market expected. However, it does not warrant a policy response, given that the increase was mostly driven by supply constraints rather than an overheating domestic economy. Chinese manufacturers have had a tough time passing on mounting input prices to customers, which raises the question about how profit margins will be maintained. For exporters, the answer may be a combination of increasing export prices in USD terms and depreciating the RMB. The rate of growth in US demand for Chinese export goods may moderate in the second half of 2021 and into 2022 after a pandemic-driven boost in 2020. China’s economic growth and interest rate differentials with the US will continue to narrow in the rest of this year. We expect the RMB to face headwinds against the USD, at least in the next quarter or two. Meanwhile, global investors should continue to underweight Chinese stocks. The PBoC Will Not React To Supply-Side Price Pressures Chart 1Marchs Strong PPI Does Not Reflect An Overheating Domestic Economy
Marchs Strong PPI Does Not Reflect An Overheating Domestic Economy
Marchs Strong PPI Does Not Reflect An Overheating Domestic Economy
Despite above-expectation readings in China’s PPI, the domestic economy shows no signs of overheating. The upside pressure on producer prices reflects the impact of both the global rally in commodities and base effects (Chart 1). In March, strength in the PPI was also accentuated by seasonality due to a resumption in construction and real estate activity following the Chinese New Year holiday. While base effects and global supply bottlenecks will continue to buoy PPI prints throughout Q2, these effects are likely transitory and would not justify a policy response. At 0.4% year-over-year in March, core CPI remains significantly below the central bank’s 3% target and does not indicate any demand-side pressure. Instead, the inability for Chinese producers to pass on higher input prices to consumers highlights the relatively subdued state of domestic demand (Chart 1, bottom panel). Chart 2Current Macro Policy Works To Cap The Upsides In Both The Price And Quantity Of Money
Current Macro Policy Works To Cap The Upsides In Both The Price And Quantity Of Money
Current Macro Policy Works To Cap The Upsides In Both The Price And Quantity Of Money
At this point there are little signs that rising producer prices are spilling over to consumer prices. We expect Chinese authorities to continue its current policy trajectory, which intends to keep a steady interbank rate while keeping money supply growth at or below the rate of nominal GDP expansion (Chart 2). China’s Deteriorating Terms Of Trade Chinese export prices climbed slightly in USD terms, but not by enough to offset the RMB’s relentless appreciation from the second half of last year, as indicated by falling export prices in RMB terms (Chart 3). A deteriorating terms of trade (ToT), defined as export prices relative to import costs, means that Chinese producers must export a greater number of units to purchase the same number of imports (Chart 4). The declining ToT can be a powerful deflationary force for China’s manufacturing sector. Chart 3Chinese Export Prices Are Rising In USD Terms But Falling In Local Currency Terms
Chinese Export Prices Are Rising In USD Terms But Falling In Local Currency Terms
Chinese Export Prices Are Rising In USD Terms But Falling In Local Currency Terms
Chart 4Terms Of Trade Have Been Falling
Terms Of Trade Have Been Falling
Terms Of Trade Have Been Falling
Chart 5Chinese Output Prices Lead US Consumer Inflation By A Year
Chinese Output Prices Lead US Consumer Inflation By A Year
Chinese Output Prices Lead US Consumer Inflation By A Year
While there are limited choices for China to improve its ToT, manufacturers could raise export prices in USD terms and “recycle” cost-push inflation back to the US. Chinese PPI normally leads US consumer inflation by 12 to 18 months (Chart 5). Hence, it is possible that the US will see import prices from China picking up more momentum by the middle of next year. The RMB’s performance is a key macro driver for manufacturing-related output prices. A depreciation in the RMB can be a meaningful reflationary force for manufacturers. There has been a clear negative correlation between the trade-weighted RMB and Chinese manufacturers' output prices and industrial profits, as shown in Chart 6. In this scenario, the USD will continue to appreciate against the RMB and possibly emerging market currencies, a headwind to global trade (Chart 7). Chart 6A Falling RMB Can Be Reflationary To Chinese Producers
A Falling RMB Can Be Reflationary To Chinese Producers
A Falling RMB Can Be Reflationary To Chinese Producers
Chart 7A Stronger USD Will Be Headwinds For Global Trade
A Stronger USD Will Be Headwinds For Global Trade
A Stronger USD Will Be Headwinds For Global Trade
Maintaining a strong RMB can partly mitigate the pain stemming from escalating commodity import prices. However, in our view it is the least preferred option by policymakers. In previous cycles a rapidly strengthening RMB did not have a major impact on Chinese exporters' competitiveness, mainly because declines in commodities prices effectively offset a rising RMB (Chart 8 and Chart 9). Therefore, Chinese exporters did not need to boost prices in USD terms to maintain their profit margins. Chart 8RMB Appreciations Did Not Hurt Chinas Share In Global Trade
RMB Appreciations Did Not Hurt Chinas Share In Global Trade
RMB Appreciations Did Not Hurt Chinas Share In Global Trade
Chart 9...Because Declines In Commodities Prices Were Able To Offset A Rising RMB
...Because Declines In Commodities Prices Were Able To Offset A Rising RMB
...Because Declines In Commodities Prices Were Able To Offset A Rising RMB
Bottom Line: Chinese exporters can either raise prices and pass the inflation onto American customers, or the PBoC will allow further depreciation in the RMB to maintain Chinese producers’ competitiveness. Appreciating the RMB is the least preferred option. Don’t Count On A US Buying Spree Market participants in China are pricing in large windfalls from the US$1.9 trillion American Rescue Plan and proposed US$2.4 trillion American Jobs Plan.1 A positive export tailwind in Q1 this year boosted China’s economic activity beyond what measures of domestic money and credit would have predicted, as shown in Chart 10. However, given the strongly positive relationship between the export sector and real investment in China, it is concerning that any deceleration in US demand for Chinese export goods would seriously challenge the sanguine view for China’s economy this year (Chart 11). Chart 10Export Strength Appears To Be Propping Up The LKI
Export Strength Appears To Be Propping Up The LKI
Export Strength Appears To Be Propping Up The LKI
Chart 11China's Export Sector Is Highly Investment-Intensive
From Deflation To Inflation … What’s Next?
From Deflation To Inflation … What’s Next?
Moreover, US demand for Chinese export goods is subject to several countervailing forces, at least in the second half of 2021: The USD currently benefits from widening real interest differentials and stronger US growth relative to the rest of the world. For the next quarter or two, persistent strength in the USD and US Treasury yields will be headwinds to global trade and may cause a temporary setback for the global manufacturing sector (Chart 7 on Page 4). Residential and business investment in the US may not regain much vigor despite large stimulus checks. Our colleagues at BCA US Investment Strategy expect US residential investment to match the long-run trend growth, but the increase will be largely offset by below-trend growth in non-residential investment. More working-from-home options will continue to drive demand for single-family homes in the suburbs and beyond. On the other hand, demand will suffer for office space in central business districts and dwellings in urban centers. Brick-and-mortar retail construction is also going to crater. Consumption for goods in the US may also see below-trend growth in the second half of 2021 and into 2022, whereas the service sector will benefit most from the coming recovery in US business and social activities. Table 1 shows that goods spending rose in 2020 despite an overall decline in consumption, because households dramatically shifted their consumption into goods from services. As such, 2020’s pandemic-driven dividend for Chinese exporters is likely to become a drag on tradeable goods exports to the US in 2021 and/or 2022. Table 1US Consumer Spending Gap Is Almost Entirely On The Services Side
From Deflation To Inflation … What’s Next?
From Deflation To Inflation … What’s Next?
It is also important for investors to put the US$2.4 trillion infrastructure spending budget proposed in the American Jobs Plan into prospective. The US lags far behind China in infrastructure spending. In the past 10 years, US public infrastructure investment (federal and state combined) has declined to an average of about $450 billion.2 This compares with China’s US $1.9 trillion yearly spending on infrastructure (Chart 12). China currently consumes seven to eight times more industrial metals than the US (Chart 13). As such, even if the US infrastructure investment plan will be approved later this year, it is unlikely to be a game changer for global commodity prices or Chinese exports. Chart 12Infrastructure Spending, China Vs. The US
From Deflation To Inflation … What’s Next?
From Deflation To Inflation … What’s Next?
Chart 13US Consumption Of Industrial Metals Is Too Small Relative To China
From Deflation To Inflation … What’s Next?
From Deflation To Inflation … What’s Next?
The proposed US$1.2 trillion spending on the US nation’s roads, bridges, green spaces, water, electricity, and universal broadband will be spread over the next eight years. The additional $150 billion per annum to the US public infrastructure investment will only boost the US spending from 24% to about 32% of China’s annual infrastructure investment. Furthermore, the fiscal multiplier effect from the extra public spending on investment from the US private sector and overall economy may not be as positive as the market has priced in, depending on the size of corporate tax hikes in the final bill. Bottom Line: After a pandemic-driven boost in 2020, growth in US imports from China will likely moderate in the second half of 2021 and into 2022. The proposed infrastructure spending plan in the US will benefit Chinese exports, but the magnitude of the windfall may be disappointing. Investment Implications As discussed in a previous report, rising US bond yields will have a muted effect on their Chinese counterparts. Tightened regulations on the real estate industry and a new round of environmental protection laws in China will continue to suppress the domestic credit demand. As a result, interest rate differentials between China and the US will continue to narrow. The strength in the USD has not run its course and the RMB will face slight depreciation pressures in Q2 and possibly into Q3. A declining RMB will provide reflationary benefits to China’s industrial profits, but with about a six-month time lag. In the meantime, we recommend global investors to continue underweighting Chinese stocks (Chart 14A and 14B). Chart 14AContinue Underweighting Chinese Stocks
Continue Underweighting Chinese Stocks
Continue Underweighting Chinese Stocks
Chart 14BContinue Underweighting Chinese Stocks
Continue Underweighting Chinese Stocks
Continue Underweighting Chinese Stocks
Jing Sima China Strategist jings@bcaresearch.com Footnotes 1According to the OECD, recent US stimulus will boost US GDP growth by almost 3 percentage points in the first full year (from 2021Q2 to 2022Q2). The knock-on effect from the stimulus on other economies is projected to be significant, including a half percentage point addition to China’s GDP during the same period. 2The Congressional Budget Office estimated that combined federal, state and local spending on infrastructure was (in 2019 dollars) $441 billion as of 2017. Cyclical Investment Stance Equity Sector Recommendations
Highlights Global Inflation: The case for maintaining a strategic overall allocation to inflation-linked bonds (ILBs) versus nominal government debt in dedicated global fixed income portfolios remains intact. Global growth expectations are accelerating as vaccinations increase, spare capacity is increasingly being absorbed across the developed world and central banks (led by the Federal Reserve) continue to show no inclination to tighten policy anytime soon. Inflation-Linked Bond Allocations: ILB valuations, however, are no longer uniformly cheap across all countries. Real yields are now moving in a less coordinated fashion as markets try to sort out the timing and pace of eventual future central bank tightening. We recommend shifting inflation-linked bond exposure from Canada to Germany, as both markets have similar valuations but the Bank of Canada is likely to turn less dovish well ahead of the ECB. Feature Chart of the WeekMarkets Remain Unconcerned About An Inflation Overshoot
Markets Remain Unconcerned About An Inflation Overshoot
Markets Remain Unconcerned About An Inflation Overshoot
The global reflation trade over the past year has been highly rewarding to investors. Equity and credit markets worldwide have delivered outstanding returns on the back of highly stimulative monetary and fiscal policies implemented to deal with the negative economic effects of COVID-19. The global INflation trade has also paid off for investors in inflation-linked bonds (ILBs), which have outperformed nominal government debt across the developed economies dating back to last spring. The rising trend for global inflation breakevens remains intact, but is approaching some potential resistance points. A GDP-weighted average of 10-year breakeven inflation rates among the major developed economies is just shy of the 2% level that has represented a firm ceiling over the past decade (Chart of the Week). At the same time, the Bloomberg consensus forecast for headline CPI inflation for that same group of countries calls for an increase to only 1.8% by year-end before slowing to 1.7% in 2022. The latest forecasts from the IMF are similar, calling for headline inflation in the advanced economies to reach 1.6% in 2021 and 1.7% in 2022. If those modest forecasts for realized inflation come to fruition, then there is likely not much more upside in inflation breakevens, in aggregate. Country selection within the ILB universe will become more important over the next 6-12 months, as divergences in growth, realized inflation and central bank reactions will lead to a more heterogeneous path for global inflation breakevens. Underlying Inflation Backdrop Still Supports Rising Breakevens On a total return basis, ILBs enjoyed an extended run of success prior to this year. The cumulative total return of the asset class (in local currency terms) between 2012 and 2020 was a whopping 61% in the UK, 25% in Canada, 22% in the US and 21% in the euro area (aggregating the individual countries in the region with inflation-linked bonds). However, the absolute performance of ILBs has been more disperse on a country-by-country basis so far in 2021. ILBs are down year-to-date in Canada (-6.2%), the UK (-5.0%) and the US (-1.4%). On the other hand, euro area ILBs have delivered a positive total return of +0.5% so far in 2021. Real bond yields have climbed off the lows in the US, UK and, most notably, Canada where the overall index yield on the Bloomberg Barclays inflation-linked bond index is now in positive territory for the first time since before the pandemic started (Chart 2). At the same time, real bond yields have been drifting lower in the euro area. These real yield moves are related to shifting perceptions of central bank responses to the global growth upturn. For example, pricing in overnight index swap (OIS) curves have pulled forward the timing and pace of future interest rate increases in the US and Canada – i.e. real policy rates will become less negative - while there has been comparatively little change in euro zone rate expectations. While the absolute returns for ILBs have become less correlated, the relative trade between nominal and inflation-linked government bonds in all countries remains intact. 10-year breakeven inflation rates have been steadily climbing in the US and UK, while depressed Japanese breakevens have crept modestly higher (Chart 3). Even Europe, where inflation has remained subdued for years, has seen a significant shift higher in inflation breakevens. (Chart 4). The turn in breakevens has occurred alongside a major change in investor perceptions of future inflation, with surveys like the ZEW showing an overwhelming majority of financial professionals expecting higher inflation in the US, Europe and the UK. Chart 2A Fading Bull Market In Inflation-Linked Bonds
A Fading Bull Market In Inflation-Linked Bonds
A Fading Bull Market In Inflation-Linked Bonds
Chart 3A Solid Recovery In Inflation Expectations
A Solid Recovery In Inflation Expectations
A Solid Recovery In Inflation Expectations
Chart 4European Inflation Expectations Starting To Normalize
European Inflation Expectations Starting To Normalize
European Inflation Expectations Starting To Normalize
Inflation forecasts have shifted in response to faster global growth expectations on the back of vaccine optimism and aggressive US fiscal stimulus. Yet inflation forecasts remain modest compared to the huge growth figures expected for 2021 and 2022. In its latest World Economic Outlook published last week, the IMF upgraded its global real GDP forecast to 6.0% for 2021 and 4.4% for 2022. This represented an increase of 0.5 and 0.4 percentage points, respectively, from the last set of forecasts published back in January. While growth upgrades occurred across all major developed and emerging economies, the biggest upgrades came in the US and Canada, for both 2021 and 2022. As a result, the IMF projects the output gap in both countries to turn positive over 2022 and 2023, and be nearly closed in core Europe, Australia and Japan (Chart 5). The IMF is not projecting a major inflation surge on the back of those upbeat growth forecasts, though. While headline inflation in the US is expected to climb to 2.3% in 2021 and 2.4% in 2022, the same measure in Canada is only projected to rise to 1.7% and 2.0% over the same two years. European inflation is expected to remain subdued, reaching only 1.4% this year and drifting back to 1.2% in 2022 despite real GDP growth averaging 4.1% over the two-year period. The IMF attributes the benign inflation outcomes, even in the face of booming growth rates and the rapid elimination of output gaps, to the structural disinflationary backdrop for so-called “non-cyclical” inflation (Chart 6). The IMF defines this as the components of inflation indices that are less sensitive to changes in aggregate demand. The IMF estimates show that the contribution from non-cyclical components to overall inflation in the advanced economies had fallen to essentially zero at the end of 2020. Chart 5A Big Expected Narrowing Of Output Gaps
How Much More Juice Is Left In The Global Inflation Breakeven Trade?
How Much More Juice Is Left In The Global Inflation Breakeven Trade?
Chart 6Non-Cyclical Components Still Weighing On Global Inflation
Non-Cyclical Components Still Weighing On Global Inflation
Non-Cyclical Components Still Weighing On Global Inflation
There is considerable upside risk for the more cyclical components of inflation that could result in inflation overshooting the IMF projections (Chart 7). Chart 7Cyclical Backdrop Is Inflationary
Cyclical Backdrop Is Inflationary
Cyclical Backdrop Is Inflationary
For example, in the US, the Prices Paid component of the ISM Manufacturing index remains elevated at post-2008 highs, while the year-over-year change in the Producer Price Index soared to 6% in March. Across the Atlantic, the European Commission business and consumer surveys have shown a big surge in the net balance of respondents expecting higher inflation in manufacturing and retail trade. Previous weakness in the US dollar and surging commodity prices are playing a major role in this rapid pick-up in price pressures seen in many countries. Given the current backdrop of strong global growth expectations, with actual activity accelerating as vaccinations increase and more parts of the global economy reopen, inflation pressures are unlikely to fade in the near term. With realized inflation rates set to spike due to base effect comparisons to the pandemic-fueled collapse one year ago, the upward pressure on global ILB inflation breakevens will persist in the coming months – especially with breakevens still below levels that would prompt central banks to turn less dovish sooner than expected. Bottom Line: The case for maintaining a strategic overall allocation to inflation-linked bonds (ILBs) versus nominal government debt in dedicated global fixed income portfolios remains intact. Global growth expectations are accelerating as vaccinations increase, spare capacity is increasingly being absorbed across the developed world and central banks (led by the Federal Reserve) continue to show no inclination to tighten policy anytime soon. Assessing Value In Developed Market Inflation-Linked Bonds Chart 8USD Outlook Now More Mixed
USD Outlook Now More Mixed
USD Outlook Now More Mixed
Although the current backdrop remains conducive to a continuation of the rising trend in global ILB breakevens, there are factors that could begin to slow the upward momentum. The future path of the US dollar is now a bit less certain (Chart 8). While the DXY index is still down 7.4% compared to a year ago, it is up 2.4% so far in 2021. Shorter-term real interest rate differentials between the US and the other major developed markets remain dollar-bearish. At the same time, longer-term real yield differentials have risen in favor of the US (middle panel). Furthermore, US growth is outperforming other developed economies, typically a dollar-bullish factor (bottom panel). Given the usual negative correlation between the US dollar and commodity prices, a loss of downside dollar momentum could also slow the pace of commodity price appreciation. This represents a risk to additional global ILB outperformance versus government bonds. Our GDP-weighted aggregate of 10-year ILB breakevens for the major developed economies is currently just under 2% - levels more consistent with oil prices over $80/bbl than the current price closer to $60/bbl (Chart 9). Chart 9Breakevens Consistent With Much Higher Oil Prices
Breakevens Consistent With Much Higher Oil Prices
Breakevens Consistent With Much Higher Oil Prices
Given some of these uncertainties over the strength of any future inflationary push from a weaker US dollar and rising commodity prices, a broad overweight allocation to ILBs across the entire developed market universe may no longer generate the same strong returns versus nominal government bonds seen over the past year. With the “easy money” already having been made in the global breakeven widening trade, country allocation within the ILB universe has now become a more important dimension for bond investors to consider. To assess the relative attractiveness of individual ILB markets, we turn to a few valuation tools. Our regression-based valuation models for 10-year ILB breakevens in the US, UK, France, Italy, Germany, Japan, Canada and Australia are all presented in the Appendix on pages 14-17. The two inputs into the model are the annual rate of change of the Brent oil price in local currency terms (as a measure of shorter-term inflation pressure) and a five-year moving average of realized headline CPI inflation (as a longer-term trend that provides a structural “anchor” for breakevens based off actual inflation outcomes). We first presented these models in April 2020, but we have now made a change in response to some of the unprecedented developments witnessed over the past year.1 Despite the strong visual correlation between the level of oil prices and inflation breakevens in most countries, we chose to use the annual growth of oil prices, rather than the level, in our breakeven models. This is because we found it more logical to compare a rate of change concept like inflation (and breakevens) to the rate of change of oil. However, the oil input into our breakeven models could produce nonsensical results during periods of extreme oil volatility that did not generate equivalent swings in breakeven inflation rates. A good example of that occurred in 2016, when the annual rate of change of the Brent oil price briefly surged toward 100%, yet 10-year US TIPS breakevens did not rise above 2% (Chart 10). An even bigger swing in oil prices has occurred over the past year, with oil prices up over +200% compared to the collapse in prices that occurred one year ago. Putting such an extreme move into our US model would have pushed the “fair value” level of the 10-year TIPS breakeven to 4% - an implausible outcome given that the 10-year breakeven has never risen to even as high as 3% in the entire 24-year history of the TIPS market. Chart 10Pass-Through Of Extreme Oil Moves Has Limits
Pass-Through Of Extreme Oil Moves Has Limits
Pass-Through Of Extreme Oil Moves Has Limits
To deal with this problem, we have truncated the rate of change of oil prices in all our breakeven models at levels consistent with past peaks of breakevens. Going back to the US example, we have “capped” the rate of change of the Brent oil price at +40%, as past periods when oil price momentum was greater than 40% did not translate into any additional increase in TIPS breakevens. We then re-estimated the model using this truncated oil price series to generate fair value breakeven levels. Chart 11A Mixed Impact Of USD Moves On Non-US Breakevens
A Mixed Impact Of USD Moves On Non-US Breakevens
A Mixed Impact Of USD Moves On Non-US Breakevens
We did this for all eight of our individual country breakeven models and in all cases, truncating extreme oil moves improved the accuracy of the model. Interestingly, we did not truncate the downside momentum of oil prices, as there was no obvious “cut-off” point where periods of collapsing oil prices did not generate equivalent declines in breakevens. Oil prices remain the most critical short-term variable to determine ILB breakeven valuation. While it is intuitive to think that currency movements should also have a meaningful impact on inflation (both realized and expected), the effect is not consistent across countries. For example, euro area breakevens appear to be positively correlated to the euro, while Japanese breakevens rarely rise without yen weakness (Chart 11). One other factor to consider when evaluating the value of breakevens is the possible existence of an inflation risk premium component during periods of higher uncertainty over future inflation. Such uncertainty could result in increased demand for ILBs from investors driving up the price of ILBs (thus lowering the real yield) relative to nominal yielding bonds, leading to wider breakevens that do not necessarily reflect a true rise in expected inflation. A simple way to measure such an inflation risk premium is to compare market-based breakevens to survey-based measures of inflation forecasts taken from sources like the Philadelphia Fed's Survey of Professional Forecasters and the Bank of Canada’s Survey Of Consumer Expectations. The assumption here is that the survey-based measures represent a more accurate (or, at least, less biased) depiction of underlying inflation expectations in an economy. We present these simple measures of inflation risk premia, comparing 10-year breakevens to survey-based measures of inflation expectations, in Chart 12 and Chart 13. Breakevens had been trading well below survey-based measures of inflation expectations after the negative pandemic growth shock in 2020 in all countries shown. After the steady climb in global breakevens seen over the past year, those gaps have largely disappeared, with breakevens now trading slightly above survey based inflation expectations in the US, UK and Australia. Chart 12No Major Inflation Risk Premia In These Markets
No Major Inflation Risk Premia In These Markets
No Major Inflation Risk Premia In These Markets
Chart 13Canadian & Australian Breakevens In Line With Inflation Surveys
Canadian & Australian Breakevens In Line With Inflation Surveys
Canadian & Australian Breakevens In Line With Inflation Surveys
Chart 14Assessing The Value Of Breakevens
Assessing The Value Of Breakevens
Assessing The Value Of Breakevens
In Chart 14, we show the valuation residuals from our 10-year ILB breakeven models, along with two other measures of potential breakeven valuation: a) the distance between current breakeven levels and their most recent pre-pandemic peaks; and b) the difference between breakevens and the survey-based measures of inflation expectations. The model results show that breakevens are furthest below fair value in France, Japan and Germany, and the most above fair value in the UK and Australia. The message of undervaluation from our models is confirmed in the other two metrics for France, Japan, Germany, Canada and Italy. The overvaluation message for Australia is consistent across all three valuation metrics, while the signals are mixed for US and UK breakevens. In Japan, while the combined signals of all three valuation metrics indicate that breakevens are far too low, the very robust positive correlation between Japanese breakevens and the USD/JPY exchange rate implies that a bet on wider breakevens requires a much weaker yen. In Canada, while the 10-year breakeven does appear cheap, the real yield has also climbed faster than any of the other countries over the past several months as markets have rapidly repriced a more hawkish path for the Bank of Canada. Recent comments from Bank of Canada officials have leaned a bit hawkish, hinting at a possible taper of its bond-buying program, as the central bank appears unhappy with the renewed boom in Canadian housing values. An early tightening of monetary conditions would likely cap any additional upside in Canadian inflation breakevens. In Europe, the undervaluation of breakevens is more compelling. The ECB is likely to maintain its dovish policy settings into at least 2023, even if growth recovers later this year as increased vaccinations lead to the end of lockdowns. As shown earlier, European breakevens can continue to rise even if the euro is also appreciating versus the US dollar, especially if growth is recovering and oil prices are rising. Euro area breakevens are likely to continue drifting higher over at least the rest of 2021. Currently in our model bond portfolio, we have allocations to ILBs out of nominal government bonds in the US, France, Canada and Italy, with no allocations in Germany, Japan, Australia or the UK. After assessing our valuation measures, we are comfortable with the ILB exposure in France and Italy and lack of positions in the UK and Australia. We still see the upside case for US breakevens, with the economy reopening rapidly fueled further by fiscal policy, and the Fed likely to maintain its current highly dovish forward guidance until much later in 2021. We are reluctant to add exposure to Japanese ILBs, despite attractive valuations, as we are not convinced that USD/JPY has enough upside potential to help realize that undervaluation of Japanese breakevens. Thus, as a new change to our model portfolio this week that reflects our assessment of ILB breakeven valuations and risks, we are closing out the exposure to Canadian ILBs and adding a new position in German ILBs of equivalent size (see the model bond portfolio tables on pages 18-19). Bottom Line: ILB valuations are no longer uniformly cheap across all countries. Real yields are now moving in a less coordinated fashion as markets try to sort out the timing and pace of eventual future central bank tightening. We recommend shifting inflation-linked bond exposure from Canada to Germany, as both markets have similar valuations but the Bank of Canada is likely to turn less dovish well ahead of the ECB. Robert Robis, CFA Chief Fixed Income Strategist rrobis@bcaresearch.com Footnotes 1 Please see BCA Research Global Fixed Income Strategy Report, "Global Inflation Expectations Are Now Too Low", dated April 28, 2020, available at gfis.bcaresearch.com. Appendix Chart A1Our US 10-Year Inflation Breakeven Model
How Much More Juice Is Left In The Global Inflation Breakeven Trade?
How Much More Juice Is Left In The Global Inflation Breakeven Trade?
Chart A2Our UK 10-Year Inflation Breakeven Model
How Much More Juice Is Left In The Global Inflation Breakeven Trade?
How Much More Juice Is Left In The Global Inflation Breakeven Trade?
Chart A3Our France 10-Year Inflation Breakeven Model
How Much More Juice Is Left In The Global Inflation Breakeven Trade?
How Much More Juice Is Left In The Global Inflation Breakeven Trade?
Chart A4Our Italy 10-Year Inflation Breakeven Model
How Much More Juice Is Left In The Global Inflation Breakeven Trade?
How Much More Juice Is Left In The Global Inflation Breakeven Trade?
Chart A5Our Japan 10-Year Inflation Breakeven Model
How Much More Juice Is Left In The Global Inflation Breakeven Trade?
How Much More Juice Is Left In The Global Inflation Breakeven Trade?
Chart A6Our Germany 10-Year Inflation Breakeven Model
How Much More Juice Is Left In The Global Inflation Breakeven Trade?
How Much More Juice Is Left In The Global Inflation Breakeven Trade?
Chart A7Our Canada 10-Year Inflation Breakeven Model
How Much More Juice Is Left In The Global Inflation Breakeven Trade?
How Much More Juice Is Left In The Global Inflation Breakeven Trade?
Chart A8Our Australia 10-Year Inflation Breakeven Model
How Much More Juice Is Left In The Global Inflation Breakeven Trade?
How Much More Juice Is Left In The Global Inflation Breakeven Trade?
Recommendations
How Much More Juice Is Left In The Global Inflation Breakeven Trade?
How Much More Juice Is Left In The Global Inflation Breakeven Trade?
The GFIS Recommended Portfolio Vs. The Custom Benchmark Index Duration Regional Allocation Spread Product Tactical Trades Yields & Returns Global Bond Yields Historical Returns
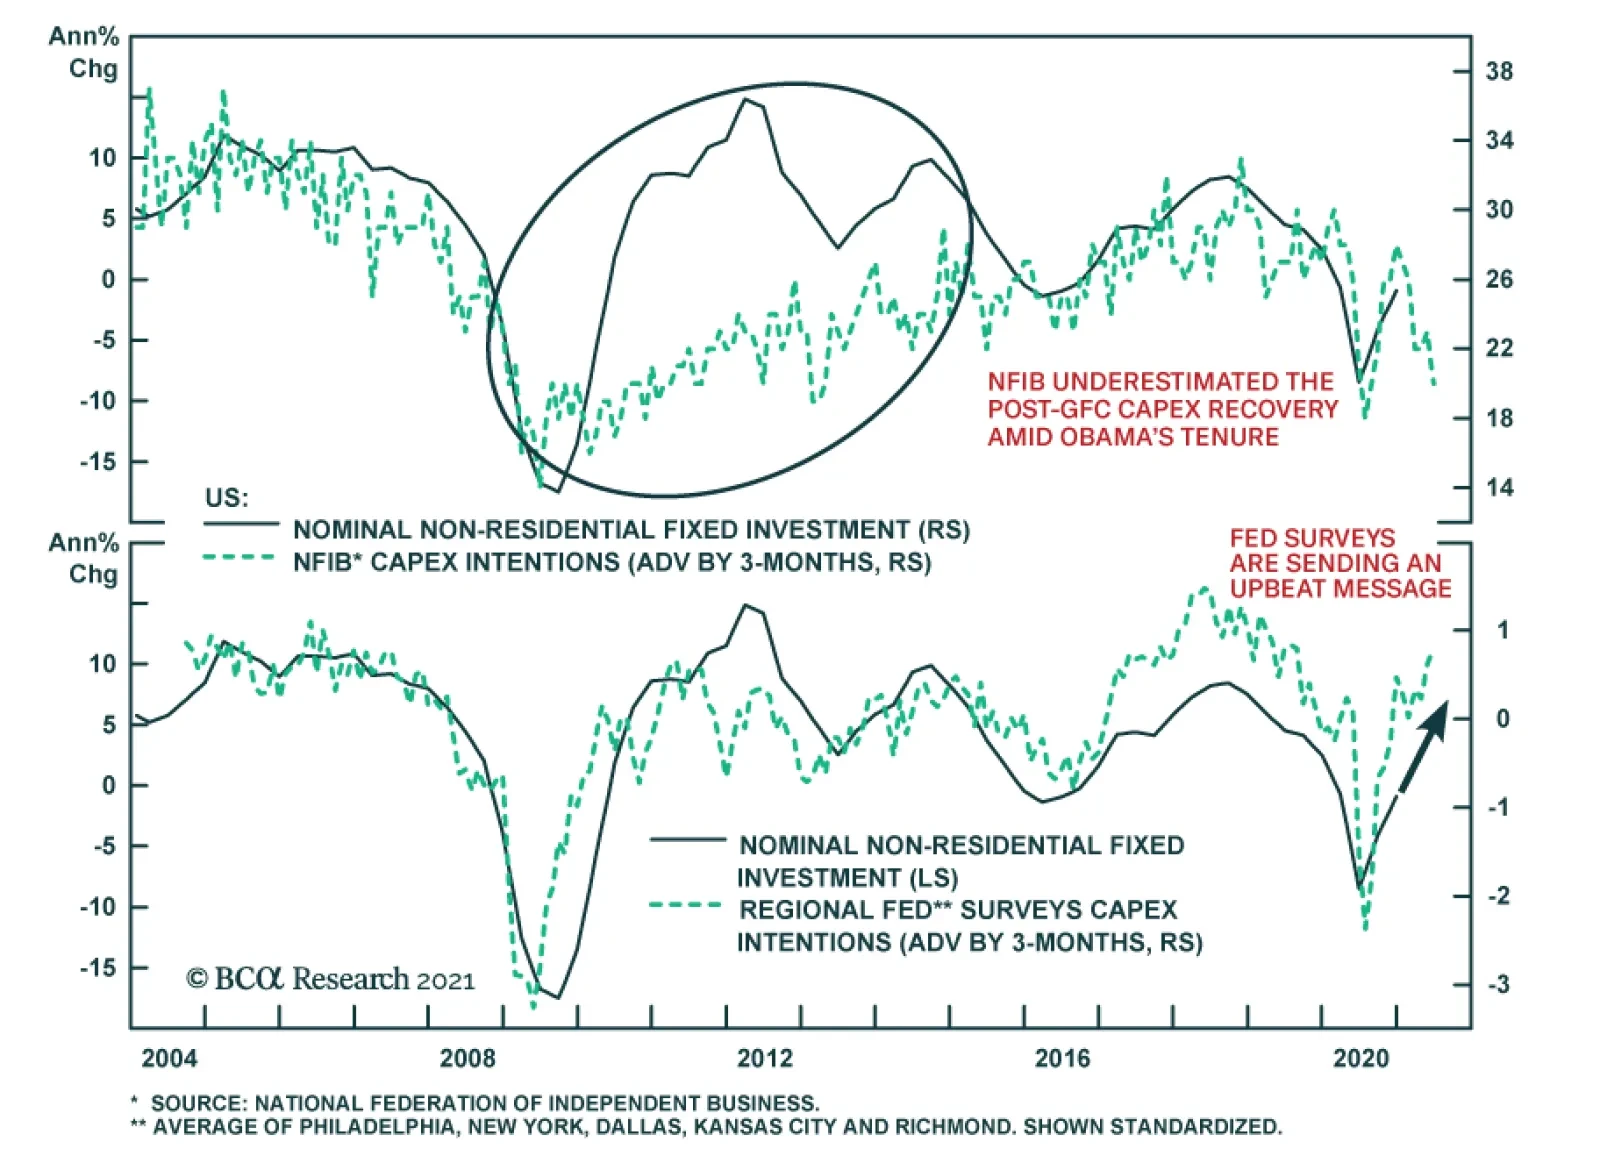
The NFIB Small Business Optimism Survey is sending a warning about US capex. While the overall report was upbeat, the share of business owners planning to make a capital expenditure during the next three to six months ticked down to 20 from 23. This is…
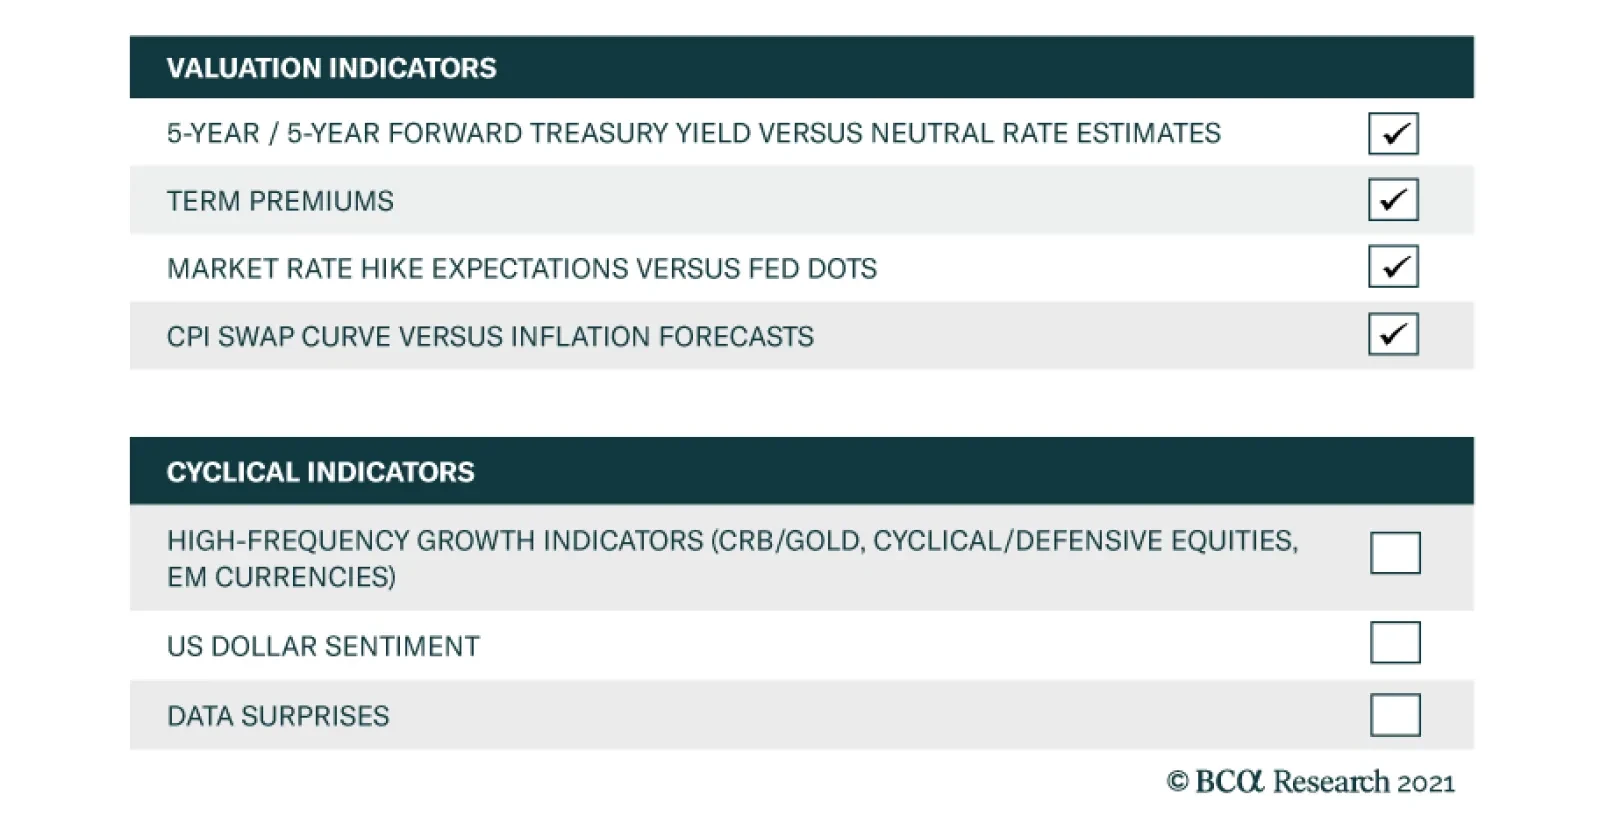
According to BCA Research’s US Bond Strategy service, bond yields could overshoot their fair value in the near term. Maintain below-benchmark portfolio duration. All in all, the message from the valuation indicators in the team’s Checklist is that a robust…
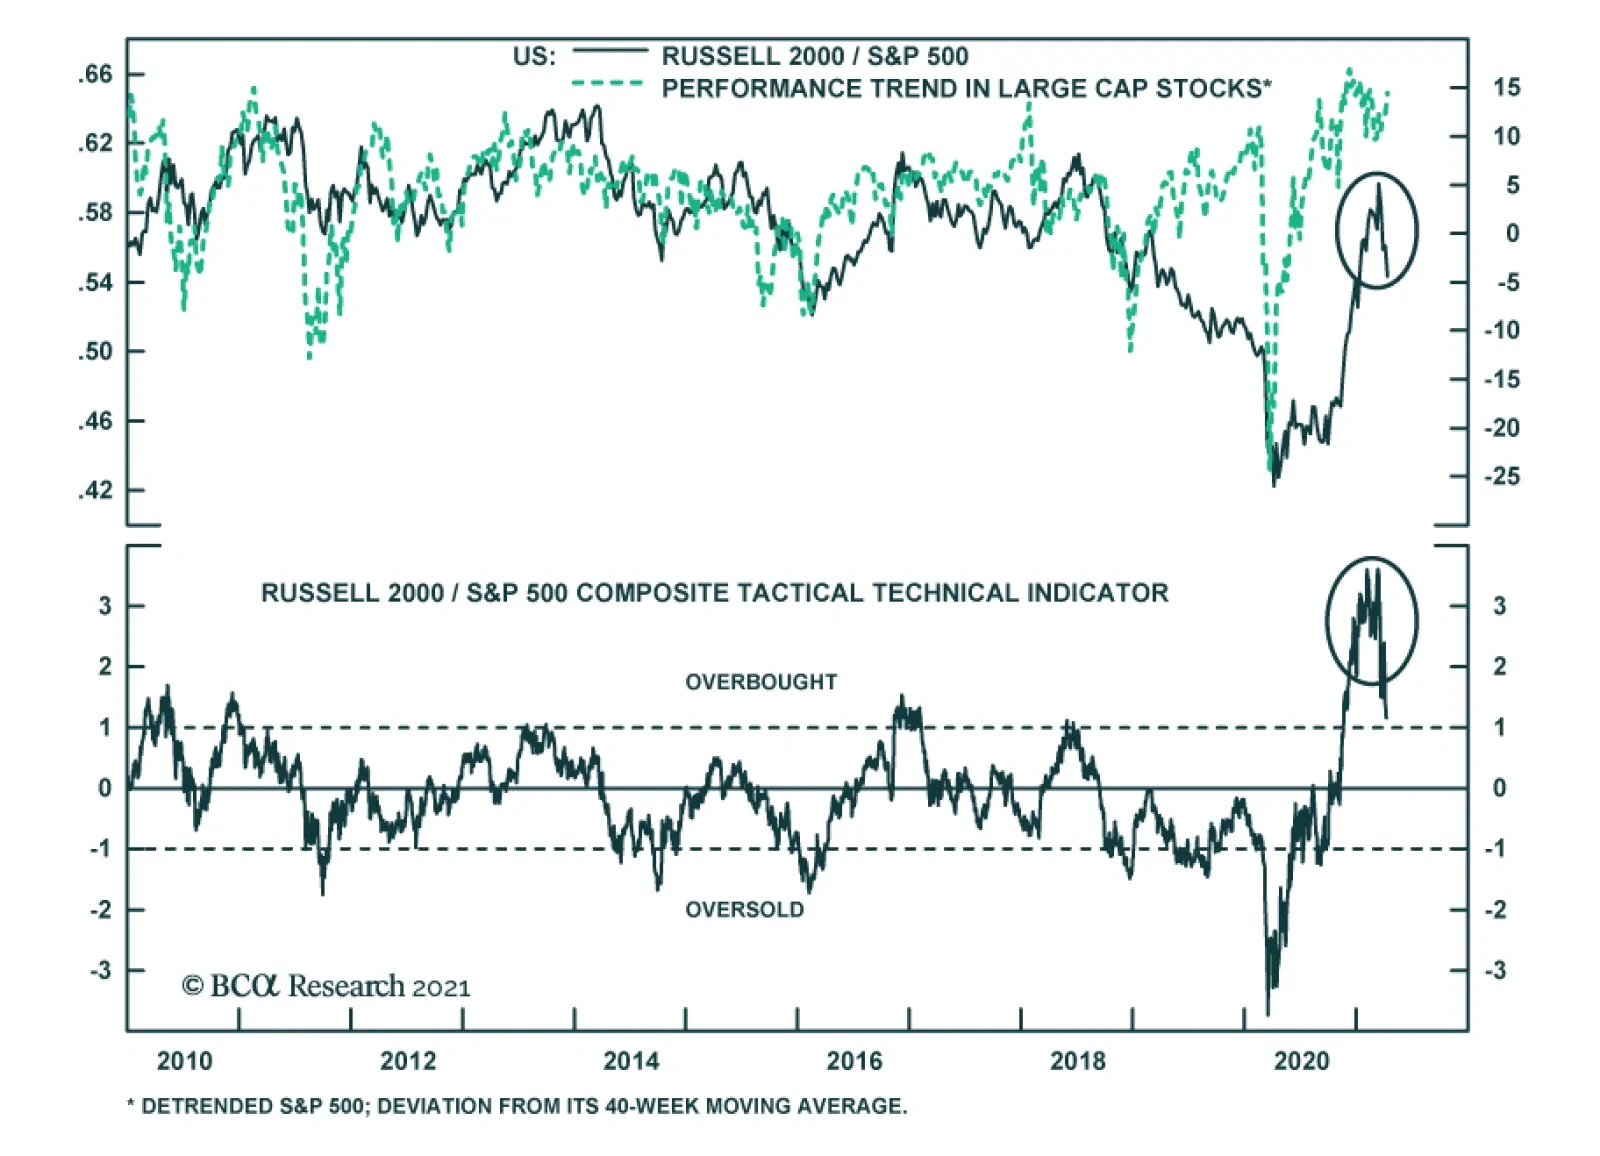
Small cap stocks have significantly outperformed large cap stocks since November, after having substantially underperformed in the early stages of the pandemic. As such, investors have looked at small cap stocks’ recently stellar relative performance as…
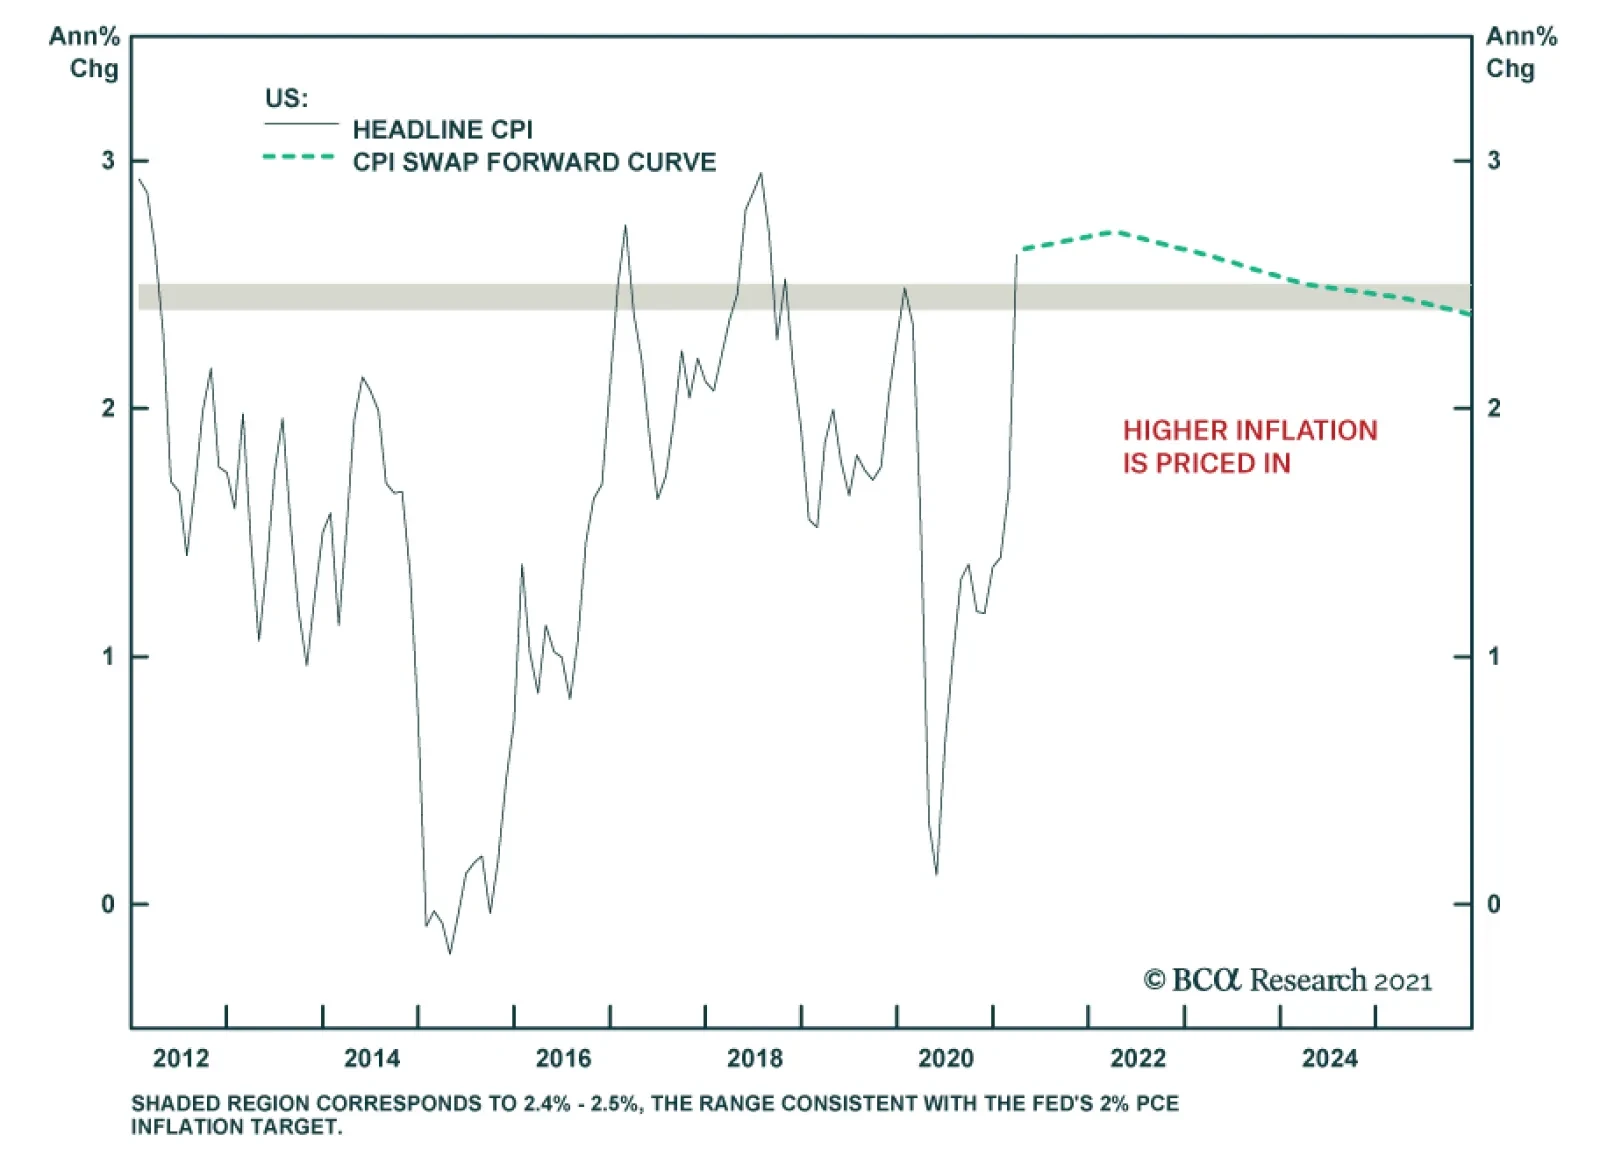
As expected, US inflation jumped in March. Headline CPI surged to a 31-month high of 2.6% y/y while core CPI rebounded to 1.6% y/y from 1.3% y/y. The impact of last year’s low base is in part to blame, but month-on-month changes suggest there is more at play.…