United States
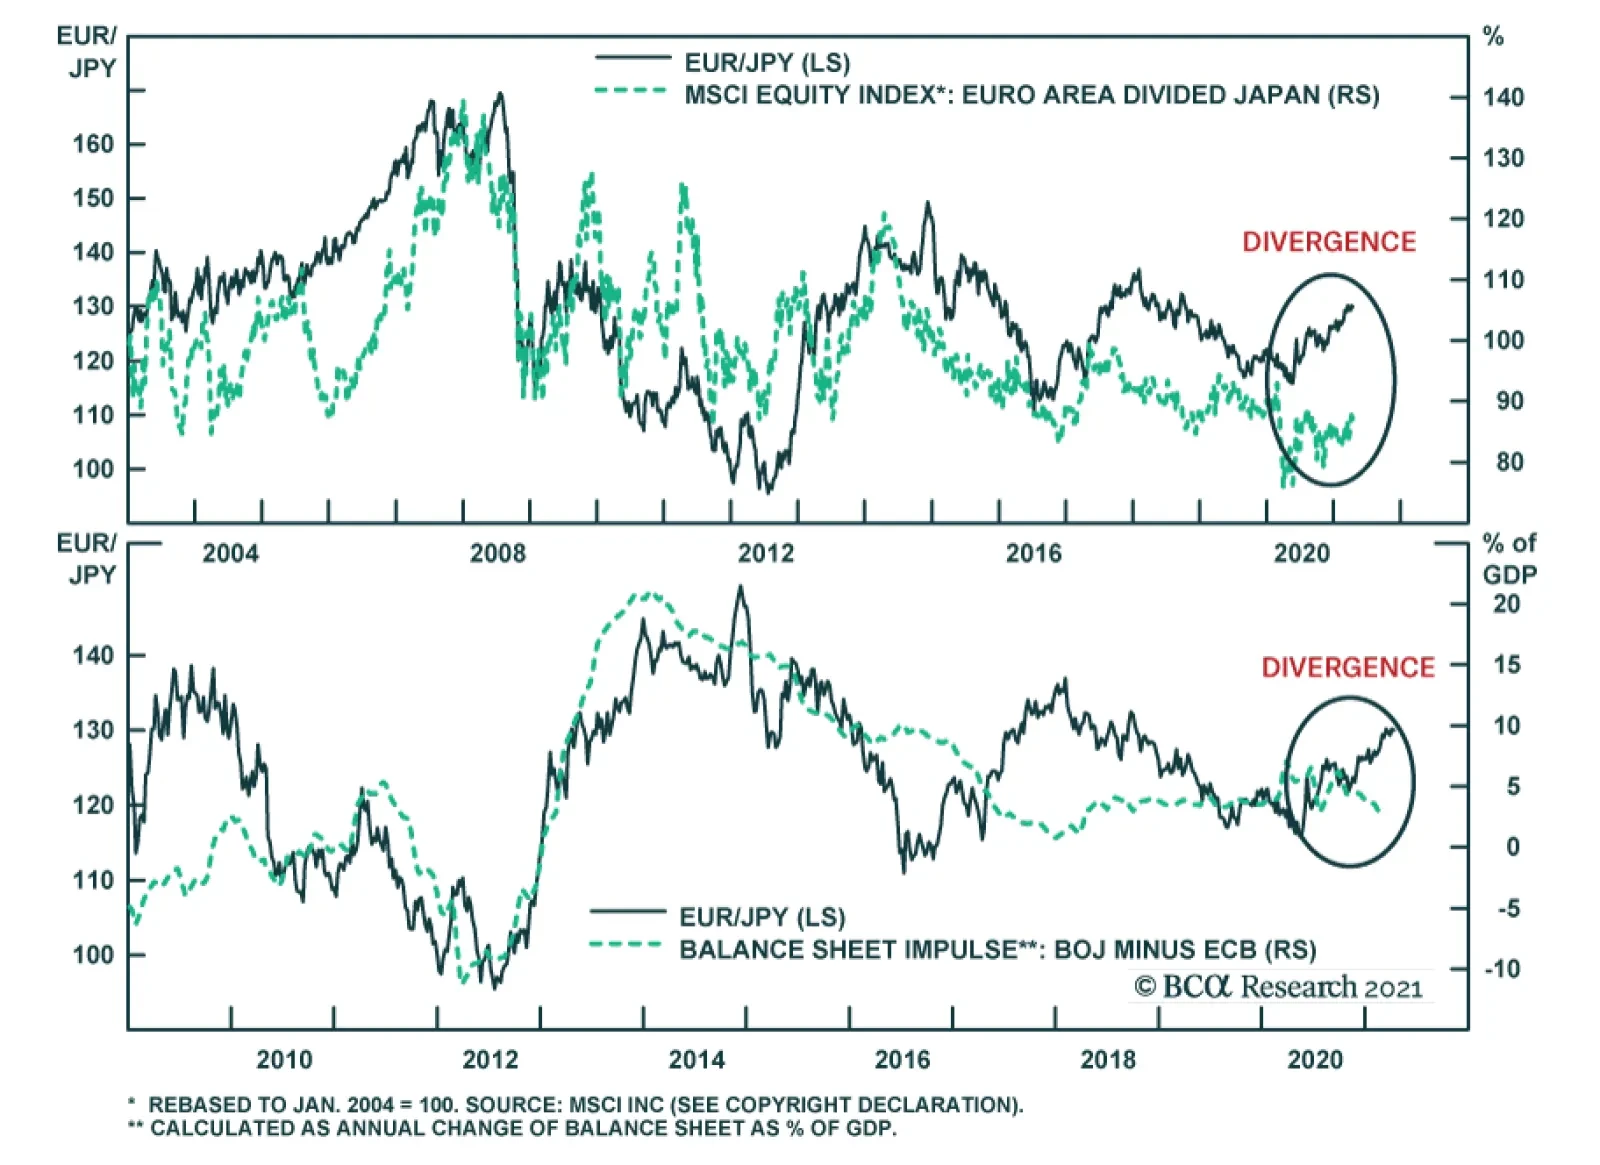
BCA Research’s Foreign Exchange Strategy service concludes that the dollar remains in a sweet spot for now, but it could nonetheless experience violent moves in the coming weeks. Thus, they are opening a short EUR/JPY position as a portfolio hedge. The…

Highlights Q1/2021 Performance Breakdown: Our recommended model bond portfolio outperformed the custom benchmark index by +55bps during the first quarter of the year. Winners & Losers: The government bond side of the portfolio outperformed by +68bps, led overwhelmingly by our underweight to US Treasuries (+63bps). Spread product allocations underperformed by -11bps, primarily due to an overweight on UK corporates (-8bps). Portfolio Positioning For The Next Six Months: We are sticking with an overall below-benchmark portfolio duration stance, given accelerating global growth momentum, expanding vaccinations and a highly stimulative fiscal/monetary policy mix. We are maintaining a moderate overweight to global spread product versus government debt, concentrated on an overweight to US high-yield given more stretched valuations in other credit sectors. On the margin, we are making the following changes to the portfolio allocations: downgrading both UK Gilts and UK investment grade corporates to neutral, while cutting the overall allocation to EM USD credit to neutral. Feature The first quarter of 2021 saw a sharp sell-off in global bond markets on the back of rising growth expectations, fueled by US fiscal stimulus and vaccine optimism. The US was near the front of the pack, with 10-year Treasuries having their biggest first quarter sell-off since 1994. Accommodative financial conditions, fueled by a highly stimulative mix of monetary and fiscal policies and improving sentiment, have lit a fire under a global economy set to reopen from pandemic lockdowns. Going forward, we expect US growth to continue leading the way, with implications for the dollar, commodity prices, and the expected path of policy rates. With that in mind, this week we are reviewing the performance of the BCA Research Global Fixed Income Strategy (GFIS) model bond portfolio during the first quarter of 2021. We also present our recommended positioning for the portfolio for the next six months (Table 1), as well as portfolio return expectations for our base case and alternative investment scenarios. Table 1GFIS Model Bond Portfolio Recommended Positioning For The Next Six Months
GFIS Model Bond Portfolio Q1/2021 Performance Review & Current Allocations: Grand Reopening
GFIS Model Bond Portfolio Q1/2021 Performance Review & Current Allocations: Grand Reopening
As a reminder to existing readers (and to new clients), the model portfolio is a part of our service that complements the usual macro analysis of global fixed income markets. The portfolio is how we communicate our opinion on the relative attractiveness between government bond and spread product sectors. We do this by applying actual percentage weightings to each of our recommendations within a fully invested hypothetical bond portfolio. Q1/2021 Model Portfolio Performance Breakdown: Steering Clear Of Duration Chart 1Q1/2021 Performance: Bearish UST Bets Pay Off
Q1/2021 Performance: Bearish UST Bets Pay Off
Q1/2021 Performance: Bearish UST Bets Pay Off
The total return for the GFIS model portfolio (hedged into US dollars) in the first quarter was -1.83%, dramatically outperforming the custom benchmark index by +55bps (Chart 1).1 This follows modest outperformance in 2020 which was driven largely by overweights on spread product initiated after the pandemic shock to markets. In terms of the specific breakdown between the government bond and spread product allocations in our model portfolio, the former generated +68bps of outperformance versus our custom benchmark index while the latter underperformed by -11bps. Our allocations to inflation-linked bonds in the US, Canada and Europe - which were a source of outperformance in 2020 - modestly underperformed this quarter (-2bps) as global real yields finally began to pick up. Our outperformance this quarter was driven overwhelmingly by our decision to go significantly underweight US Treasuries, and to position for a bearish steepening of the Treasury curve, ahead of last November’s US presidential election (Table 2). That resulted in the US Treasury allocation generating a massive +63bps of excess return in Q1/2022 as longer-term US yields surged higher. Table 2GFIS Model Bond Portfolio Q1/2021 Overall Return Attribution
GFIS Model Bond Portfolio Q1/2021 Performance Review & Current Allocations: Grand Reopening
GFIS Model Bond Portfolio Q1/2021 Performance Review & Current Allocations: Grand Reopening
The size of the US underweight was unusually large as we maintained only a neutral exposure to the other “high beta” markets that are typically positively correlated to US yield moves, Canada and Australia. Although the returns for those two government bond markets were very similar to that of US Treasuries in Q1, so the choice to stay neutral even with a bearish directional view on US yields did not impact the overall portfolio performance. Overweights to the more defensive “low beta” markets of Germany, France and Japan contributed a combined +4bps. We did see some losses on nominal government bonds in peripheral Europe (Italy: -0.6bps; Spain: -1.9bps), however, with the narrowing in spreads thrown off by a botched vaccine rollout. In spread product, underperformance came from overweights to UK investment grade corporates (-8bps), US CMBS (-4bps), and EM USD-denominated corporates (-2bps). This was despite the fact that spreads for UK corporates remained flat while US CMBS spreads actually narrowed. These losses were slightly offset by the overweight to lower-rated US high-yield (+3bps) and underweight to US agency MBS (+2bps). Our spread product losses, in total return terms, highlight the importance of considering duration risk when making a call on spread product, especially at a time when sovereign yields are rising and spreads offer little “cushion”. Duration also played a big part in nominal government bond outperformance, with a whopping +43bps of our total +55bps outperformance concentrated in just US Treasuries with a maturity greater than 10 years. In other words, overweighting overall global spread product and underweighting government bonds still generated major portfolio outperformance, even if there was a more mixed bag of returns within that credit overweight. The bar charts showing the total and relative returns for each individual government bond market and spread product sector are presented in Charts 2 & 3. Chart 2GFIS Model Bond Portfolio Q1/2021 Government Bond Performance Attribution
GFIS Model Bond Portfolio Q1/2021 Performance Review & Current Allocations: Grand Reopening
GFIS Model Bond Portfolio Q1/2021 Performance Review & Current Allocations: Grand Reopening
Chart 3GFIS Model Bond Portfolio Q1/2021 Spread Product Performance Attribution By Sector
GFIS Model Bond Portfolio Q1/2021 Performance Review & Current Allocations: Grand Reopening
GFIS Model Bond Portfolio Q1/2021 Performance Review & Current Allocations: Grand Reopening
Biggest Outperformers: Underweight US Treasuries with a maturity greater than 10 years (+43bps), maturity between 7 and 10 years (+11bps), and with a maturity between 5 and 7 years (+7bps) Overweight US high-yield (+3bps) Underweight US agency MBS (+2bps) Overweight Italian inflation-indexed BTPs (+2bps) Biggest Underperformers: Overweight UK investment grade corporates (-8bps) Overweight US agency CMBS (-4bps) Overweight Spanish government bonds (-2bps) Chart 4 presents the ranked benchmark index returns of the individual countries and spread product sectors in the GFIS model bond portfolio for Q1/2021. Returns are hedged into US dollars (we do not take active currency risk in this portfolio) and adjusted to reflect duration differences between each country/sector and the overall custom benchmark index for the model portfolio. We have also color coded the bars in each chart to reflect our recommended investment stance for each market during Q1 (red for underweight, dark green for overweight, gray for neutral). Chart 4Ranking The Winners & Losers From The GFIS Model Bond Portfolio Universe In Q1/2021
GFIS Model Bond Portfolio Q1/2021 Performance Review & Current Allocations: Grand Reopening
GFIS Model Bond Portfolio Q1/2021 Performance Review & Current Allocations: Grand Reopening
Ideally, we would look to see more green bars on the left side of the chart where market returns are highest, and more red bars on the right side of the chart were returns are lowest. On that front, our portfolio allocations performed exceptionally well in Q1. In total return terms, the global bond market sell-off was a disaster for both government bonds and spread product. US high-yield, one of our longer-standing overweights, was the only sector to emerge unscathed, delivering a positive return of +42bps. Within our government bond allocation, the “defensive” markets—Japan (-44bps), Germany, (-261bps) and France (-371bps)—were nevertheless shaken by rising yields. On the other hand, we limited our downside by maintaining a neutral stance on the higher beta markets such as Canada (-406bps), New Zealand (-415bps), and the UK (-1389bps). Gilts sold off especially sharply as the UK outperformed global peers on COVID-19 vaccinations while inflation expectations continued to pick up. Our two underweights, US Treasuries (-426bps) and European high-yield (-426bps), were prescient. The latter market was one we chose to underweight given that spreads didn’t offer nearly enough compensation on a default-adjusted and breakeven basis. Bottom Line: Our model bond portfolio outperformed its benchmark index in the first quarter of the year by +55bps – a positive result driven by our underweight allocation to the US Treasury market and overall below-benchmark global duration stance. Future Drivers Of Portfolio Returns & Scenario Analysis Chart 5More Growth-Driven Upside For Global Yields Ahead
More Growth-Driven Upside For Global Yields Ahead
More Growth-Driven Upside For Global Yields Ahead
Looking ahead, the performance of the model bond portfolio will continue to be driven predominantly by the future moves of global government bond yields, most notably US Treasuries. Our most favored leading indicators for global bond yields continue to signal more upside over at least the next six months (Chart 5). Our Global Duration Indicator, comprised of measures of future economic sentiment and momentum, remains at an elevated level. The ongoing climb in the global manufacturing PMI, which typically leads global real bond yields by around six months, suggests that the recent uptick in real yields can continue into the second half of 2021. We are still maintaining a bias towards bearish yield curve steepening across all the countries in the model bond portfolio. It is still far too soon to see bearish flattening of yield curves given the dovish bias of global central banks, many of which are actively targeting an overshoot of their own inflation targets. The US will be the first central bank to see any bearish flattening pressure, as the market more aggressively pulls forward the liftoff date of the next Fed tightening cycle in response to strong US growth, but that is an outcome we do not expect until well into the second half of 2021. With regards to country allocations within the government bond segment of the model bond portfolio, we continue to focus our maximum underweight on the US, while limiting exposure to the markets that are more sensitive to changes in US interest rates (Chart 6). Those “lower yield beta” markets (Germany, France and Japan) will continue to outperform the higher beta markets (Canada, Australia) over the latter half of 2021. We currently have Canada on “downgrade watch”, as economic momentum is accelerating and the housing bubble looks to be reflating, both of which will make the Bank of Canada turn more hawkish shortly after the Fed does. We are more comfortable keeping Australia at neutral, as Australian inflation is likely to remain too underwhelming for the Reserve Bank of Australia to turn less dovish and risk a surge in the Australian dollar. UK Gilts are a more difficult case, atypically acting like a lower beta market over the past few years. As we discussed in a Special Report published last month, we attribute the declining Gilt yield beta to the rolling shocks the UK has suffered over the past thirteen years – the 2008 global financial crisis, the 2012 euro area debt crisis, Brexit and, now, COVID-19 – that have hamstrung the Bank of England’s ability to try even modest interest rate hikes.2 With the impact of those shocks on UK growth now diminishing, we see the central bank under greater pressure to begin normalizing UK monetary policy over the couple of years. We downgraded our cyclical stance on UK Gilts and UK investment grade corporates to neutral from overweight in that Special Report and, this week, we are making the same reduction in UK weightings in our model bond portfolio (see the portfolio tables on pages 20-21). After that change, the overall duration of the model bond portfolio remains below that of the custom benchmark index, now by -0.75 years (Chart 7). Chart 6Low-Beta Markets Will Continue To Outperform USTs
Low-Beta Markets Will Continue To Outperform USTs
Low-Beta Markets Will Continue To Outperform USTs
Chart 7Overall Portfolio Duration: Stay Below Benchmark
Overall Portfolio Duration: Stay Below Benchmark
Overall Portfolio Duration: Stay Below Benchmark
We continue to see the dovish bias of global central bankers as being conducive to the outperformance of inflation-linked bonds versus nominal government debt (Chart 8). Yes, the “easy money” has been made betting on a recovery of inflation expectations from the bombed-out levels seen after the COVID-19 recession in 2020. However, within the major developed economies with inflation-linked bond markets, 10-year breakevens have already climbed beyond the pre-pandemic levels of early 2020 (Chart 9). The next targets are the previous cyclical highs seen in 2018 (and 2019 for the UK). Chart 8Dovish Central Banks Still Positive For Inflation-Linked Bonds
Dovish Central Banks Still Positive For Inflation-Linked Bonds
Dovish Central Banks Still Positive For Inflation-Linked Bonds
Chart 9Inflation Breakevens Returning To Past Cyclical Peaks
Inflation Breakevens Returning To Past Cyclical Peaks
Inflation Breakevens Returning To Past Cyclical Peaks
Chart 10Still A Supportive Backdrop For Global Corporates
Still A Supportive Backdrop For Global Corporates
Still A Supportive Backdrop For Global Corporates
The 10-year US TIPS breakeven is already past that 2018 peak of 2.18%, and with the Fed showing no sign of concern about US growth and inflation accelerating, the 10-year US breakeven should end up moving into the high end of our expected 2.3-2.5% target range before the Fed begins to turn less dovish. Thus, we are maintaining a core allocation to linkers in the portfolio, focused on US TIPS and inflation-linked bonds in Italy, France and Canada. The same aggressive easing of global monetary policy that has been good for relative inflation-linked bond performance continues to benefit global corporate bonds. The annual rate of growth of the combined balance sheets of the Fed, ECB, Bank of Japan and Bank of England remains an excellent leading indicator of the excess returns of both global investment grade and high-yield corporates over the past decade (Chart 10). With the combined balance sheet now expanding at a 55% pace, corporate bonds are still likely to continue to outperform government debt over the remainder of 2021. Much of that expected return outperformance of corporates will come via carry rather than spread compression, though. Our preferred measure of the attractiveness of credit spreads, the historical percentile ranking of 12-month breakeven spreads, shows that only US high-yield spreads are above the bottom quartile of their history among the credit sectors in our model portfolio (Chart 11). Given the absence of spread cushion in those other markets, we are maintaining an overweight stance on US high-yield in the model bond portfolio – especially versus euro area high-yield where we are underweight - while staying neutral investment grade credit in the US and Europe. Chart 11US High-Yield: The Last Bastion Of Attractive Spreads
GFIS Model Bond Portfolio Q1/2021 Performance Review & Current Allocations: Grand Reopening
GFIS Model Bond Portfolio Q1/2021 Performance Review & Current Allocations: Grand Reopening
Within the euro area, we continue to prefer owning Italian government bonds over investment grade corporates, given the European Central Bank’s more explicit support for the former through quantitative easing (Chart 12). We expect Italian yields and spreads to converge down to Spanish levels, likely within the next 6-12 months, while there is limited downside for euro area investment grade spreads given tight valuations. Chart 12Favor Italian BTPs Over Euro Area IG
Favor Italian BTPs Over Euro Area IG
Favor Italian BTPs Over Euro Area IG
We are not only looking at relative valuation considerations in developed market credit. Emerging market (EM) USD-denominated credit has benefited from a bullish combination of global policy stimulus, a weakening US dollar and rising commodity prices. We have positioned for that in our model portfolio through an overall overweight stance on EM USD credit, but one that favors investment grade corporates over sovereigns. Now, with the Chinese credit impulse likely to slow in the latter half of 2021 as Chinese policymakers look to rein in stimulus, a slower pace of Chinese economic growth represents a risk to EM credit (Chart 13). The same can be said for the US dollar, which is no longer depreciating with US bond yields rising and the markets questioning the Fed’s dovish forward guidance on future rate hikes (Chart 14). A strong US dollar would also be a risk to the commodity price rally that has supported EM financial assets. Chart 13Global Policy Mix Becoming Less Supportive For EM
Global Policy Mix Becoming Less Supportive For EM
Global Policy Mix Becoming Less Supportive For EM
Chart 14A Stronger USD Is A Risk For EM Corporates Vs Sovereigns
A Stronger USD Is A Risk For EM Corporates Vs Sovereigns
A Stronger USD Is A Risk For EM Corporates Vs Sovereigns
Chart 15A Moderate Overweight To Spread Product Vs Government Debt
GFIS Model Bond Portfolio Q1/2021 Performance Review & Current Allocations: Grand Reopening
GFIS Model Bond Portfolio Q1/2021 Performance Review & Current Allocations: Grand Reopening
In response to these growing risks to the bullish EM backdrop, we are downgrading our overall EM USD credit exposure in the model bond portfolio to neutral from overweight. We are maintaining our relative preference for EM investment grade corporates over sovereigns, however, within that overall neutral allocation. Summing it all up, we are sticking with a moderately overweight stance on global spread product versus government debt in the model portfolio, equal to four percentage points (Chart 15). That overweight comes entirely from the US high-yield allocation. After the changes made to our UK and EM positions, the tracking error of the portfolio, or its expected volatility versus that of the benchmark index, is quite low at 41bps (Chart 16). This is an unsurprising outcome given that the current positioning is focused so heavily on the US (Treasury underweight, high-yield overweight), with much of the other positioning close to neutral. That will change as 2021 progresses but, for now, our highest conviction views are in US fixed income. One final point – the relatively concentrated positioning leaves the portfolio “flat carry”, with a yield roughly equal to that of the benchmark index (Chart 17). Chart 16Limited Use Of Portfolio 'Tracking Error'
Limited Use Of Portfolio 'Tracking Error'
Limited Use Of Portfolio 'Tracking Error'
Chart 17Model Portfolio Yield Close To Benchmark
Model Portfolio Yield Close To Benchmark
Model Portfolio Yield Close To Benchmark
Scenario Analysis & Return Forecasts After making the shifts to our model bond portfolio allocations in the UK and EM, we now turn to scenario analysis to determine the return expectations for the portfolio for the next six months. On the credit side of the portfolio, we use risk-factor-based regression models to forecast future yield changes for global spread product sectors as a function of four major factors - the VIX, oil prices, the US dollar and the fed funds rate (Table 2A). For the government bond side of the portfolio, we avoid using regression models and instead use a yield-beta driven framework, taking forecasts for changes in US Treasury yields and translating those in changes in non-US bond yields by applying a historical yield beta (Table 2B). For our scenario analysis over the next six months, we use a base case scenario plus two alternate “tail risk” scenarios, based on the following descriptions and inputs: Table 2AFactor Regressions Used To Estimate Spread Product Yield Changes
GFIS Model Bond Portfolio Q1/2021 Performance Review & Current Allocations: Grand Reopening
GFIS Model Bond Portfolio Q1/2021 Performance Review & Current Allocations: Grand Reopening
Table 2BEstimated Government Bond Yield Betas To US Treasuries
GFIS Model Bond Portfolio Q1/2021 Performance Review & Current Allocations: Grand Reopening
GFIS Model Bond Portfolio Q1/2021 Performance Review & Current Allocations: Grand Reopening
Base case: Ongoing global vaccinations lead to more of the global economy reopening over the summer, with excess savings built up during the pandemic – augmented by ongoing fiscal support – starting to be spent. US economic growth will be most robust out of the major economies, given the additional boost from fiscal stimulus, while China implements actions to slow credit growth and the euro area lags on vaccinations. The Fed stands its ground and maintains no rate hikes until at least 2023, and US TIPS breakevens climb to levels consistent with the Fed’s 2% inflation mandate (2.3-2.5%). The US Treasury curve continues to bear-steepen, with the 10-year US yield rising to 2%. The VIX falls to 15, the US dollar is flat, the Brent oil price rises +5%, and the fed funds rate is unchanged at 0%. Optimistic case: A rapid pace of global vaccinations leads to booming growth led by the US but including a reopening euro area. Chinese policymakers tighten credit by less than expected. Markets begin to pull forward the timing and pace of future central bank interest rate hikes, most notably in the US but also in the other countries like Canada and the UK. Real bond yields continue to climb globally, but inflation breakevens stay elevated. The steepening trend of the US Treasury curve ends, and mild bear flattening begins with the 10-year reaching 2.2% and the 2-year yield climbing to 0.4%. The VIX stays unchanged at 18, the US dollar rises +5%, the Brent oil price climbs +2.5% and the fed funds rate stays unchanged. Pessimistic case: Setbacks on the pandemic, either from struggles with vaccine distribution or a surge in variant cases, lead to a slower pace of global growth momentum. Europe cannot reopen, China tightens credit policy faster than expected, and US households hold onto to excess savings amid lingering virus uncertainty. Diminished economic optimism leads to a pullback in global equity values and wider global credit spreads. The US Treasury curve bull flattens as longer-maturity yields fall in a risk-off move, with the 10-year yield moving back down to 1.5%. The VIX rises to 25, the US dollar falls -2.5% and the fed funds rate stays at 0%. The inputs into the scenario analysis are shown in Chart 18 (for the USD, VIX, oil and the fed funds rate), while the US Treasury yield scenarios are in Chart 19. The excess return scenarios for the model bond portfolio, using the above inputs in our simple quantitative return forecast framework, are shown in Table 3A (the scenarios for the changes in US Treasury yields are shown in Table 3B). Chart 18Risk Factor Assumptions For The Scenario Analysis
Risk Factor Assumptions For The Scenario Analysis
Risk Factor Assumptions For The Scenario Analysis
Chart 19US Treasury Yield Assumptions For The Scenario Analysis
US Treasury Yield Assumptions For The Scenario Analysis
US Treasury Yield Assumptions For The Scenario Analysis
Table 3AGFIS Model Bond Portfolio Scenario Analysis For The Next Six Months
GFIS Model Bond Portfolio Q1/2021 Performance Review & Current Allocations: Grand Reopening
GFIS Model Bond Portfolio Q1/2021 Performance Review & Current Allocations: Grand Reopening
Table 3BUS Treasury Yield Assumptions For The 6-Month Forward Scenario Analysis
GFIS Model Bond Portfolio Q1/2021 Performance Review & Current Allocations: Grand Reopening
GFIS Model Bond Portfolio Q1/2021 Performance Review & Current Allocations: Grand Reopening
The model bond portfolio is expected to deliver an excess return over the next six months of +46bps in the base case and +54bps in the optimistic scenario, but is only projected to underperform by -27bps in the pessimistic scenario. Bottom Line: We are sticking with an overall below-benchmark portfolio duration stance, given accelerating global growth momentum, expanding vaccinations and a highly stimulative fiscal/monetary policy mix. We are maintaining a moderate overweight to global spread product versus government debt, concentrated on an overweight to US high-yield given more stretched valuations in other credit sectors. On the margin, we are making the following changes to the portfolio allocations: downgrading both UK Gilts and UK investment grade corporates to neutral, while cutting the overall allocation to EM USD credit to neutral. Robert Robis, CFA Chief Fixed Income Strategist rrobis@bcaresearch.com Shakti Sharma Research Associate ShaktiS@bcaresearch.com Footnotes 1 The GFIS model bond portfolio custom benchmark index is the Bloomberg Barclays Global Aggregate Index, but with allocations to global high-yield corporate debt replacing very high quality spread product (i.e. AA-rated). We believe this to be more indicative of the typical internal benchmark used by global multi-sector fixed income managers. 2 Please see BCA Research Global Fixed Income Strategy/Foreign Exchange Strategy Special Report, "Why Are UK Interest Rates Still So Low?", dated March 10, 2021, available at gfis.bcaresearch.com. Recommendations The GFIS Recommended Portfolio Vs. The Custom Benchmark Index
GFIS Model Bond Portfolio Q1/2021 Performance Review & Current Allocations: Grand Reopening
GFIS Model Bond Portfolio Q1/2021 Performance Review & Current Allocations: Grand Reopening
Duration Regional Allocation Spread Product Tactical Trades Yields & Returns Global Bond Yields Historical Returns
Highlights Chart 1How Long Until Full Employment?
How Long Until Full Employment?
How Long Until Full Employment?
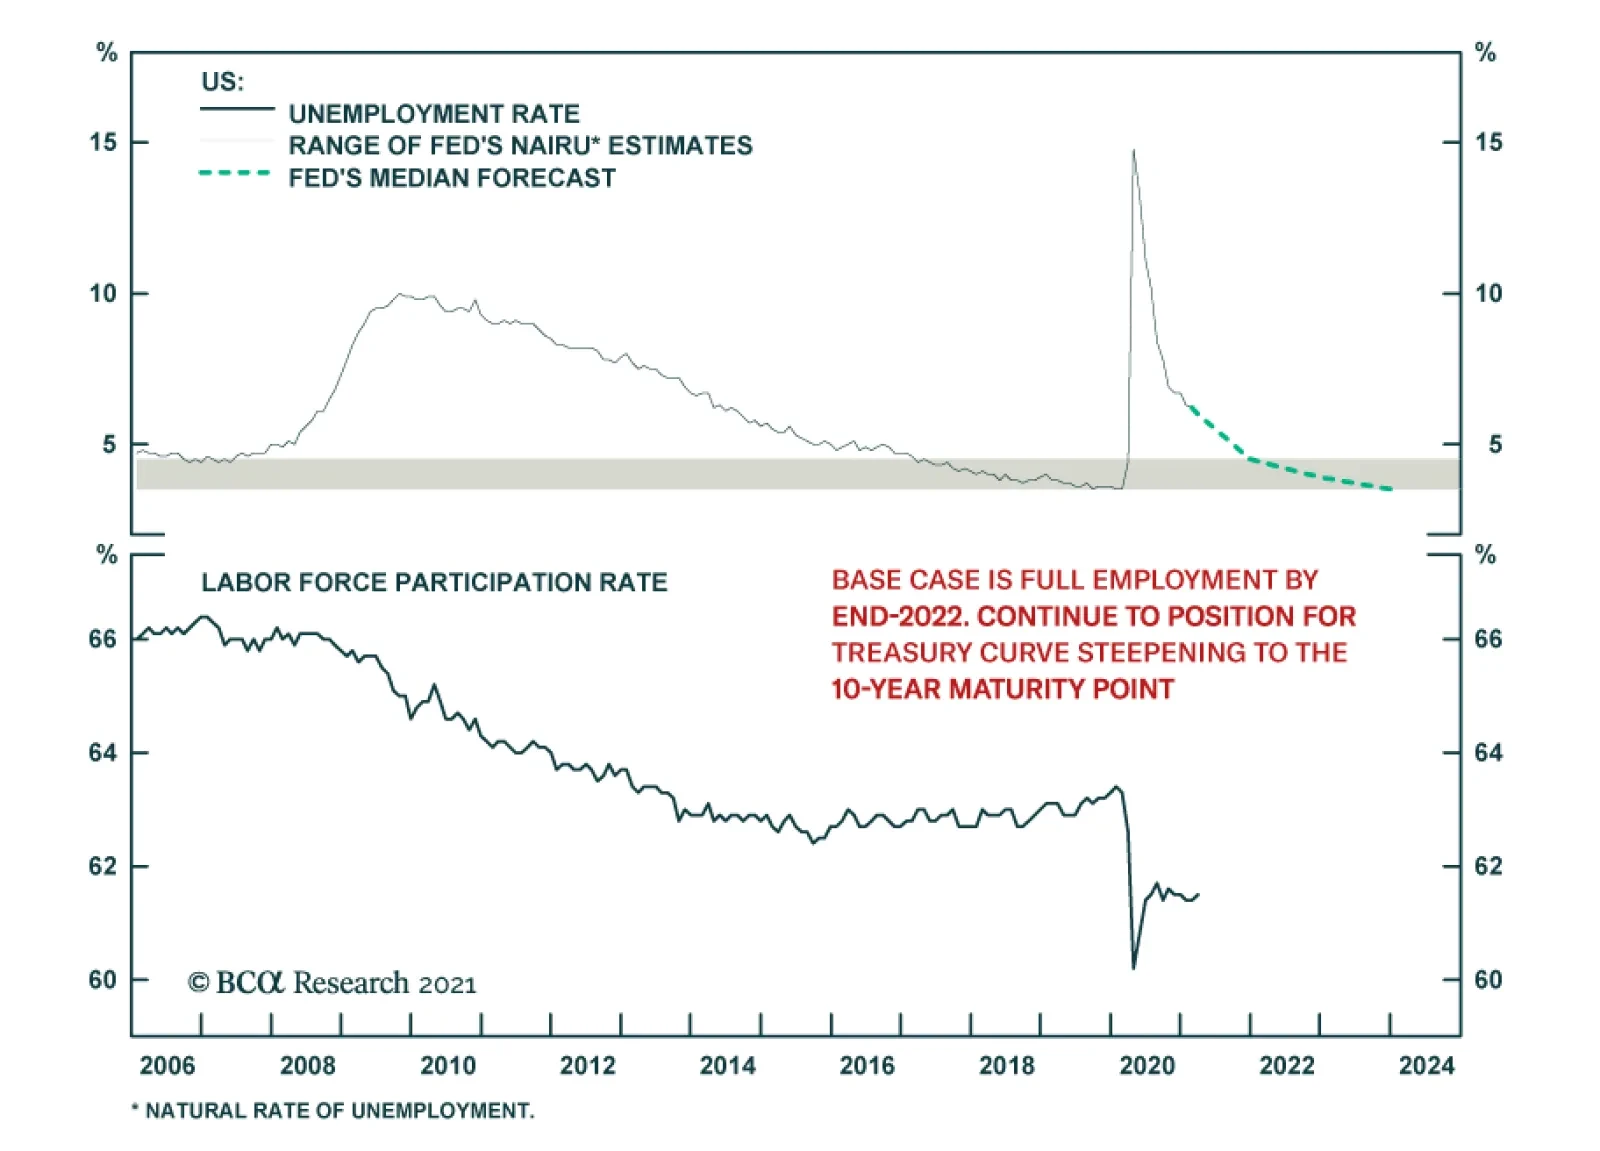
It’s official. The vaccination roll-out is successfully suppressing the spread of COVID-19 throughout the United States and the associated economic re-opening is leading to a surge in activity. Not only did March’s ISM Manufacturing PMI come in at 64.7, its highest reading since 1983, but the economy also added 916 thousand jobs during the month. Interestingly, the 10-year Treasury yield was relatively stable last week despite the eye-catching economic data. This is likely because the Treasury curve already discounted a significant rebound in economic activity and last week’s data merely confirmed the market’s expectations. At present, the Treasury curve is priced for Fed liftoff in September 2022 and a total of five rate hikes by the end of 2023. By our calculations, the Fed will be ready to lift rates by the end of 2022 if monthly employment growth averages at least 410k between now and then (Chart 1). If payroll growth can somehow stay above 701k per month, then the Fed will hit its “maximum employment” target by the end of this year. While a lot of good news is already priced in the Treasury curve, the greatest near-term risk is that the data continue to beat expectations. Maintain below-benchmark portfolio duration. Feature Table 1Recommended Portfolio Specification
It’s A Boom!
It’s A Boom!
Table 2Fixed Income Sector Performance
It’s A Boom!
It’s A Boom!
Investment Grade: Neutral Chart 2Investment Grade Market Overview
Investment Grade Market Overview
Investment Grade Market Overview
Investment grade corporate bonds outperformed the duration-equivalent Treasury index by 29 basis points in March, bringing year-to-date excess returns up to +98 bps. The combination of above-trend economic growth and accommodative monetary policy supports positive excess returns for spread product versus Treasuries. Though Treasury yields have risen, this does not yet pose a risk for credit spreads. The 5-year/5-year forward TIPS breakeven inflation rate remains below the Fed’s target range of 2.3% to 2.5%. We won’t be concerned about restrictive monetary policy pushing spreads wider until inflation expectations are well-anchored around the Fed’s target. Despite the positive macro back-drop, investment grade corporate valuations are extremely tight. The investment grade corporate index’s 12-month breakeven spread is down to its 2nd percentile (Chart 2). This means that the breakeven spread has only been tighter 2% of the time since 1995. The same measure shows that Baa-rated bonds have also only been more expensive 2% of the time (panel 3). We don’t anticipate material underperformance versus Treasuries, but we see better value outside of the investment grade corporate space.1 Specifically, we advise investors to favor tax-exempt municipal bonds over investment grade corporates with the same credit rating and duration. We also prefer USD-denominated Emerging Market Sovereign bonds over investment grade corporates with the same credit rating and duration. Finally, the supportive macro environment means we are comfortable adding credit risk to a portfolio. With that in mind, we encourage investors to pick up the additional spread offered by high-yield corporates. Table 3ACorporate Sector Relative Valuation And Recommended Allocation*
It’s A Boom!
It’s A Boom!
Table 3BCorporate Sector Risk Vs. Reward*
It’s A Boom!
It’s A Boom!
High-Yield: Overweight Chart 3High-Yield Market Overview
High-Yield Market Overview
High-Yield Market Overview
High-Yield outperformed the duration-equivalent Treasury index by 83 basis points in March, bringing year-to-date excess returns up to +263 bps. In last week’s report we looked at the default expectations that are currently priced into the junk index and considered whether they are likely to be met.2 If we demand an excess spread of 100 bps and assume a 40% recovery rate on defaulted debt, then the High-Yield index embeds an expected default rate of 3.4% (Chart 3). Using a model of the speculative grade default rate that is based on gross corporate leverage (aka pre-tax profits over debt) and C&I lending standards, we can estimate a likely default rate for the next 12 months using assumptions for profit and debt growth. The median FOMC forecast of 6.5% real GDP growth in 2021 is consistent with 31% corporate profit growth. We also assume that last year’s debt binge will be followed by relatively weak corporate debt growth in 2021. According to our model, 30% profit growth and 2% debt growth is consistent with a default rate of 3.4% for the next 12 months, exactly matching what is priced into junk spreads. Given that the Fed’s 6.5% real GDP growth forecast looks conservative given the large amount of fiscal stimulus coming down the pike, and the fact that the combination of strong economic growth and accommodative monetary policy could easily cause valuations to overshoot in the near-term, we are inclined to maintain an overweight allocation to High-Yield bonds. MBS: Underweight Chart 4MBS Market Overview
MBS Market Overview
MBS Market Overview
Mortgage-Backed Securities outperformed the duration-equivalent Treasury index by 17 basis points in March, bringing year-to-date excess returns up to +15 bps. The nominal spread between conventional 30-year MBS and equivalent-duration Treasuries tightened 12 bps in March. This spread remains wide compared to levels seen during the past few years, but it is still tight compared to the recent pace of mortgage refinancings (Chart 4). The MBS option-adjusted spread (OAS) currently sits at 19 bps. This is considerably below the 52 bps offered by Aa-rated corporate bonds, the 38 bps offered by Agency CMBS and the 27 bps offered by Aaa-rated consumer ABS. All in all, the value in MBS is not appealing compared to other similarly risky sectors. The plummeting primary mortgage spread was a key reason for the elevated refi activity seen during the past year. However, the spread has now recovered back to more typical levels (bottom panel). The implication is that further increases in Treasury yields will likely be matched by higher mortgage rates, meaning that mortgage refinancings have probably peaked. The coming drop in refi activity will be positive for MBS returns, but we aren’t yet ready to turn bullish on the sector. First, as mentioned above, value is poor compared to other similarly risky sectors. Second, the gap between the nominal MBS spread and the MBA Refinance Index remains wide (panel 2) and we could still see spreads adjust higher. Government-Related: Neutral Chart 5Government-Related Market Overview
Government-Related Market Overview
Government-Related Market Overview
The Government-Related index outperformed the duration-equivalent Treasury index by 45 basis points in March, bringing year-to-date excess returns up to +66 bps (Chart 5). Sovereign debt outperformed duration-equivalent Treasuries by 157 bps in March, bringing year-to-date excess returns up to +40 bps. Foreign Agencies outperformed the Treasury benchmark by 8 bps on the month, bringing year-to-date excess returns up to +33 bps. Local Authority bonds outperformed by 81 bps in March, bringing year-to-date excess returns up to +286 bps. Domestic Agency bonds underperformed by 2 bps, dragging year-to-date excess returns down to +14 bps. Supranationals outperformed by 7 bps, bringing year-to-date excess returns up to +13 bps. We recently took a detailed look at valuation for USD-denominated Emerging Market (EM) Sovereigns.3 We found that, on an equivalent-duration basis, EM Sovereigns offer a spread advantage over investment grade US corporates. Attractive countries include: Qatar, UAE, Mexico, Russia and Colombia We prefer US corporates over EM Sovereigns in the high-yield space. Ba-rated high-yield US corporates offer a spread advantage over Ba-rated EM Sovereigns and the lower EM credit tiers are dominated by distressed credits like Turkey and Argentina. Municipal Bonds: Overweight Chart 6Municipal Market Overview
Municipal Market Overview
Municipal Market Overview
Municipal bonds outperformed the duration-equivalent Treasury index by 187 basis points in March, bringing year-to-date excess returns up to +291 bps (before adjusting for the tax advantage). Municipal bond spreads have tightened dramatically during the past few months and Aaa-rated Munis now look expensive compared to Treasuries, with the exception of the short-end of the curve (Chart 6). That said, if we match the duration and credit rating between the Bloomberg Barclays Municipal bond indexes and the US Credit index, we find that both General Obligation (GO) and Revenue Munis appear attractive compared to US investment grade Credit, with the possible exception of some short-maturity GO bonds. Revenue Munis offer a before-tax yield pick-up relative to US Credit for maturities above 12 years (bottom panel). Revenue bonds in the 8-12 year maturity bucket offer an after-tax yield pick-up versus Credit for investors with an effective tax rate above 13% (panel 3). Revenue bonds in the 6-8 year maturity bucket offer an after-tax yield pick-up versus Credit for investors with an effective tax rate above 24%. GO Munis with 17+ years to maturity offer an after-tax yield pick-up relative to Credit for investors with an effective tax rate above 1%. This breakeven effective tax rate rises to 6% for the 12-17 year maturity bucket, 23% for the 8-12 year maturity bucket (panel 3) and 32% for the 6-8 year maturity bucket. All in all, municipal bond value has deteriorated markedly in recent months and we downgraded our recommended allocation from “maximum overweight” to “overweight” in January. However, investors should still prefer municipal bonds over investment grade corporate bonds with the same credit rating and duration. Treasury Curve: Buy 5-Year Bullet Versus 2/10 Barbell Chart 7Treasury Yield Curve Overview
Treasury Yield Curve Overview
Treasury Yield Curve Overview
Treasury yields moved up dramatically in March, with the curve steepening out to the 10-year maturity point and flattening thereafter. The 2/10 Treasury slope steepened 28 bps to end the month at 158 bps. The 5/30 slope steepened 7 bps to end the month at 149 bps (Chart 7). As we showed in a recent report, the Treasury curve continues to trade directionally with yields out to the 10-year maturity point.4 Beyond 10 years, the curve has transitioned into a bear flattening/bull steepening regime where higher yields coincide with a flatter curve and vice-versa (bottom panel). For now, we are content to stick with our recommended steepener: long the 5-year bullet and short a duration-matched 2/10 barbell. However, we will eventually be close enough to an expected Fed liftoff date that the 5/10 slope will follow the 10/30 slope and transition into a bear-flattening/bull-steepening regime. When that happens, it will make more sense to either position for a steepener at the front-end of the curve (long 3-year bullet / short 2/5 barbell) or a flattener at the long-end of the curve (long 5/30 barbell / short 10-year bullet). We don’t yet see sufficient evidence of 5/10 bear-flattening to shift out of our current recommended position and into these new ones, and so we stay the course for now. TIPS: Overweight Chart 8TIPS Market Overview
TIPS Market Overview
TIPS Market Overview
TIPS outperformed the duration-equivalent nominal Treasury index by 155 basis points in March, bringing year-to-date excess returns up to +341 bps. The 10-year TIPS breakeven inflation rate rose 22 bps on the month and it currently sits at 2.38%. The 5-year/5-year forward TIPS breakeven inflation rate rose 30 bps in March and it currently sits at 2.15%. Despite last month’s sharp move higher, the 5-year/5-year forward breakeven rate is still below the Fed’s target range of 2.3% to 2.5% (Chart 8). This means that the rising cost of inflation protection is not yet a concern for the Fed, and in fact, the Fed would like to encourage it to rise further still. Our recommended positions in inflation curve flatteners and real curve steepeners continued to perform well last month. The 5/10 TIPS breakeven inflation slope was relatively stable, but the 2/10 CPI swap slope flattened 8 bps (panel 4). The 2/10 real yield curve steepened 31 bps in March to reach 169 bps (bottom panel). An inverted inflation curve has been an unusual occurrence during the past few years, but we think it will be the normal state of affairs going forward. The Fed’s new strategy involves allowing inflation to rise above 2% so that it can attack its inflation target from above rather than from below. This new monetary environment is much more consistent with an inverted inflation curve than an upward sloping one, and we would resist the temptation to put on an inflation curve steepener. ABS: Overweight Chart 9ABS Market Overview
ABS Market Overview
ABS Market Overview
Asset-Backed Securities underperformed the duration-equivalent Treasury index by 4 basis points in March, dragging year-to-date excess returns down to +16 bps. Aaa-rated ABS underperformed by 5 bps on the month, dragging year-to-date excess returns down to +8 bps. Non-Aaa ABS underperformed by 2 bps, dragging year-to-date excess returns down to +56 bps. The stimulus from last year’s CARES act led to a significant increase in household savings when individual checks were mailed last April. This excess savings has still not been spent and now another round of checks is poised to push the savings rate higher again (Chart 9). The large stock of household savings means that the collateral quality of consumer ABS is very high, with many households using their windfall to pay down debt (bottom panel). Investors should remain overweight consumer ABS and take advantage of strong collateral performance by moving down in credit quality. The Treasury department’s decision to let the Term Asset-Backed Loan Facility (TALF) expire at the end of 2020 does not alter our recommendation. Spreads are already well below the borrowing cost that was offered by TALF, and these tight spread levels are justified by strong household balance sheets. Non-Agency CMBS: Neutral Chart 10CMBS Market Overview
CMBS Market Overview
CMBS Market Overview
Non-Agency Commercial Mortgage-Backed Securities underperformed the duration-equivalent Treasury index by 10 basis points in March, dragging year-to-date excess returns down to +77 bps. Aaa Non-Agency CMBS underperformed Treasuries by 23 bps in March, dragging year-to-date excess returns down to +14 bps. Meanwhile, non-Aaa Non-Agency CMBS outperformed by 30 bps, bringing year-to-date excess returns up to +293 bps (Chart 10). We continue to recommend an overweight allocation to Aaa-rated Non-Agency CMBS and an underweight allocation to non-Aaa CMBS. Even with the expiry of TALF, Aaa CMBS spreads are already well below the cost of borrowing through TALF and thus won’t be negatively impacted. Meanwhile, the structurally challenging environment for commercial real estate could lead to problems for lower-rated CMBS (panels 3 & 4). Agency CMBS: Overweight Agency CMBS outperformed the duration-equivalent Treasury index by 10 basis points in March, bringing year-to-date excess returns up to +49 bps. The average index option-adjusted spread tightened 5 bps on the month and it currently sits at 38 bps (bottom panel). Though Agency CMBS spreads have completely recovered back to their pre-COVID lows, they still look attractive compared to other similarly risky spread products. Stay overweight. Appendix A: Butterfly Strategy Valuations The following tables present the current read-outs from our butterfly spread models. We use these models to identify opportunities to take duration-neutral positions across the Treasury curve. The following two Special Reports explain the models in more detail: US Bond Strategy Special Report, “Bullets, Barbells And Butterflies”, dated July 25, 2017, available at usbs.bcaresearch.com US Bond Strategy Special Report, “More Bullets, Barbells And Butterflies”, dated May 15, 2018, available at usbs.bcaresearch.com Table 4 shows the raw residuals from each model. A positive value indicates that the bullet is cheap relative to the duration-matched barbell. A negative value indicates that the barbell is cheap relative to the bullet. Table 4Butterfly Strategy Valuation: Raw Residuals In Basis Points (As Of March 31ST, 2021)
It’s A Boom!
It’s A Boom!
Table 5 scales the raw residuals in Table 4 by their historical means and standard deviations. This facilitates comparison between the different butterfly spreads. Table 5Butterfly Strategy Valuation: Standardized Residuals (As Of March 31ST, 2021)
It’s A Boom!
It’s A Boom!
Table 6 flips the models on their heads. It shows the change in the slope between the two barbell maturities that must be realized during the next six months to make returns between the bullet and barbell equal. For example, a reading of 43 bps in the 5 over 2/10 cell means that we would only expect the 5-year to outperform the 2/10 if the 2/10 slope steepens by more than 43 bps during the next six months. Otherwise, we would expect the 2/10 barbell to outperform the 5-year bullet. Table 6Discounted Slope Change During Next 6 Months (BPs)
It’s A Boom!
It’s A Boom!
Appendix B: Excess Return Bond Map The Excess Return Bond Map is used to assess the relative risk/reward trade-off between different sectors of the US bond market. It is a purely computational exercise and does not impose any macroeconomic view. The Map’s vertical axis shows 12-month expected excess returns. These are proxied by each sector’s option-adjusted spread. Sectors plotting further toward the top of the Map have higher expected returns and vice-versa. Our novel risk measure called the “Risk Of Losing 100 bps” is shown on the Map’s horizontal axis. To calculate it, we first compute the spread widening required on a 12-month horizon for each sector to lose 100 bps or more relative to a duration-matched position in Treasury securities. Then, we divide that amount of spread widening by each sector’s historical spread volatility. The end result is the number of standard deviations of 12-month spread widening required for each sector to lose 100 bps or more versus a position in Treasuries. Lower risk sectors plot further to the right of the Map, and higher risk sectors plot further to the left. Chart 11Excess Return Bond Map (As Of March 31st, 2021)
It’s A Boom!
It’s A Boom!
Footnotes 1 For a look at alternatives to investment grade corporates please see US Bond Strategy Weekly Report, “Searching For Value In Spread Product”, dated January 26, 2021, available at usbs.bcaresearch.com 2 Please see US Bond Strategy Weekly Report, “That Uneasy Feeling”, dated March 30, 2021, available at usbs.bcaresearch.com 3 Please see US Bond Strategy Weekly Report, “Searching For Value In Spread Product”, dated January 26, 2021, available at usbs.bcaresearch.com 4 Please see US Bond Strategy Weekly Report, “The Fed Looks Backward While Markets Look Forward”, dated March 23, 2021, available at usbs.bcaresearch.com Ryan Swift US Bond Strategist rswift@bcaresearch.com Fixed Income Sector Performance
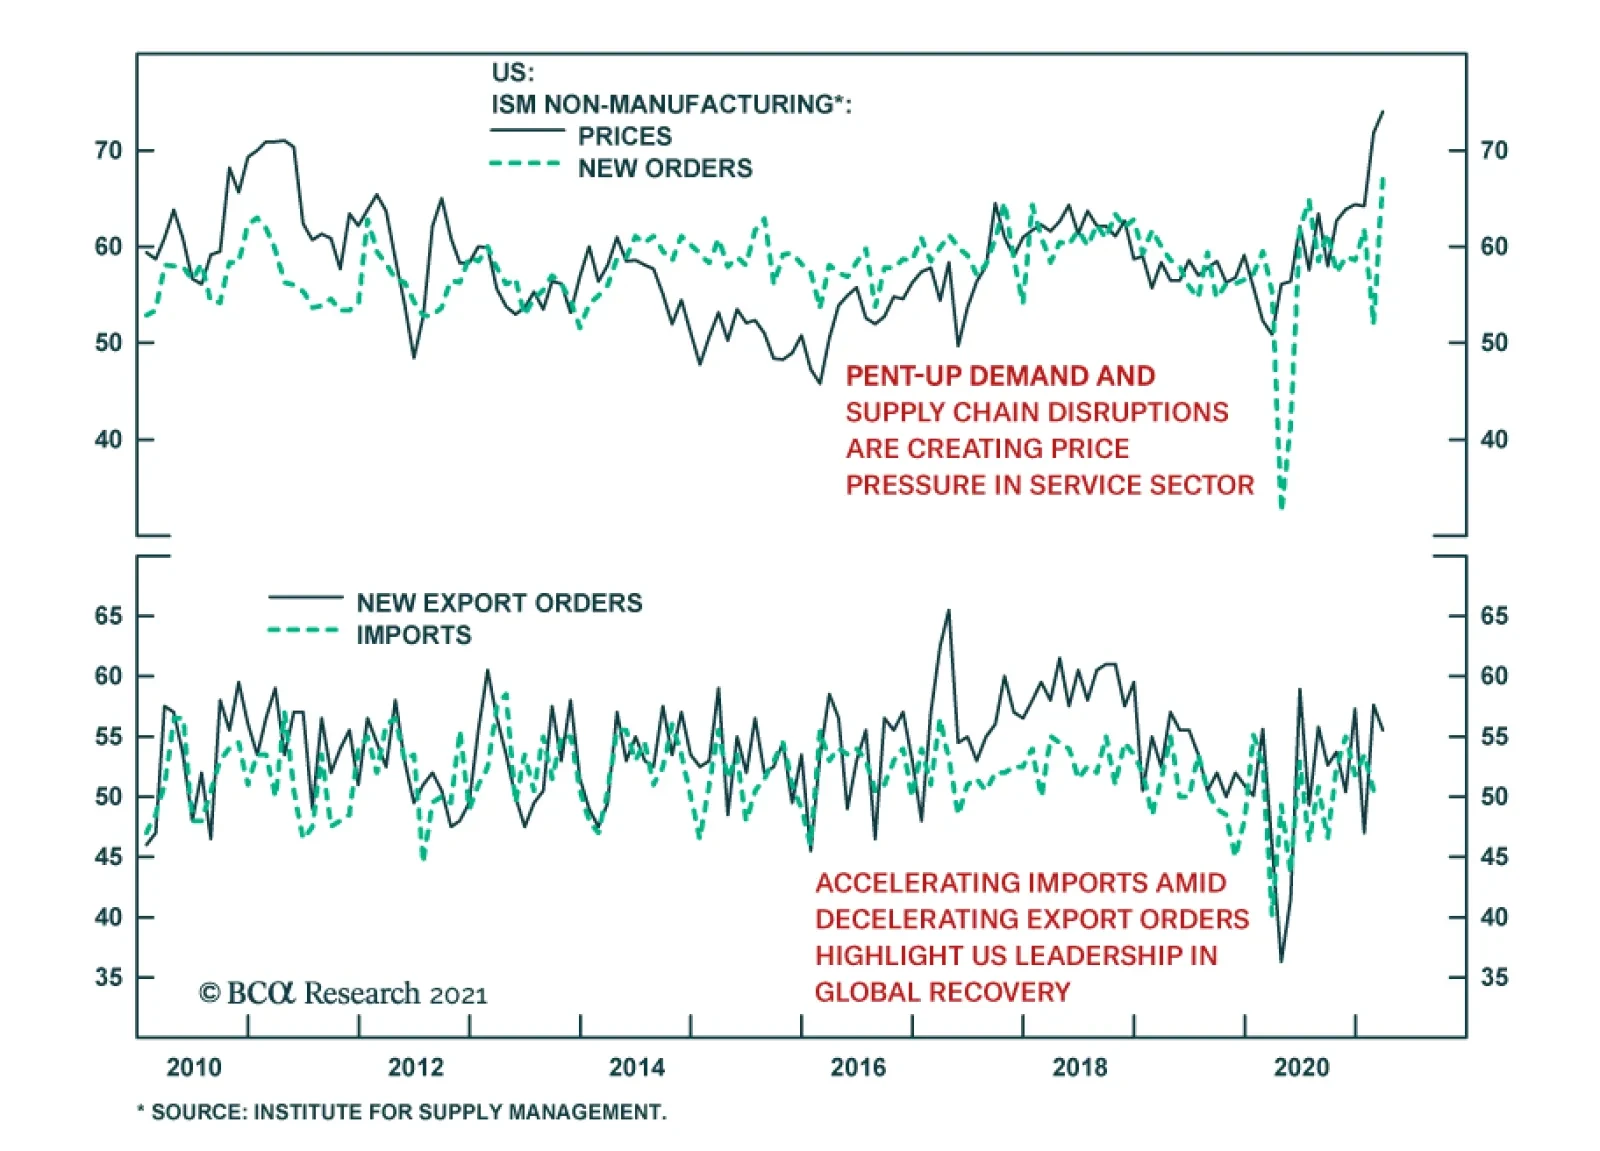
The ISM Services PMI surged to an all-time high of 63.7 from 55.3, a 4.7-point beat to expectations. The improvement was broad-based, with all 18 service industries reporting growth. The report shows price pressures building in the service sector.…
The March employment report showed the US economic recovery gathering pace. Total nonfarm payroll employment jumped by 916 thousand from a revised 468 thousand in February, significantly above the 660 thousand expected. This brought down the unemployment rate…
Highlights The Eurozone economy and assets remain beholden to the global manufacturing cycle. This sensitivity reflects the large share of output generated by capex and exports. Yet, the second half of 2021 and first half of 2022 could see euro area growth follow the beat of its own drum. This is a consequence of the unique role of consumption in the COVID-19 recession. European growth will therefore outperform expectations, even if economic momentum slows outside of Europe. Consequently, the euro and Eurozone equities will outperform for the coming 12 to 18 months. Feature For the past 20 years, investors have used a simple rule of thumb to understand European growth and markets. Europe is a derivative of global growth because of its large manufacturing sector and torpid domestic economy. A reductionist approach would even argue that China’s economy is what matters most for Europe. Is this model still valid to analyze Europe? In general, this approach still holds up well. However, the nature of the 2020 COVID-19 recession suggests that the European economy could still accelerate in the second half of the year, despite a small slowdown in the Chinese economy and global manufacturing sector. The Origin Of The Pro-Cyclicality Narrative Investors in European markets have long understood that Eurozone equities outperform when the global manufacturing cycle accelerates. This pro-cyclicality of European stocks is a consequence of their heavy weighting toward cyclical and value stocks, such as industrials, consumer discretionary and financials. Chart 1German/US Spreads: Global Manufacturing Cycle
German/US Spreads: Global Manufacturing Cycle
German/US Spreads: Global Manufacturing Cycle
Historically, European yields have also moved in a very pro-cyclical fashion. Over the past 30 years, periods when German 10-year yields rose relative to that of US Treasury Notes have coincided with an improvement in the global manufacturing sector as approximated by the ISM Manufacturing survey (Chart 1). Investors also understand that the euro is a pro-cyclical currency. Some of this behavior reflects the counter-cyclicality of the US dollar. However, if German yields rise more than US ones when global growth improves and European equities outperform under similar conditions, the euro naturally attracts inflows when the global manufacturing sector strengthens. Chart 2China Is A Key Determinant Of European Activity
China Is A Key Determinant Of European Activity
China Is A Key Determinant Of European Activity
Ultimately, the responsiveness of the euro and European assets to global growth is rooted in the nature of the European economy. Trade and manufacturing account for nearly 40% and 14% of GDP, respectively, compared to 26% and 11% for the US. This economic specialization has made Europe extremely sensitive to the gyrations of the Chinese economy, the largest contributor to fluctuation in the global demand for capital goods. As Chart 2 highlights, European IP and PMI outperform the US when China’s marginal propensity to consume (as approximated by the growth in M1 relative to M2) picks up. Is The Pro-Cyclical Narrative Still Valid? Despite the euro area debt crisis and the slow health and fiscal policy response of European authorities to COVID-19, evidence suggests that the Eurozone’s pro-cyclicality is only increasing. Chart 3Europe Is Becoming More Sensitive To The Rest Of The World Europe Is Becoming More Sensitive To The Rest Of The World
Europe Is Becoming More Sensitive To The Rest Of The World Europe Is Becoming More Sensitive To The Rest Of The World
Europe Is Becoming More Sensitive To The Rest Of The World Europe Is Becoming More Sensitive To The Rest Of The World
A simple statistical analysis confirms this hypothesis. A look at the beta of European GDP growth against the Global PMI reveals that the sensitivity of Eurozone growth and German growth to the Global PMI has steadily increased over the past 20 years (Chart 3, top panel). Moreover, the beta of euro area growth to the global PMI is now higher than that of the US, despite a considerably lower potential GDP growth, which means that a greater proportion of the Eurozone’s GDP growth is affected by globally-driven fluctuations. The bottom panel of Chart 3 shows a more volatile but similar relationship with Chinese economic activity. Correlation analysis confirms that Europe remains very sensitive to global factors. Currently, the rolling correlation of a regression of Eurozone GDP growth versus that of China stands near 0.7, which is comparable to levels that prevailed between 2005 and 2012. The correlation between German and Chinese GDP growth is now higher than at any point during the past two decades. Chart 4The Declining Role Of Consumption
The Declining Role Of Consumption
The Declining Role Of Consumption
The increasing influence of global economic variables on the European economy reflects the evolution of the composition of the Eurozone’s GDP. Over the past 11 years, the share of consumption within GDP has decreased from 57% to 52%. For comparison’s sake, consumption accounts for 71% of US GDP. The two sectors that have taken the primacy away from consumption are capex and net exports, whose combined share has grown from 22% to 26% of GDP (Chart 4). This shift in the composition of GDP echoes the structural forces facing the Eurozone. An ageing population, a banking system focused on rebuilding its balance sheet, and the tackling of the competitiveness problems of peripheral economies have hurt wage growth, consumption and imports. Meanwhile, exports have remained on a stable trend, thanks to both the comparative vigor of the euro area’s trading partners and a cheap euro. Therefore, net exports expanded. Capex benefited from the strength in European exports. A Granger causality test reveals that consumption has little impact on fixed-capital formation in the euro area. However, the same method shows that fluctuations in export growth cause changes in investment. This makes sense. The variance in exports is an important contributor to the variability of Eurozone profits (Chart 5). Thus, rising exports incentivize the European corporate sector to expand its capital stock to fulfill foreign demand. The expanding share of output created by exports and capex along with the role of exports as a driver of capex explains why Europe economic activity is bound to remain so sensitive to the fluctuations in global trade and manufacturing activity. Moreover, the capex/exports interplay even affects consumption. As Chart 6 shows, the growth of euro area personal expenditures often bottoms after the annual rate of change of the new orders of capital goods has troughed, which reflects the role of exports as a driver of European income. Chart 5Profits And Exports
Profits And Exports
Profits And Exports
Chart 6Consumption Doesn't Move In A Vacuum
Consumption Doesn't Move In A Vacuum
Consumption Doesn't Move In A Vacuum
Bottom Line: European economic activity remains a high beta play on global and Chinese growth. The decrease in consumption to the benefit of exports and capex explains why this reality will not change anytime soon. 2021, An Idiosyncratic Year? In 2021, consumption will be the key input to the European economic performance, despite the long-term relationship between European GDP and foreign economic activity. This will allow European growth to narrow some of its gap with the US and the rest of the world in the second half of this year and the first half of 2022, even if the global manufacturing sector comes off its boil soon. The 2020 recession was unique. In a normal recession, capex, real estate investment, spending on durable goods and the manufacturing sector are the main contributors to the decline in GDP. This time, consumption and the service sector generated most of the contraction in output. These two sectors also caused the second dip in GDP following the tightening of lockdown measures across Europe last winter. Once the more recent wave of lockdowns is behind us, consumption will most likely slingshot to higher levels. More than the US, where the economy has been partially open for months now, Europe remains replete with significant pent-up demand. Obviously, fulfilling this demand will require further progress in the European vaccination campaign, something we recently discussed. Chart 7The Money Supply Forecasts A Rapid Recovery
The Money Supply Forecasts A Rapid Recovery
The Money Supply Forecasts A Rapid Recovery
The surge in M1 also points to a sharp rebound in consumption once governments lift the current lockdowns (Chart 7). M1 is a much more reliable predictor of economic activity in Europe than in the US, because disintermediation is not as prevalent in the Eurozone, where banks account for 72% and 88% of corporate and household credit, respectively, compared to 32% and 29% in the US. We cannot dismiss the explosion in the money supply as only a function of the ECB’s actions. European banks are in much better shape today than they were 10 years ago. Non-performing loans have been steadily decreasing. A rise in delinquencies is likely in the coming quarters due to the pandemic; however, the EUR3 trillion in credit guarantees by governments will limit the damages to the private sector’s and banking system’s balance sheets. Moreover, the Tier-1 capital ratio of the banking system ranges between 14% for Spain and 17% for Germany, well above the 10.5% threshold set by Basel-III (Chart 8). In this context, the pick-up in money supply mirrored credit flows. Thus, even if some of that credit reflects precautionary demand, the likelihood is high that a significant proportion of the built-up cash balances will find its way into the economy. Another positive sign for consumption comes from European confidence surveys. Despite tighter lockdown measures, consumer confidence has sharply rebounded, which historically heralds stronger consumption. Moreover, according to the ECB’s loan survey, stronger consumer confidence is causing an improvement in credit demand, which foreshadows a decline in savings intentions, especially now that wage growth is stabilizing (Chart 9). Nonetheless, there is still a risk that the advance in wages peters off. The recent wage agreement reached by Germany’s IG Metall union in North Rhine Westphalia was a paltry 1.3% annual pay raise, and once the Kurzarbeit programs end, the true level of labor market slack will become evident. However, for consumption to grow, all that we need to see now is stable wage growth, even if at a low rate. Chart 8European Banks Are Feeling Better
European Banks Are Feeling Better
European Banks Are Feeling Better
Chart 9Confidence Points To Stronger Consumption
Confidence Points To Stronger Consumption
Confidence Points To Stronger Consumption
Beyond consumption, Europe’s fiscal policy will be positive compared to the US next year. The NGEU plan will add roughly 1% to GDP in both 2021 and 2022. As a result, the Eurozone’s net fiscal drag should be no greater than 1% of GDP next year. This compares to a fiscal thrust of -7% in the US in 2022, even after factoring in the new “American Jobs Act” proposed by the Biden Administration last week, according to our US Political Strategy team. Bottom Line: The revival in European consumption in the second half of 2021 and the first half of 2022 will allow the gap between European and global growth to narrow. This dynamic will be reinforced next year, when the fiscal drag will be lower in Europe than in the US. These forces will create a rare occasion when European growth will improve despite a deceleration (albeit a modest one) in global manufacturing activity. Investment Conclusions The continued sensitivity of the euro area economy to the global industrial and trade cycle indicates that over the long-term, European assets will remain beholden to the gyrations of global growth. In other words, the euro and European stocks will outperform in periods of accelerating global manufacturing activity, as they have done over the past 30 years. The next 12 to 18 month may nonetheless defy this bigger picture, allowing European assets to generate alpha for global investors. Chart 10The Euro Will Like Idiosyncratic European Growth
The Euro Will Like Idiosyncratic European Growth
The Euro Will Like Idiosyncratic European Growth
First, the gap between US and euro area growth will narrow over the coming 12 to 18 months, thus the euro will remain well bid, even if the maximum acceleration in global industrial activity lies behind. As investors re-assess their view of European economic activity and the current period of maximum relative pessimism passes, inflows into the euro area will accelerate and the euro will appreciate (Chart 10). Hence, we continue to see the recent phase of weakness in EUR/USD as transitory. Second, European equities have scope to outperform US ones over that window. Some of that anticipated outperformance reflects our positive stance on the euro. However, a consumption-driven economic bounce will be positive for European financials as well. Such a recovery will let investors ratchet down their estimates of credit losses in the financial system. Moreover, banks are well capitalized, thus the ECB will permit the resumption of dividend payments. Under these circumstances, European banks have scope to outperform US ones temporarily, especially since Eurozone banks trade at a 56% discount to their transatlantic rivals on a price-to-book basis. An outperformance of financials will be key for Europe’s performance. Chart 11German/US Spreads Near Equilibrium?
German/US Spreads Near Equilibrium?
German/US Spreads Near Equilibrium?
Finally, we could enter a period of stability in US/German yield spreads over the coming months. The ECB remains steadfast at limiting the upside in European risk-free rates, as Christine Lagarde reiterated last week. However, BCA’s US bond strategist, Ryan Swift, believes US yields will enter a temporary plateau, as the Federal Reserve will not adjust rates until well after the US economy has reached full employment. Hence, the Fed is unlikely to let the OIS curve bring forward the date of the first hike currently priced in for August 2022 on a durable basis, which also limits the upside to US yields. Thus, looking at core CPI and policy rate differences, US yields have reached a temporary equilibrium relative to Germany (Chart 11). Mathieu Savary, Chief European Investment Strategist Mathieu@bcaresearch.com
Highlights Fiscal stimulus props up output when it’s injected into an economy, but is a consumption hangover just around the corner?: Fiscal drag is a very real phenomenon but we don’t think US investors have to worry about a consumption drag any time soon, given that consumption has yet to see a bounce. Is the housing market’s boom vulnerable to reversing?: Powered by an outward shift in the demand curve for single-family homes in the suburbs and beyond and helped along by a chronic supply deficit, it appears that the housing boom has at least another year or two to run. Is the Archegos implosion a sign of broader weaknesses?: Based on what we know now, we do not believe that one levered investor’s reported demise is a symptom of systemic problems in financial markets or the banking system. Feature BCA’s monthly editorial view meeting, held last week, underlined the unusual level of uncertainty confronting investors. Against a backdrop of enormous domestic fiscal stimulus and global monetary accommodation, an entire generation of market participants is ruminating about inflation for the very first time. The course of the pandemic remains a significant unknown; while the US has seemingly lined up all the vaccine doses it will need and has begun to hit its vaccination stride, infections are rising and Europe and Canada are still mired in shutdowns. It has been easy to tally up the excess pandemic savings as they’ve accumulated into what we expect will be a $2 trillion mass, but we can only guess how much of the hoard will be spent and when. It is unclear what elements of the infrastructure spending vision laid out by President Biden last week will make it through a Congress deeply riven by partisan conflict and fissures within the Democratic caucus and the fate of its associated tax hike proposals is therefore uncertain. Against this backdrop of unknowns, we highlight the questions that have come up the most in our recent discussions with clients. We continue to have a constructive view on risk assets and the economy but the situation is fluid and we will take our cue from the evidence as it emerges. A Stimulus Hangover? Q: I get that fiscal stimulus will produce a big GDP pop this year, but what happens after it’s gone? Is the US heading for a consumption/income hangover in 2022? It’s true that the US cannot keep pumping out transfer payments to households at its 2020 and 2021 rate. It’s also true, however, that fewer and fewer households are in need of them. Employee compensation surpassed its February 2020 pre-pandemic peak in both January and February (Chart 1) and it should continue to rise as more and more people go back to work. Conversely, unemployment assistance should naturally dwindle as vaccinations allow the private sector to take the baton from the federal government. Chart 1Aggregate Compensation Is Making New Highs
Aggregate Compensation Is Making New Highs
Aggregate Compensation Is Making New Highs
Chart 2The Big Surge Has Yet To Come
The Big Surge Has Yet To Come
The Big Surge Has Yet To Come
The end of the economic impact payments ($1,400 to adults earning $75,000 or less in the current round, following $1,200 and $600 rounds last spring and this January) will represent something of a fiscal cliff for vulnerable households. They have a high marginal propensity to consume and presumably have been depending on the transfers, as evidenced by the revised 7.6% month-over-month spike in January retail sales upon the distribution of the $600 round and its subsequent 3% decline in February (Chart 2). As people return to work, however, the number of vulnerable households should shrink. We nonetheless do not fear a near-term consumption hangover for the simple reason that there was no consumption sugar rush in 2020. Consumption growth has badly lagged increases in household net worth as the multitude of households who didn’t really need the economic impact payments used them to pad their savings, pay down debt or buy stocks. Once the $1,400 checks are fully disbursed, we estimate that excess household savings will top $2 trillion. Much of those excess pandemic savings have accumulated because households were unable to spend on things like restaurant meals, travel, movies, concerts and sporting events. We are confident that they will spend again once they recover their full menu of options, but much of the forgone services spending will simply be lost. Some of the unintended pandemic savings will remain savings and the consumption tailwind driven by pent-up demand will eventually dissipate. When that happens, consumption may indeed hit a bit of a wall and economic growth will likely decelerate. The key for our twelve-month market outlook is that the unfettered release of pent-up demand cannot begin until households recover their full range of consumption options. They won’t do so until the economy fully reopens, which means the inevitable slowdown clock has not yet begun to tick. One can’t be hungover without first getting drunk and the longer it takes for the consumption surge to arrive, the longer the slowdown will be delayed. In our most likely scenario, the hangover won’t arrive until 2023, beyond the time horizon of most institutional investors. How Vulnerable Is The Housing Market? Q: The US housing market has experienced a remarkable recovery. Is the real estate boom sustainable or is it vulnerable to a sudden reversal? We believe the real estate boom can be sustained over the next year and beyond. It is supported by strong demand, affordable financing and tight supplies. Against a backdrop of extended supply shortfalls, there is scope for prices to continue to rise even as new construction activity accelerates (Chart 3). Residential investment accounts for a modest amount of economic activity but housing is nonetheless likely to remain in a sweet spot in which rising prices boost household wealth at the margin and increasing activity boosts employment and income. Chart 3Falling Supply, Rising Prices
Falling Supply, Rising Prices
Falling Supply, Rising Prices
Chart 4A Seller's Market
A Seller's Market
A Seller's Market
The pandemic has acted to stoke demand for suburban single-family homes and it appears as if at least some of the migration from urban centers to suburban and exurban/rural communities will outlast the pandemic. Several businesses have already moved to lower their real estate expenses by shrinking their office footprints in high-cost central business districts (CBD). Working from home will be an option for many professionals going forward and a lot of them may choose to trade high-cost-per-square-foot city apartments for much cheaper space in the suburbs and beyond now that they are no longer tethered to their CBD offices five days a week. In addition to the work-from-home catalyst, the flow from cities may be persistent if urban living becomes less attractive in a post-pandemic world that features fewer bars and restaurants and lingering wariness about close interactions with crowds. The supply of houses is historically low when adjusted for the total number of US households (Chart 4) and the tight conditions are only partly related to the pandemic. The first pandemic feature is an unwillingness to have (potentially infected) prospective buyers trooping through one’s house to examine it. The second is an aversion among older people to sell their homes and move to the senior-living facilities that incubated infections in the pandemic’s initial waves. Both of these factors are temporary and should ease quickly once widespread immunization stifles COVID’s spread. The longer-run supply factor is restrictive zoning laws that make it difficult to construct new homes. This is an intractable issue in many if not most of the more desirable locations across the country and it will not be solved quickly or easily (Chart 5). Demand was poised to exceed supply in many of the nation’s housing markets even before work from home unshackled skilled professionals from their offices. That dynamic should help keep prices firm while supporting residential investment and construction employment. Chart 5New Home Construction Has Lagged Since The GFC
New Home Construction Has Lagged Since The GFC
New Home Construction Has Lagged Since The GFC
Chart 6Homes Are Still Affordable
Homes Are Still Affordable
Homes Are Still Affordable
Finally, houses remain quite affordable (Chart 6, top panel). Despite a backup of 40-50 basis points from the 2.8% bottom, the rates on 30-year fixed-rate mortgages are still extremely low relative to history (Chart 6, third panel). Buying is an appealing alternative to renting despite the rise in home prices over the last year (Chart 6, bottom panel). The rate of price appreciation is likely to slow once the pandemic supply impediments fade, but US home construction has not kept pace with long-run household formation growth and we expect the housing market will remain robust for at least the next year or two. Have Termites Gotten Into The Beams? Q: Retail investors nearly brought down a hedge fund with a large short position in GameStop (GME). Now a family office that looked a lot like a hedge fund has blown up after its prime brokers allowed it to amplify long equity exposures with ridiculous amounts of leverage. We all know there’s never just one cockroach. Do you think there’s a deeper rot in this market after 12 years of gains disconnected from the fundamentals? The details of the reported fire sales of margin collateral that may have wiped out the multi-billion-dollar Archegos portfolio have not been made public. No one but the parties involved have definitive knowledge of what occurred but it’s always worth thinking about what could go wrong, especially twelve years into a bull market. We can state with full confidence, however, that the S&P 500’s extended run has not been disconnected from the fundamentals. Chart 7Earnings Growth Has Outpaced Multiple Expansion
Earnings Growth Has Outpaced Multiple Expansion
Earnings Growth Has Outpaced Multiple Expansion
Treating the pandemic sell-off as a vicious correction instead of a full-fledged bear market that ushered in a brand-new bull market, the current bull market began in March 2009 and has lasted for twelve years and one month (Chart 7, top panel). When it began, four-quarter forward consensus earnings estimates for the S&P 500 were $65. As of March 26th, forward four-quarter earnings were $180. Over the duration of the bull market, S&P 500 earnings estimates have nearly tripled, growing at an 8.75% annualized rate (Chart 7, middle panel). The index’s forward multiple has nearly doubled, from 11.25 to 21.5, rising at a 5.5% annualized rate (Chart 7, bottom panel). Earnings growth has accounted for the majority (about 61%) of the index’s 14.75% annualized gain. Through last January, ahead of the pandemic, when the forward multiple was 18.3, earnings growth accounted for two-thirds of the gain. The pandemic leg has been a re-rating phenomenon, but it slanders the overall advance to say that it has been disconnected from fundamentals. Earnings growth has been solid for an extended period of time and is poised to accelerate to 9.2% by the end of the year if today’s consensus expectations for calendar 2022 hold up. As for the issues raised by the news reports of Archegos’ demise, it is well understood that long bull markets breed excesses. It may be disheartening that a sizable pool of institutional capital found a way to use bespoke derivative instruments to game the system and evade regulatory attention but it’s certainly not surprising. When money, elections, university admissions, Olympic laurels, the World Series or the Tour de France are at stake, many people will do nearly anything to get an edge. Post-GFC measures like Basel III and the Volcker rule have made the regulated banking system more stable, but markets will never be completely shock-proof as long as humans are involved with them. We enjoy reading exposés as much as anyone else but we try to keep in mind that not every item the media sink their teeth into is evidence of systemic rot. There is a lot that is still not known about the Archegos saga beyond the apparent outlines of a highly leveraged investor who got into trouble when its underlying positions went the wrong way. It is striking to see broker-dealers challenging the three major ETF sponsors for ownership primacy in individual equities, as they do in DISCA, GSX, IQ, TME and VIAC – all stocks in which Archegos reportedly amassed large synthetic exposures. Credit Suisse and Nomura, which were singed the worst by Archegos exposures, have sizable holdings in several other companies, as do other broker-dealers. The presence of those other holdings might lead one to conclude that Archegos was not the only investor to discover that total-return swaps/contracts for difference offered a way to ramp up exposures. One might also conclude that the broker-dealers, finding households and non-financial businesses had little appetite for loans, were only too happy to provide leverage to investors via their prime brokerage arms. The two conclusions do not mean that a collapse is imminent, however. We continue to recommend that investors maintain risk-friendly portfolio positioning, albeit with added vigilance and a bias to shorten holding periods given the uncertain and potentially volatile backdrop. Doug Peta, CFA Chief US Investment Strategist dougp@bcaresearch.com
Dear client, In addition to this abbreviated weekly report, we are also sending you an in-depth report on the euro, written by my colleague Mathieu Savary. Mathieu argues that the euro could continue to face some downside in the near-term, creating perfect conditions for a buying opportunity below 1.15. We agree with Mathieu’s assessment and are shorting EUR/JPY this week as a tactical trade. Finally, last week, we held a webcast during which I discussed the key themes that will shape the dollar landscape in the coming months. In case you missed it, you can listen to the replay here. Kind regards, Chester Highlights Being long the dollar is now a consensus trade. A new US infrastructure bill will be positive for US growth. However, the new package also increases the probability that inflation will be higher in the US, which will depress relative real rates. Go short EUR/JPY as a tactical trade. Feature Chart I-1Dollar Sentiment Has Been Reset
Dollar Sentiment Has Been Reset
Dollar Sentiment Has Been Reset
The DXY index is fast approaching our 94-95 target and it is an open question whether the rally will stall at these levels, or punch through for new highs this year. Historically, the dollar has tended to move in long cycles, with the latest bull and bear markets lasting about a decade or so. If, as we believe, a dollar bear market did indeed commence in 2020, then the historical evidence is that any bounce will be capped around 4-6%. This was the experience of the 2000s. The defining landscape during the latter stages of the dollar bull market in 2018 and 2019 was deteriorating global growth, with financial conditions which remained relatively too tight. The situation today is extremely easy financial conditions and improving global growth. As such, our bias remains that the landscape is more characteristic of a dollar bear market. Speculators are now long the dollar and our capitulation index is approaching overbought levels (Chart I-1). So while there is scope for the dollar to continue to rise in the near term, the big gains are behind us. US Infrastructure Spending And Bond Yields President Joe Biden’s American Jobs Plan did little to lift US long bond yields. This suggests that most of the improvement to aggregate demand may have already been priced in. The big driver of the US dollar this year has been the improvement in yields, particularly at the long end of the curve. Short yields have remained anchored near zero (Chart I-2). If this improvement in long rates is torpedoed by lack of bi-partisan support for a larger fiscal package, then this will provide less scope for the US dollar to rise. Economically, a large infrastructure package makes sense. The neutral rate of interest in the US is well above the Fed funds target rate. A widening gap suggests underlying financing conditions (short rates) are low relative to the potential growth rate of the economy (long rates). Not surprisingly, this also tends to track the yield curve pretty closely (Chart I-3). This incentivizes banks to lend, and fund these projects. Chart I-2The Move In Rates Has Been On The Long End
The Move In Rates Has Been On The Long End
The Move In Rates Has Been On The Long End
Chart I-3A Steeping Curve Usually Encourages Lending
A Steeping Curve Usually Encourages Lending
A Steeping Curve Usually Encourages Lending
The feedback loop with the dollar could however be negative. First, while the boost to aggregate demand supports US growth in the short term, there will be spillovers to other countries. The net beneficiaries might also be the countries that have the raw materials needed to realize this infrastructure plan. The proposal has a largely “buy American” tilt, but this will also create sharp domestic shortages as the US is not a manufacturing-based economy. An increase in imports will widen the US trade deficit. Second, the returns on infrastructure investments tend to be large in lower-productivity countries. Meanwhile, the increase in US taxes to fund these deficits will lower the return on capital for US assets. This might limit foreign inflows into US capital markets. Third, the US output gap is slated to close faster than in other economies, meaning the increase in aggregate demand will soon become inflationary. This could further depress real rates in the US. There is a longstanding correlation between US relative real rates and the dollar (Chart I-4). Chart I-4The Dollar Moves With Relative Real Rates
The Dollar Moves With Relative Real Rates
The Dollar Moves With Relative Real Rates
Chart I-5The Dollar Is Overvalued
The Dollar Is Overvalued
The Dollar Is Overvalued
Finally, it is important to remember that the starting point for the US dollar is as an expensive currency. According to our PPP models, the dollar is overvalued by over 10% (Chart I-5). This is already manifesting itself in a deteriorating trade balance. It also suggests that should the dollar continue to rise significantly, it will negatively impact US growth. Trading Strategy Amidst Market Uncertainty The near term outlook for the dollar remains bullish. Vaccinations are progressing at the fastest pace in the US and in the UK while the euro area, Canada and Japan are seeing a third wave of infections underway (Chart I-6). New lockdown measures have been implemented in these latter countries, which will further dent their Q2 outlook. While our bias is that these economies eventually benefit as their vaccination program progresses, the dollar remains in a sweet spot for now. Chart I-6AA Third Wave Is Underway
A Third Wave Is Underway
A Third Wave Is Underway
Chart I-6BA Third Wave Is Underway
A Third Wave Is Underway
A Third Wave Is Underway
Chart I-6CA Third Wave Is Underway
A Third Wave Is Underway
A Third Wave Is Underway
One hedge to this scenario is to go short the EUR/JPY cross. First, our Chief European Investment Strategist Mathieu Savary argues that the euro could undershoot to 1.12 in the near term. This suggests that EUR/JPY which faces critical resistance a nudge above 130, will stage a countertrend reversal (Chart I-7). Both EUR/USD and EUR/JPY tend to be positively correlated. Second, European bourses are underperforming those in Japan in common-currency terms. The relative performance of the equity markets have usually moved in lockstep with the currency, but a divergence has opened up (Chart I-8). In fact, given very similar sector compositions across both bourses, this divergence might be down to competitiveness, given the rally in EUR/JPY. Should profits in Europe suffer relative to those in Japan, this will cap EUR/JPY gains (Chart I-9) Chart I-7EUR/JPY Faces Strong Resistance At 130
EUR/JPY Faces Strong Resistance At 130
EUR/JPY Faces Strong Resistance At 130
Chart I-8EUR/JPY Moves With Relative Share Prices
EUR/JPY Moves With Relative Share Prices
EUR/JPY Moves With Relative Share Prices
Chart I-9EUR/JPY And Relative Profits
EUR/JPY And Relative Profits
EUR/JPY And Relative Profits
Finally, monetary policy is more accommodative in Europe than in Japan. Interest rates are lower, and the ECB’s balance sheet is rising more aggressively. This has historically been accompanied by a lower EUR/JPY exchange rate (Chart I-10). Chart I-10EUR/JPY And Relative Monetary Policy
EUR/JPY And Relative Monetary Policy
EUR/JPY And Relative Monetary Policy
We eventually expect EUR/JPY to break higher, but for now, we are opening a short position in this cross as a portfolio hedge. In line with this view, we are tightening stops on all of our trades this week. The dollar could be set for violent moves in the coming weeks. Stay tuned. Chester Ntonifor Foreign Exchange Strategist chestern@bcaresearch.com Trades & Forecasts Forecast Summary Core Portfolio Tactical Trades Limit Orders Closed Trades
Highlights Global manufacturing activity will soon peak due to growing costs and China’s policy tightening. This process will allow the dollar’s rebound to continue. EUR/USD’s correction will run further. This pullback in the euro is creating an attractive buying opportunity for investors with a 12- to 24-month investment horizon. Eurozone banks will continue to trade in unison with the euro. Feature The correction in the euro has further to run. The dollar currently benefits from widening real interest differentials, but a growing list of headwinds will cause a temporary setback for the global manufacturing sector, which will fuel the greenback rally further. Nonetheless, EUR/USD will stabilize between 1.15 and 1.12, after which it will begin a new major up-leg. Consequently, investors with a 12- to 24-month investment horizon should use the current softness to allocate more funds to the common currency. A Hiccup In Global Industrial Activity Global manufacturing activity is set to decelerate on a sequential basis and the Global Manufacturing PMI will soon peak. The first problem for the global manufacturing sector is the emergence of financial headwinds. The sharp rebound in growth in the second half of 2020 and the optimism created by last year’s vaccine breakthrough as well as the rising tide of US fiscal stimulus have pushed US bond yields and oil prices up sharply. These financial market moves are creating a “growth tax” that will bite soon. Mounting US interest rates have lifted global borrowing costs while the doubling in Brent prices has increased the costs of production and created a small squeeze on oil consumers. Thus, even if the dollar remains well below its March 2020 peak, our Growth Tax Indicator (which incorporates yields, oil prices and the US dollar) warns of an imminent top in the US ISM Manufacturing and the Global Manufacturing PMI (Chart 1). Already, the BCA Global Leading Economic Indicator diffusion index has dipped below the 50% line, which usually ushers in downshifts in global growth. A deceleration in China’s economy constitutes another problem for the global manufacturing cycle. Last year’s reflation-fueled rebound in Chinese economic activity was an important catalyst to the global trade and manufacturing recovery. However, according to BCA Research’s Emerging Market Strategy service, Beijing is now tightening policy, concerned by a build-up in debt and excesses in the real estate sector. Already, the PBoC’s liquidity withdrawals are resulting in a decline of commercial bank excess reserves, which foreshadows a slowing of China’s credit impulse (Chart 2). Chart 1The Global Growth Tax Will Bite
The Global Growth Tax Will Bite
The Global Growth Tax Will Bite
Chart 2Chinese Credit Will Slow
Chinese Credit Will Slow
Chinese Credit Will Slow
In addition to liquidity withdrawals, Chinese policymakers are also tightening the regulatory environment to tackle excessive debt buildups and real estate speculation. The crackdown on property developers and house purchases will cause construction activity to shrink in the second half of 2021. Meanwhile, tougher rules for both non-bank lenders and the asset management divisions of banks will further harm credit creation. BCA’s Chief EM strategist, Arthur Budaghyan, notes that consumer credit is already slowing. Chinese fiscal policy is unlikely to create a counterweight to the deteriorating credit impulse. China’s fiscal impulse will be slightly negative next year. Chinese financial markets are factoring in these headwinds, and on-shore small cap equities are trying to break down while Chinese equities are significantly underperforming global benchmarks. Chart 3Deteriorating Surprises
Deteriorating Surprises
Deteriorating Surprises
Bottom Line: The combined assault from the rising “growth tax” and China’s policy tightening is leaving its mark. Economic surprises in the US, the Eurozone, EM and China have all decelerated markedly (Chart 3), which the currency market echoes. Some of the most pro-cyclical currencies in the G-10 are suffering, with the SEK falling relative to the EUR and the NZD and AUD both experiencing varying degrees of weakness. The Euro Correction Will Run Further… Until now, the euro’s decline mostly reflects the rise in US interest rate differentials; however, the coming hiccup in the global manufacturing cycle is causing a second down leg for the euro. First, the global economic environment remains consistent with more near-term dollar upside, due to: Chart 4Commodities Are Vulnerable
Commodities Are Vulnerable
Commodities Are Vulnerable
A commodity correction that will feed the dollar’s rebound. Aggregate speculator positioning and our Composite Technical Indicator show that commodity prices are technically overextended (Chart 4). With this backdrop, the coming deceleration in Chinese economic activity is likely to catalyze a significant pullback in natural resources, which will hurt rates of returns outside the US and therefore, flatter the dollar. The dollar’s counter-cyclicality. The expected pullback in the Global Manufacturing PMI is consistent with a stronger greenback (Chart 5). The dollar’s momentum behavior. Among G-10 FX, the dollar responds most strongly to the momentum factor (Chart 6). Thus, the likelihood is high that the dollar’s recent rebound will persist, especially because our FX team’s Dollar Capitulation Index has only recovered to neutral from oversold levels and normally peaks in overbought territory. Chart 5The Greenback's Counter-Cyclicality
The Greenback's Counter-Cyclicality
The Greenback's Counter-Cyclicality
Chart 6The Dollar Is A High Momentum Currency
The Euro Dance: One Step Back, Two Steps Forward
The Euro Dance: One Step Back, Two Steps Forward
Second, the euro’s specific dynamics remain negative for now. Based on our short-term valuation model, the fair value of EUR/USD has downshifted back to 1.1, which leaves the euro 7% overvalued (Chart 7). Until now, real interest rate differentials and the steepening of the US yield curve relative to Germany’s have driven the decline in the fair value estimate. However, the deceleration in global growth also hurts the euro’s fair value because the US is less exposed than the Eurozone to the global manufacturing cycle. Chart 7The Euro's Short-Term Fair Value Is At 1.1
The Euro's Short-Term Fair Value Is At 1.1
The Euro's Short-Term Fair Value Is At 1.1
Chart 8Speculators Have Not Capitulated
Speculators Have Not Capitulated
Speculators Have Not Capitulated
The euro is also technically vulnerable, similar to commodities. Speculators are still massively net long EUR/USD and the large pool of long bets in the euro suggests that a capitulation has yet to take place (Chart 8). The euro responds very negatively to a weak Chinese economy. The Eurozone has deeper economic ties with China than the US. Exports to China account for 1.7% of the euro area’s GDP, and 2.8% of Germany’s compared to US exports to China at 0.5% of GDP. Indirect financial links are also larger. Credit to EM accounts for 45% of the Eurozone’s GDP compared to 5% for the US. Thus, the negative impact of a Chinese slowdown on EM growth has greater spillovers on European than on US ones rates of returns. A weak CNY and sagging Chinese capital markets harm the euro. The euro’s rebound from 1.064 on March 23 2020 to 1.178 did not reflect sudden inflows into European fixed-income markets. Instead, the money that previously sought higher interest rates in the US left that country for EM bonds and China’s on-shore fixed-income markets, the last major economies with attractive yields. These outflows from the US to China and EM pushed the dollar down, which arithmetically helped the euro. Thus, the recent EUR/USD correlates closely with Sino/US interest rate and with the yuan because the euro’s strength reflects the dollar demise (Chart 9). Consequently, a decelerating Chinese economy will also hurt EUR/USD via fixed-income market linkages. Finally, the euro will depreciate further if global cyclical stocks correct relative to defensive equities. Deep cyclicals (financials, consumer discretionary, energy, materials and industrials) represent 59% of the Eurozone MSCI benchmark versus 36% of the US index. Cyclical equities are exceptionally overbought and expensive relative to defensive names. They are also very levered to the global business cycle and Chinese imports. In this context, the expected deterioration in both China’s economic activity and the Global Manufacturing PMI could cause a temporary but meaningful pullback in the cyclicals-to-defensives ratio and precipitate equity outflows from Europe into the US (Chart 10). Chart 9EUR/USD And Chinese Rates
EUR/USD And Chinese Rates
EUR/USD And Chinese Rates
Chart 10EUR/USD Will Follow Cyclicals/Defensives
EUR/USD Will Follow Cyclicals/Defensives
EUR/USD Will Follow Cyclicals/Defensives
Bottom Line: A peak in the global manufacturing PMI will hurt the euro, especially because China will meaningfully contribute to this deceleration in global industrial activity. Thus, the euro’s pullback has further to run. An important resistance stands at 1.15. A failure to hold will invite a rapid decline to EUR/USD 1.12. Nonetheless, the euro’s depreciation constitutes nothing more than a temporary pullback. … But The Long-Term Bull Market Is Intact We recommend buying EUR/USD on its current dip because the underpinnings of its cyclical bull market are intact. Chart 11Investors Structurally Underweight Europe
Investors Structurally Underweight Europe
Investors Structurally Underweight Europe
First, investors are positioned for a long-term economic underperformance of the euro area relative to the US. The depressed level of portfolio inflows into Europe relative to the US indicates that investors already underweight European assets (Chart 11). This pre-existing positioning limits the negative impact on the euro of the current decrease in European growth expectations (Chart 11, bottom panel). Second, as we wrote last week, European growth is set to accelerate significantly this summer. Considering the absence of ebullient investor expectations toward the euro, this process can easily create upside economic surprises later this year, especially when compared to the US. Moreover, the deceleration in Chinese and global growth will most likely be temporary, which will limit the duration of their negative impact on Europe. Third, the US stimulus measure will create negative distortions for the US dollar. The addition of another long-term stimulus package of $2 trillion to $4 trillion to the $7 trillion already spent by Washington during the crisis implies that the US government deficit will not narrow as quickly as US private savings will decline. Therefore, the US current account deficit will widen from its current level of 3.5% of GDP. As a corollary, the US twin deficit will remain large. Meanwhile, the Fed is unlikely to increase real interest rates meaningfully in the coming two years because it believes any surge in inflation this year will be temporary. Furthermore, the FOMC aims to achieve inclusive growth (i.e. an overheated labor market). This policy combination forcefully points toward greater dollar weakness. The US policy mix looks particularly dollar bearish when compared to that of the Eurozone. To begin with, the balance of payment dynamics make the euro more resilient. The euro area benefits from the underpinning of a current account surplus of 1.9% of GDP. Moreover, the European basic balance of payments stands at 1.5% of GDP compared to a 3.6% deficit for the US. Additionally, FDI into Europe are rising relative to the US. The divergence in the FDI trends will continue due to the high probability that the Biden administration will soon increase corporate taxes. Chart 12The DEM In The 70s
The DEM In The 70s
The DEM In The 70s
The combination of faster vaccine penetration and much larger fiscal stimulus means that the US economy will overheat faster than Europe’s. Because the Fed seems willing to tolerate higher inflation readings, US CPI will rise relative to the Eurozone. In the 1970s, too-easy policy in Washington meant that the gap between US and German inflation rose. Despite the widening of interest rate and growth differentials in favor of the USD or the rise in German relative unemployment, the higher US inflation dominated currency fluctuations and the deutschemark appreciated (Chart 12). A similar scenario is afoot in the coming years, especially in light of the euro bullish relative balance of payments. Fourth, valuations constitute an additional buttress behind the long-term performance of the euro. Our FX strategy team Purchasing Power Parity model adjusts for the different composition of price indices in the US and the euro area. Based on this metric, the euro is trading at a significant 13% discount from its long-term fair value, with the latter being on an upward trend (Chart 13). Furthermore, BCA’s Behavioral Exchange Rate Model for the trade-weighted euro is also pointing up, which historically augurs well for the common currency. Lastly, even if the ECB’s broad trade-weighted index stands near an all-time high, European financial conditions remain very easy. This bifurcation suggests that the euro is not yet a major hurdle for the continent and can enjoy more upside (Chart 14). Chart 13EUR/USD Trades Well Below Long-Term Fair Value
EUR/USD Trades Well Below Long-Term Fair Value
EUR/USD Trades Well Below Long-Term Fair Value
Chart 14Easy European Financial ##br##Conditions
Easy European Financial Conditions
Easy European Financial Conditions
Chart 15Make Room For the Euro!
Make Room For the Euro!
Make Room For the Euro!
Finally, the euro will remain a beneficiary from reserve diversification away from the USD. The dollar’s status as the premier reserve currency is unchallenged. However, its share of global reserves has scope to decline while the euro’s proportion could move back to the levels enjoyed by legacy European currencies in the early 1990s (Chart 15). Large reserve holders will continue to move away from the dollar. BCA Research’s Geopolitical Strategy team argues that US tensions with China transcend the Trump presidency. Meanwhile, the current administration’s relationship with Russia and Saudi Arabia will be cold. For now, their main alternative to the dollar is the euro because of its liquidity. Moreover, the NGEU stimulus program creates an embryonic mechanism to share fiscal risk within the euro area. The Eurozone is therefore finally trying to evolve away from a monetary union bereft of a fiscal union. This process points toward a lower probability of a break up, which makes the euro more attractive to reserve managers. Bottom Line: Despite potent near-term headwinds, the euro’s long-term outlook remains bright. Global investors already underweight European assets, yet balance of payment and policy dynamics point toward a higher euro. Moreover, valuations and geopolitical developments reinforce the cyclical tailwinds behind EUR/USD. Thus, investors with a 12- to 24-month investment horizon should use the current euro correction to gain exposure to the European currencies. Any move in EUR/USD below 1.15 will generate a strong buy signal. Sector Focus: European Banks And The Istanbul Shake The recent decline in euro area bank stocks coincides with the 14% increase in USD/TRY and the 17% decline in the TUR Turkish equities ETF following the sacking of Naci Ağbal, the CBRT governor. President Erdogan is prioritizing growth over economic stability because his AKP party is polling poorly ahead of the 2023 election. The Turkish economy is already overheating, and the lack of independence of the CBRT under the leadership of Şahap Kavcıoğlu promises a substantial increase in Turkish inflation, which already stands at 16%. Hence, foreign investors will flee this market, creating further downward pressures on the lira and Turkish assets. European banks have a meaningful exposure to Turkey. Turkish assets account for 3% of Spanish bank assets or 28% of Tier-1 capital. For France, this exposure amounts to 0.7% and 5% respectively, and for the UK, it reaches 0.3% and 2%. As a comparison, claims on Turkey only represent 0.3% and 0.5% of the assets and Tier-1 capital of US banks. Unsurprisingly, fluctuations in the Turkish lira have had a significant impact one the share prices of European banks in recent years, even after controlling for EPS and domestic yield fluctuations (Table 1). Table 1TRY Is Important To European Banks…
The Euro Dance: One Step Back, Two Steps Forward
The Euro Dance: One Step Back, Two Steps Forward
Nonetheless, today’s TRY fluctuations are unlikely to have the same lasting impact on European banks share prices as they did from 2017 to 2019 because European banks have already shed significant amounts of Turkish assets (Chart 16). This does not mean that European banks are out of the woods yet. The level of European yields remains a key determinant of the profitability of Eurozone’s banks, and thus, of their share prices (Chart 17, top panel). Moreover, the euro still tightly correlates with European bank stocks as well (Chart 17, bottom panel). As a result, our view that the global manufacturing cycle will experience a temporary downshift and the consequent downside in EUR/USD both warn of further underperformance of European banks. Chart 16… But Less Than It ##br##Once Was
The Euro Dance: One Step Back, Two Steps Forward
The Euro Dance: One Step Back, Two Steps Forward
Chart 17Higher Yields And A stronger Euro, These Are Few Of My Favorite Things
Higher Yields And A stronger Euro, These Are Few Of My Favorite Things
Higher Yields And A stronger Euro, These Are Few Of My Favorite Things
These same views also suggest that this decline in bank prices is creating a buying opportunity. Ultimately, we remain cyclically bullish on the euro and the transitory nature of the manufacturing slowdown implies that global yields will resume their ascent. The cheap valuations of European banks, which trade at 0.6-times book value, make them option-like vehicles to bet on these trends, even if the banking sectors long-term prospects are murky. Moreover, they are a play on Europe’s domestic recovery this summer. We will explore banks in greater detail in future reports. Mathieu Savary, Chief European Investment Strategist Mathieu@bcaresearch.com
Highlights The Biden administration is combining Trumpian nationalism with a renewed push for US innovation in a major infrastructure bill that is highly likely to become law. Populism and Great Power struggle with China and Russia are structural forces that give enormous momentum to this effort. Don’t bet against it. President Biden’s $2.4 trillion infrastructure and green energy plan has a subjective 80% chance of passing into law by the end of the year, as infrastructure is popular and Democrats control Congress. The net deficit increase will range from $700 billion to $1.3 trillion depending on the size of corporate tax hikes in the final bill. The second part of Biden’s plan, the roughly $2 trillion American Families Plan, has a much lower chance of passage – at best 50/50 – as the 2022 midterm elections will loom and fiscal fatigue will set in. While the US infrastructure package is a positive cyclical catalyst, it was largely expected, and the Biden administration still faces early stress-tests on China/Taiwan, Russia, Iran, and even North Korea. Game theory helps explain why financial markets cannot ignore the 60% chance of a crisis in the Taiwan Strait. A full-fledged war is still low-probability but Taiwan remains the world’s preeminent geopolitical risk. In emerging markets, stay short Russian and Brazilian currency and assets – and continue favoring Indian stocks over Chinese. Feature The “arsenal of democracy” is a phrase that President Franklin Delano Roosevelt used to describe the full might of US government, industry, and labor in assisting the western allies in World War II. The US is reviving this combination of productive forces today, with President Joe Biden’s $4 trillion-plus American Jobs and Families Plan unveiled in Pittsburgh on March 31. The context is once again a global struggle among the Great Powers, albeit not world war (at least not yet … more on that below). The US is reviving its post-WWII pursuit of global liberal hegemony – symbolized by its role, growing once again, as the world’s chief consumer and chief warrior (Chart 1). Biden promoted his plan to build up the US’s infrastructure and social safety net explicitly as a historic and strategic investment – “in 50 years, people are going to look back and say this was the moment that American won the future.”1 It is critical for investors to realize that they are not witnessing another round of COVID-19 fiscal relief. That task is already completed with the Republican spending of 2020 and Biden’s own $1.9 trillion American Rescue Plan Act (ARPA), which together with the vaccine rollout are delivering a jolt to growth (Chart 2). Chart 1America Pursues Hegemony Anew
America Pursues Hegemony Anew
America Pursues Hegemony Anew
Chart 2Consensus Expects 6.5% US GDP Growth After American Rescue Plan
Consensus Expects 6.5% US GDP Growth After American Rescue Plan
Consensus Expects 6.5% US GDP Growth After American Rescue Plan
Our own back-of-the-envelope estimates of growth suggest that there is considerable upside risk even under current law (Chart 3). The output gap is also guesstimated here, and it will tighten faster than expected, especially as the service sector revives on economic reopening. Chart 3Back-Of-Envelope: US GDP And Output Gap Show Upside Risk After American Rescue Plan Act (ARPA)
The Arsenal Of Democracy
The Arsenal Of Democracy
A growth overshoot is even more likely considering that the first part of Biden’s proposal, the $2.4 trillion American Jobs Plan consisting mostly of infrastructure and green energy, is highly likely to pass Congress (by July at earliest and December at latest, most likely late fall). Our revised estimates for the US budget deficit show that this bill will add considerably to the deficit in the coming years, peaking in three or four years, thus averting the “fiscal cliff” in 2022-23 and adding to aggregate demand in the years after the short-term COVID-era cash handouts dry up (Chart 4). The net deficit increase will be $700 billion if Biden gets all of his tax hikes and $1.3 trillion if he only gets half of them, according to our sister US Political Strategy. Chart 4US Budget Deficit Will Remain Fat In Coming Years
The Arsenal Of Democracy
The Arsenal Of Democracy
We give Biden’s $2.4 trillion American Jobs Plan an 80% chance of passing through Congress by the end of the year. Infrastructure is broadly popular – as President Trump’s own $2 trillion infrastructure campaign proposal revealed – and Democrats have just enough votes to push it through the Senate via budget reconciliation, which requires zero votes from Republicans. Biden’s political capital is still strong given that his approval rating will stay above 50% as long as Trump is the obvious alternative and the Republicans are deeply divided over their own future (Chart 5).2 The second part of his plan, the $1.95 trillion American Families Plan, is much less likely to pass before the 2022 midterm elections – we would say 50/50 odds at best, if the infrastructure deal passes quickly. Chart 5Biden’s Political Capital Is Sufficient To Pass Another Major Law
The Arsenal Of Democracy
The Arsenal Of Democracy
Of course there are very important differences between Biden’s $2.4 trillion infrastructure plan and the similarly sized proposal that Trump would have unveiled this month had he been re-elected: Biden’s proposal is probably heavier on innovation and research and development, and certainly heavier on unionization and labor regulation, than Trump’s would have been. Biden’s plan integrates infrastructure with sustainability, renewable energy, and climate change initiatives that will help the US catch up with Europe and China on the green front. The plan will consist of direct government spending – rather than government seed money to promote private investment. It will be partially offset by repealing the corporate tax cuts in Trump’s signature Tax Cuts and Jobs Act. Most importantly – from a geopolitical point of view – Biden is making a bid for the US to resume its post-WWII quest for global liberal hegemony. He argued that the US stands at the crossroads of a global choice between “democracies and autocracies” and that rebuilding US infrastructure is ultimately about proving that democracies can create consensus and “deliver for their people.” Autocratic regimes, fairly or not, routinely call attention to the divisiveness of modern party politics in the West and the resulting policy gridlock which produces bad outcomes for many citizens, resulting in greater domestic dysfunction and “chaos.” It is important to note that this bid for hegemony will be more, not less, destabilizing for global politics as it will make the US economy more self-sufficient and insulated from the world. It will intensify the US-China and US-Russia strategic competition while making it more difficult for Biden to conduct bilateral diplomacy with these states given their differences in moral values and frequent human rights violations. What is happening now is the culmination of political shifts that pre-date the pandemic, but were galvanized by the pandemic, and it is of global, geopolitical significance for the coming decade and beyond.3 Biden and the establishment Democrats – embattled by populism on their right and left flanks – are shamelessly coopting President Trump’s “Make America Great Again” nationalism with a larger-than-life, infrastructure-and-manufacturing initiative that emphasizes productivity as well as “Buy American” protectionism. Biden explicitly argued that Americans need to boost innovation to “put us in a position to win the global competition with China in the upcoming years.” At Biden’s first press conference on March 25, he made a similar point about China: So I see stiff competition with China. China has an overall goal, and I don’t criticize them for the goal, but they have an overall goal to become the leading country in the world, the wealthiest country in the world, and the most powerful country in the world. That’s not going to happen on my watch because the United States are going to continue to grow and expand.4 The US trade deficit is set to widen a lot further under this massive domestic buildout. It aims to be the largest government investment program since Dwight Eisenhower’s building of the highways or the Kennedy-Johnson-Nixon space race. But it explicitly aims to diminish China’s role as a supplier of US goods and materials and the US trade deficit already shows evidence of economic divorce (Chart 6). The US is bound to have a larger trade deficit due to its own savings-and-investment imbalances but it has a powerful interest in redistributing this trade deficit to its allies and reducing over-dependency on China, which is itself pursuing strategic self-sufficiency and military modernization in anticipation of an ongoing rivalry this century. Chart 6Biden's Coopts Trump's Trade And Manufacturing Agenda
Biden's Coopts Trump's Trade And Manufacturing Agenda
Biden's Coopts Trump's Trade And Manufacturing Agenda
Bottom Line: Biden’s $2.4 trillion American Jobs Plan has an 80% chance of passing Congress later this year with a net increase to the fiscal thrust of between $700 billion and $1.3 trillion, depending on how many and how high the corporate tax hikes. The other $2 trillion social spending part of Biden’s plan has only a 50/50 chance of passage. The infrastructure and green energy rebuild should be understood as a return of Big Government motivated by populism and Great Power competition – it is a geopolitical theme with enormous momentum. The result will be faster US growth and higher inflation expectations, with the upside risk of a productivity boom (or boomlet) from the combination of public and private sector innovation. Investors should not bet against the cyclical bull market even though any increase in long-term potential GDP is speculative. A Fourth Taiwan Strait Crisis And The Cuban Missile Crisis Biden’s American Jobs Plan reserves $50 billion for US semiconductor manufacturing, a vast sum, larger than expectations and far larger than the relatively small public investments that helped revolutionize the US chip industry in the 1980s. But it will take a long time for these investments to pay off in the form of secure and redundant supply chains, while a semiconductor shortage is raging today that is already entangled with the US-China rivalry and tensions over the Taiwan Strait. The risk of a diplomatic or military incident is urgent because the chip shortage exacerbates China’s vulnerabilities at a time when the Biden administration is about to make critical decisions regarding the tightness of new export controls that cut off China’s access to US semiconductor chips, equipment, and parts. If the Biden administration appears to pursue a full-fledged tech blockade, as the Trump administration seemed bent on doing, then China will retaliate economically or militarily. Before going further we should point out that there are still areas of potential US-China cooperation under the Biden administration that could reduce tensions this year (though not over the long run). Biden and Xi Jinping might meet virtually as early as this month to discuss carbon emission reduction targets. Meanwhile China is positioning itself to serve as power-broker on two major foreign policy challenges – Iran and North Korea. Biden expressly seeks Chinese and Russian assistance based on the mutual interest in nuclear non-proliferation. Notably, Beijing’s renewed strategic dealings with Iran over the past month highlight its confidence that Biden does not have the appetite to stick with Trump’s “maximum pressure” but rather will seek to reduce sanctions and restore the 2015 nuclear deal. Hence China will seek to parlay influence over Tehran in exchange for reduced US pressure on its trade and economy (Chart 7). Beijing is making a similar offer on North Korea. Chart 7China Holds The Key To Iran, As With North Korea?
China Holds The Key To Iran, As With North Korea?
China Holds The Key To Iran, As With North Korea?
Ironically both Iranian and North Korean geopolitical tensions should skyrocket in the short term since high-stakes negotiations are beginning, even though they are ultimately more manageable risks than the mega-risk of US-China conflict over Taiwan. China cannot gain the advanced technology it needs to achieve a strategic breakthrough if the US should impose a total tech blockade, e.g. draconian export controls enforced on US allies. Yet it is highly unlikely to gain the tech by seizing Taiwan, since war would likely destroy the computer chip fabrication plants and provoke global sanctions that would crush its economy. The result is that China is launching a massive campaign of domestic production and indigenous innovation while circumventing US restrictions through cyber and other means. Still, a dangerous strategic asymmetry is looming because the US will retain access to the most advanced computer chips via its alliances and on-shoring, whereas China will remain vulnerable to a tech blockade via Taiwan. This brings us to our chief global geopolitical risk: a US-China showdown in the Taiwan Strait. Highlighting the urgency of the risk, Admiral John Aquilino, the nominee for Commander of the US Indo-Pacific Command, told the Senate Armed Services Committee that China might not wait six years to attack Taiwan: “My opinion is that this problem is much closer to us than most think and we have to take this on.”5 To illustrate the calculus of such a showdown – and our reasons for maintaining an alarmist tone and building up market hedges and safe-haven investments – we turn to game theory. Game theory is not a substitute for empirical analysis but a tool to formalize complex international systems with multiple decision-makers. An obvious yet fair analogy to a US-China-Taiwan crisis is the Cuban missile crisis of 1962.6 The standard construction of the Cuban missile crisis in game theory goes as follows: if the US maintains a blockade and the Soviets withdraw their missiles a compromise is achieved and war is averted; if the US conducts air strikes and the Soviets maintain or use their missiles then war ensues. The payouts to each player are shown in the matrix in Diagram 1. Diagram 1Cuban Missile Crisis, 1962
The Arsenal Of Democracy
The Arsenal Of Democracy
One concern about this construction is that the payouts may underestimate the costs of war since nuclear arms could be used. We insert a comment into the diagram highlighting that the payouts could be altered to account for nuclear war. Note that this alteration does not change the final outcome: the equilibrium scenario is still US blockade and Soviet withdrawal, which is what happened in reality. If we model a US-China-Taiwan conflict along similar lines, the US takes the role of the Soviet Union while China stands where the US stood in 1962 (Diagram 2). This is a theoretical scenario in which the US offers Taiwan a decisive improvement in its security or offensive military capabilities. However, because of the unique circumstances of the Chinese civil war, in which the victors established the People’s Republic of China in Beijing in 1949 and the defeated forces retreated to Taiwan, China’s regime legitimacy is at stake in any showdown over Taiwan. If Beijing suffered a defeat that secured Taiwan’s independence while degrading Beijing’s regime legitimacy and security, the Chinese regime might not survive the domestic blowback.7 Diagram 2Fourth Taiwan Strait Crisis – What Happens If The US Offers Game-Changing Military Support To Taiwan?
The Arsenal Of Democracy
The Arsenal Of Democracy
Thus we reduce the Chinese payout in the case of American victory. In the top right cell of Diagram 2, the row player’s payout falls from two points (2ppt) in the first diagram to one point (1ppt) in this diagram. This seemingly slight change entirely alters the outcome of the game. Beijing now faces equally bad outcomes in the event of defeat, whereas victory remains preferable to a tie. Therefore as long as China believes that the US will not resort to nuclear weapons to defend Taiwan (a reasonable assessment) then it may make the mistake of opting for military force to ensure victory. Fortunately for global investors the US is not providing Taiwan with game-changing military capabilities, although it is ultimately up to China to decide what threatens its security and the US is in the process of upgrading Taiwan’s defense in an effort to deter Beijing from forceful reunification. Thus the exercise demonstrates why we do not expect immediate war – no game-changer yet – but at the same time it shows why war is much likelier than the consensus holds if the military or political status quo changes in a way that China deems strategically unacceptable. A lower-degree Taiwan crisis should be expected – i.e. one in which the US maintains tech restrictions, offers arms sales or military training that do not upend the military balance, or signs free trade agreements or other significant upgrades to the US-Taiwan relationship.8 We would give a 60% probability to some kind of crisis over the next 12-24 months. The global equity market could at least suffer a 10% correction in a standard geopolitical crisis and it could easily fall 20% if US-China war appears more likely. What would trigger a full-fledged Taiwan war? We would grow even more alarmed if we saw one of three major developments: Chinese internal instability giving rise to a still more aggressive regime; the US providing Taiwan with offensive military capabilities; or Taiwan seeking formal political independence. The first is fairly likely, the second lends itself to miscalculation, and the third is unlikely. But it would only take one or two of these to increase the war risk dramatically. Bottom Line: The Taiwan Strait is still the critical geopolitical risk and Biden’s policy on China is still unclear. Iranian and North Korean tensions will escalate in the short run but the fundamental crisis lies in Taiwan. Since some kind of showdown is likely and war cannot be ruled out we advise clients to accumulate safe-haven assets like the Japanese yen and otherwise not to bet headlong against the US dollar until it loses momentum. Emerging Markets Round-Up In this section we will briefly update some important emerging market themes and views: Chart 8Favor USMCA Over Putin's Russia
Favor USMCA Over Putin's Russia
Favor USMCA Over Putin's Russia
Russia: US-Russia tensions are escalating in the face of Biden’s reassertion of the US bid for liberal hegemony, which poses a direct threat to Russia’s influence in eastern Europe and the former Soviet Union. Ukraine is expected to see a renewed conflict this spring. The top US and Russian military commanders spoke on the phone for the second time this year after Ukrainian military reports indicated that Russia is amassing forces on the border. We also assign a 50/50 chance that the US will use sanctions to prevent the completion of the NordStream II pipeline from Russia to Germany, an event that would shake up the German election as well as provoke a Russian backlash. The Russian ruble has suffered a long slide since Putin’s invasion of Georgia in 2008 and Crimea in 2014 and the country’s currency and equities have not staged much of a comeback amid the global cyclical upswing and commodity price rally post-COVID. We recommend investors favor the Canadian dollar and Mexican peso as oil plays in the context of American stimulus and persistent Russian geopolitical risk (Chart 8). We also favor developed market European stocks over emerging Europe, which will suffer from renewed US-Russia tensions. Brazil: Brazilian President Jair Bolsonaro’s domestic political troubles are metastasizing as expected – the rally-around-the-flag effect in the face of COVID-19 has faded and his popular approval rating now looks dangerously like President Trump’s did, relative to previous presidents, which is an ominous warning for the “Trump of the South,” who faces an election in October 2022 (Chart 9). The COVID-19 deaths are skyrocketing, with intensive care units reaching critical levels across the country. The president has reshuffling his cabinet, including all three heads of the military in an unprecedented disruption that compounds fears about his willingness to politicize the military.9 Meanwhile the judicial system looks likely (but not certain) to clear former President Luiz Inácio Lula da Silva to run against Bolsonaro for the presidency, a potent threat (Chart 10). Bolsonaro’s three pillars of political viability have cracked under the pandemic: the country remains disorderly, the systemic corruption and the “Car Wash” scandal under the former ruling party are no longer at the center of public focus, and fiscal stimulus has replaced structural reform. Chart 9Brazil: Will ‘Trump Of The South’ Face Trump’s Fate?
The Arsenal Of Democracy
The Arsenal Of Democracy
Our Brazilian GeoRisk Indicator has reached a peak with Bolsonaro’s crisis – and likely breaking of the fiscal spending growth cap put in place at the height of the political crisis in 2016 – while Brazilian equities relative to emerging markets have hit a triple bottom (Chart 11). It is too soon for investors to buy into Brazil given that the political upheaval can get worse before it gets better and a Lula administration is no cure for Brazil’s public debt crisis, though a short-term technical rally is at hand. Chart 10Brazil’s Lula Looks To Be A Contender In 2022?
The Arsenal Of Democracy
The Arsenal Of Democracy
Chart 11Brazil: Policy Risk Peaks, Equities Hit Triple-Bottom Versus EM
Brazil: Policy Risk Peaks, Equities Hit Triple-Bottom Versus EM
Brazil: Policy Risk Peaks, Equities Hit Triple-Bottom Versus EM
India: A lot has happened since we last updated our views on India, South Asia, and the broader Indian Ocean basin. Farmer protests broke out in India, forcing Prime Minister Narendra Modi to temporarily suspend his much-needed structural reforms to the agricultural sector, while China-backed military coup broke out in Myanmar, and the US election set up a return to negotiations with Iran and the Taliban in Afghanistan. Perhaps the biggest surprise was the Indo-Pakistani ceasefire, despite boiling tensions over India’s decision to make Jammu and Kashmir a federal union territory. The ceasefire is temporary but it does highlight a changing geopolitical dynamic in the region. India and Pakistan ceased fire along the Line of Control where they have fought many times. The ceasefire does not resolve core problems – Pakistan will not stop supporting militant proxies and India will not grant Kashmir autonomy – but it does show their continued ability to manage the intensity of disputes while dealing with the global pandemic. An earlier sign of coordination occurred after the exchange of air strikes in early 2019, which preceded the Indian election and suggested that India and Pakistan had the ability to control their military encounters. India’s move to revoke the autonomy of Jammu and Kashmir in August 2019, along with various militant operations, created the basis for another major conflict this year. After all, the Kargil war in 1999 followed nuclear weaponization, while the 2008 conflict followed the Mumbai attack. But instead India and Pakistan have agreed to a temporary truce. A major India-Pakistan conflict would be a “black swan” as nobody is expecting it at this point. Not coincidentally, India and China also reduced tensions after the flare-up in their Himalayan territorial disputes in 2020. China may be reducing tensions now that it no longer has to distract its population from Trump and the US election. China is shifting its focus to the Myanmar coup, another area where it hopes to parlay its influence with a Biden administration preoccupied with democracy and human rights. Sino-Indian tensions will resume later, especially as China continues its infrastructure construction at the farthest reaches of its territory for the sake of economic stimulus, internal control, and military logistics. The Biden administration is adopting the Trump administration’s efforts to draw India into a democratic alliance. But more urgently it is trying to withdraw from Afghanistan and cut a deal with Iran, which means it will need Indian and Pakistani cooperation and will want India to play a supportive role. Typically India eschews alliances and it will disapprove of Biden’s paternalism. For both China and Pakistan, making a temporary truce with India discourages it from synching up relations with the US immediately. Still, we expect India to cooperate more closely with the US over time, both on economic and security matters. This includes a beefed up “Quad” (Quadrilateral Security Dialogue) with Japan and Australia, which already have strong economic ties with India. Biden’s attempt to frame US foreign policy as a global restoration of democracy and liberalism will not go very far if he alienates the largest democracy in the world and in Asia. Nor will his attempt to diversify the US economy away from China or counter China’s regional assertiveness. Therefore Biden will have to take a supportive role on US-India ties. We are sticking with our contrarian long India / short China equity trade (Chart 12). India cannot achieve its geopolitical goals without reforming its economy and for that very reason it will redouble its structural reform drive, which is supported by changing voting patterns in favor of accelerating nationwide economic development. India will also receive a tailwind from the US and its allies as they seek to diversify production sources and reduce supply chain dependency on China, at least for health, defense, and tech. Meanwhile China’s government is pursing import substitution, deleveraging, and conflict with its neighbors and the United States. While Chinese equities are much cheaper than Indian equities on a P/E basis, they are not as pricey on a P/B and P/S basis (Chart 13) – and valuation trends can continue under the current macro and geopolitical backdrop. Indian equities are more volatile but from a long-term and geopolitical point of view, India’s moment has arrived. Chart 12Contrarian Trade: Stick To Long India / Short China
Contrarian Trade: Stick To Long India / Short China
Contrarian Trade: Stick To Long India / Short China
Bottom Line: Stay long Indian equities relative to Chinese and stay short Russian and Brazilian currencies and assets. These views are based on political and geopolitical themes that will remain relevant over the long run but are also seeing short-term confirmation. Chart 13Indian Stocks Not As Over-Priced On Price-To-Book, Price-To-Sales
Indian Stocks Not As Over-Priced On Price-To-Book, Price-To-Sales
Indian Stocks Not As Over-Priced On Price-To-Book, Price-To-Sales
Investment Takeaways To conclude we want to highlight two investment takeaways. First, while the market has rallied in expectation of the US stimulus package, Biden must now get the package passed. This roller coaster process, combined with the inevitable European recovery once the vaccine rollout gets on its feet (Chart 14), will power an additional rally in cyclicals, value stocks, and commodities. This is true as long as China does not tighten monetary and fiscal policy too abruptly, a risk we have highlighted in previous reports. Chart 14Europe's Vaccination Problem
Europe's Vaccination Problem
Europe's Vaccination Problem
While the US is pursuing “Buy American” provisions within its stimulus package, its growing trade deficit shows that it will be forced to import goods and services to meet its surging demand. This is beneficial for its nearest trade partners, Canada and Mexico, and Europe – as well as China substitutes further afield in some cases. Our European Investment Strategist Mathieu Savary has pointed out the opportunities lurking in Europe at a time when vaccine troubles and lockdowns are clouding the medium-term economic view, which is brightening. He recommends going long the “laggard” sectors and sub-sectors that have not benefited much relative to “leaders” that rallied sharply in the wake of last year’s stimulus, vaccine discovery, and defeat of President Trump (Chart 15). The laggard sectors are primed to outperform on rising US interest rates and decelerating Chinese economy as well (Chart 16). Therefore we recommend going long his basket of Euro Area laggards and short the leaders. Chart 15Europe’s Laggards And Leaders
The Arsenal Of Democracy
The Arsenal Of Democracy
Chart 16Macro Forces Favor The Laggards over the Leaders
Macro Forces Favor The Laggards over the Leaders
Macro Forces Favor The Laggards over the Leaders
Chart 17Will OPEC 2.0 Maintain Production Discipline To Keep Oil Supplies Tight?
Will OPEC 2.0 Maintain Production Discipline To Keep Oil Supplies Tight?
Will OPEC 2.0 Maintain Production Discipline To Keep Oil Supplies Tight?
Commodities – especially base metals – will continue to benefit from the global and European reopening as well as the US infrastructure buildout, assuming that China does not shoot its economy in the foot. Our Commodity & Energy Strategy highlights that global oil prices should remain in a $60-$80 per barrel range over the coming years on the back of tight supply/demand balances and ongoing OPEC 2.0 production management (Chart 17). We continue to see upside oil price risks in the first half of the year but downside risks in the second half. The US pursuit of a deal with Iran may trigger sparks initially – i.e. unplanned supply outages – but this will be followed by increased supply from Iran and/or OPEC 2.0 as a deal becomes evident. Matt Gertken Vice President Geopolitical Strategy mattg@bcaresearch.com Footnotes 1 White House, "Remarks by President Biden on the American Jobs Plan," Pittsburgh, Pennsylvania, March 31, 2021, whitehouse.gov. 2 A bipartisan bill is conceivably, barely, since Republicans face pressure to join with such a popular bill, but they cannot accept the corporate tax hikes, unionization, or green boondoggles that will inevitably occur. 3 The pandemic and President Trump’s hands-off attitude toward it helped galvanize this revival of Big Government, but the revival was already well on its way prior to the pandemic. 4 White House, "Remarks by President Biden in Press Conference," March 25, 2021, whitehouse.gov. 5 Again, "the most dangerous concern is that of a military force against Taiwan," though he implied that Beijing would wait until after the February 2022 Winter Olympics before taking action. He requested that the US urgently increase regional military defense. See Senate Armed Services Committee, "Nomination – Aquilino," March 23, 2021, armed-services.senate.gov. 6 At that time the Soviet Union stationed nuclear missiles in Cuba that threatened the US homeland directly and sent a convoy to make the missile installation permanent. The US imposed a blockade. A showdown ensued, at great risk of war, until the Soviets withdrew and the Americans made some compromises regarding missiles in Turkey. 7 Note that this was not the case for the US in 1962: Cuba did not have special significance for the legitimacy of the American republic and the American regime would have survived a defeat in the showdown, although its security would have been greatly compromised. 8 Taiwan is proposing to buy a missile segment enhancement for its Patriot Advanced Capability-3 missile defense system for delivery in 2025, though this is not yet confirmed by the Biden administration. See for example Yimou Lee, "Taiwan To Buy New U.S. Air Defence Missiles To Guard Against China," Reuters, March 31, 2021, reuters.com. 9 See Monica Gugliano, "I Will Intervene! The Day Bolsonaro Decided To Send Troops To The Supreme Court," Folha de São Paulo, August 2020, piaui.folha.uol.com.br.