United States
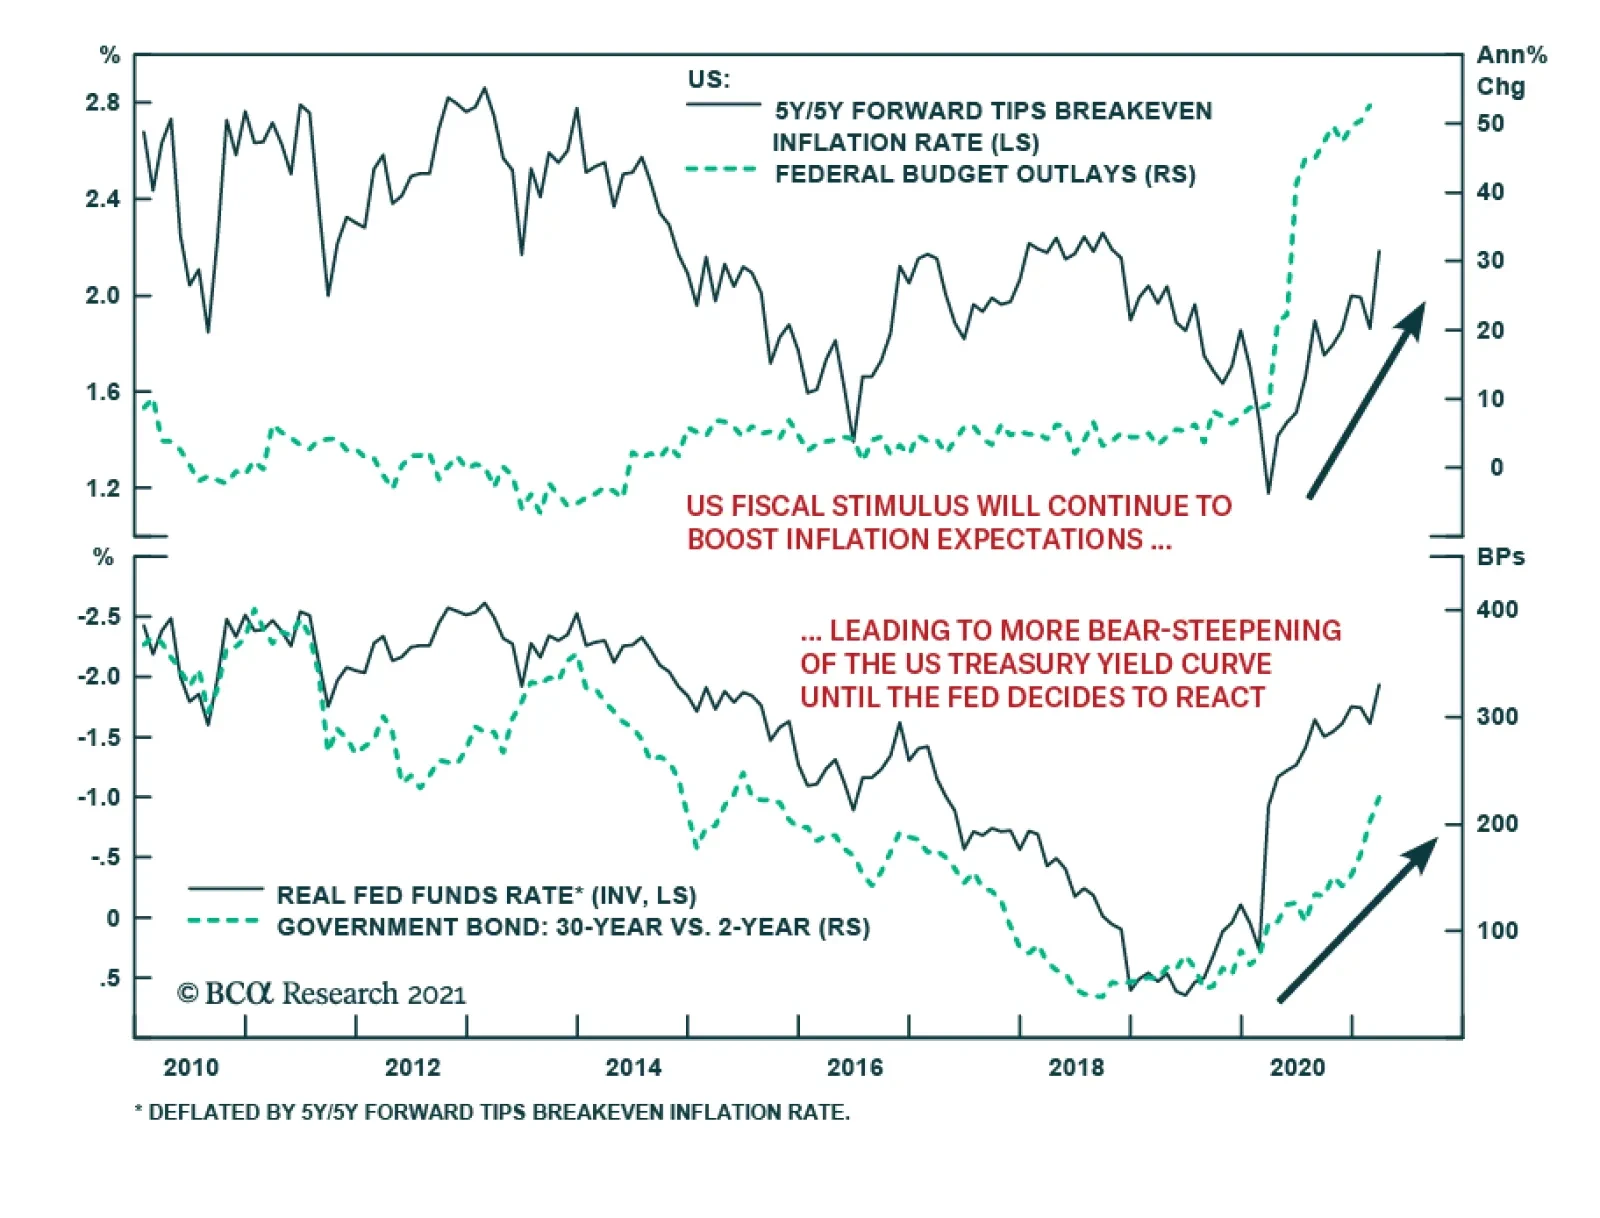
The US fiscal stimulus measures announced by the Biden Administration have been enormous, with the $1.9 trillion pandemic relief plan followed up by the $2.4 trillion of infrastructure proposals unveiled last week. The former alone is likely to boost 2021 US…
The ISM Manufacturing PMI accelerated to 64.7 in March from 60.8 in the prior month, resulting in a 3.2-point surprise to expectations and the highest reading since 1983. The report showed a broad-based improvement in the manufacturing sector, with nearly all…
According to BCA Research’s US Political Strategy service, investors should not bet against Democratic tax hikes or new spending. President Biden’s $2.4 trillion infrastructure proposal will take effect over eight years and will be offset by corporate tax…

Highlights The Biden Administration's $2.25 trillion infrastructure plan rolled out yesterday will, at the margin, boost global demand for energy and base metals more than expected later this year and next. Global GDP growth estimates – and the boost supplied by US stimulus – once again will have to be adjusted higher (Chart of the Week). Energy and metals fundamentals continue to tighten. OPEC 2.0's so-far-successful production management strategy will keep the level of supply just below demand, which will keep Brent crude oil on either side of $60/bbl. Base-metals output will struggle to meet higher demand from the ongoing buildout of renewables infrastructure and growing electric-vehicle sales. Of late, concerns that speculative positioning suggests prices will head lower – or, at other times, higher – are entirely misplaced: Spec positioning conveys no information on price levels or direction. Energy and metals prices, on the other hand, do convey useful information on spec positioning, demonstrating specs do not lead the news or prices, they follow them. Short-term headwinds caused by halting recoveries and renewed lockdowns – particularly in the EU – will fade in 2H21 as vaccines roll out, if the experience of the UK and US are any guide. Continued USD strength, however, would remain a headwind. Feature If the Biden administration is successful in getting its $2.25 trillion infrastructure-spending bill through Congress, the US will join the rest of the world in the race to re-build – in some cases, build anew – its long-neglected bridges, roads, schools, communications and high-speed transportation networks, and, critically, its electric-power grid. There's a lot of game left to play on this, but our Geopolitical Strategy group is giving this bill an 80% of passage later this year, after all the wrangling and log-rolling in Congress is done. In and of itself, the infrastructure-directed spending coming out of Biden's plan will be a catalyst for higher US industrial commodity demand – energy, metals and bulks. In addition, it will support the lift in the demand boost coming out of higher GDP growth globally, which will be pushed higher by US fiscal spending, as the Chart of the Week shows. Of note is the extremely robust growth expected in India, China and the US, which are among the largest consumers of industrial commodities globally. Overall growth in the G20 and globally will be expansive in 2022 as well. Chart of the WeekBiden's $2.25 Trillion Infrastructure Bill Will Boost Global Commodity Demand
Fundamentals Support Oil, Bulks, And Metals
Fundamentals Support Oil, Bulks, And Metals
Higher GDP growth translates directly into higher demand for commodities, all else equal, as can be seen in the relationship between EM and DM GDP, supply and inventories and Brent crude oil prices in Chart 2. While we have reduced our Brent forecast for this year to $60/bbl on the back of renewed demand-side weakness in the EU due to problems in acquiring and distributing COVID-19 vaccines, we expect this to be reversed next year and into 2025, with prices trading between $60-$80/bbl (Chart 3). OPEC 2.0, the oil-producer coalition led by the Kingdom of Saudi Arabia (KSA) and Russia, has done an excellent job of keeping the level of oil supply below demand over the course of the pandemic, which we expect to continue to the end of 2025.1 Chart 2Higher GDP Growth Presages Higher Commodity Demand
Higher GDP Growth Presages Higher Commodity Demand
Higher GDP Growth Presages Higher Commodity Demand
Chart 3Brent Crude Oil Prices Will Average - / bbl to 2025
Brent Crude Oil Prices Will Average $60 - $80 / bbl to 2025
Brent Crude Oil Prices Will Average $60 - $80 / bbl to 2025
As the Biden plan makes its way through Congress, markets will get a better idea of how much diesel fuel, copper, steel, iron ore, etc., will be required in the US alone. What is important to note here that the US is just moving to the starting line, whereas other economies like China and the EU already have begun their investment cycles in renewables and EVs. At present, key markets already are tight, particularly copper (Chart 4) and aluminum (Chart 5). In both markets, we expect physical deficits this year and next, which inclines us to believe the metals leg of this renewables buildout is just beginning – higher prices will be required to incentivize the development of new supply.2 Chart 4Copper Will Post Physical Deficit...
Copper Will Post Physical Deficit...
Copper Will Post Physical Deficit...
Chart 5...As Will Aluminum
...As Will Aluminum
...As Will Aluminum
This is particularly important in copper, where growth in mining output of ore has been flat for the past two years. Copper is the one metal that spans all renewables technologies, and is a bellwether commodity for global growth. We expect copper to trade to $4.50/lb (up ~ $0.50/lb vs spot) on the COMEX in 4Q21 on the back of increasing demand and tight supplies – i.e., falling mining supply and refined copper output growth (Chart 6). Worth noting also is steel rebar and hot-rolled coil prices traded at record highs this week on Chinese futures markets. Stronger steel markets continue to support iron ore prices, although the latter is trading off its recent highs and likely will move lower toward the end of the year as Brazilian supply returns to the market.3 We use steel prices as a leading indicator for copper prices – steel leads copper prices by ~ 9 months. This makes sense when one considers steel is consumed early in infrastructure and construction projects, while copper consumption occurs later as airports and houses are fitted with copper for electric, plumbing and communications applications. Chart 6Copper Ore Output Flat
Copper Ore Output Flat
Copper Ore Output Flat
Does Speculative Positioning Matter? Of late, media pundits and analysts have cited an unwinding of speculative positions in oil and metals markets following sharp run-ups in net long positions as a harbinger of weaker prices in the near future (Chart 7).4 At other times, speculation has been invoked as a reason for price surges – e.g., when oil rocketed toward $150/bbl in mid-2008, which was followed by a price collapse at the start of the Global Financial Crisis (GFC).5 Brunetti et al note, "The role of speculators in financial markets has been the source of considerable interest and controversy in recent years. Concern about speculative trading also finds support in theory where noise traders, speculative bubbles, and herding can drive prices away from fundamental values and destabilize markets." (p. 1545) Chart 7Speculative Positioning Lower In Brent Than WTI
Speculatives Positioning Lower in Brent Than WTI
Speculatives Positioning Lower in Brent Than WTI
We recently re-tested earlier findings in our research, which found that knowledge of how specs are positioned – either on the long or the short side of the market – conveys no information on the level of prices or the change that should be expected given that knowledge. However, knowledge of the price level does convey useful information on how speculators are positioned in futures markets.6 In cointegrating regressions of speculative positions in crude oil, natural gas and copper futures on price levels for these commodities, we find the level of prices to be a statistically significant determinant of spec positions. We find no such relationship using spec positions as an explanatory variable for prices.7 On the other hand, Chart 2 above is an example of statistically significant relationships for Brent and WTI price as a function of supply-demand fundamentals displaying coefficients of determination (r-squares) of close to 90% in the post-GFC period (2010 to now). This supports our earlier findings regarding spec behavior: They follow prices, they don't lead them.8 We are not dismissive of speculation. It plays a critical role in markets, by providing the liquidity that enables commodity producers and consumers to hedge their price exposures, and to investors seeking to diversify their portfolios with commodity exposures that are uncorrelated to their equity and bond holdings. Short-Term Headwinds Likely Dissipate COVID-19 remains the largest risk to markets generally, commodities in particular. The mishandling of vaccine rollouts in the EU has pushed back our assumption for demand recovery deeper into 2H21, but it has not derailed it. We expect COVID-related deaths and hospitalizations to fall in the EU as they have in the UK and the US following the widespread distribution of vaccines, which should occur in the near future as Brussels organizes its pandemic response (Chart 8). Making vaccines available for other states in dire straits will follow, which will allow the global re-opening to progress as lockdowns are lifted (Chart 9). Chart 8EU Vaccination Rollouts Will Boost Global Economic Recovery
Fundamentals Support Oil, Bulks, And Metals
Fundamentals Support Oil, Bulks, And Metals
Chart 9Global Re-Opening Has Slowed, But Will Resume In 2H21
Fundamentals Support Oil, Bulks, And Metals
Fundamentals Support Oil, Bulks, And Metals
The other big risk we see to commodities is persistent USD strength (Chart 10). The dollar has rallied for the better part of 2021, largely on the back of improving US economic prospects relative to other states, and success in its vaccination efforts. The resumption of the USD's bear market may have to wait until the rest of the world catches up with America's public-health response to the pandemic, and the global economy ex-US and -China enters a stronger expansionary mode. Bottom Line: We remain bullish industrial commodities expecting demand to improve as the EU rolls out vaccines and begins to make progress in arresting the pandemic and removing lockdowns. Global fiscal and monetary policy, which likely will be bolstered by a massive round of US infrastructure spending beginning in 4Q21 will catalyze demand growth for oil and base metals. This will prompt another round of GDP revisions to the upside. The dollar remains a headwind for now, but we expect it to return to a bear market in 2H21. Chart 10The USD's Evolution Remains Important
The USD's Evolution Remains Important
The USD's Evolution Remains Important
Robert P. Ryan Chief Commodity & Energy Strategist rryan@bcaresearch.com Ashwin Shyam Research Associate Commodity & Energy Strategy ashwin.shyam@bcaresearch.com Commodities Round-Up Energy: Bullish Going into the April 1 meeting of OPEC 2.0 today, we are not expecting any increase in production. OPEC earlier this week noted demand had softened, mostly due to the slow recovery from the COVID-19 pandemic in the EU, which, based on their previous policy decisions, suggests the producer coalition will not be increasing production. The coalition led by KSA and Russia will have to address Iran's return as a major exporter to China this year, which appears to have been importing ~ 1mm b/d of Iranian crude this month (Chart 11). This puts Iran in direct competition with KSA as a major exporter to China, in defiance of the US re-imposition of sanctions against Iranian exports. China and Iran over the weekend signed a 25-year trade pact that also could include military provisions, which could, over time, alter the balance of power in the Persian Gulf if Chinese military assets – naval and land warfare – deploy to Iran under their agreement. Details of the deal are sparse, as The Guardian noted in its recent coverage. Among other things, government officials in Tehran have come under withering criticism for entering the deal, which they contend was signed with a "politically bankrupt regime." The Guardian also noted US President Joe Biden " is prepared to make a new offer to Iran this week whereby he will lift some sanctions in return for Iran taking specific limited steps to come back into compliance with the nuclear agreement, including reducing the level to which it enriches uranium," in the wake of the signing of this deal. Base Metals: Bullish Copper fell this week, initially on an inventory build, and has now settled right under the $4/lb mark, as investors await details on the US infrastructure bill unveiled in Pittsburgh, PA, on Wednesday. According to mining.com, a major chunk of the proposed bill will be devoted to investments in infrastructure, which will be metals-intensive. Precious Metals: Bullish Gold fell further this week, as US treasury yields rose, buoyed by the increased US vaccine efforts and President Biden’s proposed spending plans (Chart 12). USD strength also worked against the yellow metal, which has been steadily declining since the beginning of this year. COMEX gold fell below the $1,700/oz mark for the third time this month and settled at $1,683.90/oz on Tuesday. Chart 11
Sporadic Producers Will Be Accomodated
Sporadic Producers Will Be Accomodated
Chart 12
Gold Trading Lower On The Back of A Strong Dollar
Gold Trading Lower On The Back of A Strong Dollar
Footnotes 1 Please see Five-Year Brent Forecast Update: Expect Price Range of $60 - $80/bbl, which we published 25 March 2021. It is available at ces.bcaresearch.com. 2 Please see Industrial Commodities Super-Cycle Or Bull Market?, which we published 4 March 2021 for additional discussion, particularly regarding the need for additional capex in energy and metals markets. 3 Please see UPDATE 1-Strong industrial activity, profit lift China steel futures, published by reuters.com 29 March 2021. 4 See, e.g., Column: Frothy oil market deflates as virus fears return published 23 March 2021. 5 Brunetti, Celso, Bahattin Büyüksahin, and Jeffrey H. Harris (2016), " Speculators, Prices, and Market Volatility," Journal of Financial and Quantitative Analysis, 51:5, pp. 1545-74, for further discussion. 6 Please see Specs Back Up The Truck For Oil, which we published 26 April 2018, and Feedback Loop: Spec Positioning & Oil Price Volatility published 10 May 2018. Both are available at ces.bcaresearch.com. 7 We group money managers (registered commodity trading advisors, commodity pool operators and unregistered funds) and swap dealers (banks and trading companies providing liquidity to hedgers and speculators) together to test these relationships. 8 In our earlier research, we also noted our results generally were supported in the academic literature. See, e.g., Fattouh, Bassam, Lutz Kilian and Lavan Mahadeva (2012), "The Role of Speculation in Oil Markets: What Have We Learned So Far?" published by The Oxford Institute For Energy Studies. Investment Views and Themes Strategic Recommendations Commodity Prices and Plays Reference Table Summary of Closed Trades
Higher Inflation On The Way
Higher Inflation On The Way
Highlights President Biden’s $2.4 trillion “American Jobs Plan” is a major US public investment that will dispel any endogenous deflationary tail risk from the US economy this cycle, increase inflation expectations yet boost productivity, and hike corporate taxes. The proposal has an 80% chance of passage before the end of the year given that infrastructure is popular and Democrats can pass the bill via reconciliation with zero Republican votes. The $2.4 trillion infrastructure proposal will take effect over eight years and will be offset by corporate tax hikes that will take effect over 15 years. The increase in the budget deficit will be around $400 billion if all tax hikes pass and $1.4 trillion if only half the tax hikes pass. The American Families Plan will follow with another roughly $700 billion to $1.3 trillion increase to the budget deficit, depending on how much individual/household taxes go up. But this bill only has a 50/50 chance of passing before the 2022 midterm elections. Investors should maintain a bullish cyclical (12-month) bias and keep favoring value stocks, industrials, and materials over tech and health care. We also recommend going long consumer discretionary stocks and energy large caps versus small caps. Feature President Joe Biden spoke in Pittsburgh on Wednesday to unveil his economic vision and policy proposals going forward. Biden proposed a $2.4 trillion “American Jobs Plan” infrastructure and green energy package to be implemented over eight years, which will be part of a $4 trillion-plus “Build Back Better” legislative agenda that will be partially offset by an estimated $3 trillion in tax hikes to take effect over 15 years. The result will be a pro-cyclical boost to fiscal thrust, GDP growth, and inflation expectations; some potential for a productivity boom; a possible expansion of the social safety net; and tax reform that reduces US corporate profits. Pennsylvania is a Rust Belt state, Biden’s home state, and a critical swing state in the 2016 and 2020 elections, so the location makes sense. Biden aims to solidify the economic recovery and restore the Democratic Party’s leadership on infrastructure and manufacturing after Republican President Trump nearly stole their thunder. If he succeeds then his administration and party will improve their support substantially. The US economy is opening rapidly while the COVID-19 vaccination campaign continues apace. Chart 1 shows that household disposable income and net worth surged as a result of giant fiscal relief while consumer spending lags behind due to social distancing. The $1.7 trillion treasure chest of personal savings creates the basis for an increase in spending as consumers get vaccinated and regain their freedom. Economic policy uncertainty has collapsed, even relative to global uncertainty (Chart 2). There are no longer doubts about whether government will spend the country out of a slump. Even state and local governments have been bailed out despite having much stronger finances than predicted. However, there are doubts about how much more deficit spending the Biden administration will be able to push through, and that is what will now be debated in Congress following Biden’s Pittsburgh proposals. Chart 1Lower Spending And Higher Income Led To Mounting Excess Savings
Lower Spending And Higher Income Led To Mounting Excess Savings
Lower Spending And Higher Income Led To Mounting Excess Savings
Chart 2US Policy Uncertainty Soon To Revive
US Policy Uncertainty Soon To Revive
US Policy Uncertainty Soon To Revive
There will not be much of a deflationary tail risk to the new business cycle in the context of this expansive fiscal policy, as bullish investors are well aware. However, policy uncertainty will revive going forward as more spending will raise the risk of economic overheating, tax hikes will affect different sectors disproportionately, deficits and debt will balloon, and Biden’s challenges with immigration and foreign policy will intensify. There is an upside risk for the stock market that Congress delays tax hikes but this is not our base case. In this week’s report we revise and update our estimates for the impact of Biden administration’s legislative proposals – including his projected $4 trillion-plus in spending on infrastructure, health, and education – taking into consideration Biden’s Pittsburgh speech, his first press conference on March 25, and all the rumors and leaks that have come to light over the past two weeks. Back-Of-The-Envelope Estimates Of US Growth And Output Gap After ARPA First we need to revise our back-of-the-envelope estimates of the impact of the $1.9 trillion American Rescue Plan Act (ARPA). Chart 3 shows two scenarios for US GDP growth. The first is the “maximum” scenario, in which US real GDP grows by 10.7% because all of the money authorized under the new law is spent. The second scenario puts real growth at 6% by using only the Congressional Budget Office’s expected federal outlays (as opposed to budget authority) to estimate the government spending component of GDP. In both cases we assume that 33% of the fiscal relief is spent in FY2021 and the remainder in FY2022. These scenarios do not include Biden’s American Jobs and Families Plans because those bills have yet to be drafted, let alone pass Congress. Chart 3Revised US GDP Estimates With ARPA
Biden’s Pittsburgh Speech And Legislative Agenda
Biden’s Pittsburgh Speech And Legislative Agenda
Consensus estimates put real GDP growth at 5.7% and the Federal Reserve estimates that 2021 growth will clock in at 6.5%, as shown in Chart 4. Not all of the government spending will translate directly into aggregate demand because 37% of the ARPA consists of direct checks and unemployment benefits to households that may only spend one-third of the amount they receive (while paying down debt with a third of it and saving a third of it). Yet more government deficit spending is coming down the pike and consumers are sitting on a huge pile of savings, which implies that growth could surprise to the upside of consensus estimates. Chart 4Consensus Estimates Of US GDP PosT-ARPA
Consensus Estimates Of US GDP PosT-ARPA
Consensus Estimates Of US GDP PosT-ARPA
Chart 5 uses our same back-of-the-envelope calculation to estimate the impact of current law (including ARPA) on the US output gap. The output gap is the difference between actual GDP growth and potential GDP growth – during busts the country’s growth falls well beneath potential while during booms it rises above potential. The chart shows that if all of the government relief funds are spent then the output gap will be more than closed by the end of the year. By contrast, the CBO’s January projection shows the output gap persisting through 2025. While our estimates in Chart 5 may be too generous regarding federal cash handouts translating directly to consumer spending and higher demand, nevertheless the consensus estimate is entirely understated and out of date as a result of ARPA and the Biden administration’s additional fiscal spending that is coming. Chart 5Revised US Output Gap Estimates With ARPA
Biden’s Pittsburgh Speech And Legislative Agenda
Biden’s Pittsburgh Speech And Legislative Agenda
Chart 6Revised US Budget Deficit Projection Post-ARPA
Biden’s Pittsburgh Speech And Legislative Agenda
Biden’s Pittsburgh Speech And Legislative Agenda
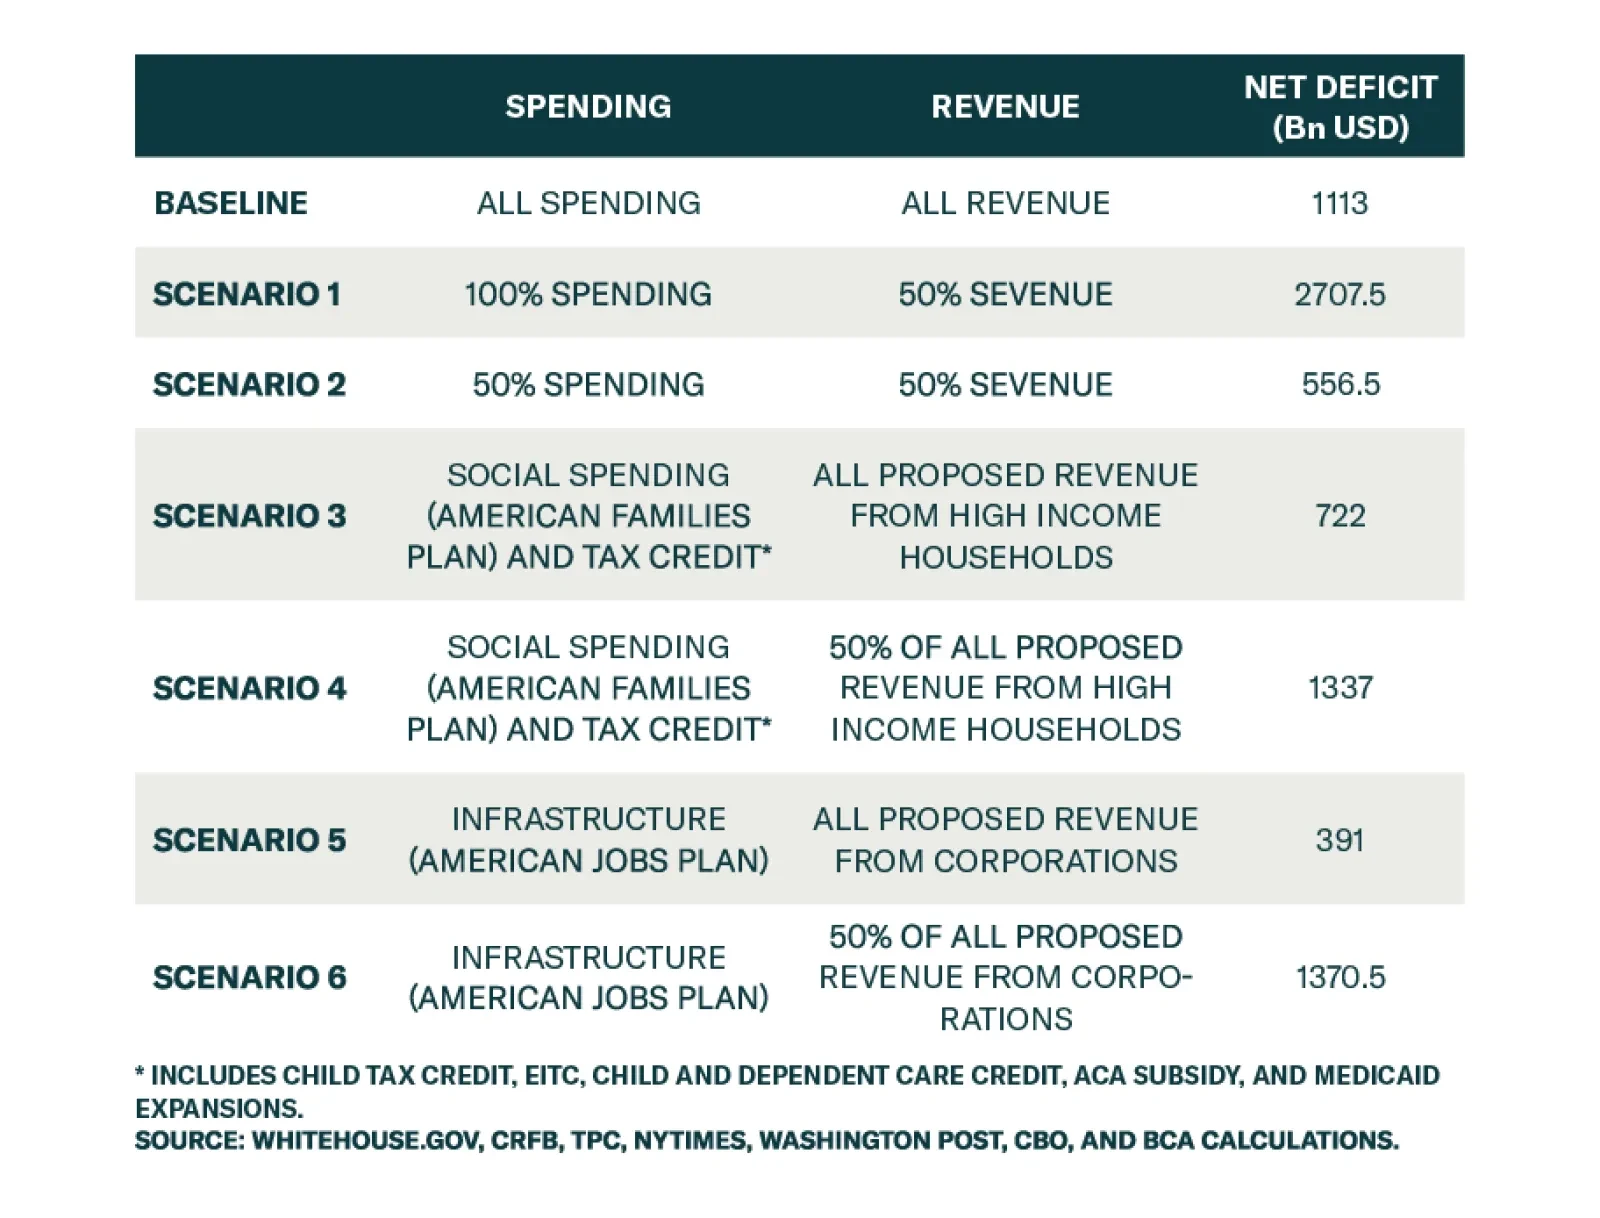
Chart 6 updates our US budget deficit outlook using the CBO’s February budget baseline. The ARPA’s increase in government spending is added to create the new Democratic Party status quo scenario over the next ten years, with the budget normalizing by 2025. The Democratic low spending scenario assumes that Biden passes the $2.4tn infrastructure-plus plan announced in Pittsburgh (Table 1) using all the revenue from all the corporate tax hikes. Biden’s agenda will be broken into separate bills with varying probabilities of success. So in our budget deficit outlook we only include the infrastructure-and-corporate-tax-hikes component that is apparently being prioritized. Table 1Biden's 'American Jobs Plan'
Biden’s Pittsburgh Speech And Legislative Agenda
Biden’s Pittsburgh Speech And Legislative Agenda
Bottom Line: US growth will surprise to the upside of consensus estimates while the US output gap will be closed much sooner than expected. Financial markets are largely prepared for this outcome, although it reinforces that investors should maintain a cyclically bullish view and tactically should buy on the dips. Biden’s Pittsburgh Speech And ‘American Jobs Plan’ Budget Impacts Our view is that the Biden administration has a subjective 80% chance of passing a second major budget reconciliation bill (FY2022) and a 50% chance of passing a third budget reconciliation bill (FY2023). The question appears to be resolved that Democrats will prioritize infrastructure over social welfare. Whichever one they prioritize can be linked to tax hikes and yet will still be highly likely to pass given that no Republican votes are needed under budget reconciliation rules. Moderate Democrats may water down the tax provisions but they would be suicidal to oppose their entire party on the administration’s signature piece of legislation. The social spending bill, assuming it follows infrastructure, would have to be pursued via a third reconciliation bill for FY2023 but it is less likely to pass. By next year Biden will have spent a lot of his political capital, fiscal spending fatigue will be a real phenomenon, and the 2022 midterm elections will loom. What matters for investors is the impact on the budget deficit since that will determine how big of an impact will hit GDP and how long US fiscal policy remains accommodative. Table 2 shows the impact on the budget balance if Biden gets all of his spending and all revenue proposals (Baseline), if he gets all the spending but only half the tax hikes (Scenario 1), and if he gets half the spending and half the tax hikes (Scenario 2). Scenarios 3 and 4 treat the social spending plan with varying degrees of tax revenue from the proposed individual tax hikes, while Scenarios 5 and 6 treat the infrastructure plan with varying tax revenue from corporate tax hikes. Table 2Biden’s Forthcoming ‘American Jobs Plan’ Legislative Proposals
Biden’s Pittsburgh Speech And Legislative Agenda
Biden’s Pittsburgh Speech And Legislative Agenda
Table 3 shows the Biden campaign’s proposed tax hikes by line item along with the spending proposals. The range of net deficit spending runs from about $400 billion to about $3 trillion over ten years, which is a broad range and not very telling but which seems, subjectively, likely to settle in the $2 trillion range. Chart 7 shows the budget deficit’s deviation from the status quo trajectory in each of these scenarios, i.e. additional fiscal thrust. Table 3Biden’s Tax-And-Spend Proposals In Detail
Biden’s Pittsburgh Speech And Legislative Agenda
Biden’s Pittsburgh Speech And Legislative Agenda
Chart 7US Budget Deficit Projections With ‘American Jobs Plan’ Agenda
Biden’s Pittsburgh Speech And Legislative Agenda
Biden’s Pittsburgh Speech And Legislative Agenda
The infrastructure package consists of a range of proposals having to do with traditional roads and bridges, renewable energy, rural broadband Internet, domestic manufacturing incentives, supply chain security initiatives, affordable housing, and research and development (see Table 1 above). The social safety net expansion consists of making permanent the child tax credit that was extended in the ARPA; lowering the Medicare eligibility requirement to age 60 from 65; lengthening paid family/medical leave for workers; funding universal pre-school; and funding tuition-free community college. Some Democrats will oppose delaying social spending and tax hikes because they may not pass before the midterms and Republicans could easily take back control of the House of Representatives in 2022. Hence there is still a chance that Biden will pursue infrastructure on a bipartisan and piecemeal basis while using the FY2022 budget reconciliation for his social spending and tax hikes. The reasoning goes as follows: Historically the House has a high probability of shifting against a new president’s party in his first midterm election. The only exception to this rule were George W. Bush and Franklin D. Roosevelt. Republicans will definitely oppose social welfare and tax hikes, whereas they could be convinced to support an infrastructure plan. Republicans will not vote for infrastructure if it includes tax hikes and many Democrats believe that long-term infrastructure spending will enhance productivity and hence need not require revenue offsets. Hence there is still a chance of a bipartisan infrastructure bill. This would jeopardize its overall passage but it would ensure that Democrats could pass their social agenda via FY2022 reconciliation. What are the odds of bipartisanship? Throughout this year we have reserved some space for bipartisan lawmaking to take place under the radar. A recent example is the Paycheck Protection Program (PPP) Extension Act of 2021, which Biden signed into law on March 30. This is a bipartisan extension of the small business emergency loan program that began under President Trump. Senate Majority Leader Mitch McConnell quashed objections from within his party to extending the program, which has substantial support from the National Federation of Independent Business.1 The result was a 92-7 vote majority in the Senate, showing that Republican cooperation is possible. The fact that Republicans also cleared the way for the use of earmarks, or pork barrel spending directed at a critical lawmaker’s constituency in exchange for his or her vote, also suggests that bipartisanship is possible, particularly on infrastructure. Republicans can also be brought to support efforts to secure supply chains and energize the US technological race with China, such as the $50 billion funding for semiconductor manufacturing, which could be part of a major infrastructure package or regular budget appropriations. The catch is that Republicans will not support tax hikes, unionization, IRS strengthening, workplace enforcement, or climate change policies pursued under the guise of infrastructure. As a result the Democrats are highly incentivized to bypass Republicans from the beginning and pursue their agenda through two separate reconciliation bills. Finally, Democrats still have the option of removing the Senate filibuster, enabling regular bills to pass with merely 51 votes. Investors should plan on this occurring despite the news media narrative suggesting that moderate Democrats do not want it to happen – the point is that it is not an invincible check on the ruling party’s power. Biden signaled in his first press conference on March 25 that he is willing to see the filibuster removed. Bottom Line: Democrats can pass most of their infrastructure and social safety net proposals via budget reconciliation bills for FY2022 and FY2023, without a single Republican vote. If they do so they can only spare three votes in the House and zero votes in the Senate – meaning that the devil is in the details. Their odds of passing the first are high at a subjective 80% but then their odds of passing the second are 50/50 at best. Thus it is not wise to bet against Democratic tax hikes or new spending. The net impact on the deficit will be negative and hence stimulating for the economy. Growth and inflation will surprise to the upside. Biden’s Political Capital Still Moderate-To-Strong Our argument above is based in great part on Biden’s political capital, which is moderate but likely to strengthen as consumer sentiment rises. Table 4 updates our US Political Capital Index. Political polarization is subsiding from extreme peaks, and business sentiment and economic conditions are improving (with a surge in capex intentions albeit rising concerns over regulation). Table 4Biden’s Political Capital Sufficient For Another Major Bill
Biden’s Pittsburgh Speech And Legislative Agenda
Biden’s Pittsburgh Speech And Legislative Agenda
The weak spot is household sentiment as Biden’s approval rating is falling (normal for presidents as their honeymoon ends). However, consumer confidence is already picking up and will surely accelerate with vaccinations gaining ground, the dole being delivered, and the service sector reviving. Chart 8 shows that Biden’s approval rating is settling in the mid-50% range, which is substantially better than Trump’s at this time although worse than President Obama’s. Biden can be understood as a synthesis of these two predecessors given that he is coopting Trump’s agenda on fiscal spending, infrastructure, trade, and manufacturing while continuing Obama’s legacy on regulation, immigration, civil rights, and foreign policy. We expect Biden’s approval rating not to fall too far, unless he suffers a foreign policy disaster with China, Iran, or Russia, given that over 50% of voters will tend to support him as long as President Trump is the obvious alternative. Chart 9 suggests that Biden’s economic approval rating is weak but this score is going to rise once the new relief funds are distributed and the economic recovery gets going full steam. The early business cycle will probably be a constant source of support for the president over his four-year term. Chart 8Biden’s Approval Rating Fairly Stout
Biden’s Pittsburgh Speech And Legislative Agenda
Biden’s Pittsburgh Speech And Legislative Agenda
Chart 9Biden’s Approval On Economy Will Rise
Biden’s Pittsburgh Speech And Legislative Agenda
Biden’s Pittsburgh Speech And Legislative Agenda
Remarkably even the US Congress is gaining greater popular approval (Chart 10). This is very rare in modern times and could suggest that a major change is taking shape as Congress pursues populist fiscal policy under both Trump and Biden. Congress is handing out free money so people suddenly don’t hate it as much. There is a limit to how popular Congress will become and it will certainly not shake off its hard-earned reputation for gridlock and partisan rancor by suddenly exemplifying enlightenment and bipartisanship. But any rise in congressional approval is notable and would imply greater political capital for the current government and hence greater policy certainty for investors in the short run. Biden’s political capital is not yet suffering due to economic overheating as the latter has not yet happened – but it is a risk to monitor over the medium term. Inflationary pressures continue to build across the supply chain. Small businesses are increasingly flagging cost of labor as a rising concern while consumer price inflation is likely to pick up. Chart 10Congress Is Becoming More Popular
Biden’s Pittsburgh Speech And Legislative Agenda
Biden’s Pittsburgh Speech And Legislative Agenda
Inflation expectations are critical and will take time to change. Americans think about inflation through prices at the pump. Chart 11 shows the US and global crude oil price and average gasoline prices at the gas station for US consumers. Gasoline prices have surged although they are not yet at the $4 per gallon level that causes popular concern to escalate sharply. Chart 11Inflation Is Coming But Geopolitics Brings Oil Price Volatility
Inflation Is Coming But Geopolitics Brings Oil Price Volatility
Inflation Is Coming But Geopolitics Brings Oil Price Volatility
Oil prices are expected to go higher in the coming two years, according to our Commodity & Energy Strategy, but over a five-year period global supply-demand trends and balances suggest that the price will fluctuate within the $60-$80 dollar range. Biden’s regulations and foreign policy will introduce some volatility by hampering domestic US production, triggering sparks in the Middle East over Iran, and yet ultimately increasing global supply via any diplomatic deal with Iran. The BCA Research House View holds that today’s inflation is a temporary phenomenon whereas a more substantial bout of inflation is waiting in the medium-to-long term. The reason our strategists are not overly concerned in the near term is that there is still substantial slack in the economy: the labor force participation rate has fallen from 63.3% to 61.4% since the pandemic, the U6 unemployment rate stands at 11.1% (up from 7% prior to the pandemic), and the all-important employment-to-population ratio for prime-age workers stands at 57.6%, down from 61.1% prior to the pandemic. However, this slack is on pace to be tightened quickly as long as the pandemic subsides and Biden’s American Jobs Plan passes. Bottom Line: Our US Political Capital Index suggests Biden’s political capital is moderate-to-strong, which supports our view that he can pass at least one more major piece of legislation and possibly two. Inflation expectations will rise further and the selloff in US treasuries will continue. Investment Takeaways The market rally since January has priced a lot of the good news from Biden’s proposals, which are broadly similar to his campaign proposals. There is not a clear legislative strategy and passing two major bills before the midterm elections is a stretch. The priority bill, however, looks to pass by the end of this year after a roller-coaster ride of congressional negotiations and horse-trading. Deep cyclical sectors will benefit the most. We remain long value over growth stocks, specifically industrials and materials. We are also maintaining our long BCA infrastructure basket at least until passage of the bill is secured. Our infrastructure basket consists of a range of materials and machinery producers, construction services, and environmental services, and does not focus on headline “infrastructure” companies in the utilities and telecoms sectors. We recommend going long large cap energy stocks relative to small caps, which will have a harder time adjusting to Biden’s regulatory, tax, and green agenda. A long-term infrastructure plan that includes green energy, manufacturing, digital infrastructure, and R&D could create a productivity boost. Hiking the corporate tax rate to 28% is negative for corporate earnings but it will take place over a longer time frame and is being introduced in the context of a cyclical upswing. Hence we remain bullish over the course of this year. Biden’s Pittsburgh speech ostensibly confirmed the news flow over the past month suggesting that the Democrats will not propose a government-provided health insurance option in their upcoming legislative proposals. Instead they are prioritizing lowering the Medicare eligibility requirement and enabling Medicare to negotiate pharmaceutical prices. Our short of the managed health care sub-sector suffered from this shift in policy focus although we will maintain the trade as we expect the public option to reemerge at a later date. Meanwhile our pair trade of long health equipment and facilities relative to pharmaceuticals and bio-tech continues to perform well (Chart 12). A clear beneficiary of the US’s newfound proactive fiscal policy is the consumer. Consumer spending has not fully recovered from the pandemic and recession. Household disposable income ticked down in February from January, after the distribution of the government’s $900 billion COVID-19 relief funds in the Consolidated Appropriations Act passed in December. However, disposable income is up 8% over the 12 months since COVID broke out, due to fiscal relief. The result of lower spending and higher income is an increase in the personal saving rate to 13.6% in February, well above normal, as our US Bond Strategy highlights in its latest report. Recent research from our US Investment Strategy highlights that consumer growth should track relatively well with increases in household net worth, implying that nominal personal consumption expenditures could grow at a rate of 8.8% by the end of the year and 6.9% by the end of next year. Chart 12Stay Long Industrials Over Health Care
Stay Long Industrials Over Health Care
Stay Long Industrials Over Health Care
Chart 13Go Long Consumer Discretionary Stocks
Go Long Consumer Discretionary Stocks
Go Long Consumer Discretionary Stocks
In this context we take a positive view of consumer stocks in general. Cyclically we would favor consumer discretionary stocks and recommend investors go long. While discretionary spending should outperform as the economic upswing gains pace, we are holding consumer staples as a hedge against bad news (Chart 13). Not only will Biden’s tax hikes, inflation, and the rise in bond yields cause ongoing risks to cyclical sectors, but Biden also faces a series of imminent foreign policy tests with China/Taiwan, Iran, Russia, and North Korea, as highlighted in our sister Geopolitical Strategy. Matt Gertken Vice President Geopolitical Strategy mattg@bcaresearch.com Appendix Table A1Political Risk Matrix
Biden’s Pittsburgh Speech And Legislative Agenda
Biden’s Pittsburgh Speech And Legislative Agenda
Table A2APolitical Capital: White House And Congress
Biden’s Pittsburgh Speech And Legislative Agenda
Biden’s Pittsburgh Speech And Legislative Agenda
Table A2BPolitical Capital: Household And Business Sentiment
Biden’s Pittsburgh Speech And Legislative Agenda
Biden’s Pittsburgh Speech And Legislative Agenda
Table A2CPolitical Capital: The Economy And Markets
Biden’s Pittsburgh Speech And Legislative Agenda
Biden’s Pittsburgh Speech And Legislative Agenda
Table A3Biden’s Cabinet Position Appointments
Biden’s Pittsburgh Speech And Legislative Agenda
Biden’s Pittsburgh Speech And Legislative Agenda
Footnotes 1 Bill Scher, “The Bipartisan Senate Bill You Haven’t Heard About,” Real Clear Politics, realclearpolitics.com.
Feature The global macro landscape over the next six months or so will be characterized by a booming US economy and decelerating growth in China. Financial markets will move accordingly. US Treasury yields will remain under upward pressure, the US dollar will rebound, commodities prices will experience a setback and EM equities will continue underperforming DM stocks. The upcoming US economic boom is a well-known narrative and does not require much elaboration. China’s slowdown, on the other hand, is a matter of debate among investors and commentators. We have been arguing that macro policy tightening and a resumption of regulatory clampdowns on the financial system and property market are bound to result in a growth deceleration in China. There are already leading indicators that point to an impending growth slowdown: Chart 1China Is Set To Decelerate
China Is Set To Decelerate
China Is Set To Decelerate
The latest datapoint for domestic orders from the PBOC’s survey of 5000 industrial enterprises has relapsed in Q1. It leads A-share companies EPS growth by six months (Chart 1, top panel). The message is that industrial companies’ profit growth will once again slow in H2 2021. The recent setback in Chinese A-shares is evidence that markets are already beginning to price in a profit deceleration in H2. The bottom panel of Chart 1 indicates that banks’ claims on enterprises and households have rolled over and will continue downshifting. This is consistent with easing bank loan approvals and reflects policymakers’ guidance for banks. In Charts 3, 4, 6, 7, 8, 9, 10, 11 and 13 below, we illustrate more indicators and evidence of a forthcoming peak in the Chinese business cycle in general and commodities prices in particular. Weakening growth in China will hurt EM stocks and currencies more than those in DM, as many emerging economies are exposed to industrial commodities that are much more sensitive to demand in China versus trends in the US. Also, many Asian economies export more to China than they do to the US and Europe. Besides, the growth outlook in EM (ex-China, Korea and Taiwan) remains sub-par, especially relative to the US and DM more broadly. The reasons for this are slower vaccination rates and by extension economic reopening, a lack of fiscal stimulus and unhealthy banking systems. Notably, Chart 39 below demonstrates that EM bank stocks are breaking down relative to DM bank stocks. This potential breakdown reflects the state of EM fundamentals relative to those of DM. This week we recommend a new trade: short EM banks / long DM banks. In the US, the feature story will be the brisk pace of its reopening, an economic boom and intensifying inflationary pressures. So long as US bond yields continue rising, the US dollar will be supported. The next downleg in the greenback will occur when inflation rises but the Fed explicitly refuses to tackle it. Odds are that we are several months away from that. Hence, rising US bond yields will prop up the US dollar for now. The rebound in the US dollar and rising US bond yields will weigh on EM fixed income. The bottom panel of Chart 30 below illustrates that EM credit spreads negatively correlate with commodity prices. All in all, EM credit spreads will likely widen. Together with ascending US Treasury yields, this means higher EM sovereign and corporate dollar bond yields. The latter have always been associated with lower EM share prices (Chart 2, top panel). Chart 2Rising Corporate Bond Yields Are A Threat To Stocks
Rising Corporate Bond Yields Are A Threat To Stocks
Rising Corporate Bond Yields Are A Threat To Stocks
Strategy: As a tactical strategy (three to six months), last week we recommended downgrading the allocation to EM within global equity and credit portfolios from neutral to underweight. We also recommended shorting a basket of the following EM currencies versus the US dollar for the next several months: HUF, PLN, PHP, TRY, CLP, ZAR, KRW, BRL and THB. Strategic portfolios should maintain neutral allocations to EM equities, credit, local bonds and currencies. Arthur Budaghyan Chief Emerging Markets Strategist arthurb@bcaresearch.com Chinese Share Prices Point To A Top In Commodities Prices The recent underperformance of Chinese onshore cyclical stocks relative to defensive stocks heralds a slowdown in growth and has historically been a good indicator for raw materials prices. Consistently, the latest pullback in share prices of materials companies included in the MSCI China Investable Index also signals a drop in industrial metals prices. Chart 3Chinese Share Prices Point To A Top In Commodities Prices
Chinese Share Prices Point To A Top In Commodities Prices
Chinese Share Prices Point To A Top In Commodities Prices
Chart 4Chinese Share Prices Point To A Top In Commodities Prices
Chinese Share Prices Point To A Top In Commodities Prices
Chinese Share Prices Point To A Top In Commodities Prices
Commodities: New Secular Bull Market Or A Trading Range? Various Chinese liquidity and money measures have historically led the CRB Raw Materials Price Index and presently signal a relapse in commodities. The 200-year chart showing raw materials (excluding oil and gold) prices in real (inflation-adjusted) terms suggests that commodities prices have not undershot their long-term time-trend (Chart 5). We do not argue for a continuation of a structural bear market in commodities, but a medium-term setback is likely in the next three to six months. Chart 5Commodities: New Secular Bull Market Or A Trading Range?
Commodities: New Secular Bull Market Or A Trading Range?
Commodities: New Secular Bull Market Or A Trading Range?
Chart 6Commodities: New Secular Bull Market Or A Trading Range?
Commodities: New Secular Bull Market Or A Trading Range?
Commodities: New Secular Bull Market Or A Trading Range?
Chart 7Commodities: New Secular Bull Market Or A Trading Range?
Commodities: New Secular Bull Market Or A Trading Range?
Commodities: New Secular Bull Market Or A Trading Range?
EM Share Prices Are Beginning To Price A Profit Slowdown In H2 2021 The rally in EM share prices last year has priced the ongoing profit recovery. However, the apex in Chinese money/credit measures entails an EM profit slowdown in H2 this year (Chart 8). Besides, the considerable pullback in Chinese cyclicals-to-defensive stock prices implies further drawdown in EM share prices. Chart 8EM Share Prices Are Beginning To Price A Profit Slowdown In H2 2021
EM Share Prices Are Beginning To Price A Profit Slowdown In H2 2021
EM Share Prices Are Beginning To Price A Profit Slowdown In H2 2021
Chart 9EM Share Prices Are Beginning To Price A Profit Slowdown In H2 2021
EM Share Prices Are Beginning To Price A Profit Slowdown In H2 2021
EM Share Prices Are Beginning To Price A Profit Slowdown In H2 2021
The Chinese Economy: Shifting Into Low Gear In China, liquidity and money measures portend a peak business cycle. Excluding TMT companies, Chinese investable stocks have failed to break above their trading range of the past ten years. Notably, the slowdown is not limited to the old economy. The Caixin New Economy Index has dropped to its early 2019 level. Chart 10The Chinese Economy: Shifting Into Low Gear
The Chinese Economy: Shifting Into Low Gear
The Chinese Economy: Shifting Into Low Gear
Chart 11The Chinese Economy: Shifting Into Low Gear
The Chinese Economy: Shifting Into Low Gear
The Chinese Economy: Shifting Into Low Gear
Chart 12The Chinese Economy: Shifting Into Low Gear
The Chinese Economy: Shifting Into Low Gear
The Chinese Economy: Shifting Into Low Gear
Chart 13The Chinese Economy: Shifting Into Low Gear
The Chinese Economy: Shifting Into Low Gear
The Chinese Economy: Shifting Into Low Gear
Peak Growth And Equity Sentiment We have been showing Chart 14 for the past several months. The record high sentiment on EM equities in January preceded with an apex in EM share prices in February. This measure of sentiment is not yet low enough to expect a bottom in EM stocks. Chart 15 shows a similar indicator for euro area equities. Will it play out in the euro area as it did with EM? Chart 14Peak Growth And Equity Sentiment
Peak Growth And Equity Sentiment
Peak Growth And Equity Sentiment
Chart 15Peak Growth And Equity Sentiment
Peak Growth And Equity Sentiment
Peak Growth And Equity Sentiment
Booming IPOs And Secondary Issues = Peak Investor Sentiment The numbers of IPOs and secondary issuances have risen to a record high in China and EM. Often, this development is consistent with peak investor sentiment that coincides with some sort of top in share prices. Chart 16Booming IPOs And Secondary Issues = Peak Investor Sentiment
Booming IPOs And Secondary Issues = Peak Investor Sentiment
Booming IPOs And Secondary Issues = Peak Investor Sentiment
Chart 17Booming IPOs And Secondary Issues = Peak Investor Sentiment
Booming IPOs And Secondary Issues = Peak Investor Sentiment
Booming IPOs And Secondary Issues = Peak Investor Sentiment
Chart 18Booming IPOs And Secondary Issues = Peak Investor Sentiment
Booming IPOs And Secondary Issues = Peak Investor Sentiment
Booming IPOs And Secondary Issues = Peak Investor Sentiment
Equity Risk Premium: EM Equities Are Not Cheaper Than European And Japanese Equities Equity earnings yield minus interest rates (a proxy for equity risk premium) in EM is similar to that of the US. Hence, adjusted for local interest rates, EM stocks are not cheap. In fact, European and Japanese stocks are cheaper than EM stocks. Chart 19Equity Risk Premium: EM Equities Are Not Cheaper Than European And Japanese Equities
Equity Risk Premium: EM Equities Are Not Cheaper Than European And Japanese Equities
Equity Risk Premium: EM Equities Are Not Cheaper Than European And Japanese Equities
Chart 20Equity Risk Premium: EM Equities Are Not Cheaper Than European And Japanese Equities
Equity Risk Premium: EM Equities Are Not Cheaper Than European And Japanese Equities
Equity Risk Premium: EM Equities Are Not Cheaper Than European And Japanese Equities
A US Dollar Rebound = EM Setback Both EM equity recent selloffs and relative underperformance versus DM occur alongside US dollar strength. Besides, EM equity relative performance often moves counter to US stocks relative performance against the global benchmark (Chart 23). Finally, emerging Asian stocks’ relative performance versus the global index has hit a major technical resistance. The path of least resistance is, for now, on the downside. Chart 21A US Dollar Rebound = EM Setback
A US Dollar Rebound = EM Setback
A US Dollar Rebound = EM Setback
Chart 22A US Dollar Rebound = EM Setback
A US Dollar Rebound = EM Setback
A US Dollar Rebound = EM Setback
Chart 23A US Dollar Rebound = EM Setback
A US Dollar Rebound = EM Setback
A US Dollar Rebound = EM Setback
Chart 24A US Dollar Rebound = EM Setback
A US Dollar Rebound = EM Setback
A US Dollar Rebound = EM Setback
EM Stocks Have Formed A Medium-Term Top The EM overall equity benchmark (shown in Chart 20) as well as EM ex-TMT stocks, EM (ex-China, Korea and Taiwan) share prices, EM small caps and the EM equal-weighted index have so far failed to break out. The forthcoming slowdown in China, rising US Treasury yields, the US dollar rebound and poor fundamentals in EM (ex-China, Korea and Taiwan) are consistent with these technical patterns and warrant caution for now. Chart 25EM Stocks Have Formed A Medium-Term Top
EM Stocks Have Formed A Medium-Term Top
EM Stocks Have Formed A Medium-Term Top
Chart 26EM Stocks Have Formed A Medium-Term Top
EM Stocks Have Formed A Medium-Term Top
EM Stocks Have Formed A Medium-Term Top
Chart 27EM Stocks Have Formed A Medium-Term Top
EM Stocks Have Formed A Medium-Term Top
EM Stocks Have Formed A Medium-Term Top
Chart 28EM Stocks Have Formed A Medium-Term Top
EM Stocks Have Formed A Medium-Term Top
EM Stocks Have Formed A Medium-Term Top
Rising US Treasury Yields Are A Bad Omen For EM Fixed-Income Investor sentiment on US Treasurys is neutral, as is JP Morgan’s duration survey. Major market moves do not halt when sentiment is neutral but rather persist until sentiment becomes extreme. This and the economic boom and rising inflationary pressures in the US are the basis for higher US bond yields. The latter will push up both EM local currency and US dollar bond yields. In turn, a relapse in commodities prices will lead to a widening EM credit spread. Chart 29Rising US Treasury Yields Are A Bad Omen For EM Fixed-Income
Rising US Treasury Yields Are A Bad Omen For EM Fixed-Income
Rising US Treasury Yields Are A Bad Omen For EM Fixed-Income
The US Dollar Rebound Is In The Making The US dollar will continue its rebound as the US economic growth outpaces others and US yields rise relative to their peers. In turn, a rollover in commodities prices is a harbinger of EM currency weakness. Chart 30The US Dollar Rebound Is In The Making
The US Dollar Rebound Is In The Making
The US Dollar Rebound Is In The Making
Chart 31The US Dollar Rebound Is In The Making
The US Dollar Rebound Is In The Making
The US Dollar Rebound Is In The Making
Chart 32The US Dollar Rebound Is In The Making
The US Dollar Rebound Is In The Making
The US Dollar Rebound Is In The Making
Chart 33The US Dollar Rebound Is In The Making
The US Dollar Rebound Is In The Making
The US Dollar Rebound Is In The Making
A Strong Dollar Will Redistribute Inflation From The US To The Rest Of the World US import prices are rising in US dollar terms but not enough to offset exporters’ currency appreciation of the past 12 months. In fact, export prices in local currency terms have been tame in China and Korea. The greenback might appreciate in the near term to redistribute inflationary pressures from the US to the rest of the world, where the risk remains deflation/disinflation. Chart 34A Strong Dollar Will Redistribute Inflation From The US To The Rest Of the World
A Strong Dollar Will Redistribute Inflation From The US To The Rest Of the World
A Strong Dollar Will Redistribute Inflation From The US To The Rest Of the World
Chart 35A Strong Dollar Will Redistribute Inflation From The US To The Rest Of the World
A Strong Dollar Will Redistribute Inflation From The US To The Rest Of the World
A Strong Dollar Will Redistribute Inflation From The US To The Rest Of the World
EMs’ Poor Fundamentals In recent weeks, Brazil and Russia have hiked their policy rates. However, core consumer price inflation in both countries remains well behaved. Both economies are sluggish. In short, economic growth and inflation did not herald higher policy rates. Higher borrowing costs will jeopardize growth in these and other EM economies. Critically, the breakdown in EM relative to DM bank share prices (Chart 39) is a sign of poor health of EM banks and their inability to finance the economic recovery. Chart 36EMs' Poor Fundamentals
EMs' Poor Fundamentals
EMs' Poor Fundamentals
Chart 37EMs' Poor Fundamentals
EMs' Poor Fundamentals
EMs' Poor Fundamentals
Chart 38EMs' Poor Fundamentals
EMs' Poor Fundamentals
EMs' Poor Fundamentals
Investment Ideas A few of our investment recommendations outside our main strategy are: (1) long Chinese A-shares / short investable stocks; (2) long global value / short Chinese investable value stocks; (3) long global industrials / short global materials; (4) short a basket of EM currencies versus the US dollar or go long EM currency volatility. This week we are adding a new recommendation: short EM banks / long DM banks (Chart 39). Chart 39Investment Ideas
Investment Ideas
Investment Ideas
Chart 40Investment Ideas
Investment Ideas
Investment Ideas
Chart 41Investment Ideas
Investment Ideas
Investment Ideas
Footnotes Equities Recommendations
Growth Divergence: Booming US, Slowing China
Growth Divergence: Booming US, Slowing China
Currencies, Credit And Fixed-Income Recommendations
What To Make Of Near Insatiable Risk Appetite?
What To Make Of Near Insatiable Risk Appetite?
We recently came across an old BCA indicator – the Risk Appetite Index (RAI) – and after dusting it off we tweaked it a bit and are updating it today for the first time since US Equity Strategy last showed it in 2007! The RAI comprises eight equally weighted risk on and off indicators shown as a z-score and constructed so that a rising value indicates increasing risk appetite and vice versa. For example, a rising VIX indicates risk off and thus is inverted as part of the RAI. Currently the RAI has literally gone off the charts and signals that investors are craving risk. True, previous nose bleed readings have been associated with significant market tops including late-1990s, mid-2008 and late-2019 RAI readings over one (see chart). However, the last time the RAI was over four standard deviations above the historical mean was during the GFC rebound from late-2009/early-2010 when the SPX also had a monster run-up as we recently showed in our research. Excessive leverage and the January Melvin Capital and more recent Archegos Capital Management blowup anecdotes are unnerving, and in the near-term some caution is warranted (as a reminder, we continue to hold the long VIX June futures as a hedge). However, more often than not such a high RAI reading has been resolved with an SPX correction and not a meltdown. As we have been highlighting recently, our biggest risk, aside from China’s slowdown, remains the Fed becoming at the margin less accommodative in the back half of the year when it will start talking about talking about tapering. Bottom Line: While the SPX is getting close to our 4,000 year-end target and some near-term caution is warranted, the equity bull market (and business cycle) is in its infancy and we reiterate our cyclical and structural sanguine views.
On Wednesday, President Biden unveiled his second major economic program. The American Jobs Plan is a $2.4 trillion investment in the country’s infrastructure, designed to improve the quality of infrastructure, create jobs and “out-compete China”. The…
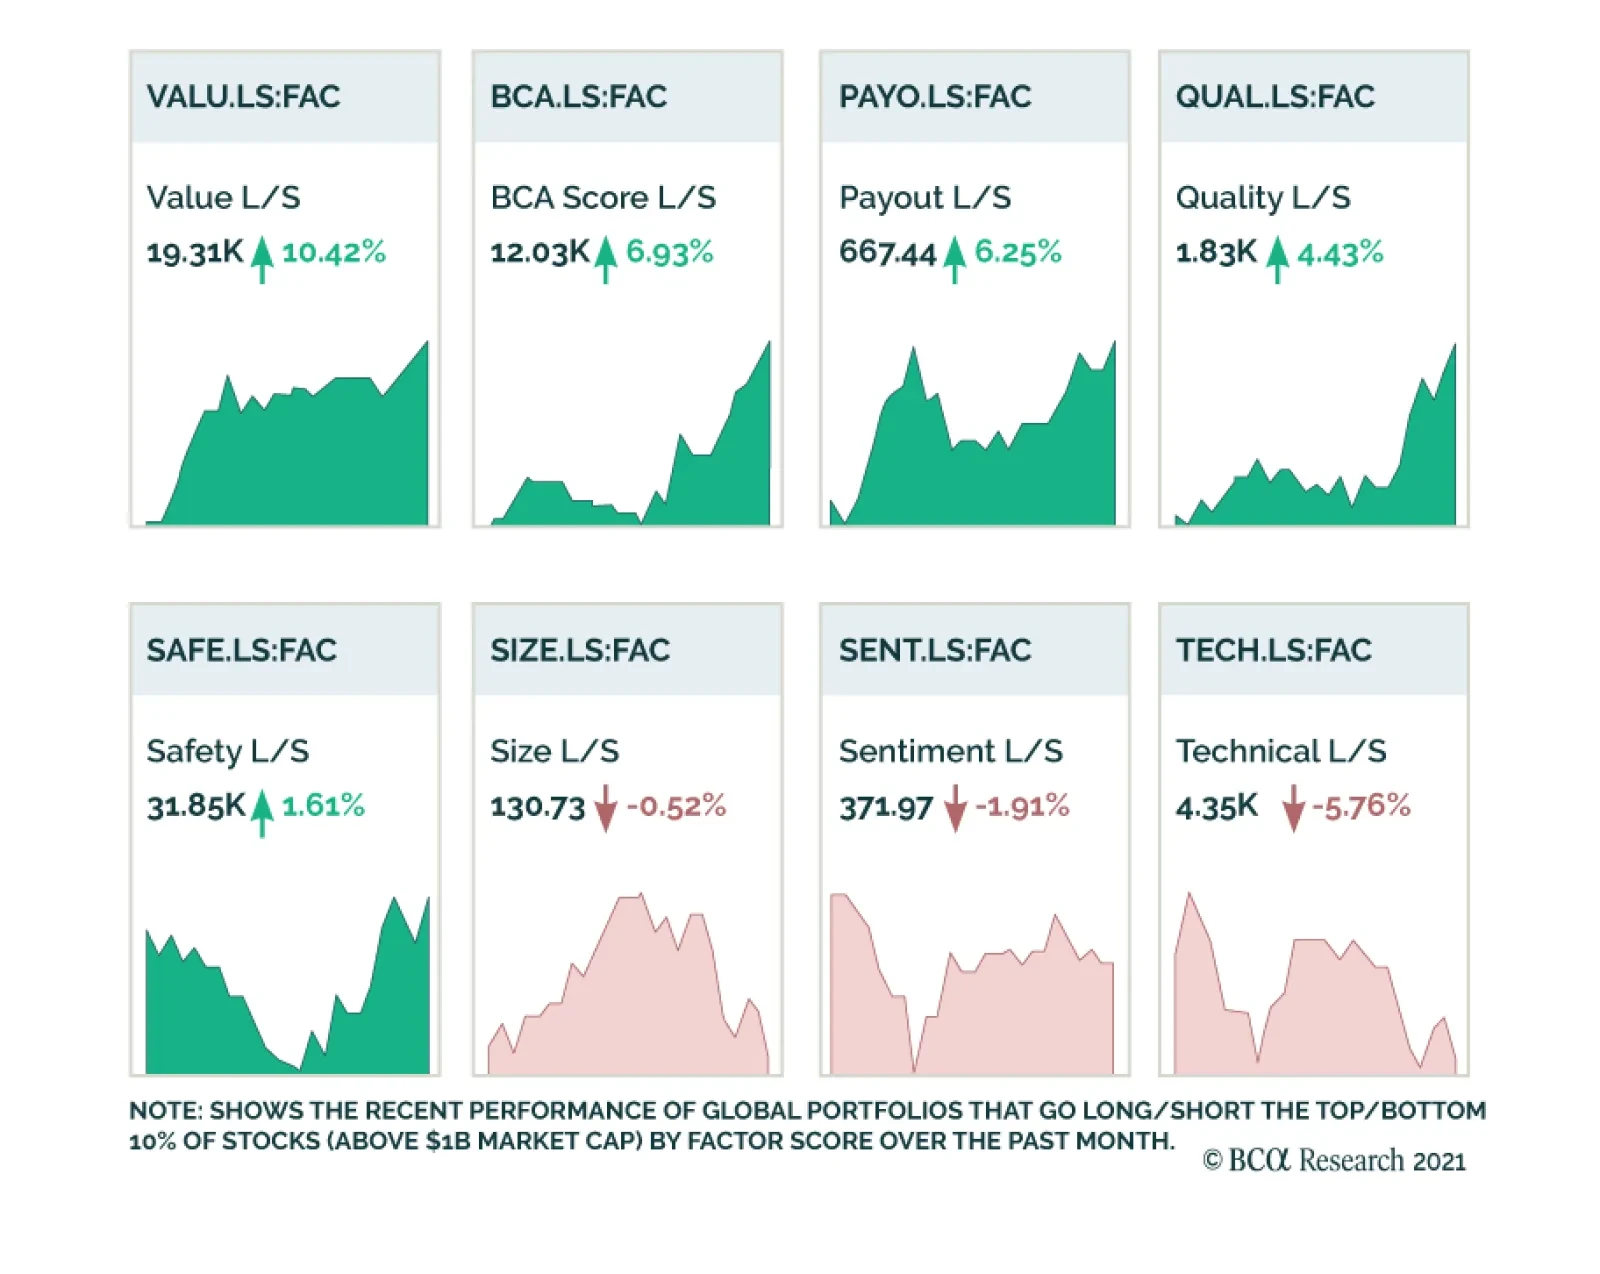
Size and Sentiment had been the dominant factors driving equity markets since the conclusion of the US Presidential Election and positive vaccine news in early November 2020. Other key factors such as Quality and Safety had been lagging. This phenomenon was…
In the latest Special Report we attempted to answer the question of whether this coming rebound in CPI is a paradigm shift that will push the US into a new era of consistently high (i.e. above 3%/annum) core CPI inflation, or is it a merely counter trend inflationary spike within the broader deflationary megatrend? We took a deep dive into six structural forces behind inflation that we identified. Four of those forces were pro-inflationary, while the remaining two were anti-inflationary (Table 1). We also assigned a value on our subjective strength scale for each force. Each value incorporates how quickly a particular force will come to fruition, and how strong it will be over the next 5-to-10 year period. Based on our analysis, we concluded that there are rising odds that the deflationary megatrend has run its course and has reached an inflection point of turning inflationary. Bottom Line: On a structural basis (10-years), it is likely that the deflationary trend is turning. For more details please refer to this Monday’s Special Report.
From Deflation To Eventual Inflation
From Deflation To Eventual Inflation