United States

The inflation/deflation debate has been dominating the news flow and we are compelled to offer our thoughts in two-part series of Special Reports on this widely discussed, but also widely misunderstood topic. Over the past year, we have been inundated with countless questions about our outlook on inflation given the dual monetary and fiscal stimuli that have been ongoing since Covid-19 hit (Chart 1). We take this opportunity to provide detailed answers on everything inflation in this series of Special Reports. Specifically, in this first report we focus on the long-term and structural forces behind US core CPI inflation. We go in depth into the drivers behind the current deflationary trend and also examine what other variables might break that trend in the future. We also try to ignore the medium-term outlook because the inflation story is well-known as the financial media is littered with charts that slice and dice the ISM manufacturing release in every possible way showing that inflation will rebound. Hence, there is no disagreement about the medium-term path for the core CPI inflation. Chart 12020 Stimuli
2020 Stimuli
2020 Stimuli
The important question that we look to answer in this Special Report is whether this rebound is a paradigm shift that will push the US into a new era of consistently high (i.e. above 3%/annum) core CPI inflation, or is it a merely counter trend inflationary spike within the broader deflationary megatrend? Laying The Groundwork Before we wrestle with the structural forces behind inflation, first we must get the question of quantitative easing (QE) and its effects on the real economy and inflation out of the way. Undoubtedly, QE is an integral part of any discussion about the real-word and/or financial asset price inflation, and while it tickles the public’s imagination with hyperinflationary fears, the reality is that those fears are largely misplaced (Chart 2). In fact, pundits have established a consensus: “QE only affects the financial economy as it increases bank reserves that can never escape in the real economy. On the other hand, fiscal stimulus affects the real economy and can cause genuine inflation.” There clearly hasn’t been any material inflation since the GFC, so the argument of “QE only affecting the financial economy” appears to be correct, but at closer look there is room for a different interpretation. What is important to understand is that QE is nothing but a tool, sometimes a signaling tool, in the Fed’s arsenal, and like any tool, it can be used in different ways. Chart 2Boogeyman?
(Part I) Tinkering With Inflation: Outlook
(Part I) Tinkering With Inflation: Outlook
The fact that there has not been any material real-world inflation since the housing bubble is neither because QE is structurally deflationary nor because it “cannot touch” the real economy, but because policy makers chose to use the QE tool to rescue creditors (the financial sector) rather than debtors (the real economy) during the GFC. Delving deeper in the Great Recession, the banks were largely undercapitalized with cash accounting for a tiny portion of overall assets and Treasury holdings being at historic lows (Chart 3). The rest of the assets were tied to loans and other risky securities. Once NINJA loans and other subprime loans along with the derivative CLOs/CDOs house of cards began imploding, the banking sector could not stomach the losses owing to the nonexistent cash buffer, and the entire system went into insolvency mode. This is when the Fed stepped in with QE (and the Treasury with TARP in order to recapitalize the banks) to bail out the nervous system of the US economy by boosting reserves and giving freshly printed money to the banks in exchange for their Treasurys, MBS and other risky securities. By providing support to the banking system, the Fed was counterbalancing a deflationary financial industry shutdown (the Richard Koo balance sheet type recession) rather than injecting an inflationary real economic stimulus. As a result, nearly all of the newly created money was stuck in the financial system in the form of new reserves, and as far as the real economy was concerned, no new money entered directly into the real world. This is how the consensus of “QE only affecting the financial economy” was formed, and why we did not observe a long-lasting rise in CPI despite all of the GFC-brought about stimuli. Chart 3Banks Were Well-capitalized
Banks Were Well-capitalized
Banks Were Well-capitalized
Fast-forward to today, and the backdrop could not be more different. The banking sector was well capitalized, so doing an aggressive QE to boost reserves and to stimulate the financial sector would have only provided marginal benefits. The deflationary shock came through the real economy, not the financial economy, meaning that a real (i.e. fiscal) stimulus was needed. Once again, the QE tool comes to the rescue. This time however, QE was also used to finance Main Street stimulus programs as the Fed bought long dated Treasury (and other) securities that pushed interest rates to rock bottom levels and helped facilitate government stimulus spending. Consequently, a more meaningful fraction of QE money reached Main Street and had an effect on the real economy and was not just locked in new reserves. As a reminder, when rates fall to zero and the Fed embarks on QE, the lines between monetary and fiscal policies get blurred. When QE (instead of the foreign or private sectors) is used to facilitate government expenditures, which later on gets distributed into the real economy, QE can provide inflationary support and can reach the real economy. Chart 42008 Versus Today
2008 Versus Today
2008 Versus Today
Perhaps the best way to illustrate the difference between 2008 and 2020 is by showing M2 money supply data. The spike in M2 data in 2020 dwarfs the one in 2008; in 2020 QE money reached the real economy and ended up in private sector’s bank accounts (thus contributing to M2 growth), whereas in 2008 QE money was mainly locked in bank reserves. True the money multiplier and M2 money stock velocity are still in hibernation, and were we to see a sustainable inflationary impulses both of these indicators would have to show signs of life (Chart 4). So does this mean that there are grounds for longer-term inflationary concerns since in 2020 QE actually reached the real economy? To answer this question, we now dig deeper into the secular inflation forces and split them in two camps: pro-inflationary and anti-inflationary. Pro-Inflationary Driver #1: The Buenos Aires Consensus Our view since last June has been that fiscal deficits are here to stay as far as the eye can see and the shift from the Washington to the Buenos Aires Consensus1 is a paradigm shift with staying power. The most important long-term consequence of the Buenos Aires Consensus will be higher inflation. And we are not talking just the asset price kind – which investors have enjoyed over the past decade – but of the more traditional flavor: consumer price inflation. Crudely put, as long as fiscal support remains in place (proverbial helicopter drop, Chart 5) after the pandemic is long forgotten it can serve as a meaningful catalyst for structural inflation, instead of being a one-off counterbalancing short-term boost. To reiterate just how much more powerful fiscal spending is outside of a recession, we conduct a labor market analysis and show that a large percentage of the present-day stimulus is being used to counterbalance the deflationary pandemic shock, rather than contributing to driving inflation higher. Table 1 shows our proxy for total payroll losses incurred by America households as a direct result of the pandemic. Our estimate is $501 billion from March 2020 until today. Chart 5Helicopter Checks
Helicopter Checks
Helicopter Checks
The Committee for a Responsible Federal Budget also publishes detailed statistics on the dollar flow of every pandemic stimulus program to a specific economic sector. As of today, US households received $1,400 billion, but some of the stimulus categories simply defer a payment that households still have to make in the future, instead of injecting brand-new money. After stripping those categories out, we arrive to a cleaner number of roughly $1,000 billion – that is how much new money US households received. Next, we subtract our total payroll loss proxy resulting into a net inflow of approximately $500 billion or 2.3% of 2020 US GDP. This is a respectable sum and 2.3% is significant. However, it has one major drawback. The 2.3% GDP stimulus number assumes that every single dollar was actually spent into the real economy, which we know is not true. Table 1The Counterbalancing Effect
(Part I) Tinkering With Inflation: Outlook
(Part I) Tinkering With Inflation: Outlook
A recent New York Fed study on how American households used their stimulus money concluded that: “36.4% of the stimulus money was used to boost savings, 34.5% to paydown debt, 25.9% was spent on essentials and non-essentials, and finally the rest of the money (3.2%) was donated”. It is worth noting that this study also looked at the expected spending patterns for the new round of stimulus checks, and the results were generally the same. To obtain a more realistic number of how much of the net $500 billion inflow actually entered the economy, we multiply it by 25.9% (how much money was used on spending according to the NY Fed) and arrive at a better estimate of $130 billion or 0.6% of 2020 US GDP, which is by no means an astronomical number that will shatter into pieces the current deflationary megatrend. This empirical exercise demonstrated how a large percentage of the present-day stimulus is being used to counterbalance the deflationary pandemic shock. However, if our thesis of a Buenos Aires Consensus in which governments spend even outside of recessions pans out, then there will not be the aforementioned counterbalancing effect, and all the fiscal dollars will go straight to contributing to rising inflation until the deflationary megatrend is broken. Pro-Inflationary Driver #2: Demographics In the long run, inflation tends to oscillate alongside a country’s demographics. More specifically, it is the relative size of the three age cohorts (young, working-age, and old) that plays a key role in driving inflation. People who are in the working-age cohort are at their peak productivity, which implies that their contribution to the production of goods and services is greater than the demand for new credit they generate, meaning that they produce a deflationary pull. The opposite is true for the other two age cohorts (the young and the old). Neither one is contributing to the production of goods & services, while both still generate new credit in the economy (for example student loans), and the end result is an inflationary pull. Hence, it is the interplay between these three age cohorts that serves as a structural force behind inflation. To put some numbers behind this conceptual framework, we turn our attention to a paper “The enduring link between demography and inflation” written by Mikael Juselius and Előd Takáts. In the paper, the authors conduct rigorous cross-country analysis and find that indeed, people 30-60 years of age (the working-age cohort) exert deflationary pressure, while the other two cohorts contribute to rising inflation. Chart 6 plots the age-structure effect for the US against inflation. The authors also quantified that over the 40-year period (1970-2010) the increase in the working-age population (due to baby-boomers) has lowered inflationary pressures by almost five percentage points in the US (Chart 7). Meanwhile, by extrapolating the likely path of demographic data by 40 years (2010-2050), the authors observed a shift from deflationary to inflationary age pressure mainly due to the incoming increase in the proportion of the old cohort. Their estimate of the expected pull on inflation in the US will be approximately two and a half percent (Chart 8). Chart 6Demographics Are A Mighty Force
Demographics Are A Mighty Force
Demographics Are A Mighty Force
Chart 7From Deflationary...
(Part I) Tinkering With Inflation: Outlook
(Part I) Tinkering With Inflation: Outlook
Chart 8...To Inflationary
(Part I) Tinkering With Inflation: Outlook
(Part I) Tinkering With Inflation: Outlook
Going forward, US demographics will be more inflationary than deflationary. Pro-Inflationary Driver #3: De-Globalization The “apex of globalization” or “de-globalization” is our third pro-inflationary driver. We have written about this theme extensively at BCA Research and it is the mega-theme of our sister Geopolitical Strategy (GPS) service. Odds are high that countries will continue looking inward as the US sustains its aggressive trade policy, China’s trend growth slows, and US-China strategic tensions intensify. Chart 9 shows that we are at the conclusion of a period of tranquility. Pax Americana underpinned globalization as much as Pax Britannica before it. The US is in a relative decline after decades of geopolitical stability allowed countries like China to rise to “great power” status and rivals like Russia to recover from the chaos of the 1990s. Chart 9The Tide Is Turning
The Tide Is Turning
The Tide Is Turning
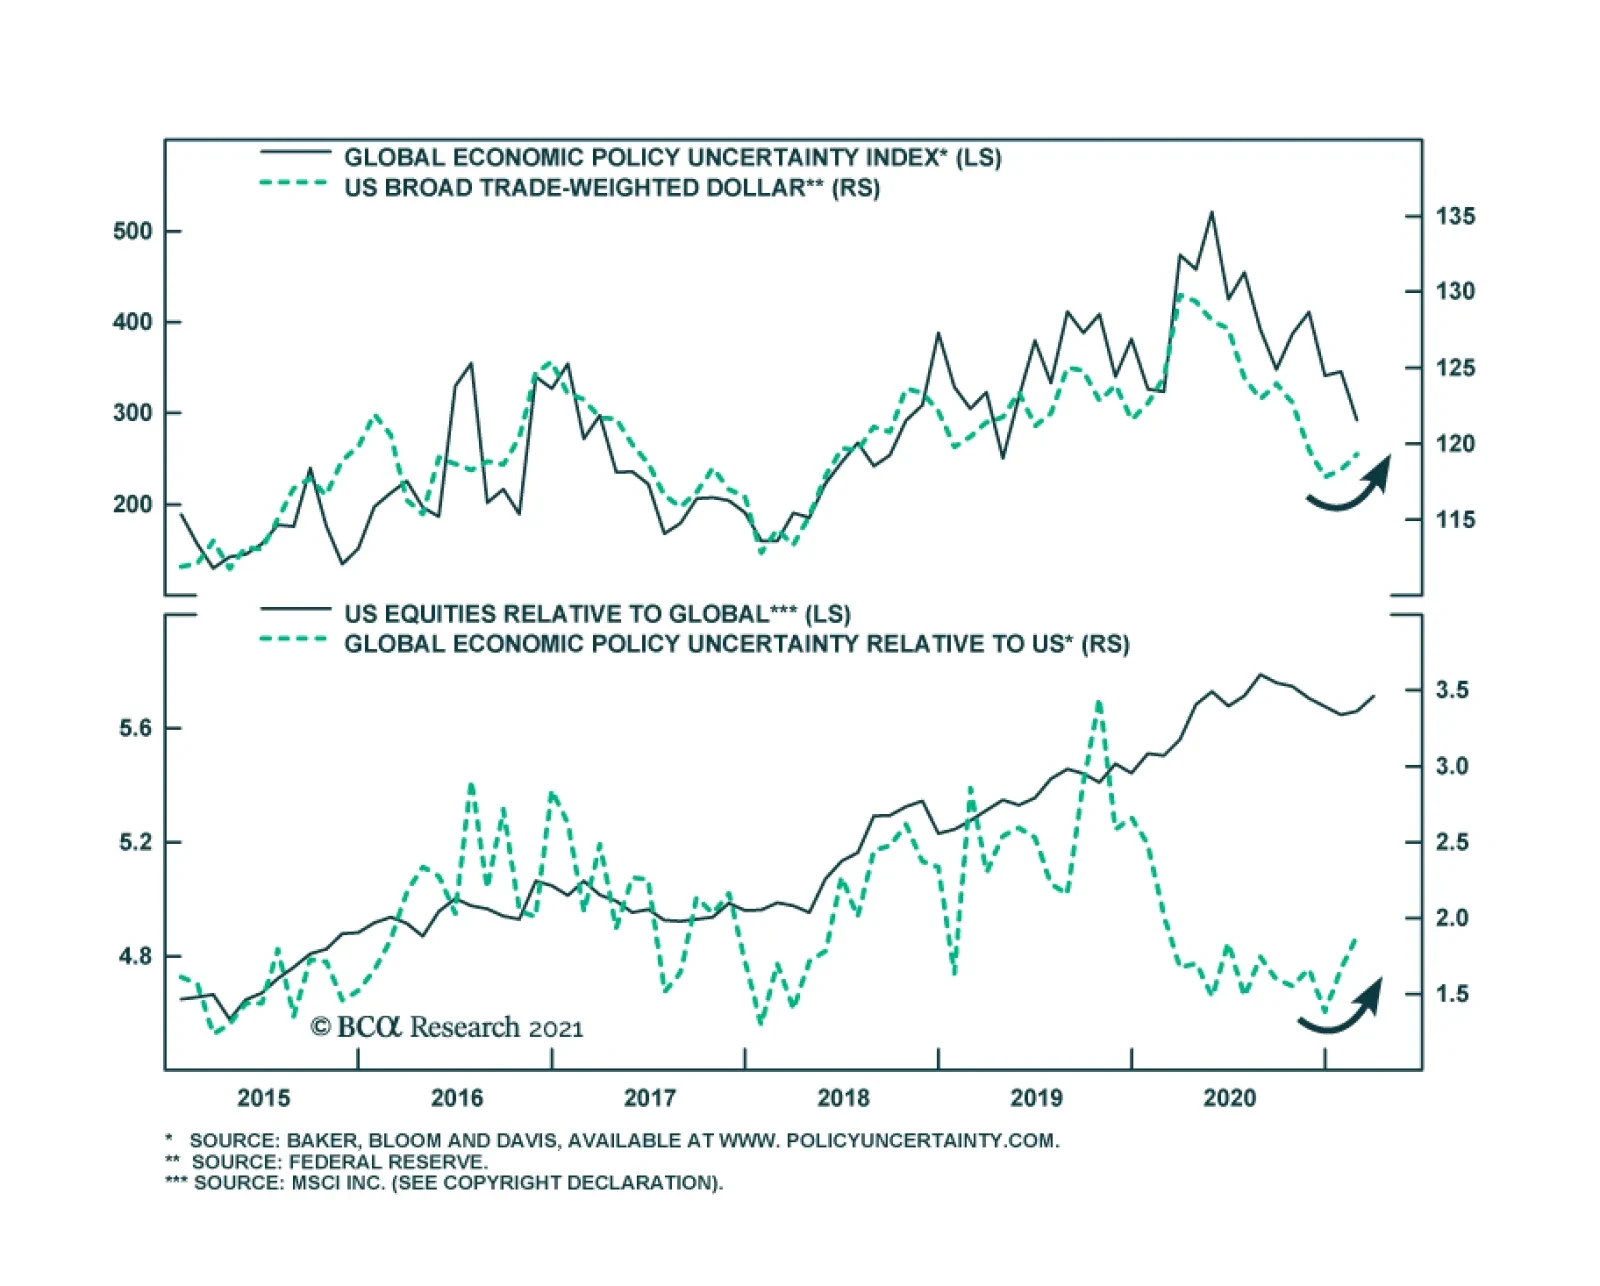
De-globalization has become the consensus since the election of Donald Trump. But Trump is not the prophet of de-globalization; he is its acolyte. And now, President Biden is continuing in Trump’s footsteps. Globalization is ending because of structural factors, not cyclical ones. And its decline was pre-written into its “source code.” Three factors stand at the center of this assessment, first outlined in a 2014 GPS Special Report, “The Apex Of Globalization – All Downhill From Here”: multipolarity, populism and protectionism. Events have since confirmed this view. The three pillars of globalization are the free movement of goods, capital, and people across national borders. We expect to see marginally less of each in the future and this should prove inflationary. Pro-Inflationary Driver #4: US Dollar Bear Market The path of least resistance is lower for the US dollar and it represents our final pro-inflationary driver. Chart 10 highlights the ebbs and flows of the trade-weighted US dollar since it floated in the early-1970s. The DXY index has moved in six-to-ten year bull and bear markets. The most recent trough was during the depths of the Great Recession, while the peak was in early-2020. If history repeats, eventually the dollar will mean revert lower in the 2020s, especially given the fiscal profligacy (Buenos Aires Consensus) of the current administration that may continue into 2024. Chart 10Time For A Downcycle?
Time For A Downcycle?
Time For A Downcycle?
True, the US dollar remains the global reserve currency, but that exorbitant privilege is clearly fraying on the edges as the balance-of-payments dynamics are heading in the wrong direction. While the US Congressional Budget Office (CBO) expects some normalization in the US budget deficit over the next 4 years since the pandemic shock will be over, looking further into the future the CBO forecasts a further reacceleration in deficit spending. Assuming a stable to grinding lower current account deficit in the next several years, the path of least resistance is lower for the currency. BCA’s US dollar model also corroborates the twin deficit message and suggests ample structural downside for the USD (Chart 11). The apex of globalization will also hurt the greenback in a reflexive manner. In a world where all the markets are integrated, borrowers in EM nations often use the reserve currency to issue liabilities at a lower cost. This boosts the demand by EM central banks for US dollar reserves to protect domestic banking systems funded in USD. Moreover, some countries like China implement pegs (both official and unofficial) to the US dollar in order to maintain their competitiveness and export their production surpluses to the US. To do so they buy US assets. If the global economy becomes more fragmented and the Sino-US relationship continues to deteriorate structurally as we expect, then these sources of demand for the dollar will recede. Overlay the widening US current account deficit, and you have the perfect recipe for a depreciating trade-weighted US dollar. Importantly, the 1970s is an interesting period to examine in more detail. As the Nixon administration floated the greenback this aggravated the inflationary pressures (Chart 12) that were building all along the 1960s when the US adopted the Mutually Assured Destruction Doctrine along with the Cold War space race that eventually saw the US landing on the moon in 1969. Chart 11A Bearish Outlook
A Bearish Outlook
A Bearish Outlook
Chart 12The Greenback In The 1970s
The Greenback In The 1970s
The Greenback In The 1970s
A lower greenback is synonymous with rising commodity and import prices and given that the US is the consumer of last resort (70% PCE), the commodity/import price pendulum will swing from a deflationary to an inflationary force. Anti-Inflationary Driver #1: Technology’s Creative Destruction Schumpeter’s “creative destruction” forces dominate technology companies in general and Silicon Valley in particular, and represent our fist anti-inflationary driver. These creative destruction forces in the tech industry are inherently deflationary. As a result, tech business models have evolved to thrive during disinflationary periods. Chart 13 shows the software sector deflator derived from national accounts, and since the mid-1980s more often than not it has been mired in deflation. US semiconductor prices, computer hardware prices, and almost any tech related category from the PCE, PPI and CPI releases looks more or less the same as software, underscoring that this is a technology sector wide modus operandi. More recently, Uber Technologies and Airbnb, to name a few, continually bring existing capacity online and that adds another layer of deflation forces at work in select industries they operate in. Tack on technology infiltrating finance and soon the extremely opaque health care services industry that comprises almost 20% of US GDP or $4tn and a deflationary impulse will likely reverberate across these large segments of the US economy that have managed to sustain high pricing power over the decades. Chart 13Technological Progress Is Deflationary
Technological Progress Is Deflationary
Technological Progress Is Deflationary
Thus, these creative destruction processes remain alive and well in tech land and will continue to exert deflationary/disinflationary pressure (of the good kind) on the US economy. Anti-Inflationary Driver #2: Income & Wealth Inequality The growing trend in income and wealth inequality is our second anti-inflationary force. We first want to focus on the issue of income inequality as it leads to wealth inequality. Income inequality refers to the distribution of wages and profits generated by the economy. It is the proverbial “share of the pie” that households from different socioeconomic brackets receive. The link with inflation comes through the marginal propensity to save statistic of those different brackets. Lower income households have nearly nonexistent propensity to save as they live paycheck to paycheck. Therefore, any additional income inflow they receive gets immediately syphoned into the real economy. In contrast, the top 10% have a high propensity to save as all of their living expenses are well covered, so any additional income they receive is stashed away into savings and does not enter the real economy. This is why following the Trump’s tax cut that benefitted the top 10% there has not been a durable spike in CPI inflation. The fact that in the US the income share of the top 10% is growing at stratospheric rates at the same as time as the bottom 90% are struggling to cover even a $400 unexpected expense needs no introduction. The exact reasons as to why that happened would require a separate Special Report, but one of the main reasons is the multi-decade suppression of unions, which does not allow employees to bargain effectively for a larger slice of corporate profits. Given that profits are an exact mirror image of labor expenses, it is not surprising that the union movement is being marginalized (Charts 14 & 15). Staying on the topic of inflation, as we already outlined, when the lower and medium socioeconomic brackets receive more income, it does not disappear in the savings accounts, but instead it is redirected into the real economy causing a healthy inflationary uptick. Chart 14No Power = No Money
No Power = No Money
No Power = No Money
Chart 15The Tug Of War
The Tug Of War
The Tug Of War
Chart 16 shows the wealth share of the top 10% of American households on inverted scale. Since the 1920s, inflation and the wealth share of the top 10% has moved in opposite directions. There were two distinct periods when the wealth share of the bottom 90% rose: from the early 1930s until the early 1950s, and from the mid-1960s until the mid-1980s. Both of these periods were accompanied by rising CPI inflation. Chart 16Wealth Equality Is Inflationary
Wealth Equality Is Inflationary
Wealth Equality Is Inflationary
At the same time, when looking at any other period outside of those golden days for the bottom 90%, US inflation was anemic. This empirical evidence further underscores the importance of income and wealth distribution in the economy, and given the current US political and economic realities, we do not expect any material changes in labor dynamics to take root. The top 10% will continue benefitting at the expense of the bottom 90%, which will keep US CPI inflation suppressed. Concluding Thoughts In this Special Report our goal was to look beyond the already known medium term inflation outlook, and present both sides of the argument about the long-term inflation trend. We took a deep dive into six structural forces behind inflation that we identified. Four of those forces were pro-inflationary, while the remaining two were anti-inflationary (Table 2). We also assigned a value on our subjective strength scale for each force. Each value incorporates how quickly a particular force will come to fruition, and how strong it will be over the next 5-to-10 year period. Based on our analysis, we conclude that there are rising odds that the deflationary megatrend has run its course and has reached an inflection point of turning inflationary. Table 2Inflation Dots
(Part I) Tinkering With Inflation: Outlook
(Part I) Tinkering With Inflation: Outlook
In the next Special Report from our Tinkering With Inflation series, we will conduct a thought experiment and explore a world in which our forecasts prove to be accurate, and a new inflationary paradigm engulfs the US economy. Under such a backdrop what will the US equity sector winners and losers, especially given the related shift in the stock-to-bond correlation? Stay tuned. Arseniy Urazov Research Associate ArseniyU@bcaresearch.com Footnotes 1 Buenos Aires Consensus is our catchall term for everything that is opposite of the Washington Consensus: less globalization, fiscal stimulus as far as the eyes can see, erosion of central bank independence, and a dirigiste (as opposed to laissez-faire) approach to economics that seeks to protect “state champions,” stifles innovation, and ultimately curbs productivity growth.
Highlights Global manufacturing activity will soon peak due to growing costs and China’s policy tightening. This process will allow the dollar’s rebound to continue. EUR/USD’s correction will run further. This pullback in the euro is creating an attractive buying opportunity for investors with a 12- to 24-month investment horizon. Eurozone banks will continue to trade in unison with the euro. Feature The correction in the euro has further to run. The dollar currently benefits from widening real interest differentials, but a growing list of headwinds will cause a temporary setback for the global manufacturing sector, which will fuel the greenback rally further. Nonetheless, EUR/USD will stabilize between 1.15 and 1.12, after which it will begin a new major up-leg. Consequently, investors with a 12- to 24-month investment horizon should use the current softness to allocate more funds to the common currency. A Hiccup In Global Industrial Activity Global manufacturing activity is set to decelerate on a sequential basis and the Global Manufacturing PMI will soon peak. The first problem for the global manufacturing sector is the emergence of financial headwinds. The sharp rebound in growth in the second half of 2020 and the optimism created by last year’s vaccine breakthrough as well as the rising tide of US fiscal stimulus have pushed US bond yields and oil prices up sharply. These financial market moves are creating a “growth tax” that will bite soon. Mounting US interest rates have lifted global borrowing costs while the doubling in Brent prices has increased the costs of production and created a small squeeze on oil consumers. Thus, even if the dollar remains well below its March 2020 peak, our Growth Tax Indicator (which incorporates yields, oil prices and the US dollar) warns of an imminent top in the US ISM Manufacturing and the Global Manufacturing PMI (Chart 1). Already, the BCA Global Leading Economic Indicator diffusion index has dipped below the 50% line, which usually ushers in downshifts in global growth. A deceleration in China’s economy constitutes another problem for the global manufacturing cycle. Last year’s reflation-fueled rebound in Chinese economic activity was an important catalyst to the global trade and manufacturing recovery. However, according to BCA Research’s Emerging Market Strategy service, Beijing is now tightening policy, concerned by a build-up in debt and excesses in the real estate sector. Already, the PBoC’s liquidity withdrawals are resulting in a decline of commercial bank excess reserves, which foreshadows a slowing of China’s credit impulse (Chart 2). Chart 1The Global Growth Tax Will Bite
The Global Growth Tax Will Bite
The Global Growth Tax Will Bite
Chart 2Chinese Credit Will Slow
Chinese Credit Will Slow
Chinese Credit Will Slow
In addition to liquidity withdrawals, Chinese policymakers are also tightening the regulatory environment to tackle excessive debt buildups and real estate speculation. The crackdown on property developers and house purchases will cause construction activity to shrink in the second half of 2021. Meanwhile, tougher rules for both non-bank lenders and the asset management divisions of banks will further harm credit creation. BCA’s Chief EM strategist, Arthur Budaghyan, notes that consumer credit is already slowing. Chinese fiscal policy is unlikely to create a counterweight to the deteriorating credit impulse. China’s fiscal impulse will be slightly negative next year. Chinese financial markets are factoring in these headwinds, and on-shore small cap equities are trying to break down while Chinese equities are significantly underperforming global benchmarks. Chart 3Deteriorating Surprises
Deteriorating Surprises
Deteriorating Surprises
Bottom Line: The combined assault from the rising “growth tax” and China’s policy tightening is leaving its mark. Economic surprises in the US, the Eurozone, EM and China have all decelerated markedly (Chart 3), which the currency market echoes. Some of the most pro-cyclical currencies in the G-10 are suffering, with the SEK falling relative to the EUR and the NZD and AUD both experiencing varying degrees of weakness. The Euro Correction Will Run Further… Until now, the euro’s decline mostly reflects the rise in US interest rate differentials; however, the coming hiccup in the global manufacturing cycle is causing a second down leg for the euro. First, the global economic environment remains consistent with more near-term dollar upside, due to: Chart 4Commodities Are Vulnerable
Commodities Are Vulnerable
Commodities Are Vulnerable
A commodity correction that will feed the dollar’s rebound. Aggregate speculator positioning and our Composite Technical Indicator show that commodity prices are technically overextended (Chart 4). With this backdrop, the coming deceleration in Chinese economic activity is likely to catalyze a significant pullback in natural resources, which will hurt rates of returns outside the US and therefore, flatter the dollar. The dollar’s counter-cyclicality. The expected pullback in the Global Manufacturing PMI is consistent with a stronger greenback (Chart 5). The dollar’s momentum behavior. Among G-10 FX, the dollar responds most strongly to the momentum factor (Chart 6). Thus, the likelihood is high that the dollar’s recent rebound will persist, especially because our FX team’s Dollar Capitulation Index has only recovered to neutral from oversold levels and normally peaks in overbought territory. Chart 5The Greenback's Counter-Cyclicality
The Greenback's Counter-Cyclicality
The Greenback's Counter-Cyclicality
Chart 6The Dollar Is A High Momentum Currency
The Euro Dance: One Step Back, Two Steps Forward
The Euro Dance: One Step Back, Two Steps Forward
Second, the euro’s specific dynamics remain negative for now. Based on our short-term valuation model, the fair value of EUR/USD has downshifted back to 1.1, which leaves the euro 7% overvalued (Chart 7). Until now, real interest rate differentials and the steepening of the US yield curve relative to Germany’s have driven the decline in the fair value estimate. However, the deceleration in global growth also hurts the euro’s fair value because the US is less exposed than the Eurozone to the global manufacturing cycle. Chart 7The Euro's Short-Term Fair Value Is At 1.1
The Euro's Short-Term Fair Value Is At 1.1
The Euro's Short-Term Fair Value Is At 1.1
Chart 8Speculators Have Not Capitulated
Speculators Have Not Capitulated
Speculators Have Not Capitulated
The euro is also technically vulnerable, similar to commodities. Speculators are still massively net long EUR/USD and the large pool of long bets in the euro suggests that a capitulation has yet to take place (Chart 8). The euro responds very negatively to a weak Chinese economy. The Eurozone has deeper economic ties with China than the US. Exports to China account for 1.7% of the euro area’s GDP, and 2.8% of Germany’s compared to US exports to China at 0.5% of GDP. Indirect financial links are also larger. Credit to EM accounts for 45% of the Eurozone’s GDP compared to 5% for the US. Thus, the negative impact of a Chinese slowdown on EM growth has greater spillovers on European than on US ones rates of returns. A weak CNY and sagging Chinese capital markets harm the euro. The euro’s rebound from 1.064 on March 23 2020 to 1.178 did not reflect sudden inflows into European fixed-income markets. Instead, the money that previously sought higher interest rates in the US left that country for EM bonds and China’s on-shore fixed-income markets, the last major economies with attractive yields. These outflows from the US to China and EM pushed the dollar down, which arithmetically helped the euro. Thus, the recent EUR/USD correlates closely with Sino/US interest rate and with the yuan because the euro’s strength reflects the dollar demise (Chart 9). Consequently, a decelerating Chinese economy will also hurt EUR/USD via fixed-income market linkages. Finally, the euro will depreciate further if global cyclical stocks correct relative to defensive equities. Deep cyclicals (financials, consumer discretionary, energy, materials and industrials) represent 59% of the Eurozone MSCI benchmark versus 36% of the US index. Cyclical equities are exceptionally overbought and expensive relative to defensive names. They are also very levered to the global business cycle and Chinese imports. In this context, the expected deterioration in both China’s economic activity and the Global Manufacturing PMI could cause a temporary but meaningful pullback in the cyclicals-to-defensives ratio and precipitate equity outflows from Europe into the US (Chart 10). Chart 9EUR/USD And Chinese Rates
EUR/USD And Chinese Rates
EUR/USD And Chinese Rates
Chart 10EUR/USD Will Follow Cyclicals/Defensives
EUR/USD Will Follow Cyclicals/Defensives
EUR/USD Will Follow Cyclicals/Defensives
Bottom Line: A peak in the global manufacturing PMI will hurt the euro, especially because China will meaningfully contribute to this deceleration in global industrial activity. Thus, the euro’s pullback has further to run. An important resistance stands at 1.15. A failure to hold will invite a rapid decline to EUR/USD 1.12. Nonetheless, the euro’s depreciation constitutes nothing more than a temporary pullback. … But The Long-Term Bull Market Is Intact We recommend buying EUR/USD on its current dip because the underpinnings of its cyclical bull market are intact. Chart 11Investors Structurally Underweight Europe
Investors Structurally Underweight Europe
Investors Structurally Underweight Europe
First, investors are positioned for a long-term economic underperformance of the euro area relative to the US. The depressed level of portfolio inflows into Europe relative to the US indicates that investors already underweight European assets (Chart 11). This pre-existing positioning limits the negative impact on the euro of the current decrease in European growth expectations (Chart 11, bottom panel). Second, as we wrote last week, European growth is set to accelerate significantly this summer. Considering the absence of ebullient investor expectations toward the euro, this process can easily create upside economic surprises later this year, especially when compared to the US. Moreover, the deceleration in Chinese and global growth will most likely be temporary, which will limit the duration of their negative impact on Europe. Third, the US stimulus measure will create negative distortions for the US dollar. The addition of another long-term stimulus package of $2 trillion to $4 trillion to the $7 trillion already spent by Washington during the crisis implies that the US government deficit will not narrow as quickly as US private savings will decline. Therefore, the US current account deficit will widen from its current level of 3.5% of GDP. As a corollary, the US twin deficit will remain large. Meanwhile, the Fed is unlikely to increase real interest rates meaningfully in the coming two years because it believes any surge in inflation this year will be temporary. Furthermore, the FOMC aims to achieve inclusive growth (i.e. an overheated labor market). This policy combination forcefully points toward greater dollar weakness. The US policy mix looks particularly dollar bearish when compared to that of the Eurozone. To begin with, the balance of payment dynamics make the euro more resilient. The euro area benefits from the underpinning of a current account surplus of 1.9% of GDP. Moreover, the European basic balance of payments stands at 1.5% of GDP compared to a 3.6% deficit for the US. Additionally, FDI into Europe are rising relative to the US. The divergence in the FDI trends will continue due to the high probability that the Biden administration will soon increase corporate taxes. Chart 12The DEM In The 70s
The DEM In The 70s
The DEM In The 70s
The combination of faster vaccine penetration and much larger fiscal stimulus means that the US economy will overheat faster than Europe’s. Because the Fed seems willing to tolerate higher inflation readings, US CPI will rise relative to the Eurozone. In the 1970s, too-easy policy in Washington meant that the gap between US and German inflation rose. Despite the widening of interest rate and growth differentials in favor of the USD or the rise in German relative unemployment, the higher US inflation dominated currency fluctuations and the deutschemark appreciated (Chart 12). A similar scenario is afoot in the coming years, especially in light of the euro bullish relative balance of payments. Fourth, valuations constitute an additional buttress behind the long-term performance of the euro. Our FX strategy team Purchasing Power Parity model adjusts for the different composition of price indices in the US and the euro area. Based on this metric, the euro is trading at a significant 13% discount from its long-term fair value, with the latter being on an upward trend (Chart 13). Furthermore, BCA’s Behavioral Exchange Rate Model for the trade-weighted euro is also pointing up, which historically augurs well for the common currency. Lastly, even if the ECB’s broad trade-weighted index stands near an all-time high, European financial conditions remain very easy. This bifurcation suggests that the euro is not yet a major hurdle for the continent and can enjoy more upside (Chart 14). Chart 13EUR/USD Trades Well Below Long-Term Fair Value
EUR/USD Trades Well Below Long-Term Fair Value
EUR/USD Trades Well Below Long-Term Fair Value
Chart 14Easy European Financial Conditions
Easy European Financial Conditions
Easy European Financial Conditions
Chart 15Make Room For the Euro!
Make Room For the Euro!
Make Room For the Euro!
Finally, the euro will remain a beneficiary from reserve diversification away from the USD. The dollar’s status as the premier reserve currency is unchallenged. However, its share of global reserves has scope to decline while the euro’s proportion could move back to the levels enjoyed by legacy European currencies in the early 1990s (Chart 15). Large reserve holders will continue to move away from the dollar. BCA Research’s Geopolitical Strategy team argues that US tensions with China transcend the Trump presidency. Meanwhile, the current administration’s relationship with Russia and Saudi Arabia will be cold. For now, their main alternative to the dollar is the euro because of its liquidity. Moreover, the NGEU stimulus program creates an embryonic mechanism to share fiscal risk within the euro area. The Eurozone is therefore finally trying to evolve away from a monetary union bereft of a fiscal union. This process points toward a lower probability of a break up, which makes the euro more attractive to reserve managers. Bottom Line: Despite potent near-term headwinds, the euro’s long-term outlook remains bright. Global investors already underweight European assets, yet balance of payment and policy dynamics point toward a higher euro. Moreover, valuations and geopolitical developments reinforce the cyclical tailwinds behind EUR/USD. Thus, investors with a 12- to 24-month investment horizon should use the current euro correction to gain exposure to the European currencies. Any move in EUR/USD below 1.15 will generate a strong buy signal. Sector Focus: European Banks And The Istanbul Shake The recent decline in euro area bank stocks coincides with the 14% increase in USD/TRY and the 17% decline in the TUR Turkish equities ETF following the sacking of Naci Ağbal, the CBRT governor. President Erdogan is prioritizing growth over economic stability because his AKP party is polling poorly ahead of the 2023 election. The Turkish economy is already overheating, and the lack of independence of the CBRT under the leadership of Şahap Kavcıoğlu promises a substantial increase in Turkish inflation, which already stands at 16%. Hence, foreign investors will flee this market, creating further downward pressures on the lira and Turkish assets. European banks have a meaningful exposure to Turkey. Turkish assets account for 3% of Spanish bank assets or 28% of Tier-1 capital. For France, this exposure amounts to 0.7% and 5% respectively, and for the UK, it reaches 0.3% and 2%. As a comparison, claims on Turkey only represent 0.3% and 0.5% of the assets and Tier-1 capital of US banks. Unsurprisingly, fluctuations in the Turkish lira have had a significant impact one the share prices of European banks in recent years, even after controlling for EPS and domestic yield fluctuations (Table 1). Table 1TRY Is Important To European Banks…
The Euro Dance: One Step Back, Two Steps Forward
The Euro Dance: One Step Back, Two Steps Forward
Nonetheless, today’s TRY fluctuations are unlikely to have the same lasting impact on European banks share prices as they did from 2017 to 2019 because European banks have already shed significant amounts of Turkish assets (Chart 16). This does not mean that European banks are out of the woods yet. The level of European yields remains a key determinant of the profitability of Eurozone’s banks, and thus, of their share prices (Chart 17, top panel). Moreover, the euro still tightly correlates with European bank stocks as well (Chart 17, bottom panel). As a result, our view that the global manufacturing cycle will experience a temporary downshift and the consequent downside in EUR/USD both warn of further underperformance of European banks. Chart 16… But Less Than It Once Was
The Euro Dance: One Step Back, Two Steps Forward
The Euro Dance: One Step Back, Two Steps Forward
Chart 17Higher Yields And A stronger Euro, These Are Few Of My Favorite Things
Higher Yields And A stronger Euro, These Are Few Of My Favorite Things
Higher Yields And A stronger Euro, These Are Few Of My Favorite Things
These same views also suggest that this decline in bank prices is creating a buying opportunity. Ultimately, we remain cyclically bullish on the euro and the transitory nature of the manufacturing slowdown implies that global yields will resume their ascent. The cheap valuations of European banks, which trade at 0.6-times book value, make them option-like vehicles to bet on these trends, even if the banking sectors long-term prospects are murky. Moreover, they are a play on Europe’s domestic recovery this summer. We will explore banks in greater detail in future reports. Mathieu Savary, Chief European Investment Strategist Mathieu@bcaresearch.com Cyclical Recommendations Structural Recommendations Closed Trades Currency Performance
The Euro Dance: One Step Back, Two Steps Forward
The Euro Dance: One Step Back, Two Steps Forward
Fixed Income Performance Government Bonds
The Euro Dance: One Step Back, Two Steps Forward
The Euro Dance: One Step Back, Two Steps Forward
Corporate Bonds
The Euro Dance: One Step Back, Two Steps Forward
The Euro Dance: One Step Back, Two Steps Forward
Equity Performance Major Stock Indices
The Euro Dance: One Step Back, Two Steps Forward
The Euro Dance: One Step Back, Two Steps Forward
Geographic Performance
The Euro Dance: One Step Back, Two Steps Forward
The Euro Dance: One Step Back, Two Steps Forward
Sector Performance
The Euro Dance: One Step Back, Two Steps Forward
The Euro Dance: One Step Back, Two Steps Forward
According to BCA Research’s Geopolitical Strategy service, there are signs that policy uncertainty and geopolitical risk will revive. The decline in global policy uncertainty and geopolitical risk that attended the US election and COVID-19 vaccine…
As expected, February’s US Personal Income and Outlays report was significantly weaker than the prior month. Personal income fell 7.1% m/m following a stimulus-driven 10.1% m/m jump in January. The income shortfall was passed through to Personal Spending…
On Thursday, the Fed made officials plans to remove pandemic-era restrictions on dividends and share buybacks for banks that clear stress tests at the end of June. As suggested by the relatively modest gains since the announcement, the news was mostly priced…
Optimistic sell-side analysts’ forward earnings forecasts are rebalancing the market’s return away from multiple expansion and toward an earnings-led explanation. But, with expectations still sitting at extremes, even a minor setback can result a significant drawdown, especially in the absence of a valuation cushion. Chart 1 shows the difference between forward and trailing earnings growth and represents another yellow flag. Chart 2 on the next page zooms into each of the circled periods and reveals that 3/4 iterations resulted into an outright bear market in the SPX, while the one in 2009 was followed by a swift 10% correction in a matter of two months. To be clear, we are not calling for a bear market, nor did Chart 1 cause those bear markets, but just like an inverted yield curve reflects that the overall economy is susceptible to an external shock, this earnings surprise factor works in a similar way and signals that any mishap can result into a sizable drawdown. Bottom Line: Near-term caution is warranted in the prospects of the broad equity market, and we reiterate our long VIX June futures hedge that got triggered intraday on Monday just below the 25 mark. Chart 1
Beware Excessive Profit Optimism
Beware Excessive Profit Optimism
Chart 2
Beware Excessive Profit Optimism
Beware Excessive Profit Optimism
Highlights Biden’s policy on China is hawkish so far, as expected, but temporary improvement is possible. We are cyclically bearish on the dollar but are taking a neutral tactical stance as the greenback’s bounce could go higher than expected if US-China relations take another downward dive. US-Iran tensions are on track to escalate in the second quarter as the pressure builds toward what we think will be a third quarter restoration of the 2015 nuclear deal. Oil price volatility is the takeaway. The anticipated US-Russia conflict has emerged and will bring negative surprises, especially for Russian and emerging European markets. Europe still enjoys relative political stability. A German election upset would bring upside risk to the euro and bund yields, while Scottish independence risk is contained for now. In this report we are launching the first in a new series of regular quarterly outlook reports that will supplement our annual Geopolitical Strategy strategic outlook. Feature The decline in global policy uncertainty and geopolitical risk that attended the US election and COVID-19 vaccine discovery has largely played out. Global investors have witnessed successful vaccine rollouts in the US and UK and can look forward to other countries, namely the EU-27, catching up. They have witnessed a splurge of US fiscal spending – $2.8 trillion since December – unprecedented in peacetime. And they have seen the Chinese government offer assurances that monetary tightening will not undermine the economic recovery. The risk of the US doubling down on belligerent trade protectionism has fallen by the wayside along with the Trump presidency. Going forward, there are signs that policy uncertainty and geopolitical risk will revive. First, as the global semiconductor shortage and Suez Canal blockage highlight, the world economy will sputter and strain at the sudden eruption of economic activity as the pandemic subsides and vast government spending takes effect. Financial instability is a likely consequence of the sudden, simultaneous adoption of debt monetization across a range of economies combined with a global high-tech race and energy overhaul. Second, the defeat of the Trump presidency does not reverse the secular increase in geopolitical tensions arising from America’s internal divisions and weakening hand relative to China, Russia, and others. On the contrary, large monetary and fiscal stimulus lowers the economic costs of conflict and encourages autarkic, self-sufficiency policies that make governments more likely to struggle with each other to secure their supply chains. Chart 1AThe Return Of Geopolitical Risk
The Return Of Geopolitical Risk
The Return Of Geopolitical Risk
Chart 1BThe Return Of Geopolitical Risk
The Return Of Geopolitical Risk
The Return Of Geopolitical Risk
If we look at simple, crude measures of geopolitical risk we can see the market awakening to the new wall of worry for this business cycle – Great Power struggle, the persistence of “America First” with a different figurehead, China policy tightening, and a vacuum of European leadership. The US dollar is rising, developed market equities are outperforming emerging markets, safe-haven currencies are ticking up against commodity currencies, and gold is perking back up (Charts 1A & 1B). The cyclical upswing should reverse most of these trends over the medium term but investors should be cautious in the short term. US Stimulus, Chinese Tightening, And The Greenback The US remains the world’s preponderant power despite its political dysfunction and economic decline relative to emerging markets. The US has struggled to formulate a coherent way to deal with declining influence, as shown by dramatic policy reversals toward Iraq, Iran, China, and Russia. The pattern of unpredictability will continue. The Biden administration’s longevity is unknown so foreign states will be cautious of making firm commitments, implementing deals, or taking irrevocable actions. This does not mean the Biden administration will have a small impact – far from it. Biden’s national policy seeks to fire up the American economy, refurbish alliances, export liberal democratic ideology, and compete with China and Russia. The firing up is largely already accomplished – the American Rescue Plan Act (ARPA) and Biden’s forthcoming “Build Back Better” proposals will ultimately rank with Johnson’s Great Society. The Fed estimates that US GDP growth will hit 6.5% this year, higher than the consensus of economic forecasts estimates 5.5%, driven by giant government pump-priming (Chart 2). The US, which is already an insulated economy, is virtually inured to foreign shocks for the time being. Chart 2US Injects Steroids
Second Quarter Outlook 2021: Geopolitics Upsets The "Return To Normalcy"
Second Quarter Outlook 2021: Geopolitics Upsets The "Return To Normalcy"
Next comes the courting of allies to form a united democratic front against the world’s ambitious dictatorships. This process will be very difficult as the allies are averse to taking risks, especially on behalf of an erratic America. Chart 3US Stimulus Briefly Halts Decline In Global Economic Share
Second Quarter Outlook 2021: Geopolitics Upsets The "Return To Normalcy"
Second Quarter Outlook 2021: Geopolitics Upsets The "Return To Normalcy"
The Obama administration spent six full years creating a coalition to pressure an economically miniscule Iran into signing the 2015 nuclear deal. Imagine how long it will take Biden to convince the EU-27 and small Asian states to stick their necks out against Xi Jinping’s China. Especially if they suspect that the US’s purpose is to force China to open its doors primarily for the Americans. If the US grows at the rate of consensus forecasts then its share of global GDP will be 17.6% by 2025 (Chart 3). However, the US’s decline should not be exaggerated. Consider the lesson of the past year, in which the US seemed to flounder in the face of the pandemic. The US’s death count, on a population basis, was in line with other developed markets and yet its citizens exercised a greater degree of individual freedom. It maintained the rule of law despite extreme polarization, social unrest, and a controversial election. Its development of mRNA vaccines highlighted its ongoing innovation edge. And it has rolled out the vaccines rapidly. Internal divisions are still extreme and likely to produce social instability (we are still in the zone of “peak polarization”). But the US economic foundation is now fundamentally supported – political collapse is improbable. Chart 4US Vs China: The Stimulus Impulse
US Vs China: The Stimulus Impulse
US Vs China: The Stimulus Impulse
In short, the US saw the “Civil War Lite” and has moved onto “Reconstruction Lite,” with a big expansion of the social safety net and infrastructure as well as taxes already being drafted. Meanwhile General Secretary Xi has managed to steer China into a good position for the much-ballyhooed 100th anniversary of the Communist Party on July 1. His administration is tightening monetary and fiscal policy marginally to resume the fight against systemic financial risk. China faces vast socioeconomic imbalances that, if left unattended, could eventually overturn the Communist Party’s rule. So far the tightening of policy is modest but the risk of a policy mistake is non-negligible and something global financial markets will have to grapple with in the second quarter. Comparing the US and China reveals an impending divergence in relative monetary and fiscal stimulus (Chart 4). China’s money and credit impulse is peaking – some signs of economic deceleration are popping up – even as the US lets loose a deluge of liquidity and pump-priming. The result is that the world is likely to experience waning Chinese demand and waxing US demand in the second half of the year. It is almost the mirror image of 2009-10, when China’s economy skyrocketed on a stimulus splurge while the US recovered more slowly with less policy support. The medium-to-long-run implication is that the US will have a bumpy downhill ride over the coming decade whereas China will recover more smoothly. Yet the analogy only goes so far. The structural transition facing China’s society and economy is severe and US-led international pressure on its economy will make it more severe. The short-run implication – for Q2 2021 – is that the US dollar’s bounce could run longer than consensus expects. Commodity prices, commodity currencies, and emerging market assets face a correction from very toppy levels. The global cyclical upswing will continue as long as China avoids a policy mistake of overtightening as we expect but the near-term is fraught with downside risk. Bottom Line: We are neutral on the dollar from a tactical point of view. While our bias is to expect the dollar to relapse, in line with the BCA House View and our Foreign Exchange Strategy, we are loathe to bet against the greenback given US stimulus and Chinese tightening. This is not to mention geopolitical tensions highlighted below that would reinforce the dollar. Biden’s China Policy And The Semiconductor Shortage Any spike in US-China strategic tensions in Q2 would exacerbate the above reasoning on the dollar. It would also lead to a deeper selloff in Chinese and EM Asian currencies and risk assets. A spike in tensions is not guaranteed but investors should plan for the worst. One of our core views for many years has been that any Democratic administration taking office in 2020 would remain hawkish on China, albeit less so than the Trump administration. So far this view is holding up. It may not have been the cause of the drop in Chinese and emerging Asian equities but it has not helped. However, the jury is still out on Biden’s China policy and the second quarter will likely see major actions that crystallize the relative hawkish or dovish change in policy. The acrimonious US-China meeting in Alaska meeting does not necessarily mean anything. The Biden administration has a full China policy review underway that will not be completed until around early June. The first bilateral summit between Biden and Xi could occur on Earth Day, April 22, or sometime thereafter, as the countries are looking to restart strategic dialogue and engage on nuclear non-proliferation and carbon emission reductions. Specifically China wants to swap its help on North Korea – which restarted ballistic missile launches as we go to press – for easier US policies on trade and tech. Only if and when a new attempt at engagement breaks down will the Biden administration conclude that it has a basis for pursuing a more offensive policy toward China. The problem is that new engagement probably will break down, sooner or later, for reasons we outlined last week: the areas of cooperation are limited – obviously so on health and cybersecurity, but even on climate change. Engagement on Iran and North Korea may have more success but the bigger conflicts over tech and Taiwan will persist. Ultimately China is fixated on strategic self-sufficiency and rapid tech acquisition in the national interest, leaving little room for US market access or removal of high-tech export controls. The threat that Biden will ultimately adopt and expand on Trump’s punitive measures will hang over Beijing’s head. The risk of a Republican victory in 2024 will also discourage China from implementing any deep structural concessions. The crux of the conflict remains the tech sector and specifically semiconductors.1 China is rapidly gaining market share but the US is using its immense leverage over chip design and equipment to cut off China’s access to chips and industry development. The ongoing threat of an American chip blockade is now being exacerbated by a global shortage of semiconductors as the economy recovers (Chart 5), exposing China’s long-term economic vulnerability. Chart 5Global Semiconductor Shortage
Global Semiconductor Shortage
Global Semiconductor Shortage
There is room for some de-escalation but not much – and it is not to be counted on. The Biden administration, like the Obama administration, subscribes to the view that the US should prioritize maintaining its lead in tech innovation rather than trying to compete with China’s high-subsidy model, which is gobbling up the lower end of the computer chip market. Biden’s policy will at first be defensive rather than offensive – focused on improving US supply chain security rather than curtailing Chinese supply. Biden’s proposal for domestic infrastructure program will include funds for the semiconductor industry and research. While the Biden administration likely prizes leadership and innovation over the on-shoring of US chip production, the US government must also look to supply security, specifically for the military, so some on-shoring of production is inevitable.2 Ultimately the Biden administration can continue using export controls to slow China’s semiconductor development or it can pare these controls back. If it does nothing then China’s state-backed tech program will lead to a rapid increase in Chinese capabilities and market share as has occurred in other industries. If it maintains restrictions then it will delay China’s development, especially on the highest end of chips, but not prevent China from gaining the technology through circumventing export controls, subsidizing its domestic industry, and poaching from Taiwan and South Korea. Given that technological supremacy will lead to military supremacy the US is likely to maintain restrictions. But a full chip blockade on China would require expanding controls and enforcing them on third parties, and massively increases strategic tensions, should Biden ever decide to go this ultra-hawkish route. The Biden administration can adjust the pace and intensity of export controls but cannot give China free rein. Biden will want to block China’s access to the US market, or funds, or parts when these feed its military-industrial complex but relax pressure on China’s commercial trade. This is only a temporary fix. The commercial/military distinction is hard to draw when Beijing continually pursues “civil-military fusion” to maximize its industrial and strategic capabilities. Therefore US-China strategic tensions over tech will worsen over the long run even if Biden pursues engagement in the short run. Bottom Line: Biden’s China policy has started out hawkish as expected but the real policy remains unknown. The second quarter will reveal key details. Biden could pursue engagement, leading to a reduction in tensions. Investors should wait and see rather than bet on de-escalation, given that tensions will escalate anew over the medium and long term and therefore may never really decline. Iran And Oil Price Volatility Biden’s other foreign policy challenges in the second quarter hinge on Iran and Russia. The Biden administration aims to restore the 2015 Iranian nuclear deal and is likely to move quickly. This is not merely a matter of intention but of national capability since US grand strategy is pushing the US to shift focus to Asia Pacific, and an Iranian nuclear crisis divides US attention and resources. Biden has the ability to return to the 2015 deal with a flick of his wrist. The Iranians also have that ability, at least until lame duck President Hassan Rouhani leaves office in August – beyond that, a much longer negotiation would be necessary. US-Iran talks will lead to demonstrations of credible military threats, which means that geopolitical attacks and tensions in the Middle East will likely go higher before they fall on any deal. The past several years have already seen a series of displays of military force by the Iranians and the US and its allies and this process may escalate all summer (Map 1). Map 1Military Incidents In Persian Gulf Since Abqaiq Refinery Attack, 2019
Second Quarter Outlook 2021: Geopolitics Upsets The "Return To Normalcy"
Second Quarter Outlook 2021: Geopolitics Upsets The "Return To Normalcy"
It is too soon to draw conclusions regarding the Israeli election on March 23 but it is possible that Prime Minister Benjamin Netanyahu will remain in power (Chart 6). If this is the case then Israel will oppose the American effort to rejoin the Iranian nuclear deal, culminating in a crisis sometime in the summer (or fall) in which the Israelis make a major show of force against Iran. Even if Netanyahu falls from power, the new Israeli government will still have to show Iran that it cannot be pushed around. Fundamentally, however, a change in leadership in Israel would bring the US and Israel into alignment and thus smooth the process for a deal that seeks to contain Iran’s nuclear program at least through 2025. Any better deal would require an entirely new diplomatic effort. Chart 6Israeli Ruling Coalition Share Of Knesset Shares In Recent Elections
Second Quarter Outlook 2021: Geopolitics Upsets The "Return To Normalcy"
Second Quarter Outlook 2021: Geopolitics Upsets The "Return To Normalcy"
The Russians or Saudi Arabians might reduce their oil production discipline once a deal becomes inevitable, so as not to lose market share to Iranian oil that will come back onto global markets. Thus oil markets could face unexpected oil supply outages due to conflict followed by OPEC or Iranian supply increases, implying that prices will be volatile. Our Commodity & Energy Strategy expects prices to average $65/barrel in 2021, $70/barrel in 2022, and $60-$80/barrel through 2025. Bottom Line: Oil prices will be volatile in the second quarter as they may be affected by the twists and turns of US-Iran negotiations, which may not reach a new equilibrium until July or August at earliest. Otherwise a multi-year diplomatic process will be required, which will suck away the Biden administration’s foreign policy capital, resulting either in precipitous reduction in Middle East focus or a neglect of greater long-term challenges from China and Russia. Russian Risks, Germany Elections, And Scottish Independence European politics are more stable than elsewhere in the world – marked by Italy’s sudden formation of a technocratic unity government under Prime Minister Mario Draghi. Draghi is focused on using EU recovery funds to boost Italian productivity and growth. Europe’s economic growth has underperformed that of the US so far this year. The EU is not witnessing the same degree of fiscal stimulus as the US (Chart 7). The core member states all face a fiscal drag in the coming two years and meanwhile the bloc has struggled to roll out COVID-19 vaccines efficiently. However, the vaccines are proven to be effective and will eventually be rolled out, so investors should buy into the discount in the euro and European stocks as a result of the various mishaps. Global and European industrial production and economic sentiment are bouncing back and German yields are rising albeit not as rapidly as American (Chart 8). Chart 7EU Stimulus Lags But Targets Productivity
Second Quarter Outlook 2021: Geopolitics Upsets The "Return To Normalcy"
Second Quarter Outlook 2021: Geopolitics Upsets The "Return To Normalcy"
Chart 8Global And Euro Area Production To Accelerate
Global And Euro Area Production To Accelerate
Global And Euro Area Production To Accelerate
Chart 9German Conservatives Waver in Polls
German Conservatives Waver in Polls
German Conservatives Waver in Polls
The main exceptions to Europe’s relative political stability come from Germany and Scotland. German Chancellor Angela Merkel is a lame duck and her party is falling in opinion polls with only six months to go before the general election on September 26 (Chart 9). Merkel even faced the threat of a no-confidence motion in the Bundestag this week due to her attempt to extend COVID lockdowns over Easter and sudden retreat in the face of a public backlash. Merkel apologized but her party is looking extremely shaky after recent election losses on the state level. The rise of a new left-wing German governing coalition is much more likely than the market expects. The second quarter will see the selection of a chancellor-candidate for her Christian Democratic Union and its Bavarian sister party the Christian Social Union. Table 1 highlights the likeliest chancellor-candidates of all the parties and their policy stances, from the point of view of whether they have a “hawkish,” hard-line policy stance or “dovish,” easy policy stance on the major issues. What stands out is that the entire German political spectrum is now effectively centrist or dovish on monetary and fiscal policy following the lessons of the 13 years since the global financial crisis. Table 1German Chancellor Candidates, 2021
Second Quarter Outlook 2021: Geopolitics Upsets The "Return To Normalcy"
Second Quarter Outlook 2021: Geopolitics Upsets The "Return To Normalcy"
In other words, while Germany’s conservatives will seek an earlier normalization of policy in the wake of the crisis, none of them are as hawkish as in the past, and an election upset would bring even more dovish leaders into power. Thus the German election is a political risk but not a global market risk. It should not fundamentally alter the trajectory of German equities or bond yields – which is up amid global and European recovery – and if anything it would boost the euro. The potential German chancellor candidates show more variation when it comes to immigration, the environment, and foreign policy. Germany has been leading the charge for renewable energy and will continue on that trajectory (Chart 10). However it has simultaneously pursued the NordStream II natural gas pipeline with Russia, which would bring 55 billion cubic meters of natural gas straight into Germany, bypassing eastern Europe and its fraught geopolitics. This pipeline, which could be completed as early as August, would improve Germany’s energy security and Russia’s economic security, which remain closely intertwined despite animosity in other areas (Chart 11). But the pipeline would come at the expense of eastern Europe’s leverage – and American interests – and therefore opposition is rising, including among the ascendant German Green Party. Chart 10Germany’s Switch To Renewables
Second Quarter Outlook 2021: Geopolitics Upsets The "Return To Normalcy"
Second Quarter Outlook 2021: Geopolitics Upsets The "Return To Normalcy"
Chart 11Germany Puts Multilateralism To The Test
Second Quarter Outlook 2021: Geopolitics Upsets The "Return To Normalcy"
Second Quarter Outlook 2021: Geopolitics Upsets The "Return To Normalcy"
Chart 12UK-EU Trade Deal Dampens Scots Nationalism
UK-EU Trade Deal Dampens Scots Nationalism
UK-EU Trade Deal Dampens Scots Nationalism
While Merkel and the Christian Democrats are dead-set on completing the pipeline, global investors are underrating the possibility of a major incident in which the US uses diplomacy and sanctions to halt the project. This is not intuitive because Biden is focused on restoring the US alliance with Europe, particularly Germany. But he is doing so in order to counter Russian and Chinese authoritarianism. Therefore the pipeline could mark the first real test of Biden’s – and Germany’s – understanding of multilateralism. Importantly the US is not pursuing a diplomatic “reset” with Russia at the outset of Biden’s term. This has now been confirmed with Biden’s accusation that Russian President Vladimir Putin is a “killer” and the ensuing, highly symbolic Russian withdrawal of its ambassador to the United States, unseen even in the Cold War. The Americans are imposing sanctions in retaliation for Russia’s alleged interference in the 2016 and 2020 elections. Russia is largely inured to US sanctions at this point but if the US wanted to make a difference it would insist on a stop to NordStream by cutting off access to the US market to the various European engineering and insurance companies critical to construction.3 Yet German leaders would have to be cajoled and it may be more realistic for the US to demand other concessions from Germany, particularly on countering China. The US-German arrangement will go a long way toward defining Germany’s and the EU’s risk appetite in the context of Biden’s proposal to build a more robust democratic alliance to counter revisionist authoritarian states. The Russians say they want to avoid a permanent deterioration in relations with the US, which they warn is on the verge of occurring. There is some space for engagement, such as on restoring the Iran deal, which Russia ostensibly supports. Biden may want to keep Russia pacified until he has an Iranian deal in hand. Ultimately, however, US-Russian relations are headed to new lows as the Biden administration brings counter-pressure on the Russians in retribution for the past decade of actions to undermine the United States. Germany’s place in this conflict will determine its own level of geopolitical risk. Clearly we would favor German assets over those of emerging Europe or Russian in this environment. One final risk from Europe is worth mentioning for the second quarter: the UK and Scotland. Scottish elections on May 6 could enable the Scottish National Party to push for a second independence referendum. So far our assessment is correct that Scottish independence will lose momentum after Prime Minister Boris Johnson’s post-Brexit trade deal with the European Union. Scottish nationalists are falling (Chart 12) and support for independence has dropped back toward the 45% level where the 2014 referendum ended up. Nevertheless elections can bring surprises and this narrative bears vigilance as a threat to the pound’s sharp rebound. Bottom Line: Europe’s relative political stability is challenged by US-Russia geopolitical tensions, the higher-than-expected risk of a German election upset, and the tail risk of Scottish independence. Of these only a US-Russia blowup, over NordStream or other issues, poses a major downside risk to global investors. We continue to underweight EM Europe and Russian currency and financial assets. Investment Takeaways Our three key views for 2021, in addition to coordinated monetary and fiscal stimulus, are largely on track for the year so far: China’s Headwinds: China’s renminbi and stock market are indeed suffering due to policy tightening and US geopolitical pressure. Risk to our view: if Biden and Xi make major compromises to reengage, and Xi eases monetary and fiscal policy anew, then the global reflation trade and Chinese equities will receive another boost. US-Iran Triggered Oil Volatility: The US and Iran are still in stalemate and the window of opportunity for a quick restoration of the 2015 deal is rapidly narrowing. Tensions are indeed escalating prior to any resolution, which would come in the third quarter, thus producing first upside then downside pressures for oil prices. Risk to our view: the Biden administration has no need for a new Iran deal and tensions escalate in a major way that causes a major risk premium in oil prices and forces the US to downgrade its pressure campaign against China. Europe’s Outperformance: So far this year the dollar has rallied and the EU has botched its vaccine rollout, challenging our optimistic assessment of Europe. But as highlighted in this report, we anticipated the main risks – government change in Germany, a Scots referendum – and the former is positive for the euro while the downside risk to the pound is contained. The major geopolitical problem is Russia, where we always expected substantial market-negative risks to materialize after Biden’s election. Risk to our view: A US-Russian reset that lowers geopolitical tensions across eastern Europe or a German status quo election followed by a tightening of fiscal policy sooner than the market expects. Matt Gertken Vice President Geopolitical Strategy mattg@bcaresearch.com Footnotes 1 For an excellent recent review of the issues see Danny Crichton, Chris Miller, and Jordan Schneider, "Labs Over Fabs: How The U.S. Should Invest In The Future Of Semiconductors," Foreign Policy Research Institute, March 2021, issuu.com. 2 Alex Fang, "US Congress pushes $100bn research blitz to outcompete China," Nikkei Asia, March 23, 2021, asia.nikkei.com. In anticipation of the Biden administration’s dual attempt to promote, on one hand, innovation, and on the other hand, semiconductor supply security, the US semiconductor giant Intel has announced that it will build a $20 billion chip fabrication plant in Arizona. This is in addition to TSMC’s plans to build a plant in Arizona manufacturing chips that are necessary for the US Air Force’s F-35 jets. See Kif Leswing, "Intel is spending $20 billion to build two new chip plants in Arizona," CNBC, March 23, 2021, cnbc.com. 3 See Margarita Assenova, "Clouds Darkening Over Nord Stream Two Pipeline," Eurasia Daily Monitor 18:17 (2021), Jamestown Foundation, February 1, 2021, Jamestown.org. Appendix: GeoRisk Indicator China
China: GeoRisk Indicator
China: GeoRisk Indicator
Russia
Russia: GeoRisk Indicator
Russia: GeoRisk Indicator
UK
UK: GeoRisk Indicator
UK: GeoRisk Indicator
Germany
Germany: GeoRisk Indicator
Germany: GeoRisk Indicator
France
France: GeoRisk Indicator
France: GeoRisk Indicator
Italy
Italy: GeoRisk Indicator
Italy: GeoRisk Indicator
Canada
Canada: GeoRisk Indicator
Canada: GeoRisk Indicator
Spain
Spain: GeoRisk Indicator
Spain: GeoRisk Indicator
Taiwan
Taiwan: GeoRisk Indicator
Taiwan: GeoRisk Indicator
Korea
Korea: GeoRisk Indicator
Korea: GeoRisk Indicator
Turkey
Turkey: GeoRisk Indicator
Turkey: GeoRisk Indicator
Brazil
Brazil: GeoRisk Indicator
Brazil: GeoRisk Indicator
Section III: Geopolitical Calendar
The market is pricing a significantly more hawkish Fed versus the FOMC dot plot. This is not unusual. Historically, markets tend to prematurely anticipate Fed rate hikes. Most often, unforeseen deflationary shocks force the Fed to remain more dovish than…
Beware The Greenback's Coiled Spring Potential
Beware The Greenback's Coiled Spring Potential
The mighty USA remains the world’s growth locomotive that tugs the global economy higher. In fact, in a recent Strategy Report we highlighted how US growth expectations outpace the EMU (see Chart 17 here) by a hefty margin. Even the Fed has now thrown in the towel and expects 6.5% real GDP growth for calendar 2021. Such dominance also comes at a small cost as foreigners begin to accumulate US financial assets that, at the margin, drains US dollar-based liquidity. Similarly, chip and other shortages the world over along with transportation bottlenecks also slow down global trade that in turn further mops up USD liquidity. The knock-on effect of an appreciating US dollar is well-known: it effectively tightens global monetary conditions. In more detail, it deals a blow to emerging markets (EM) especially twin deficit countries, and also eats into 40% of SPX sales that are foreign sourced. As a reminder, we recently downgraded the cyclicals/defensives portfolio tilt from overweight to neutral in anticipation of EM-driven headwinds in general, and China’s looming slowdown in particular. Bottom Line: Near-term caution is warranted, and we reiterate our recent downside protection trigger, where our portfolio went long June VIX futures as a hedge.
Highlights Biden has enough political capital to pass at least one more major piece of legislation. The next major bill will increase the budget deficit further, adding additional stimulus, though it will consist of structural reforms over a ten-year time frame and with a drag created by tax hikes. Our annual key views are on track: polarization has subsided but remains at peak levels from a historical point of view; structural reform is underway, although any chance of bipartisanship is slipping; the Republicans remain deeply divided despite some signs of regrouping. Investors should remain cyclically bullish although the sharp rise in bond yields, the bounce in the US dollar, China’s growth deceleration, and geopolitical risks all warrant tactical caution in the near term. Feature The first quarter of the year brought a few political surprises – from the Capitol Hill riot to Trump’s second impeachment – but the only significant surprise for the American investor was the Democratic victory in the Georgia Senate runoffs. This victory changed the policy setting, producing a Democratic majority in the US Senate and enabling the Biden administration to project three budget reconciliation bills (for FY2021, 2022, 2023) that require zero Republican votes. The first of these bills was signed into law promptly as expected. The $1.9 trillion American Rescue Plan Act consists of short-term cash handouts and social spending that will supercharge an economic recovery that is rapidly accelerating due to the rollout of vaccines for COVID-19 (Chart 1). Chart 1American Rescue Plan Boosts GDP
Second Quarter Outlook 2021: From Stimulus To Structural Reform
Second Quarter Outlook 2021: From Stimulus To Structural Reform
The second major piece of legislation, likely the budget reconciliation bill for FY2022, will consist of net increases to the budget deficit, thus further stimulating the economy, albeit along with structural reform, i.e. social safety net and tax hikes, and a 10-year time horizon. In the second quarter investors will learn the parameters of the bill through Biden’s address to a joint session of Congress, an idealistic presidential budget proposal, a more realistic House and Senate budget resolution, and an extended negotiation. Yet Biden’s second bill will probably not be signed into law until the third or even fourth quarter. Big Government Is Back The American Rescue Plan Act cements a new era of “Big Government” that should be ascribed not to any particular party but to underlying populist pressures in the United States. President Trump’s big-spending ways and pandemic relief packages had already produced a major step up in the government contribution to economic output, as shown in Chart 2, and this will go higher once Biden’s 8.7% of GDP bill is added to the mix. This increase in the government role is likely to last beyond the pandemic given that President Trump had already taught the Republicans that fiscal austerity does not win votes. Republicans will still be the party of “limited government” but that is a relative concept and they will not be able to win elections on a platform of slashing spending, at least not until stagflation returns. In the meantime they are out of power and tax-and-spend liberals rule the roost. Chart 2Era Of Big Government Is Back
Second Quarter Outlook 2021: From Stimulus To Structural Reform
Second Quarter Outlook 2021: From Stimulus To Structural Reform
Our updated budget projections show that the decline of stimulus spending will be gradual in the coming years if Biden delivers his second reconciliation bill for FY2022 (Chart 3). Major changes from previous versions have to do with changes to the Congressional Budget Office’s baseline outlook. Our new Democratic Low Spending scenario assumes a $2 trillion dollar green/infrastructure package, a $1 trillion health care reform, and a roughly $2 trillion increase in tax revenue. The Democrats will raise taxes – at least partially repealing Trump’s Tax Cut and Jobs Act and raising a few other taxes. We expect the market to be negatively surprised by the magnitude of tax hikes, at least initially, though the upside risk to the equity market is that tax hikes will be watered down by moderate Democrats in the Senate. We would not bet on a positive tax surprise because even moderate Democrats are in favor of taxing corporations and the wealthy, the taxes can be phased in over a 10-year period, and the economy is on a cyclical upswing combined with mammoth new spending programs. Chart 3US Budget Deficit Booms Under Biden
Second Quarter Outlook 2021: From Stimulus To Structural Reform
Second Quarter Outlook 2021: From Stimulus To Structural Reform
Our presumption that Biden will sign his second major bill into law this fall (even as late as December) rests on the vulnerability of his administration and party. Traditional Democrats, embodied by Biden, Democratic leaders in Congress, and Biden’s technocratic cabinet (Appendix), face a historic accumulation of political pressure from their populist left-wing and from Trump’s populist Republican Party. If they cannot deliver on major “bread and butter” promises to the American people, while including just enough progressive elements to keep the far left at bay, they risk extinction in coming election cycles. This pressure is real and will enable at least one more major legislative achievement. Bottom Line: Government spending has taken a big step up and Biden’s second major legislative initiative will ensure that the step up is permanent rather than a temporary response to a crisis. The macro impact is inflationary on the margin. Biden’s Second Reconciliation Bill Is the Biden administration over-stimulating the economy and setting the US up for overheating? It looks like it, though the size of tax hikes is as yet unknown. Going forward the stock market will be extremely attentive to two risks that cut in different directions: excessive stimulus and excessive tax hikes. The American Rescue Plan alone is more than twice as large as the estimated output gap. The output gap is widely expected to be closed by the end of the year (Chart 4). Even a $1 trillion infrastructure package – much lower than the currently rumored $3 trillion – would be excessive in this context. Chart 4Output Gap Is Virtually Closed
Second Quarter Outlook 2021: From Stimulus To Structural Reform
Second Quarter Outlook 2021: From Stimulus To Structural Reform
The infrastructure package that is being planned – which would include a range of measures in addition to roads and bridges, such as green energy projects, supply chain on-shoring, and digital infrastructure – would take place over a ten-year period and will be coupled with a drag from new taxes. A modern-age infrastructure plan would boost productivity and hence potential GDP growth, which could offset some of the inflationary impact. Speculatively, the simplest path for achieving Biden’s objectives would be to put his health care reform (with other welfare proposals) in the FY2022 reconciliation bill along with tax reform. Tax changes are the purpose of the reconciliation process. Unlike infrastructure, health provisions are virtually guaranteed to pass the arcane rules of reconciliation. This is not a minor concern: the Senate parliamentarian ruled out a federal minimum wage hike in the American Rescue Plan because it was not directly germane to government revenues and expenditures and could do the same to infrastructure. Bear in mind that the Obama administration passed a key component of the Affordable Care Act (Obamacare) via reconciliation, setting a precedent that health care is germane. More broadly the Democratic Party has prioritized health care since 1992, now has a chance to clinch it, and has repeatedly benefited at the ballot box on the health agenda. Infrastructure, unlike health and tax reform, could conceivably pass in a regular bill, or piecemeal in annual spending bills, in which Biden would wheel and deal to try to get 60 votes (50 Democrats, 10 Republicans). However, the latest rumors as we go to press suggest the Democrats will prioritize infrastructure and link it to tax reform. Republicans will not vote for tax hikes so reconciliation would still be required in this case. Reconciliation is trickier with infrastructure spending than with health care, though not impossible. What is clear is that Biden’s agenda is too large to fit into one bill, that tax hikes are being planned, and that reconciliation is necessary for tax hikes. Based on our scenarios in Table 1, every realistic scenario involves an increase to the budget deficit, ranging from around $500 billion to $5.4 trillion over the 10-year period. Therefore the economy will receive additional stimulus on top of the unprecedented peacetime stimulus it has already received. Table 1Scenarios For Biden’s Second Reconciliation Bill
Second Quarter Outlook 2021: From Stimulus To Structural Reform
Second Quarter Outlook 2021: From Stimulus To Structural Reform
Two other gleanings from Q1 bear mentioning: Biden’s policies on trade and immigration. On trade, Biden is coopting Trump’s hawkish China policy while trying to improve trade relations with allies and partners. The trade deficit is set to expand along with economic recovery and stimulus, resulting in larger twin deficits (Chart 5). This trend should weigh on the US dollar – but the dollar has strengthened so far this year. Given the US’s inherent strengths – rule of law, innovation, faster relative growth – and the structural rise in global geopolitical tensions, covered regularly by our twin Geopolitical Strategy, we are loathe to bet against a rising dollar. However, investors should note that the BCA House View expects the dollar to relapse and the dollar bear market to continue. On immigration, Biden faces his greatest domestic policy challenge. By easing border and immigration enforcement amid a hyper-charged economic recovery, he has invited a large flow of immigrants and refugees (Chart 6). He is thus forced to take urgent border actions to staunch the flow. If he does what is necessary to maintain order then he will widen the rift with the far left. Meanwhile Republicans are finding an issue over which they can start to reunite. Chart 5US Twin Deficits Balloon
US Twin Deficits Balloon
US Twin Deficits Balloon
Chart 6Immigration A Looming Problem For Biden
Immigration A Looming Problem For Biden
Immigration A Looming Problem For Biden
Bottom Line: The air of crisis is dissipating rapidly and proposed tax hikes will motivate opposition but Biden still has enough political capital to get at least one more budget reconciliation bill passed. The bill will focus on health/welfare (easier to pass but more inflationary) or infrastructure (harder but better for productivity). Either way the net deficit impact will be negative and the dual risk of higher taxes and economic overheating will create hurdles for the stock market rally. Updating Our Three Key Views For 2021 How do the events of Q1 impact our three key views for 2021? At the start of the year we forecast (1) that the US’s political polarization would subside but remain at historically peak levels; (2) that the US would launch major structural reforms, in some cases on a bipartisan basis; (3) that Republican disunity would enable this contradictory environment of polarization yet occasional bipartisanship. Based on the first quarter’s events, we would draw the following conclusions for the second quarter and beyond: 1. Peak Polarization: Polarization has indeed subsided (Chart 7). The country is still vulnerable to major polarizing events, including domestic extremists of whatever stripe, though any major terrorist attack would likely strengthen support for the sitting government. A fall in polarization is just one positive factor in Biden’s overall political capital, which we measure through our US Political Capital Index (Table 2). We consider Biden’s political capital moderate-to-strong because consumer confidence and the economy will likely improve. However, passing legislation will gradually get harder. The Obama administration had considerably greater strength in the Senate than the Biden administration, though, as mentioned, reconciliation guarantees Biden one or two more major pieces of legislation (Chart 8). Democrats can still overturn the filibuster, which requires a 60-vote majority on regular legislation, as we have long highlighted. But for now they seem to accept a watering-down of the filibuster (a “talking filibuster”) that will still give the minority Republicans the ability to halt controversial legislation. Chart 7Polarization Slips But Remains Elevated
Polarization Slips But Remains Elevated
Polarization Slips But Remains Elevated
Table 2Biden’s Political Capital Is Moderate To Strong
Second Quarter Outlook 2021: From Stimulus To Structural Reform
Second Quarter Outlook 2021: From Stimulus To Structural Reform
Chart 8Major Legislation Can Pass Early In Presidential Term
Second Quarter Outlook 2021: From Stimulus To Structural Reform
Second Quarter Outlook 2021: From Stimulus To Structural Reform
2. Bipartisan Structural Reform: The fact that not a single Republican senator voted for the American Rescue Plan Act, despite the lingering pandemic and air of crisis, suggests that bipartisanship is extremely limited, e.g. limited to the seven Republican senators who voted to convict Trump (Table 3). However, bipartisanship is still possible on an infrastructure package if the Democrats do not link it with tax hikes. Table 3Centrist Senators – And Republicans Who Voted To Convict Trump
Second Quarter Outlook 2021: From Stimulus To Structural Reform
Second Quarter Outlook 2021: From Stimulus To Structural Reform
Beneath the surface there is bipartisanship when it comes to trade, supply chains, and countering China. Tariffs bottomed under the Obama administration and Biden started off with another round of “Buy America” provisions and a tentative decision to maintain Trump’s tariffs on China (Chart 9). Measures to boost US supply chain resilience in technology, health, and defense could be rolled up into an infrastructure package to help garner 10 Republican votes. Republicans have prepared for possible compromise by clearing the way for the use of “earmarks,” or constituency-based legislative incentives, otherwise known as pork-barrel spending. Chart 9Tarriff Levels Bottomed Under Obama
Tarriff Levels Bottomed Under Obama
Tarriff Levels Bottomed Under Obama
The market currently expects an infrastructure bill to pass, as indicated by the outperformance of infrastructure-related stocks, industrials, and materials relative to the market. Our BCA Infrastructure basket is outperforming (Chart 10). The market does not currently expect the Democrats to focus on health care policy, which creates the likelihood of a negative surprise for this sector (Chart 11). Chart 10Market Says Infrastructure Will Pass (One Way Or Another)
Market Says Infrastructure Will Pass (One Way Or Another)
Market Says Infrastructure Will Pass (One Way Or Another)
The managed health care sub-sector (the insurance companies) staged a surprise rally over the past month that should reverse as Biden’s legislative proposals become known. However, Big Pharma and biotech continue to sell off as expected. Again, the simplest FY2022 reconciliation bill would consist of Biden’s health reform plus tax reform. The market is having some doubts about Democrats’ climate change agenda, which will be stuffed into the infrastructure package, given that the US renewable energy index has rolled over relative to global renewables. US cyclicals are also outperforming renewables (Chart 12). If Democrats do not use reconciliation, they may not get many green projects passed. If they do use reconciliation, their health and welfare reforms will have to wait until a FY2023 reconciliation bill that may not get passed. Chart 11More Pain Coming For Health Insurers, Big Pharma
More Pain Coming For Health Insurers, Big Pharma
More Pain Coming For Health Insurers, Big Pharma
Chart 12Market Skeptical About Biden Climate Agenda Passage
Market Skeptical About Biden Climate Agenda Passage
Market Skeptical About Biden Climate Agenda Passage
3. Republicans In The Wilderness: Although Republicans have begun to regroup faster than many expected, the divisions within the party have not been healed and will continue to flare up in disputes that threaten to wreck the party. Trump and the populist wing are preparing to put up primary election challengers to establishment Republican senators and representatives who voted against Trump or otherwise who vote against his “America First” agenda. Yet it is possible that 10 Republicans will find it impossible to vote against Biden’s infrastructure package if it is well-designed regarding supply chains and China and not linked with tax hikes. Trump could split the party via his personal following (which may be enhanced by a new social media outlet) and his ability to divide the party’s votes if he forms a “Patriot Party.” We recently showed, via the “Prisoner’s Dilemma” in game theory, that the Republicans must choose a Trumpist agenda of fiscal largesse, trade protectionism, and border security if they are to succeed. Yet Trump may or may not choose to run for president again or form a third party. The result is that Trump is more likely than not to be the Republican candidate in 2024 but there are huge risks to the party’s coherence as the party establishment tries to convince Trump to bow out and support a successor (Diagram 1). The point is that Trump remains a loose cannon and is capable of dividing the party single-handedly. Since investors cannot predict Trump’s behavior they should not expect the Republicans to unite in the near term. Diagram 1Game Theory Says Republicans Will Court Trump
Second Quarter Outlook 2021: From Stimulus To Structural Reform
Second Quarter Outlook 2021: From Stimulus To Structural Reform
Bottom Line: Our three key views for 2021 are broadly on track – polarization is subsiding but still near peak levels, structural reform is underway (though bipartisanship is clearly at risk), and the Republicans remain divided and ineffectual. The Democrats’ handling of their infrastructure package will determine if bipartisanship can reinforce structural reform but the FY2022 reconciliation process enables them to achieve some reform regardless. Investment Takeaways The Federal Reserve expects GDP to grow by 6.5% in 2021 as a whole (up from the 4.2% estimate in December) and the unemployment rate to fall to 4.5% by the end of the year (down from 5% previously). Treasury Secretary Janet Yellen is expected to predict full employment by 2022. Households are likely to spend at least a third of the $699 billion in dole money they receive (stimulus checks and topped-up unemployment benefits), according to surveys highlighted by our Global Investment Strategy. This summer will have a party on every block, whether authorized or not. While details are scant about the exact makeup of the Biden administration’s next major legislation, what is clear is that it will have a net negative impact on the budget balance. Democrats will raise taxes but not so much as to jeopardize the economic recovery and their election prospects in 2022-24. This ultra-easy fiscal policy coincides with an ultra-easy monetary policy in which the Fed has insisted it will not raise rates through 2023. The market expects four rate hikes by that time, which would put the Fed funds rate at about 1.1%. The Fed will eventually have to adjust its path for the Fed funds rate and start thinking about thinking about tapering asset purchases. But the main thing to remember is that the Fed has committed to generating an inflation overshoot. In this context, US investors should be cyclically bullish albeit tactically guarded given the sharp rise in bond yields and rising dollar. A pro-cyclical orientation would favor small caps over large caps, cyclicals over defensives, and value over growth stocks. All of these positions have recently met with some resistance and could face a healthy near-term correction. Cyclical stocks are historically very elevated relative to defensives (Chart 13). But over a 12-month period the recovery and stimulus will reinforce the bullish view, as rising bond yields will not stop equities from rising if the Fed stands pat. Chart 13Cyclicals Look Toppy Versus Defensives
Cyclicals Look Toppy Versus Defensives
Cyclicals Look Toppy Versus Defensives
The chief risks to the pro-cyclical orientation stem from any breakout in the US dollar, the rollover in China’s growth momentum, and the Biden administration’s tax hikes and foreign policy challenges. These risks are all immediate and serious, especially given high stock market valuations. China’s policy tightening will not be fully felt in the economy until the second half of the year and Biden’s specific foreign policy challenges can result in negative geopolitical shocks at any time this year or over the next four years. The point is to buy on the dips unless surprise events fundamentally alter the reflationary cyclical backdrop. With regard to equity sectors, our US Political Risk Matrix highlights the chief policy risks to our US Equity Strategy’s views. Generally speaking Biden poses upside risks to industrials and consumer discretionary sectors and downside risks to energy, health care, tech, and communications (Table 4). After a quarter’s worth of information on markets and policy, these views are mostly confirmed: stay cyclically bullish on industrials and financials, bearish on tech and health care. Table 4US Political Risk Matrix
Second Quarter Outlook 2021: From Stimulus To Structural Reform
Second Quarter Outlook 2021: From Stimulus To Structural Reform
In the case of energy we continue to be neutral-to-bullish over a 12-month time horizon as long as demand is recovering, global inventories are drawing down, and the immediate geopolitical scene is conducive to tit-for-tat attacks in the Middle East, as is the case in the first half of the year. But Biden’s regulatory risks and disruptive climate change agenda can bring negative surprises for US oil producers and Biden’s foreign policy would ultimately be positive for Middle East oil supply. In the case of communications services we are neutral-to-bearish. The Biden administration is allied with Big Tech but it is tightening regulation and anti-trust enforcement gradually to gain greater control over the sector.1 The Treasury selloff is set to continue. Yields are starting to reach pre-COVID levels and have a way to go until they challenge 2018 levels. From peak to trough in the Bloomberg Barclays Treasury Index, the current selloff is not as bad as in the past four recoveries, as our US Bond Strategy has shown. As the economic rebound shows up in hard data over the course of this year, the Fed’s revised expectations will confirm the bond selloff in the financial market. We would thus favor high-yield corporate bonds. We remain overweight TIPS and municipal bonds relative to duration-matched nominal bonds. In recent years presidential approval has correlated remarkably well with the stock-to-bond ratio about two months later (Chart 14). The implication is that higher presidential approval is consistent with receding uncertainty and greater consumer optimism about the economy, which is reflected in rising bond yields and share prices. Neither Biden’s approval rating nor the stock-to-bond ratio is likely to go much higher without a consolidation phase, however, as implied by the chart. Chart 14Stock-To-Bond Ratio Needs A Breather In Q2
Stock-To-Bond Ratio Needs A Breather In Q2
Stock-To-Bond Ratio Needs A Breather In Q2
Matt Gertken Vice President Geopolitical Strategy mattg@bcaresearch.com Appendix Table A1APolitical Capital: White House And Congress
Second Quarter Outlook 2021: From Stimulus To Structural Reform
Second Quarter Outlook 2021: From Stimulus To Structural Reform
Table A1BPolitical Capital: Household And Business Sentiment
Second Quarter Outlook 2021: From Stimulus To Structural Reform
Second Quarter Outlook 2021: From Stimulus To Structural Reform
Table A1CPolitical Capital: The Economy And Markets
Second Quarter Outlook 2021: From Stimulus To Structural Reform
Second Quarter Outlook 2021: From Stimulus To Structural Reform
Table A2Biden’s Cabinet Position Appointments
Second Quarter Outlook 2021: From Stimulus To Structural Reform
Second Quarter Outlook 2021: From Stimulus To Structural Reform
Footnotes 1 Biden is expected to nominate anti-trust scholar Lina Khan for FTC commissioner.