United States
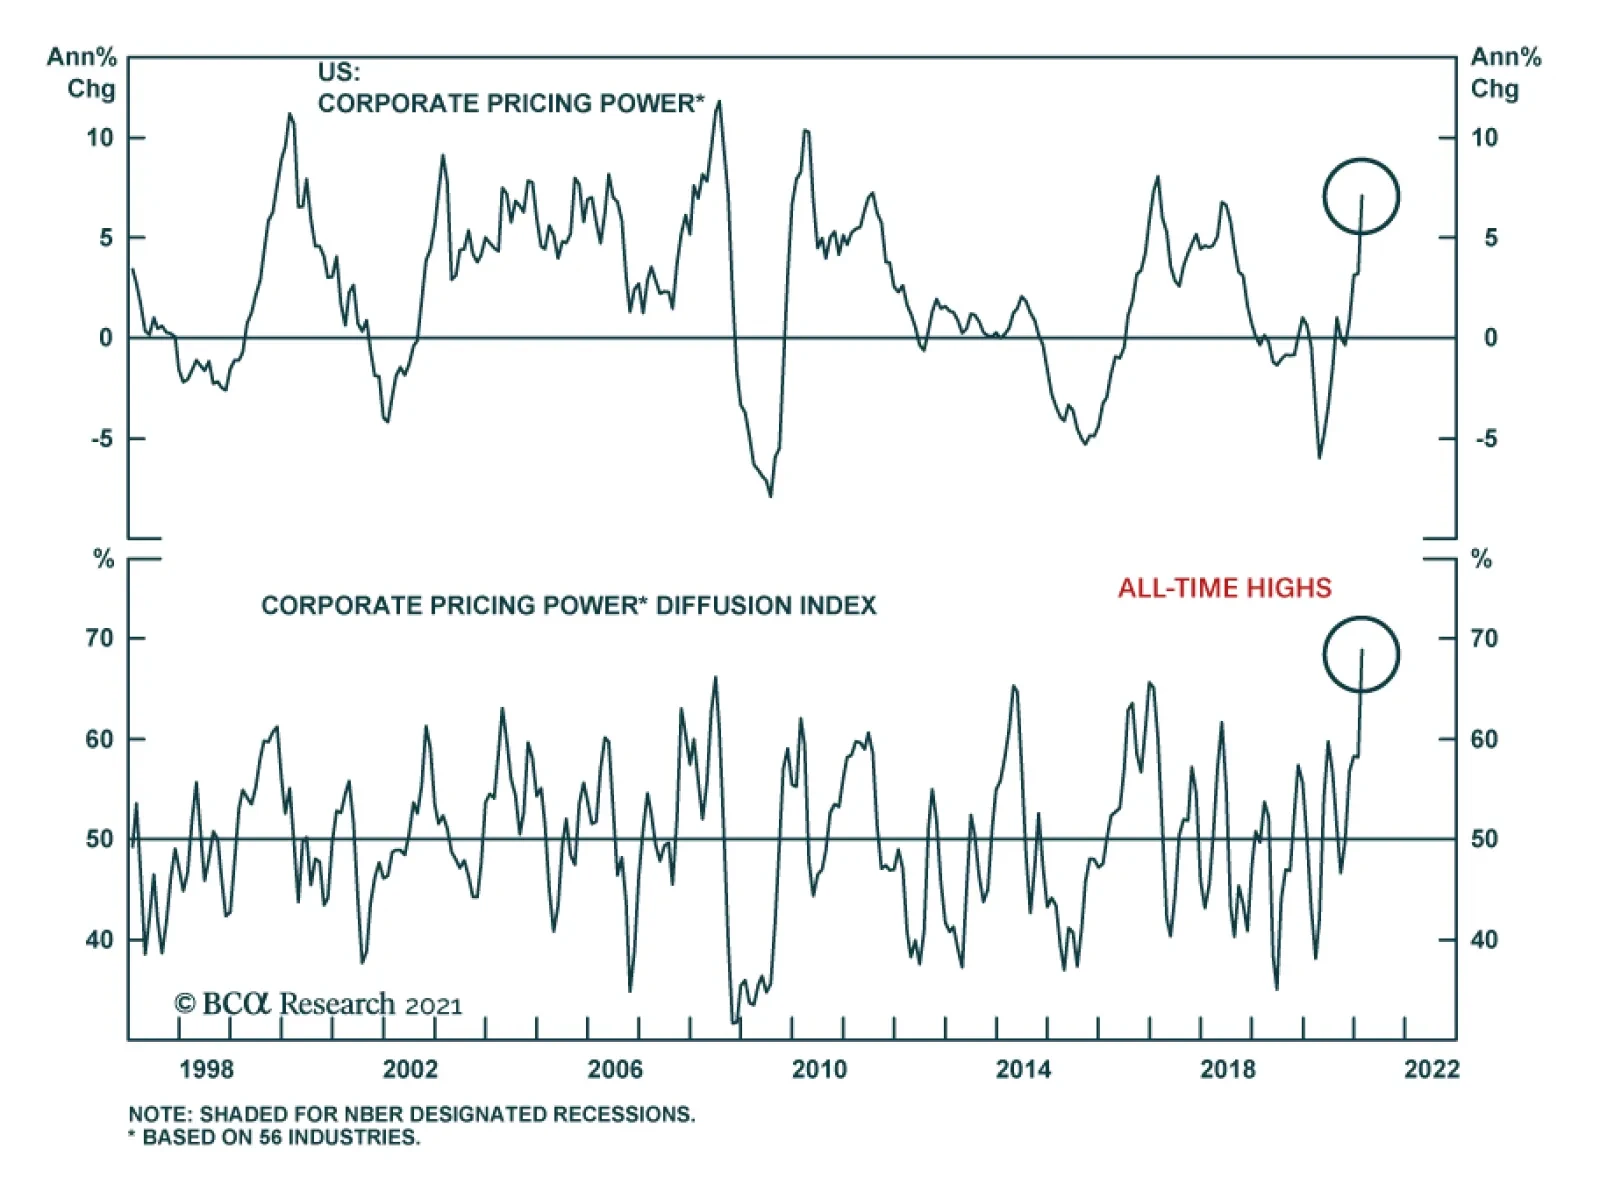
Yesterday, US Equity Strategy updated their Corporate Pricing Power Indicator (CPPI). It has swung over 10 percentage points from the recent trough, accelerating north of 5%/annum pace. Their diffusion index of the 60 selling price categories they track has…
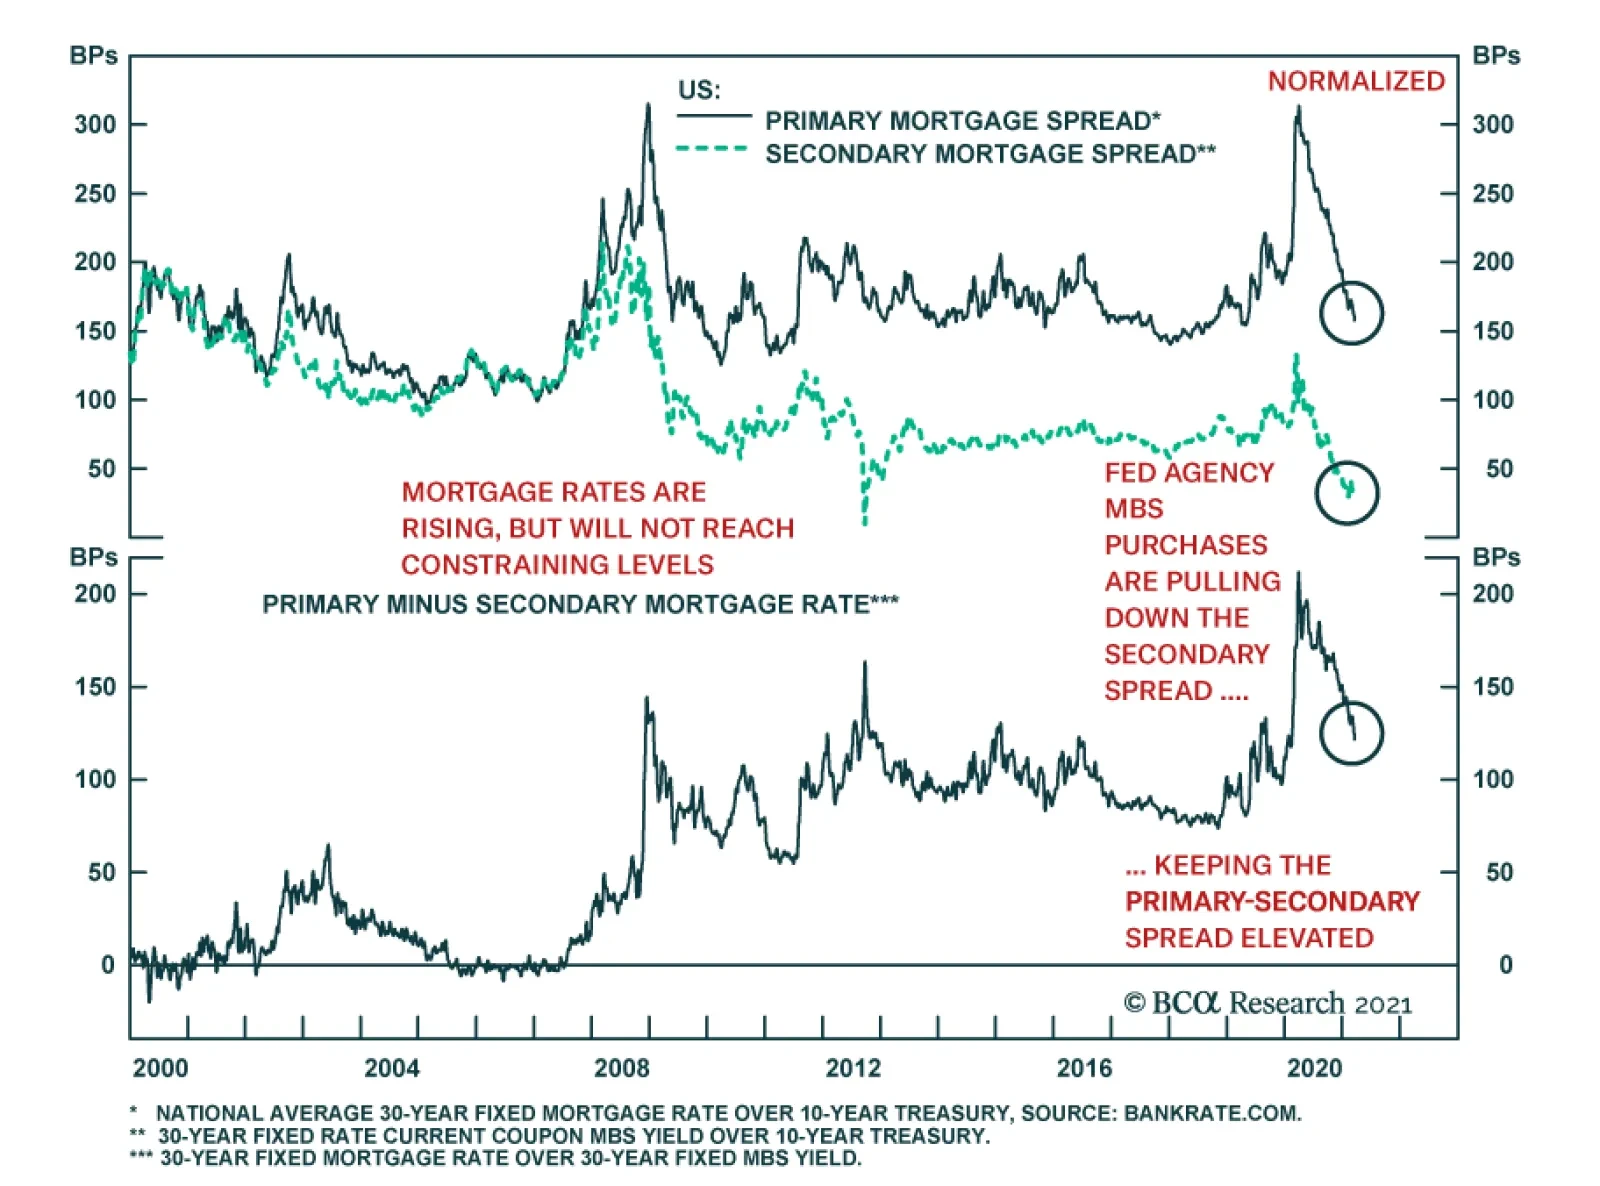
US mortgage rates are moving decisively higher, up a sharp 50 bps since their early-February bottom. This comes after a slow response to last year’s interest rate cut, followed by a continued drift lower throughout the second half of the year, even as US…

Dear Client, Dhaval Joshi has started publishing the new BCA Research Counterpoint product, in which he will continue to apply his unique process to dig up original investment opportunities around the globe. I trust many of you will continue to read Dhaval’s excellent and thought-provoking work. I also hope to keep your readership as I take the helm of the European Investment Strategy product, where I will apply BCA’s time-tested method which emphasizes analysis of global liquidity and economic trends to forecast European market outcomes. Thank you for your continued trust and support. Best regards, Mathieu Savary Highlights The Eurozone’s economy lags the US’s because of weakness in the service sector. Poor vaccine rollouts and tighter fiscal policy explain this bifurcated outcome. Even though Europe will continue to trail the US this year, the summer period will see a sharp European recovery. Investors can take advantage of this rebound by buying the cyclical equities that have lagged during last year’s rally. Favor the French, Italian and Spanish equity markets over the German and Dutch markets. The Bank of England does not need to fight rising Gilt yields; favor the pound over the euro as the UK-German spread widens. The Norges Bank will be the first G-10 central bank to lift rates, which will hurt EUR/NOK. Fade any hawkish noise coming from the German election season. Feature The service sector constitutes the biggest drag on the Eurozone’s economy, which will cause European growth to trail that of the US further. The euro area’s fundamental problem is that it lags the US significantly on both vaccination and fiscal stimulus fronts. Nonetheless, by the summer, the European service sector will start catching up, which will favor a basket of sectors exposed to the economic re-opening that have lagged until now. The Service Sector Remains Under The Weather The consensus is correct to expect European growth to lag that of the US in 2021, even if the extent of the shortfall does not hit the 4% currently penciled in by Bloomberg. Chart 1The Service Sector Is the Problem
The Service Sector Is the Problem
The Service Sector Is the Problem
Unlike normal business cycles, the service sector is now Europe’s biggest handicap, while the manufacturing sector is performing in line with that of the US (Chart 1, top panel). On both sides of the Atlantic, industrial activity has benefited from the same set of positives in recent quarters. Goods purchases were the only outlet for pent-up demand built up in the first and second quarter of 2020. Extraordinarily accommodative global liquidity conditions and record-low interest rates boosted spending on big-ticket items, especially in light of the housing boom that has engulfed the globe. Finally, China’s rapid recovery fueled a swift rebound in the demand for natural resources, autos and machinery that benefited manufacturers the world over. Service activity did not enjoy a similar unified tailwind. Consequently, while the US Services PMI stands at a seven-year high, the Eurozone’s lingers at 45.7, in contraction territory (Chart 1, middle panel). The weaker confidence of European households sheds light on this bifurcated performance (Chart 1, bottom panel). Health and fiscal policies are the main headwinds in the Eurozone that have hurt its service sector and hampered the mood of its households, at least compared to the US. With regard to health policy, the poor vaccination rates on the European continent create the greatest problem. The vaccination effort has only reached 11.8, 11.1, 11.9 and 12.5 doses per 100 person in Germany, France, Italy and Spain respectively. In the US and the UK, authorities have already delivered more than 30 doses per 100 person (Chart 2). As a result, while infection and death per capita are rapidly declining in the US and in the UK, mortality is once again rising in France as well as in Italy and caseloads are increasing there and in Germany. Moreover, hospitalization rates and ICU usage in France, Germany, Italy or Portugal are once again trending up, and in some cases they are hitting threatening levels for the healthcare system. In response to these COVID-19 dynamics, governments in many major Eurozone countries are resorting to the re-imposition of restrictions. Italy has announced new lockdowns in half of its 20 regions while France just entered its third lockdown over the weekend. By contrast, the stringency of restrictions is set to ease in the UK and the US. In the US, limitations were already imposed or followed more laxly relative to the euro area (depending on the state) and mobility was improving (Chart 3). Chart 2Slow Vaccination In The Eurozone
Slow Vaccination In The Eurozone
Slow Vaccination In The Eurozone
Chart 3The Stringency Of Lockdowns Matter
The Stringency Of Lockdowns Matter
The Stringency Of Lockdowns Matter
Despite the lower mobility created by stricter restrictions in the Eurozone, the US government has opened the fiscal tap much more aggressively than European governments (Chart 4). Since the beginning of the crisis, the US fiscal help has reached 25% of GDP, while in Italy, Germany, France or Spain the budget deficits have swelled by a more modest 14%, 10%, 9% and 13% of GDP, respectively. True, European governments have also offered credit guarantees totaling EUR3 trillion euros, but these sums only have a very indirect impact on aggregate demand and should mostly be understood as liquidity insurance to prevent a liquidity crisis from morphing into a solvency crisis. Chart 4Tight Fists On The Continent
Summer Of ‘21
Summer Of ‘21
For the remainder of 2021, European fiscal policy is unlikely to be eased compared to the US. BCA Research’s Geopolitical strategy team anticipates the Biden government to add a further $2 trillion dollars of spending by the end of 2021, mostly in the form of long-term and infrastructure outlays, in addition to the $1.9 trillion recently legislated.While the European Union’s NGEU plan is an important step in the integration of European fiscal policy, its generous EUR750 billion envelope will be disbursed over five years. This implies a debt-based fiscal expansion of 1% per annum between 2021 and 2024 (the years of maximum disbursements). Individual state plans are also limited. Bottom Line: The European economy is lagging the US economy because of the inferior performance of its service sector. This disadvantage is the consequence of both a slower vaccine rollout that is negatively impacting mobility and a much more timid fiscal policy. Relief Is On Its Way The Eurozone’s service sector and domestic economic performance is nonetheless set to improve, despite the current health and fiscal policy deficiencies. First, the economy continues to adapt to its new socially distanced form. In the second quarter of 2020, the imposition of lockdowns caused the euro area’s quarterly GDP to collapse by 11%. The contribution to GDP of the retail, wholesale, artistic, entertainment, and hospitality sectors tumbled to -7.3%. In Q4 2020, as European governments were imposing equally stringent lockdowns, quarterly GDP growth fell to -0.1% and the contribution to growth of the same sectors only hit -0.54%. Second, the continental vaccination campaign is progressing. It is easy to worry that it will take a very long time to vaccinate the entire population, but the main reason to impose lockdowns is to preserve capacity in the healthcare system. Thus, the priority is to inoculate 50-year olds and above because they constitute 90% of hospitalizations. Through this aperture, even if the pace of vaccination remains tepid in Europe, the goal to decrease economic restrictions can reasonably be achieved by summer. Moreover, with Pfizer’s logistical issues corrected, the pace of vaccination can accelerate. Concerns remain over the population’s willingness to receive the vaccines, but these issues will fade as well. The current worries surrounding the AstraZeneca vaccines provide an example. The incidence of thromboembolic events is marginally higher than for the general population and the European Medicines Agency deemed the AstraZeneca vaccines safe, especially in light of the human costs of the disease it prevents. As caseloads and mortality rates decline in Israel, the UK and the US, even French elderlies will become more willing to receive their vaccines. Table 1Parsimonious But Constant Fiscal Stimulus…
Summer Of ‘21
Summer Of ‘21
Third, fiscal policy will remain easy. True, European government support is tepid compared to the US, but the continual drip of new policy measures shows that authorities are not intransigent (Table 1). In all likelihood, the various furlough and employment protection schemes implemented since the spring of 2020 are likely to remain in place this year even if lockdowns decrease. Their impact on employment was major and they contributed meaningfully to preserve household income (Chart 5). Finally, COVID-19 is a seasonal illness and summer is on its way in Europe. The experience of 2020, when vaccines and testing were much more limited than they are today, has taught us that in the summer months, this coronavirus spreads much less. Therefore, seasonal patterns will allow a relaxation of social distancing measures. Chart 5Furloughs Played A Crucial Role
Summer Of ‘21
Summer Of ‘21
In this context, service activity in the Eurozone will improve, which will boost GDP. European households, like their US counterparts, have accumulated significant excess savings (Chart 6). Furthermore, global manufacturing activity will remain robust, which will support employment and household income in the Eurozone. Hence, consumer confidence will improve and some of the EUR300 billion in excess savings will make its way into the economy. The service sector should be the prime beneficiary of this money because households have already fulfilled a large proportion of their pent-up demand for goods. What they now want to do is to go out, go to restaurants and spend their income on experiences. The rebound in the contribution to GDP of the retail and recreation sectors will be accretive to job and household income, unleashing a virtuous circle of activity (Chart 7). Chart 6European Are Building Their Nest Egg too
European Are Building Their Nest Egg too
European Are Building Their Nest Egg too
Chart 7Services Will Contribute Again to Growth
Services Will Contribute Again to Growth
Services Will Contribute Again to Growth
Bottom Line: In 2021, the euro area’s economy will further lag that of the US, but investors should nonetheless expect a robust uptick in service activity this summer. How To Play The Summer Recovery? Chart 8Buy The Laggards / Sell the Leaders
Summer Of ‘21
Summer Of ‘21
Five weeks ago, BCA Research’s US Equity Sector Strategy service designed a strategy to buy the laggards within a basket of sectors that should benefit from the recovery while selling the “back-to-work” stocks that had already priced in that recovery. This recommendation protects investors against potential hiccups in the re-opening trade and is simple to implement: sell/underweight the pro-cyclical sectors that stand above their February 19 relative peak and buy/overweight those that remain below their relative highs (Chart 8). In the Eurozone context, this strategy involves focusing on the cyclical sectors, and buying/overweighting these cyclical stocks that stand below their pre-COVID high relative to the MSCI benchmark while selling/underweighting those that have punched above this threshold. Chart 9 illustrates the sectors to favor and the ones to avoid using this methodology. In essence, not only should the “laggards” baskets experience a catch up in earnings, but also, the shift in sentiment should prompt a re-rating of relative valuations (Chart 10). Chart 9Who Are the Laggards And the Leaders?
Summer Of ‘21
Summer Of ‘21
This strategy makes sense beyond the COVID-19 dynamics. From a global perspective, the basket of sectors purchased (the laggards”) outperforms the former “leaders” after global bond yields increase (Chart 11, top panel). This relationship reflects the heavy representation of financials in the “laggards” basket while tech and the interest rates-sensitive automobile sector are key constituents of the “leaders” basket. Additionally, the former “leaders” are more exposed to the Chinese business cycle than the “laggards". Chart 10Relative Valuations will Adjust
Relative Valuations will Adjust
Relative Valuations will Adjust
Chart 11Macro Forces Favor The Laggards over the Leaders
Macro Forces Favor The Laggards over the Leaders
Macro Forces Favor The Laggards over the Leaders
The deceleration in the Chinese economy is a problem for the “leaders” relative performance (Chart 11, bottom panel). China’s credit impulse has rolled over as Beijing aims to prevent excess speculation in the real estate sector. Moreover, a regulatory tightening is taking place in the Middle Kingdom, which will further slow its economy. Already, the new orders-to-inventories ratio from the NBS PMI reflects the downside risk for the Chinese economy, which highlights the threat to the previous high-flying leaders. A strategy that favors the former “laggards” at the expense of the previous “leaders” also has implications for geographical allocation within euro area equities. As Table 2 shows, Italy, France and Spain over represent the “laggards” in their national benchmarks while the Netherlands and Germany overweight the “leaders”. On a net basis, the tech-heavy Netherlands is the country to avoid, with a 27% relative underweight for the “laggards”, while Spain and Italy should be favored, with their 24% and 22% overweight in the “laggards” relative to the “leaders”. Spain and Italy in particular will also benefit from a further narrowing in sovereign spreads that will boost the performance of their financial sector while the re-opening of trade continues. Additionally, investors should favor France at the expense of Germany. Table 2France, Italy, and Spain Over The Netherlands And Germany
Summer Of ‘21
Summer Of ‘21
Bottom Line: The economic re-opening favors the Eurozone cyclicals that still trade below their February 19 2020 relative highs as the expense of those cyclicals that have already overtaken their pre-COVID peaks. This means buying/overweighting the Banks, Insurance, Energy and Aerospace & Defense sectors at the expense of the IT, Automobiles and Building products sectors. It also implies a preference for Italian and Spanish equities, especially relative to Dutch equities. Country Focus: The BoE Follows the Fed, Not The ECB Last Thursday, the Bank of England followed in the Fed’s footprints, not the ECB’s. The BoE refrained from adding to its asset purchases, even if this year, 10-year Gilt yields are rising in line with the Treasuries and rapidly outpacing Bund yields. However, the BoE remains committed to keeping short rates at record lows and it keeps the window open for rate cuts if economic conditions ever warrant it. We agree with the Bank of England that the UK’s economic outlook has improved in recent months. The extension of both the furlough schemes and tax holidays, along with the rapid pace of vaccination in the British Islands point to robust growth in the coming quarters. Nonetheless, the picture is not without blemish. Specifically, the UK’s exports to the EU are collapsing in wake of Brexit. Moreover, the pace of vaccination in the UK is set to slow a bit over the coming months. These risks to the outlook are unlikely to topple the economy, because the vigor of the UK’s housing market is an important support to domestic demand. While the UK’s labor market remains frail, the strength of the RICS housing survey suggests that real wages will stay well bid (Chart 12). The increase in household income will cause consumption to accelerate sharply once lockdowns are eased. This could accentuate inflationary pressures this year, and cause inflation over the next few years to trend higher relative to the euro area. Chart 12UK Real Wages Have Upside
UK Real Wages Have Upside
UK Real Wages Have Upside
With this economic backdrop, the market’s pricing of the SONIA curve is appropriate. Over the past month, the OIS curve has steepened significantly (Chart 13). The BoE is comfortable with that pricing and considers the back up in interest rates to be reflective of stronger growth and not constraining of activity. In fact, financial conditions are roughly unchanged since the MPC’s last meeting, which highlights that rising risk asset prices have compensated for an appreciating pound and rising gilt yields. Chart 13SONIA Is Climbing Up, And The BoE Is Fine With It
SONIA Is Climbing Up, And The BoE Is Fine With It
SONIA Is Climbing Up, And The BoE Is Fine With It
Bottom Line: The SONIA curve will continue to shift higher relative to the EONIA curve. Consequently, the spread between Gilt and Bund yields will widen further and EUR/GBP will depreciate more over the coming six to nine months, especially because the pound keeps trading at a discount. Moreover, thanks to their domestic focus and lower sensitivity to the pound, UK mid-cap and small-cap stocks will outperform the FTSE-100. Country Focus: Norges Bank, First Out Of The Gate Chart 14The Norges Bank Will Raise Rates First
The Norges Bank Will Raise Rates First
The Norges Bank Will Raise Rates First
Last Thursday, Governor Øystein Olsen indicated that the Norges Bank would increase interest rates from zero later this year, which validates the message of the Norwegian swap curve. Looking at economic fundamentals, investors should not bet against this outcome. BCA’s Central Bank Monitor confirms that the Norges Bank will be the first central bank in the West to lift interest rates (Chart 14). It is the only one of our Monitors in “Tight Money Required” territory. The message from our Norges Bank Monitor reflects the prompt recovery of the Norwegian economy. Thanks to rebounding Brent prices and rapidly expanding production at the new Johan Sverdrup oil field (the largest in the North Sea), Norwegian nominal exports are growing at a double-digit pace. Meanwhile Norwegian retail sales are increasing at a 16% annual rate. Beyond some near-term COVID worries, consumer spending will remain robust because the strong employment component of the PMI points to solid job gains and a rapidly rising consumer confidence. Finally, Norwegian inflation is already above the central bank’s target of 2%, with core CPI at 2.05% and headline inflation at 3.3%. Chart 15A Weaker EUR/NOK ahead
A Weaker EUR/NOK ahead
A Weaker EUR/NOK ahead
Thanks to Norway’s economic performance, the krone remains one of the favorite currencies of BCA’s Foreign Exchange Strategy service. The global economic environment creates additional tailwind for the NOK. A continued global economic recovery will allow oil prices to rise further on a 12- to 18-month basis, which should lead to a weaker EUR/NOK (Chart 15). In a similar vein, the NOK is particularly sensitive to the USD dollar’s fluctuations. As a result, BCA’s negative cyclical stance toward the USD will create an important support for the NOK, even if the greenback’s countertrend bounce could last another quarter or so. Finally, along with the SEK, the NOK is the cheapest pro-cyclical currency in the G10, trading at a 5% discount to its fair value. Thus, the Norwegian krone should benefit greatly from continued risk taking this year. Bottom Line: The Norwegian krone remains one of the most attractive currencies in the world. The status of the Norges Bank as the front-runner to lift rates this year only amplifies the NOK’s appeal. A Few Words On Germany’s State Elections Chart 16German Party Polling
German Party Polling
German Party Polling
The defeat of Angela Merkel’s CDU party in the states of Baden-Wurttemberg and Rhineland-Palatinate highlights that the German electorate is moving slowly to the left. According to BCA’s Geopolitical Strategy Service, it is too early to tell whether a left-wing coalition will take power in Germany this fall. However, the marginal shift toward the SPD and the Green Party indicates that even the CDU will have to listen to the median voter’s demands (Chart 16). Practically, this means that German politics will push for more European integration and that ultimately, more fiscal stimulus will materialize in Europe over the coming years. As a result, investors should fade any hit to the euro or European assets caused by hawkish sounds made by CDU potential leaders during the campaign for the September federal election. Mathieu Savary, Chief European Investment Strategist Mathieu@bcaresearch.com Cyclical Recommendations Structural Recommendations Trades Closed Trades Currency Performance
Summer Of ‘21
Summer Of ‘21
Fixed Income Performance Government Bonds
Summer Of ‘21
Summer Of ‘21
Corporate Bonds
Summer Of ‘21
Summer Of ‘21
Equity Performance Major Stock Indices
Summer Of ‘21
Summer Of ‘21
Geographic Performance
Summer Of ‘21
Summer Of ‘21
Sector Performance
Summer Of ‘21
Summer Of ‘21
Highlights Portfolio Strategy China’s slowdown, a grinding higher US dollar, extremely overbought technicals and historically pricey valuations, all signal that the time is ripe to book profits and downgrade machinery to neutral. Recent Changes Lock in gains of 4.3% and downgrade the S&P construction machinery & heavy trucks index to neutral, today. Table 1
Pricing Power Update
Pricing Power Update
Feature While the Fed’s dots dovishly surprised market participants last week, the FOMC’s output and inflation projections were on the hawkish side. Adding the committee’s 2021 core PCE price inflation estimate to their real GDP forecast results in a roughly 9% nominal GDP estimate, assuming the PCE and GDP deflators approximate one another. Clearly, the Fed is in a bind as it tries to strike a delicate balance between short and long term rates. Our thesis, first posited on February 1, remains that the bond market will keep on testing the Fed’s resolve until the FOMC members start to “talk about talking about tapering”. An economy running on steroids buoyed both by ultra loose monetary and fiscal policies at a time when it is primed to reopen at full speed around Memorial Day is inherently inflationary. Under such a backdrop, the subsurface equity market’s response makes perfect sense. “Back-To-Work” stocks left “COVID-19 Winners” in the dust, small caps outperformed the Nasdaq 100, the Value Line Arithmetic Index and the RVRS1 exchange traded fund outshone the SPX and the S&P 495 trounced the S&P 5 (Chart 1). In other words, when growth is scarce as during last year’s recession investors flock to growth stocks, now that growth is abundant investors are cornering value stocks with the highest degree of operating leverage (top panel, Chart 1). While this deck reshuffling may go on temporary hiatus as the 10-year US Treasury yield pauses for breath, this sector rotation has cyclical staying power. Given this looming inflationary impulse context, today we update our Corporate Pricing Power Indicator (CPPI). Chart 2 shows that our CPPI has swung over 10 percentage points from the recent trough, accelerating north of 5%/annum pace. In fact, our diffusion index of the 60 selling price categories we track has vaulted to all-time highs (second panel, Chart 2). Chart 1Anatomy Of The Market
Anatomy Of The Market
Anatomy Of The Market
Chart 2Corporate Pricing Power Flexing Its Muscles
Corporate Pricing Power Flexing Its Muscles
Corporate Pricing Power Flexing Its Muscles
Wage inflation is also coming out of hibernation, with job switchers outpacing job stayers’ salary inflation, according to the latest Atlanta Fed wage growth trackers (third panel, Chart 2). Importantly, the most recent NFIB survey showed that small businesses have the hardest time filling job openings by finding qualified labor. Over the past three decades, this backdrop has been conducive to wage inflation (Chart 3), and if history at least rhymes, a pick-up in wage inflation is in the cards in the back half of the year (Chart 4). Our sense is that the economic reopening will by then be at full speed, further exacerbating wage pressures. Chart 3Inflation…
Inflation…
Inflation…
While profit margins are on the cusp of shaking off the remnants of the COVID-19 accelerated recession, sell-side analysts’ 12-month forward profit margin estimates show no signs of input cost pressures, at least not yet. The risk is that corporations may find it challenging to pass on these looming wage increases down the supply chain and all the way to the consumer in order to preserve margins (bottom panel, Chart 2). The jury is still out on who will eventually have to bear the brunt of inflationary pressures, especially in the context of rising fiscal deficits (i.e. personal current transfers). Drilling beneath the surface, our CPPI signals that genuine inflationary pressures are mounting as supply chains are strained causing shortages on a slew of manufacturing industries. As a reminder, we calculate industry group pricing power from the relevant CPI, PPI, PCE and commodity growth rates for each of the 60 industry groups we track. Table 2 also highlights shorter term pricing power trends and each industry's spread to overall inflation. Chart 4…Is Coming
…Is Coming
…Is Coming
Table 2Industry Group Pricing Power
Pricing Power Update
Pricing Power Update
While 68% of the industries we cover are outright lifting selling prices, half are doing so at a faster clip than overall inflation. With regard to pricing power trends, encouragingly only 30% of the industries we cover are in a downtrend (Table 2). Services industries mostly populate the bottom half of Table 2 with the usual suspects – airlines, air freight, hotels and movies & entertainment – that COVID-19 wreaked the most havoc to occupying the bottom four spots. Nevertheless, this is looking in the rearview mirror. The tide is slowly turning as a recent update from the TSA highlighted that passenger enplanements are perking up. Lumber has reached escape velocity and has sustained forest products atop our table with a meteoric year-over-year growth rate of 149%! Commodities populate nine out of the top ten spots and while gold has fallen down the ranks since our last update, it is still expanding at a near 10%/annum rate, despite the greenback’s year-to-date rise. Energy related commodities are on fire and peak oil inflation will hit in April/May due to base effects. Keep in mind that last spring WTI crude oil prices sank into a deeply negative print per bbl. While at first sight all seems upbeat in the commodity complex, beneath the surface some cracks are forming. This week, we revisit our number one macro risk for the back half of the year: China’s pending slowdown, and downgrade a deep cyclical capital goods sub-group to neutral. Gauging China’s Slowdown Cresting in Chinese data pushed us to downgrade the cyclical/defensive portfolio bent from overweight to neutral last month (third panel, Chart 5), and now we highlight yet another warning shot originating across the Pacific Ocean. Bloomberg’s compiled China High-Frequency Economic Activity Index (CHFEAI) has downshifted since peaking last December, warning that investors should keep their “China” guard up. The CSI 300 is following down the path of the CHFEAI (second panel, Chart 5), and the near-term risk is that the S&P 500 may be next in line (top panel, Chart 5), as it has closely tracked China, albeit with a slight lag, since COVID-19 hit, as we first showed in our December 21, 2020 Special Report. Tack on the absence of an SPX valuation cushion, and there are rising odds that select deep cyclical/highly levered/China exposed sectors will start to sniff out some China trouble. Taking cue from Chinese financial market data is also instructive. The MSCI China stock price index, its short-term momentum, net EPS revisions and 12-month forward EPS growth all troughed last spring. It is slightly unnerving that by all these metrics China’s stock market recovery is coming off the boil and may be a precursor to a soft-patch in the coming months (Chart 6). Chart 5Monitor China Closely
Monitor China Closely
Monitor China Closely
Chart 6What Are Chinese Stocks Sniffing Out?
What Are Chinese Stocks Sniffing Out?
What Are Chinese Stocks Sniffing Out?
Importantly, select commodities, especially ones that are hypersensitive to Chinese activity, appear exhausted and have likely hit, at least a temporary, zenith. While anecdotes of metal related scams and thefts are mushrooming especially catalytic converters mostly owing to rare earths soaring prices, we would not be surprised were bronze/copper statues to start disappearing and sold for scrap, as was prevalent in the mid-2000s commodity super cycle. Dr. Copper has more than doubled in the past year, is near all-time highs and already discounts a lot of good China recovery news (top panel, Chart 7). Historically, Google Trends searches for “commodity super cycle” have been closely correlated with cyclicals/defensives relative performance and the recent spike near all-time highs likely corroborates that the Chinese recovery is well advanced (Chart 8). Chart 7Glass Ceiling
Glass Ceiling
Glass Ceiling
Chart 8“Commodity Super Cycle” Hubris?
“Commodity Super Cycle” Hubris?
“Commodity Super Cycle” Hubris?
WTI crude oil prices have also jumped over $100/bbl after hitting the negative $37/bbl mark last April. In the mid-60s/bbl crude oil has likely hit a ceiling and will have a tough time surging past this long term resistance. Sentiment is as extreme as it was during the Desert Storm in the early 1990s, which is the last time the oil RSI jumped over 80 (Chart 9)! Chart 9Slippery Slope?
Slippery Slope?
Slippery Slope?
The Australian dollar, a commodity currency levered to China’s wellbeing, has also been on a tear since last March with AUDUSD rising from 0.55 to roughly 0.80. The Aussie is currently at the upper band of its range, since the Hawke/Keating government floated it in 1983, and facing stiff resistance. There are rising odds that AUDUSD is also sniffing out some China softness in the coming months (bottom panel, Chart 7). Finally, Chinese surveys and money aggregates data also signal that a garden variety slowdown will take root, especially post the 100-year Communist Party anniversary this summer. The Chinese manufacturing PMI is awfully close to the 50 expansion/contraction line, at a time when both M1 money supply has ticked lower and the total social financing impulse has rolled over (Chart 10). Tack on our sister’s China Investment Strategy’s recent estimate of a further steep deceleration in the latter and factors are falling into place for an engineered slowdown in China in the back half of the year (bottom panel, Chart 10). Bottom Line: China is on the cusp of a slowdown, remains a key macro risk to monitor, and thus we use this opportunity to book gains in a deep cyclical industrials sub-group and downgrade to neutral. Chart 10Keep Your China Guard Up
Keep Your China Guard Up
Keep Your China Guard Up
CAT Stalling? As China’s economic growth downshifts, we are compelled to book gains in machinery stocks and downgrade to neutral. This sub-surface industrials sector move comes on the heels of last week’s upgrade in the more domestically focused railroads, and does not affect the broad sector’s overweight stance. First, machinery stocks are extremely overbought by historical standards outpacing the SPX by 36% on a year-over-year basis. Valuations have also spiked: the relative price to sales ratio is back near par and trades at a 25% premium to the historical average (Chart 11). Such lopsided positioning is fraught with danger and could at least temporarily reverse in a violent fashion. Second, while the US dollar has been boosting the industry’s exports and adding to machinery P&L via positive translation gains, the greenback’s year-to-date appreciation will eat into profits, at the margin, in the back half of the year (second & middle panels, Chart 12). Chart 11Too Far Too Fast
Too Far Too Fast
Too Far Too Fast
Chart 12First Signs Of Cracks Appearing
First Signs Of Cracks Appearing
First Signs Of Cracks Appearing
Sell-side analysts have taken notice and net profit revisions have topped out. Similarly, our EPS growth macro models suggest that machinery stocks will struggle to outearn the SPX (Chart 12). Lastly, as China goes, so go machinery stocks. The latest Chinese manufacturing PMIs hooked down and any sustained weakness will weigh heavily on demand for US machinery new orders (fourth panel, Chart 12). Tack on the waning impulse of Chinese total social financing aggregates including BCA’s downbeat forecast, and the outlook for machinery end-demand darkens further (Chart 13). Nevertheless, before getting outright bearish on machinery stocks, there are a few offsetting factors. Commodity prices, while toppy, remain firm, and alleviate fears of a severe Chinese slowdown. Moreover, Chinese excavator sales are on a tear surging to a three year high. While China’s manufacturing PMI has petered out, both the global PMI and developed market PMIs are reaccelerating. As the global economy reopens, services PMIs will further boost the global composite PMIs (second & bottom panels, Chart 14). Chart 13Chart Of The Year Candidate
Chart Of The Year Candidate
Chart Of The Year Candidate
Finally, while our relative EPS growth models hover near the zero line, the same is also true for the sell side’s profit growth estimates and represent a modest hurdle for the industry to surpass (third panel, Chart 14). Netting it all out, China’s slowdown, a grinding higher US dollar, extremely overbought technicals and historically pricey valuations, all signal that the time is ripe to book profits and downgrade machinery to neutral. Chart 14Reasons Not To Turn Outright Bearish
Reasons Not To Turn Outright Bearish
Reasons Not To Turn Outright Bearish
Bottom Line: Downgrade the S&P construction machinery & heavy trucks index to neutral today for a relative gain of 4.3% since inception. The ticker symbols for the stocks in this index are: BLBG: S5CSTF – CAT, CMI, PCAR & WAB. Anastasios Avgeriou US Equity Strategist anastasios@bcaresearch.com Footnotes 1 The Reverse Cap Weighted U.S. Large Cap ETF (Ticker: RVRS) provides exposure to the companies in the S&P 500 index. However, while traditional market cap weighted indexes such as the S&P 500 weight companies inside the index by their relative market capitalization, RVRS does the opposite, weighting companies by the inverse of their relative market cap. By investing smallest-to-biggest, the fund is tilting investment exposure to the smaller end of the market cap spectrum within the large cap space. https://exponentialetfs.com/wp-content/uploads/2021/01/Reverse-ETF-Factsheet_2020.12.311.pdf Current Recommendations Current Trades Strategic (10-Year) Trade Recommendations
Overdose?
Overdose?
Size And Style Views February 24, 2021 Stay neutral cyclicals over defensives January 12, 2021 Stay neutral small over large caps June 11, 2018 Long the BCA Millennial basket The ticker symbols are: (AAPL, AMZN, UBER, HD, LEN, MSFT, NFLX, SPOT, ABNB, V). January 22, 2018 Favor value over growth
Asian equities fell on Friday in part on negative headlines about US-China talks in Anchorage, Alaska. The two sides exchanged barbs, raising fears that a US-China diplomatic reset may not occur. However, there were also rumors that behind closed doors, the…
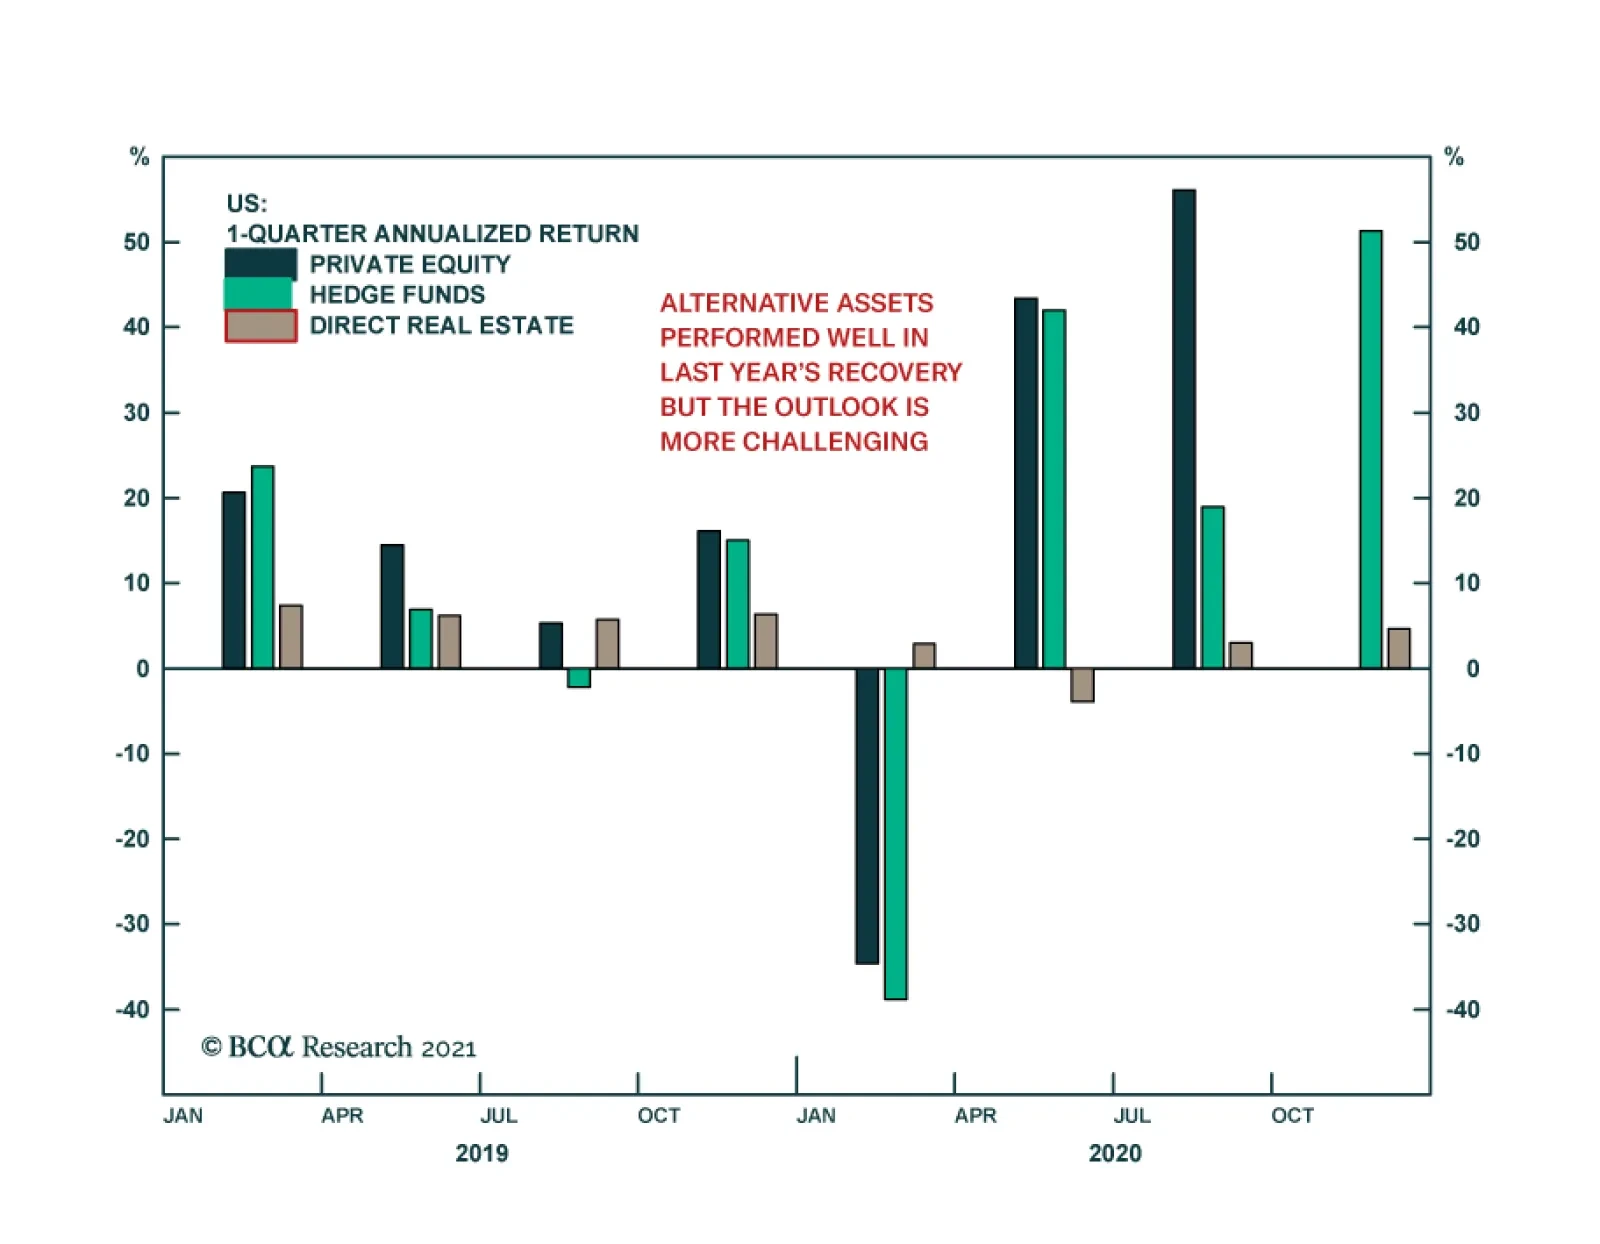
Illiquid alternative assets recovered in the last three quarters of 2020 just as listed assets did. The composite hedge fund index, according to Hedge Fund Research, returned 51% annualized in Q4. Data for private equity (PE) are not yet available for Q4, but…

BCA Research’s Foreign Exchange Strategy service concludes that the dollar will remain the global reserve currency for years to come. However, a slow pivot towards reserve diversification will act as a structural headwind for the dollar. The 2020 pandemic…
While the Fed’s dots dovishly surprised, the FOMC’s output and inflation projections were on the hawkish side. Adding the committee’s core PCE price inflation estimate for 2021 to their real GDP forecast results in a roughly 9% nominal GDP estimate, assuming the PCE and GDP deflators approximate one another. The last time the US economy hit such a high mark on a q/q annualized basis (ex-2020) was in late-2003 (Chart 1). Back then the Bush tax cuts were signed into law in late May 2003 turbocharging the economy. Chart 2 shows that the fed funds rate was pegged at 1% and the bond market was in selloff mode, with both the 10-year US Treasury yields surging violently and inflation breakevens galloping higher. While the S&P eventually shrugged off the bond market’s new equilibrium yield, drilling beneath the surface is revealing. Chart 1
Shades Of 2003/4?
Shades Of 2003/4?
Chart 2
Shades Of 2003/4?
Shades Of 2003/4?
As a reminder, back then the Fed was actually sowing the seeds of the housing bubble by keeping rates at 1%, which resulted in an economy running on steroids. Deep cyclical sectors outperformed the SPX and defensives significantly lagged the broad market especially as the economic data caught on fire in 2004 (see Appendix Charts A1, A2, A3, ). Financials were range bound and relative tech performance slumped in 2004 (for inclusion purposes Charts A4-A9 in the Appendix also show GICS2 sector relative performance). Bottom Line: Using the 2003/4 parallel as a guidepost we remain comfortable with our current positioning of preferring industrials and energy to consumer staples and communication services. Appendix Chart A1
Appendix
Appendix
Chart A2
Appendix
Appendix
Chart A3
Appendix
Appendix
Chart A4
Appendix
Appendix
Chart A5
Appendix
Appendix
Chart A6
Appendix
Appendix
Chart A7
Appendix
Appendix
Chart A8
Appendix
Appendix
Chart A9
Appendix
Appendix
Dear client, Next week, in lieu of our weekly report, I will be hosting a webcast on Thursday, March 25 at 10:00 am EDT and Friday March 26 at 9:00 am HKT. I look forward to your comments and questions during the webcast. Best regards, Chester Highlights During bear markets, counter-trend rallies in the dollar are capped around 4%. This time should be no different. Meanwhile, unless the Fed tightens policy to stem the increase in aggregate demand, inflation will rise and real short rates will drop. The relative equity performance of the US is critical for the dollar. Reserve diversification out of dollars has also started to place a natural ceiling against other developed market currencies. An attractive opportunity is emerging to short the AUD/CAD cross. Feature The 1.7% rise in the US dollar this year is reinvigorating the bull case. When presenting our key views last year, we highlighted that the DXY index was at risk of a 2-4% bounce.1 We reaffirmed this view in our January report: Sizing A Potential Dollar Bounce. At the time, the DXY index was at the 90 level, suggesting the rally should fizzle around 94. Therefore, the key question is whether the nascent rise in the DXY will punch through this level, or fade as we originally expected. The short-term case for the dollar remains bullish. The currency is much oversold. Meanwhile, real interest rates are moving in favor of the US, vis-à-vis a few countries. Third and interrelated, economic momentum in the US is quite strong, compared to other G10 countries. With the rising specter of a market correction, the dollar could also benefit from safe haven flows towards the US. The Federal Reserve’s meeting yesterday certainly reaffirmed that short-term rates will remain anchored near zero, at least until 2023. The Fed does not see inflation much above 2% a couple of years out. Nevertheless, a lot can change in the coming months. Cycles, Positioning And Interest Rates The dollar tends to move in long cycles, with the latest bull and bear markets lasting about a decade or so. In other words, the dollar is a momentum currency. As such, determining which regime you are in is critical to assessing the magnitude of any rally. This is certainly the case when sentiment remains overly dollar bearish, as now. During bear markets, counter-trend rallies in the dollar are capped around 4-6%. This was what happened in the early 2000s. In bull markets, such as after the financial crisis, the dollar achieves escape velocity, with more durable rallies well into the teens (Chart I-1). So far, the current rise still fits within the narrative of a healthy reset in a longer-term bear market. Chart I-1The Dollar Rally Is Still Benign
The Dollar Rally Is Still Benign
The Dollar Rally Is Still Benign
Long interest rates have also been moving in favor of the dollar, especially relative to the euro area, Japan, and even Sweden. Currencies are driven by real interest rate differentials, and higher US yields are bullish. With the Fed giving no indication it will prevent the curve from steepening further, US interest rates could keep gaping higher. However, currencies are about relative rate differentials, and the rise in US interest rates has not been in isolation. Rates in the UK, Australia and New Zealand, countries that have managed the COVID-19 crisis pretty well, are beginning to rise faster than in the US (Chart I-2). Chart I-2A Synchronized Rise In Global Yields
A Synchronized Rise In Global Yields
A Synchronized Rise In Global Yields
US Versus World Growth The rise in US interest rates has been justified by better economic performance. Whether looking at purchasing managers’ indices, economic surprise indices, or even GDP growth expectations, the US has had the upper hand (Chart I-3). The Fed expects US growth to hit 6.5% this year. This is well above what other central banks expect for their domestic economies. The ECB expects 4%, the BoJ expects 3.9%, and the BoC expects 4.6% (Table I-1). Chart I-3AThe US Leads In Growth This Year
The US Leads In Growth This Year
The US Leads In Growth This Year
Chart I-3BThe US Leads In Growth This Year
The US Leads In Growth This Year
The US Leads In Growth This Year
Table I-1The US Leads In Growth And Inflation This Year
Arbitrating Between Dollar Bulls And Bears
Arbitrating Between Dollar Bulls And Bears
However, economic dominance can be transient, especially in a world of flexible exchange rates. For one, a higher dollar will sap US growth via the export channel. This is especially the case since the starting point is an expensive currency. On a real effective exchange rate basis, the dollar is above its long-term mean (Chart I-4). Meanwhile, we expect the rest of the world to perform better as economies reopen. The services PMI in the US is already close to a cyclical high, similar to Sweden (Chart I-5). These are among the countries with the least stringent COVID-19 measures in the western hemisphere. This suggests that other economies, even manufacturing-centric ones, could see a coiled-spring rebound in growth as we put this pandemic behind us. Chart I-4The Dollar Is Expensive
The Dollar Is Expensive
The Dollar Is Expensive
Chart I-5The US Service PMI Is At A Cyclical High
The US Service PMI Is At A Cyclical High
The US Service PMI Is At A Cyclical High
The sweet spot for most economies is when growth is rising but inflation is low, allowing the resident central bank to keep policy dovish. However, it is an open question if the US can continue to boost spending, without a commensurate rise in inflation. The OECD estimates that the US output gap will close by 2022, with the $1.9-trillion fiscal package. This will put the US well ahead of any G10 country (Chart I-6). Unless the Fed tightens policy to stem the increase in aggregate demand, inflation will rise and real rates will drop (Chart I-7). Rising nominal rates and falling real yields will be anathema to the dollar. Chart I-6The US Output Gap Will Soon Close
The US Output Gap Will Soon Close
The US Output Gap Will Soon Close
Chart I-7Wages And Inflation Should Inch Higher
Wages And Inflation Should Inch Higher
Wages And Inflation Should Inch Higher
Equity Rotation And The Dollar A currency manager once noted that the most important variable to pay attention to when making FX allocations is relative equity performance. This might seem bizarre at first blush, but stands at the center of what an exchange rate is – a mechanism that equalizes rates of return across countries. As such while bond flows are important for exchange rates, equity flows matter as well. The relative equity performance of the US is critical for two reasons. First, the US equity market tends to do relatively better during bear markets. This was the case last year and during the 2008 crisis. Second, the outperformance of the US over the last decade has dovetailed with a dollar bull market (Chart I-8). It is rare to find a currency that has performed well both during equity bull and bear markets. If past is prologue, the near-term risks for the dollar are to the upside, especially if the market rally encounters turbulence as yields rise. The put/call ratio in the US is at a 5-year nadir. A move towards parity could violently pull up the DXY index (Chart I-9). However, a garden-variety 5-10% correction in the SPX should correspond to a shallow bounce in the DXY. This will also fit the pattern of bear market USD rallies, as we already highlighted in Chart I-1. Chart I-8US Equity Relative Performance And The Dollar
US Equity Relative Performance And The Dollar
US Equity Relative Performance And The Dollar
Chart I-9The Dollar Could Rise In ##br##A Market Reset
The Dollar Could Rise In A Market Reset
The Dollar Could Rise In A Market Reset
At the same time, any correction could usher in a violent rotation from cyclicals to defensives, especially if underpinned by higher interest rates. The performance of energy and financials are a leap ahead of other sectors in the S&P 500 this year. Importantly, they also massively outperformed during the February drawdown. Meanwhile, valuations are heavily elevated in the US compared to the rest of the world. This is true for growth sectors compared to value, and cyclicals compared to defensives. Throughout history, both exchange rates and valuations have tended to mean revert. Long-Term Dollar Outlook The 2020 pandemic was a one-in-a-hundred-year event. Coordinated fiscal and monetary stimuli have ushered in a new economic cycle. As a counter-cyclical currency, the dollar tends to do poorly (Chart I-10). This is because monetary stimulus provides more torque to economies levered to the global cycle. Once growth achieves escape velocity, the currencies of these more pro-cyclical economies benefit. The IMF projects that non-US growth should outpace US growth after 2021. Meanwhile, it is an open question that any rally in the dollar will be durable. The key driver behind the dollar increase in 2020 was a global shortage. Not only has the Fed extended its liquidity provisions to foreign central banks until September this year, the share of offshore US dollar debt issuance has fallen by a full 9 percentage points (Chart I-11). Simply put, the Fed is flooding the system with dollar liquidity at the same time that foreign entities are weaning themselves off it Chart I-10The IMF Expects Faster Growth Outside The US After 2021
The IMF Expects Faster Growth Outside The US After 2021
The IMF Expects Faster Growth Outside The US After 2021
Chart I-11Share Of US Dollar Debt ##br##Rolling Over
Arbitrating Between Dollar Bulls And Bears
Arbitrating Between Dollar Bulls And Bears
The reason behind this is balance-of-payment dynamics. The market has realized that ballooning twin deficits in the US come at a cost. For foreign issuers, it is the prospect of rolling over US-denominated debt at a much higher coupon rate. For bond investors, it is currency depreciation, especially if fiscal largesse becomes too “sticky,” and stokes inflation. As such, bond investors continue to avoid the US, despite rising rates (Chart I-12). Finally, reserve diversification out of dollars has started to place a natural ceiling on the US dollar, especially against other developed market currencies. Ever since the trend began to accelerate in 2015, the DXY has been unable to sustainably punch through the 100 level (Chart I-13). This will place a durable floor under developed market currencies in general and gold in particular. The Chinese RMB has also been gaining traction in global FX reserves. Chart I-12Little Appetite For US ##br##Treasurys
Little Appetite For US Treasurys
Little Appetite For US Treasurys
Chart I-13Reserve Diversification Has Been A Headwind For The Dollar
Reserve Diversification Has Been A Headwind For The Dollar
Reserve Diversification Has Been A Headwind For The Dollar
More specifically, the role of the USD/CNY exchange rate as a key anchor for emerging market currencies will rise, especially if the RMB remains structurally strong.2 The People’s Bank of China has massive foreign exchange reserves, worth about US$3.2 trillion. This means it can provide swap agreements that will almost cover the totality of EM foreign dollar debt. Swap agreements entail no exchange of currency, but are about confidence. The PBoC can instill this confidence in countries that have low and/or falling foreign exchange reserves. The dollar will remain the global reserve currency for years to come. However, a slow pivot towards reserve diversification will act as a structural headwind for the dollar. Housekeeping Chart I-14AUD/CAD Is Correlated To The VIX
Arbitrating Between Dollar Bulls And Bears
Arbitrating Between Dollar Bulls And Bears
We were stopped out of our CAD/NOK trade for a profit of 3.1%. The resilience of the US economy is benefiting the CAD more than the NOK for now. However, the Norges Bank confirmed it might be one of the first central banks to lift rates, as early as this year. We are both short USD/NOK and EUR/NOK and recommend sticking with these positions. Second, the growing spat between the EU and the UK could lead to more volatility in our short EUR/GBP position. Our target remains 0.8, but we are tightening stops to 0.865 to protect profits. The BoE left interest rates unchanged, but struck a constructive tone. This will bode well for cable, beyond near-term volatility. Third, our short USD/JPY position was stopped out amid the dollar rally. We are standing aside for now, but will reopen this trade later. Finally, a rise in volatility will boost the dollar, but also benefit short AUD/CAD positions. We are already short the AUD/MXN, but short AUD/CAD could be more profitable should market turmoil persist (Chart I-14). Chester Ntonifor Foreign Exchange Strategist chestern@bcaresearch.com Footnotes 1 Please see the Foreign Exchange Strategy Special Report, titled “2021 Key Views: Tradeable Themes,” dated December 4, 2020. 2 Please see Foreign Exchange Strategy Currency In-Depth Report, titled “Will The RMB Continue To Appreciate?,” dated February 26, 2021. Currencies U.S. Dollar Chart II-1USD Technicals 1
USD Technicals 1
USD Technicals 1
Chart II-2USD Technicals 2
USD Technicals 2
USD Technicals 2
Most data out of the US has been robust: Both PPI, import and export prices were in line with expectations for February. The PPI ex food and energy came in at 2.5% year-on-year. Empire manufacturing was robust at 17.4 in March, versus 12.1 last month. Housing starts and building permits came in a nudge below expectations in February, at 1421K and 1682K. The one disappointment was retail sales, which fell 3.3% year-on-year in February. The DXY index rose slightly this week. The FOMC remained dovish, without any revision to its median path of interest rate hikes. The markets disliked its reticence on rising long-bond yields. As such, equities are rolling over as yields continue to creep higher. Report Links: The Dollar Bull Case Will Soon Fade - March 5, 2021 Are Rising Bond Yields Bullish For The Dollar? - February 19, 2021 Portfolio And Model Review - February 5, 2021 The Euro Chart II-3EUR Technicals 1
EUR Technicals 1
EUR Technicals 1
Chart II-4EUR Technicals 2
EUR Technicals 2
EUR Technicals 2
Recent data from the euro area are mending: The ZEW expectations survey rose to 74 in March, from 69.6. For Germany, the improvement was better at 76.6 from 71.2. The trade balance remained at a healthy €24.2bn euro surplus in January. The euro fell by 0.6% amidst broad dollar strength. With the ECB committed to cap the rise in yields and rise in peripheral spreads, relative interest rates will move against the euro. Sentiment remains elevated, and so a healthy reset is necessary to wash out stale longs. Report Links: Portfolio And Model Review - February 5, 2021 On Japanese Inflation And The Yen - January 29, 2021 The Dollar Conundrum And Protection - November 6, 2020 The Japanese Yen Chart II-5JPY Technicals 1
JPY Technicals 1
JPY Technicals 1
Chart II-6JPY Technicals 2
JPY Technicals 2
JPY Technicals 2
Recent data from Japan has been mixed: Core machinery orders grew 1.5% year-on-year in January. Exports fell by 4.5% in January, while imports rose by 11.8%. This has shifted the adjusted trade balance to a deficit of ¥38.7bn yen. The Japanese yen fell by 0.4% against the US dollar this week, and remains the weakest G10 currency this year. Rising yields have seen Japanese investors stampede into overseas markets such as the UK, while pushing down the yen. We remain yen bulls, but will stand aside for now since it could still go lower in the short term. Report Links: The Dollar Bull Case Will Soon Fade - March 5, 2021 On Japanese Inflation And The Yen - January 29, 2021 The Dollar Conundrum And Protection - November 6, 2020 British Pound Chart II-7GBP Technicals 1
GBP Technicals 1
GBP Technicals 1
Chart II-8GBP Technicals 2
GBP Technicals 2
GBP Technicals 2
Recent data out of the UK have been weak: Industrial production and construction output fell by 4.9% and 3% year-on-year in January. Monthly GDP growth fell by 2.9% in January. Rightmove house prices rose 2.7% year-on-year in March. The pound fell by 0.4% against the dollar this week. It however remains the best performing currency this year. The BoE kept monetary policy on hold, but struck a hawkish tone as vaccination progresses, giving way to higher mobility in the summer. We remain long sterling via the euro. Report Links: Portfolio And Model Review - February 5, 2021 The Dollar Conundrum And Protection - November 6, 2020 Revisiting Our High-Conviction Trades - September 11, 2020 Australian Dollar Chart II-9AUD Technicals 1
AUD Technicals 1
AUD Technicals 1
Chart II-10AUD Technicals 2
AUD Technicals 2
AUD Technicals 2
Recent data in Australia was robust: Home prices rose by 3.6% in the fourth quarter. Modest home appreciation is welcome news by the RBA, given high-flying prices in its antipodean neighbor. The employment report was solid. There were 88.7K new jobs in February, all full-time. This pushed down the unemployment rate to 5.8% from 6.4%. The Aussie fell by 0.4% this week. The Australian recovery is fast approaching escape velocity, forcing the RBA to contain a more pronounced rise in long-bond yields. We remain long AUD/NZD. In the very near term, a market shakeout could pull the Aussie lower, favoring short AUD/CAD positions. Report Links: The Dollar Bull Case Will Soon Fade - March 5, 2021 Portfolio And Model Review - February 5, 2021 Australia: Regime Change For Bond Yields & The Currency? - January 20, 2021 New Zealand Dollar Chart II-11NZD Technicals 1
NZD Technicals 1
NZD Technicals 1
Chart II-12NZD Technicals 2
NZD Technicals 2
NZD Technicals 2
Recent data out of New Zealand was weak: Credit card spending fell by 10.6% year-on-year in January. Q4 GDP contracted by 1% both year-on-year and quarter-on-quarter. The current account remains in deficit at NZ$-2.7bn for Q4. The New Zealand dollar fell by 0.9% against the US dollar this week. The new rule to include house prices in setting monetary policy will be a logistical nightmare for the RBNZ. In trying to achieve financial stability, the RBNZ will have to forego some economic stability, especially if the country still requires accommodative settings. Confused messaging could also introduce currency volatility. Report Links: Portfolio And Model Review - February 5, 2021 Currencies And The Value-Versus-Growth Debate - July 10, 2020 Updating Our Balance Of Payments Monitor - November 29, 2019 Canadian Dollar Chart II-13CAD Technicals 1
CAD Technicals 1
CAD Technicals 1
Chart II-14CAD Technicals 2
CAD Technicals 2
CAD Technicals 2
There was a data dump in Canada this week: The economy added 259.2K jobs in February. This pushed down the unemployment rate from 9.4% to 8.2%. Wages also increased by 4.3% in February. The Nanos confidence index rose from 60.5 to 62.7 in the week of March 12. Housing starts rose by 246K in February, as expected. The BoC’s preferred measures of CPI came in close to the 2% target. Headline CPI was weaker at 1.1% in February. The Canadian dollar rose by 0.3% against the US dollar this week. The correction in oil prices could set the tone for the near-term performance of the loonie, despite robust domestic conditions. However, at the crosses, CAD should have upside. We took profits on our short CAD/NOK position this week. Report Links: Will The Canadian Recovery Lead Or Lag The Global Cycle? - February 12, 2021 Currencies And The Value-Versus-Growth Debate - July 10, 2020 More On Competitive Devaluations, The CAD And The SEK - May 1, 2020 Swiss Franc Chart II-15CHF Technicals 1
CHF Technicals 1
CHF Technicals 1
Chart II-16CHF Technicals 2
CHF Technicals 2
CHF Technicals 2
There was scant data out of Switzerland this week: Producer and import prices fell by 1.1% year-on-year in February. February CPI releases also suggest the economy remains in deflation. The Swiss franc fell by 0.4% against the US dollar this week. Safe-haven currencies continue to be sold as yields rise, making the Swiss franc the worst performing currency this year after the yen. This is welcome news for the SNB. We have been long EUR/CHF on this expectation, and recommend investors to stick with this trade. Report Links: Portfolio And Model Review - February 5, 2021 The Dollar Conundrum And Protection - November 6, 2020 On The DXY Breakout, Euro, And Swiss Franc - February 21, 2020 Norwegian Krone Chart II-17NOK Technicals 1
NOK Technicals 1
NOK Technicals 1
Chart II-18NOK Technicals 2
NOK Technicals 2
NOK Technicals 2
There was scant data out of Norway this week: The trade balance remained in surplus of NOK 25.1bn in February. The Norges bank kept interest rates on hold at 0%. The NOK fell by 1.2% against the dollar this week. The trigger was the selloff in oil prices. However, with the Norges bank signaling a rate hike later this year, placing it ahead of its G10 peers, there is little scope for the NOK to fall durably. Inflation in Norway is above target, and higher mobility later this year will benefit oil-rich Norway. We are long the Norwegian krone as a high-conviction bet against both the dollar and the euro. Report Links: Portfolio And Model Review - February 5, 2021 Revisiting Our High-Conviction Trades - September 11, 2020 A New Paradigm For Petrocurrencies - April 10, 2020 Swedish Krona Chart II-19SEK Technicals 1
SEK Technicals 1
SEK Technicals 1
Chart II-20SEK Technicals 2
SEK Technicals 2
SEK Technicals 2
Swedish data releases were a slight miss: Headline CPI came in at 1.4% in February. Core CPI came in at 1.2%. The unemployment rate remained at 8.9% in February. The Swedish krona fell by 0.8% against US dollar this week. Sweden is struggling to contain another wave of the pandemic and this has weighed on the currency this year. The saving grace for the economy has been a global manufacturing cycle that continues humming. Until Sweden is able to get past the pandemic, the currency will continue trading in a stop-and-go pattern. We remain long the SEK on cheap valuations and as a play on the global industrial cycle. Report Links: Revisiting Our High-Conviction Trades - September 11, 2020 Updating Our Balance Of Payments Monitor - November 29, 2019 Where To Next For The US Dollar? - June 7, 2019 Trades & Forecasts Forecast Summary Core Portfolio Tactical Trades Limit Orders Closed Trades
Highlights The Federal Reserve’s ultra-dovish stance is not the only reason for markets to cheer. The US is booming, China is unlikely to overtighten monetary and fiscal policy, and Europe remains a source of positive political surprises. Still, the cornerstone of this cycle’s wall of worry has been laid: Biden faces a series of foreign policy challenges, the US is raising taxes, China is tightening policy, and Europe’s stimulus is not large enough to qualify as a game changer for potential GDP growth. Stay the course by maintaining strategic pro-cyclical trades yet building up tactical hedges and safe-haven plays. Feature Chart 1US Stimulus, Chinese Tightening, German Vaccine Hiccups
US Stimulus, Chinese Tightening, German Vaccine Hiccups
US Stimulus, Chinese Tightening, German Vaccine Hiccups
The US is turning to tax hikes, China is returning to structural reforms, and Europe is bungling its vaccine rollout. Yet synchronized global debt monetization is nothing to underrate. Especially not in the context of a Great Power struggle that features a green energy race as well as a high-tech race. Governments are generating a cyclical growth boom and it is conceivably that their simultaneous pump-priming combined with a new capex cycle and private innovation could generate a productivity breakthrough. This upside risk is keeping global equity markets bullish even as it becomes apparent that construction has begun on this cycle’s wall of worry. The US dollar bounce should be watched closely in this context (Chart 1). After passing the $1.9 trillion American Rescue Plan Act, which consists largely but not entirely of short-term cash handouts (Chart 2), President Joe Biden’s policy agenda will now turn to tax hikes. Thus far the tax hike proposals are in line with Biden’s campaign literature (Table 1). It remains to be seen whether the market will “sell the news” that Biden is pivoting to tax hikes. After all, Biden was the most moderate of the Democratic candidates and his tax proposals only partially reverse President Trump’s tax cuts. Chart 2American Rescue Plan Act
Building Back … The Wall Of Worry
Building Back … The Wall Of Worry
Table 1Biden’s Tax Hike Proposals On The Campaign Trail
Building Back … The Wall Of Worry
Building Back … The Wall Of Worry
Nevertheless higher taxes symbolize a regime change in the US – it is very unlikely tax rates will go down anytime soon but they could go easily higher than expected in the coming decade – and the drafting process will bring negative surprises, as Treasury Secretary Janet Yellen highlighted by courting Europe to cooperate on a 12% minimum corporate tax and halt the global race to the bottom in taxes on multinational corporations. At the same time Biden’s foreign policy challenges are rising across the board: China is demanding a rollback of Trump’s policies: If Biden says yes, he will sacrifice hard-won American leverage on matters of national interest. If he says no, the Phase One trade deal will be null and void, as will sanctions on Iran and North Korea, and the new economic sanctions on Taiwan will expand beyond mere pineapples.1 Russia is recalling its US ambassador: Biden vowed to make Russia pay for alleged interference in the 2020 US election and sanctions are forthcoming.2 The real way to make Russia pay is to halt the construction of the Nordstream II natural gas pipeline, which reduces the leverage of eastern European democracies while increasing Germany’s energy dependence on Russia. But Germany is dead-set on that pipeline. If Biden levies sanctions the centerpiece of his diplomatic outreach to Europe will be further encouraged to chart an independent course from Washington (though the rest of Europe might cheer). North Korea is threatening to restart missile tests: North Korea is pouring scorn on the Biden administration for trying to restart negotiations.3 The North wants sanctions relief and it knows that Biden is willing to offer it but it may need to create an atmosphere of crisis first. China would be happy were that to happen as it could offer the US its good services on North Korea instead of concrete trade concessions. Iran is refusing to rejoin negotiations over the 2015 nuclear deal: Biden has about five months to arrange for the US and Iran to rejoin the 2015 nuclear deal. Beyond that he will enter into another long negotiation with the master negotiators, the Persians. But unlike President Obama from 2009-15, he will not have support from Russia and China … unless he sacrifices his doctrine of “extreme competition” from the get-go. It is not clear which of these challenges will be relevant to financial markets, or when. However, with US and global equities skyrocketing, it must be said that the geopolitical backdrop is not nearly as reassuring as the Federal Reserve, which announced on Saint Patrick’s Day that it will not hike interest rates until 2024 even in the face of a 6.5% growth rate and the prospect of an additional, yet-to-be passed $2 trillion in US deficit spending. Herein lies Biden’s first victory. He has stressed that boosting the American economy and middle class is critical to his foreign policy. He envisions the US regaining its global standing by defeating the virus, super-charging the economy, and then orchestrating a grand alliance of European and Asian democracies to write new global rules that will put pressure on China to reform its economy. “I say it to foreign leaders and domestic alike. It's never, ever a good bet to bet against the American people. America is coming back. The development, manufacturing, and distribution of vaccines in record time is a true miracle of science.”4 The pandemic and economic part of this agenda are effectively done and now comes the hard part: creating a grand alliance while China and Russia demonstrate to their neighbors the hard consequences of joining any new US crusade. The contradiction of Biden’s foreign policy is his desire to act multilaterally and yet also get a great deal done. The Europeans are averse to conflict with China and Russia. The Russians and Chinese are not inclined to do any great favors on Iran or North Korea. Nobody is opening up their economy – Biden himself is coopting Trump’s protectionism, if less brashly. Cooperation with Presidents Xi Jinping and Vladimir Putin on nuclear proliferation is possible – as long as Biden aborts his democracy agenda and his trade agenda. We continue with our pro-cyclical investment stance but have started building up hedges as we are convinced that geopolitical risk will deliver a rude awakening. This awakening will be a buying opportunity given the ultra-stimulating backdrop … unless it portends war in continental Europe or the Taiwan Strait. In the remainder of this report we highlight the takeaways from China’s National People’s Congress as well as recent developments in Germany. Our key views remain the same: China will not overtighten monetary/fiscal policy; Biden will be hawkish on China; Germany’s election may see an upset but that would be market-positive. China: No Overtightening So Far China concluded its National People’s Congress – the “Two Sessions” of legislation every year – and issued its 2021 Government Work Report. It also officially released the fourteenth five-year plan covering economic development for 2021-25. Table 2 shows the new plan’s targets as compared to the just expired thirteenth five-year plan that covered 2016-20. Table 2China’s Fourteenth Five Year Plan (2021-25)
Building Back … The Wall Of Worry
Building Back … The Wall Of Worry
For a full run-down of the National People’s Congress we recommend clients peruse BCA’s latest China Investment Strategy report. From a geopolitical point of view we would highlight the following takeaways: The Tech Race: China added a new target for strategic emerging industry value added as percent of GDP – it wants this number to reach 17% by 2025 but there is nothing solid to benchmark this against. The point is that by including such a target China is putting more emphasis on emerging industries, including: information technology, robotics, green energy, electric vehicles, 5G networks, new materials, power equipment, aerospace and aviation equipment, and others. China’s technological “Great Leap Forward” continues, with a focus on domestic production and upgrading the manufacturing sector that is bound to stiffen the competition with the United States. China’s removal of a target for service industry growth suggests that Beijing does not want de-industrialization to occur any faster – another reason for global trade tensions to stay high. Research and Development: For R&D spending, previous five-year plans set targets for the desired level. For example, over the last five years China vowed to increase annual R&D spending to 2.5% of GDP. A reasonable expectation for the coming five years would have been a 3% target of GDP. However, this time the government set a target of an annual growth rate of no less than 7% during 2021-2025. The point is that China is continuing to ascend the ranks in R&D spending relative to the US and West in coordination with the overarching goal of forging an innovative and high-tech economy. Unemployment: China has restored an unemployment rate target. In its twelfth five-year plan Beijing aimed to keep the urban surveyed unemployment rate below 5% but over the past five years this target vanished. Now China restored the target and bumped it up slightly to 5.5%. This target should not be hard to meet given the reported sharp decline in urban unemployment to 5.2% already. However, China’s unemployment statistics are notoriously unreliable. The real takeaway is that unemployment will be higher as trend growth slows, while social stability remains the Communist Party’s ultimate prize – and any reform or deleveraging process will occur within that context. The Green Energy Race: China re-emphasized its pledge to tackle climate change, aiming for peak carbon emissions by 2030 and carbon neutrality by 2060. However, no detailed action plans were mentioned. Presumably China will not loosen its enforcement of existing environmental targets. Most of these were kept the same as over the past five years, except for pollution (PM2.5 concentration). Previously the government sought to reduce PM2.5 concentration by 18%. Now the target is set at 10% aggregate reduction, which is lower, though further reduction will be difficult after a 43% drop since 2014. Overall, China has not loosened up its environmental targets – if anything, enforcement will strengthen, resulting in an ongoing regulatory headwind to “Old China” industries. Military Power: Last week we noted that the government’s goals for the military have changed in a way that reinforces themes of persistently high geopolitical tensions. The info-tech upgrades to the People’s Liberation Army were supposed to be met by 2020, with full “modernization” achieved by 2035. However, last October the government created a new deadline, the one-hundredth anniversary of the PLA in 2027 (“military centenary goal”). No specific measures or targets are given but the point is that there is a new deadline of serious importance – an importance that matches the party’s much-ballyhooed centennial on July 1 of 2021 and the People’s Republic’s centennial in 2049. The fact that this deadline is only six years away suggests that a rapid program of military reform and upgrade is beginning. The official defense spending growth target of 6.8% is only slightly bigger than last year’s 6.6% but these targets mask the significance of the announcement. The takeaway is that the Chinese military is preparing for an earlier-than-expected contingency with the United States and its allies. What about China’s all-important monetary, fiscal, and quasi-fiscal credit targets? There is no doubt that China is tightening policy, as we highlight in our updated China Policy Tightening Checklist (Table 3). But will China overtighten? Probably not, at least not judging by the Two Sessions, but the risk is not negligible. Table 3A Checklist For Chinese Policy Tightening
Building Back … The Wall Of Worry
Building Back … The Wall Of Worry
The government reiterated that money and credit growth should remain in a reasonable range in 2021, with “reasonable range” referring to nominal economic growth. Chinese economists estimate that the nominal growth rate will be around 8%-9% in 2021. The IMF projection is 8.1%, while latest OECD forecast is at 7.8%.5 Because China’s total private credit (total social financing) growth is inherently higher than M2 growth, we would use pre-pandemic levels as our benchmark for whether the government will tighten policy excessively: If total social financing growth plunges below 12%, then our view is disproved and Beijing is over-tightening (Chart 3). If M2 growth plunges below 8%, we can call it over-tightening. Anything above these benchmarks should be seen as reasonable and expected tightening, anything below as excessive. However, the Chinese and global financial markets could grow jittery at any time over the perennial risk of a policy mistake whenever governments try to prevent excessive leverage and bubbles. As for fiscal policy, the new quotas for local government net new bond issuance point to expected rather than excessive tightening. New bonds can be used to finance capital investment projects. The quota for total new bond issuance is 4.47 trillion CNY, down by 5.5% from last year. Though local governments may not use up all of the quota, the reduction is small. In fact, total local government bond issuance will be a whisker higher in 2021 than in 2020. The quota for net new bonds is only slightly below the 2020 level and much higher than the 2019 level. Therefore the chance of fiscal overtightening is small – and smaller than monetary overtightening. Chart 3China Policy Overtightening Benchmark
China Policy Overtightening Benchmark
China Policy Overtightening Benchmark
Chart 4China’s Real Budget Deficit Is Huge
Building Back … The Wall Of Worry
Building Back … The Wall Of Worry
China’s official budget balance is a fiction so we look at the IMF’s augmented net lending and borrowing, which reached a whopping -18.2 % of GDP in 2020. It is expected to decrease gradually to -13.8% by 2025. That level will be slightly higher than the pre-pandemic level from 2017-2019 (Chart 4).6 By contrast, China’s total augmented debt is expected to keep rising in the coming years and reach double the 2015 level by 2025. Efforts to constrain debt could lead to a larger debt-to-GDP ratio if growth suffers as a consequence, as our Global Investment Strategy points out. So China will tighten cautiously – especially given falling productivity, higher unemployment, and the threat of sustained pressure from the US and its allies. US-China: Biden As Trump-Lite Chinese and US officials will convene in Alaska on March 18-19. This is the first major US-China meeting under the Biden administration and global investors will watch closely to see whether tensions will drop. So far tensions have not fallen, highlighting a persistent and once again underrated risk to the global equity rally. Biden’s foreign policy team has not completed its review of China policy and Presidents Biden and Xi Jinping are trying to schedule a bilateral summit in April – so nothing concrete will be decided before then. Chart 5US-China: Beijing's Standing Offer
US-China: Beijing's Standing Offer
US-China: Beijing's Standing Offer
The Biden administration is setting up a pragmatic policy, offering areas to engage with China while warning that it will not compromise on democratic values or national interests. China would welcome the opportunity to work with the Americans on nuclear non-proliferation, namely North Korea and Iran, as this would expend US leverage on an area of shared interest while leaving China a free hand over its economic and technological policies. China at least partially enforced sanctions on these countries in response to President Trump’s demands during the trade war and official statistics suggest it continues to do so. Oil imports from Iran remain extremely low while Chinese business with North Korea is, on paper, nil (Chart 5). If this data is accurate then North Korea’s economy has not benefited from China’s stimulus and snapback. If true, then Pyongyang will offer partial concessions on its nuclear program in exchange for sanctions relief. At the moment, instead of staging any major provocations to object to US-Korean military drills, the North is using fiery language and threatening to restart missile tests. This suggests a diplomatic opening. But investors should be prepared for Pyongyang to stage much bigger provocations than missile tests. In March 2010, while the world focused on the financial crisis, the North Koreans torpedoed a South Korean corvette, the Chonan, and shelled some islands, at the risk of a war. The problem under the Trump administration was that Trump wanted a verifiable and durable deal of economic opening for denuclearization whereas the North Koreans wanted to play for time, reduce sanctions, study the data from their flurry of missile tests during the Obama and early Trump years, and see if Trump would get reelected before offering any concrete concessions. Trump’s stance was not really different from Bill Clinton’s but he tried to accelerate the timeline and go for a big win. By Trump’s losing the election North Korea bought four more years on the clock. Chart 6US-China: Biden Lukewarm On China
Building Back … The Wall Of Worry
Building Back … The Wall Of Worry
The Biden administration is willing to play for time if it gets concrete results in phases. This would keep North Korea at bay and retain a line of pragmatic engagement with Beijing. But if North Korea stages a giant provocation Biden will not hesitate to use threats of destruction like Clinton and Trump did. The American public is not much concerned about North Korea (or Iran) but is increasingly concerned about China, with a recent Gallup opinion poll showing that nearly 50% view China as America’s greatest enemy and Americans consistently overrate China’s economic power (Chart 6). Biden will not let grassroots nationalism run his policy. But it is true that he has little to gain politically from appearing to appease China. With progress at hand on the pandemic and economic recovery, Biden will devote more attention to courting the allies and attempting to construct his alliance of democracies to meet global challenges and to “stand up” to China and Russia. The allies, however, are risk-averse when it comes to confronting China. This is as true for the Europeans as it is for China’s Asian neighbors, who stand directly in its firing line. In fact, Europe’s total trade with China is equivalent to that of the US (Chart 7). The Europeans have said that they will pursue tougher trade enforcement through the World Trade Organization, which would tie the Biden administration’s hands. Biden and his cabinet officials insist that they will use the “full array” of tools at their disposal (e.g. tariffs and sanctions) to punish China for mercantilist trade policies. Chinese negotiators are said to be asking explicitly for Biden to roll back Trump’s policies. Some of these policies relate to trade and tech acquisition, others to strategic disputes. We doubt that Biden will compromise on the trade issues to get cooperation on North Korea and Iran. But he will have to offer major concessions if he wants durable denuclearization agreements on these rogue states. Otherwise it will be clear that his administration is mostly focused on competition with China itself and willing to sideline the minor nuclear aspirants. Our expectation is that Americans care about the China threat and the smaller threats will be used as pretexts with which to increase pressure and sanctions on China. Asian equities have corrected after going vertical, as expected. But contrary to our expectations geopolitics was not the cause (Chart 8). This selloff could eventually create a buying opportunity if the Biden administration is revealed to take a more dovish line on China, trade, and tech in exchange for progress on strategic disputes like North Korea. Any discount due to North Korean provocations in particular would be a buy. On Taiwan, however, China’s new 2027 military target underscores our oft-recited red flag. Chart 7EU Risk Averse On China
EU Risk Averse On China
EU Risk Averse On China
Chart 8Asian Equity Correction And GeoRisk Indicators
Asian Equity Correction And GeoRisk Indicators
Asian Equity Correction And GeoRisk Indicators
Bottom Line: Investors should stay focused on the US-China relationship. What matters is Biden’s first actions on tariffs and high-tech exports. So far Biden is hawkish as we anticipated. Investors should fade rumors of big new US-China cooperation prior to the first Biden-Xi summit. Any major North Korean aggression will create a buy-on-the-dips opportunity. Unless it triggers a war, that is – and the threshold for war is high given the Chonan incident in 2010. Germany: Markets Wake Up To Election Risk – And Smile This week’s election in the Netherlands delivered a fully expected victory to Prime Minister Mark Rutte’s liberal coalition. The German leadership ranks next to the Dutch in terms of governments that received an increase in popular support as a result of the COVID-19 crisis (Chart 9). However, in Germany’s case the election outcome is not a foregone conclusion. Chart 9German Leadership Saw Popularity Bounce
Building Back … The Wall Of Worry
Building Back … The Wall Of Worry
As we highlighted in our annual forecast, an upset in which a left-wing bloc forms the government for the first time since 2005 is likelier than the market expects. This scenario presents an upside risk for equities and bund yields since Germany would become even more pro-Europe, pro-integration, and proactive in its fiscal spending. In the current context that would be greeted warmly by financial markets as it would reinforce the cyclical rotation into the euro, industrials, and European peripheral debt. Incidentally, it would also reduce tensions with Russia and China – even as the Biden administration is courting Germany. Recent state elections confirm that the electorate is moving to the left rather than the right. In Baden-Wurttemberg, the third largest state by population and economic output, and a southern state, the Christian Democrats slipped from the last election (-2.9%), the Social Democrats slipped by less (-1.7%), the Free Democrats gained (2.2%), the Greens gained (2.3%), and the far-right Alternative for Germany saw a big drop (-5.4%). In the smaller state of Rhineland-Palatinate the results were largely the same although the Greens did even better (Tables 4A & 4B).7 In both cases the Christian Democrats saw the worst result since prior to the financial crisis while the Greens tripled their support in Baden and doubled their support in the Palatinate over the same time frame. Table 4AGerman State Elections Show Voters’ Leftward Drift Continues
Building Back … The Wall Of Worry
Building Back … The Wall Of Worry
Table 4BGerman State Elections Show Voters’ Leftward Drift Continues
Building Back … The Wall Of Worry
Building Back … The Wall Of Worry
To put this into perspective: Outgoing Chancellor Angela Merkel and her coalition have seen a net 6% increase in popular support since COVID-19. The coalition, led by the Christian Democratic Union and its Bavarian sister party, the Christian Social Union, still leads national opinion polling. What we are highlighting are chinks in the armor. The gap with the combined left-leaning bloc is less than 10% points (Chart 10). Chart 10German Party Polling
German Party Polling
German Party Polling
Merkel is a lame duck whose party has been in power for 17 years. She is struggling to find an adequate successor. Her current frontrunner for chancellor-candidate, Armin Laschet, is suffering in public opinion, especially after the state election defeats, while her previous successor was ousted last year. Other chancellor-candidates, like Friedrich Merz, Markus Söder, and Norbert Röttgen may find themselves to the right of the median voter, which has been shifting to the left. Merkel’s party’s handling of COVID-19 first received praise and now, in the year of the vote, is falling under pressure due to difficulties rolling out the vaccine. Even as conditions improve over the course of the year her party may struggle to recover from the damage, since the underlying reality is that Germany has suffered a recession and is beset by global challenges. While the Christian Democrats performed relatively well in the 2009 election, in the teeth of the global financial crisis, times have changed. Today the Social Democrats are no longer in free fall – ever since their Finance Minister Olaf Scholz led the charge for fiscal stimulus in 2019 – while third parties like the Free Democrats, Greens, and Die Linke all gained in 2009 and look to gain this year (Table 5). In today’s context it is even more likely that other parties will rise at the ruling party’s expense. Still, the Christian Democrats have stout support in polls and do not have to split votes with the far-right, which is in collapse. Table 5German Federal Election Results Show 2021 Could Throw Curveball For Ruling Party
Building Back … The Wall Of Worry
Building Back … The Wall Of Worry
Therein lies the real market takeaway: right-wing populism has flopped in Germany. The risk to the consensus view that Merkel will hand off the baton seamlessly to a successor and secure her party another term in leadership is that the establishment left will take power (the Greens in Germany are essentially an establishment party). Chart 11German Bunds Respond To Macro Shifts, State Elections
German Bunds Respond To Macro Shifts, State Elections
German Bunds Respond To Macro Shifts, State Elections
Near-term pandemic and economic problems have caused bund yields to fall and the yield curve to flatten so far this year (Chart 11). But that trend is unlikely to continue given the global and national outlook. Election uncertainty should work against this trend since the only possible uncertainty gives more upside to the fiscal outlook and bond yields. If the consensus view indeed comes to pass and the Christian Democrats remain in power, the election holds out policy continuity – at least on economic policy. Fiscal tightening would happen sooner under the Christian Democrats but it would not be aggressive or premature, at least not in the 2021-22 period. It is the current coalition that first loosened Germany’s belt – and it did so in 2019, prior to COVID-19. Germany’s and the EU’s proactive fiscal turn will have a major positive impact on growth prospects, at least cyclically, though it is probably too small thus far to create a structural improvement in potential growth. Fiscal thrust is negative over next two years even with the EU’s Next Generation Recovery Fund being distributed. A structural increase in growth is possible given that all of the major countries are simultaneously pursuing monetary and fiscal stimulus as well as big investments in technology and renewable energy that will help engender a new private capex cycle. But productivity has been on a long, multi-decade decline so it remains to be seen if this can be reversed. Geopolitically speaking, Germany’s and the EU’s policy shift arrived in the nick of time to deepen European integration before divisions revive. Integration is broadly driven by European states’ need to compete on a grand scale with the US, Russia, and China. But Putin, Brexit, and Mario Draghi demonstrate the more tactical pressures: Brexit discourages states from exiting, especially with ongoing trade disputes and the risk of a new Scottish independence referendum; Putin’s aggressive foreign policy drives eastern Europeans into the arms of the West; and the formation of a unity government in Italy encourages European solidarity and improves Italian growth prospects. The outlook for structural reforms is not hopeless. Prime Minister Draghi’s government has a good chance of succeeding at some structural reforms where his predecessors have failed. Meanwhile French President Emmanuel Macron is still favored to win the French election in 2022, which is good for French structural reform. The fact that the EU tied its recovery fund to reform is positive. Most importantly the green energy agenda is replacing budget cutting for the time being, which, again, is positive for capex and could create positive long-term productivity surprises. Of course, structural reform intensity slowed just prior to COVID, in Spain, France, and Italy. Once the recovery funds are spent the desire to persist with reform will wane. This is clear in Spain, which has rolled back some reforms and has a weak government that could dissolve any time, and Italy, where the Draghi coalition may not last long after funds are spent. If the global upswing persists and Chinese/EM growth improves, then Europe will benefit from a macro backdrop that enables it to persist with some structural reforms and crawl out of its liquidity trap. But if China/EM growth relapses then Europe will fall back into a slump. Thus it is a very good thing for Europe, the euro, and European equities that the US is engaged in an epic fiscal blowout and that China’s Two Sessions dampened the risk of overtightening. Incidentally, if the German government does shift, relations with Russia would improve on the margin. While US-Russia tensions will remain hot, German mediation could reduce Russia’s insecurity and lower geopolitical risks for both Russia and emerging Europe, which are very cheaply valued at present in part because they face a persistent geopolitical risk premium. Bottom Line: German politics will drive further EU integration whether the Christian Democrats stay in power or whether the left-wing parties manage a surprise victory. Europe will have to provide more fiscal stimulus but otherwise the global context is favorable for Europe. Investors should not be too pessimistic about short-term hiccups with the vaccine rollout. Investment Takeaways The US is stimulating, China is not overtightening, and German’s election risk is actually an upside risk for European and global risk assets. These points reaffirm a bullish cyclical outlook on global stocks and commodities and a bearish outlook on government bonds. It is especially positive for global beneficiaries of US stimulus excluding China, such as Canada and Mexico. It is also beneficial for industrial metals and emerging markets exposed to China over the medium term, after frenzied buying suffers a healthy correction. Any premium in European equities should be snapped up. However, the cornerstone has been laid for the wall of worry in this global economic cycle: the US is raising taxes, China is tightening policy, and Europe’s fiscal stimulus will probably fall short. Moreover a consensus outcome from the German election would be a harbinger of earlier-than-expected fiscal normalization. There is not yet a clear green light in US-China relations – on the contrary, our view that Biden would be hawkish is coming to pass. Biden faces foreign policy tests across the board and now is a good time to hedge against the inevitable return of downside risks given the remorseless increase in tensions between the Great Powers. Housekeeping A number of clients have written to ask follow-up questions about our contrarian report last week taking a positive view on cybersecurity stocks despite the tech selloff and a positive view on global defense stocks, especially in relation to cybersecurity. The main request is, Which companies offer the best value? So we teamed up with BCA’s new Equity Analyzer to highlight the companies that receive the best BCA scores utilizing a range of factors including value, safety, payout, quality, technicals, sentiment, and macro context – all relative to a universe of global stocks with a minimum market cap of $1 billion. The results are shown in the Appendix, which we hope will come in handy. Separately our tactical hedge, long US health care equipment versus the broad market, has stopped out at -5%. This makes sense in light of the pro-cyclical rotation. Health care equipment is still likely to outperform the rest of the US health care sector amid a policy onslaught of higher taxes, government-provided insurance, and pharmaceutical price caps. Matt Gertken Vice President Geopolitical Strategy mattg@bcaresearch.com Yushu Ma Research Associate yushu.ma@bcaresearch.com Appendix Appendix Table ABCA Research Equity Analyzer Casts Light On Best Defense And Cybersecurity Stocks
Building Back … The Wall Of Worry
Building Back … The Wall Of Worry
Appendix Table BBCA Research Equity Analyzer Casts Light On Best Defense And Cybersecurity Stocks
Building Back … The Wall Of Worry
Building Back … The Wall Of Worry
Appendix Table CBCA Research Equity Analyzer Casts Light On Best Defense And Cybersecurity Stocks
Building Back … The Wall Of Worry
Building Back … The Wall Of Worry
Footnotes 1 China is asking for export controls that have hamstrung Huawei and SMIC to be removed as well as for sanctions and travel bans on Communist Party members and students to be lifted. See Lingling Wei and Bob Davis, "China Plans To Ask U.S. To Roll Back Trump Policies In Alaska Meeting," Wall Street Journal, March 17, 2021, wsj.com; Helen Davidson, "Taiwanese urged to eat ‘freedom pineapples’ after China import ban," The Guardian, March 2, 2021, theguardian.com. 2 "Putin on Biden: Russian President Reacts To US Leader’s Criticism," BBC, March 18, 2021, bbc.com. 3 Pyongyang is likely to test a new, longer range intercontinental ballistic missile for the first time since its self-imposed missile test moratorium began in 2018 after President Trump’s summit with leader Kim Jong Un. See Lara Seligman and Natasha Bertrand, "U.S. ‘On Watch’ For New North Korean Missile Tests," Politico, March 16, 2021, politico.com. 4 See ABC News, "Transcript: Joe Biden delivers remarks on 1-year anniversary of pandemic", ABC News, Mar. 11, 2021, abcnews.com. 5 Please see IMF Staff, "World Economic Outlook Reports", IMF, Jan. 2021, imf.org and OECD Staff, "OECD Economic Outlook, Interim Report March 2021", OECD, March 9, 2021, oecd.org. 6 Please see IMF Asia and Pacific Dept, "People’s Republic of China : 2020 Article IV Consultation-Press Release; Staff Report; and Statement by the Executive Director for the People's Republic of China", IMF, Jan. 8, 2021, imf.org. 7 The other state elections coming up this year will coincide with the federal election on September 26, with one minor exception (Saxony-Anhalt). Opinion polls show the Christian Democrats slipping below the Greens in Berlin and the Social Democrats in Mecklenburg-Vorpommern. The Alternative for Germany is falling in all regions.