United States

Highlights UK Interest Rates: A series of rolling shocks dating back to the 2008 financial crisis has prevented the Bank of England (BoE) from normalizing crisis-era levels of interest rates, even during years when inflation was overshooting the BoE 2% target. Brexit and COVID-19 were the last of those two shocks, but the growth- and inflation-dampening effects of both are fading fast. Implications for Gilts & GBP: The BoE’s dovish rhetoric, including hints that negative policy rates are still a viable option, looks increasingly inappropriate. The surge in real UK bond yields seen over the past month is just the beginning of a medium-term process of interest rate normalization. Maintain below-benchmark duration on Gilts, while downgrading UK allocations within dedicated global fixed income portfolios to neutral. The pound has upside in this environment, especially if depressed UK productivity starts to recover. Feature Chart 1UK Real Yields: Deeply Negative
Why Are UK Interest Rates Still So Low?
Why Are UK Interest Rates Still So Low?
The UK has become one of the more peculiar corners of the global fixed income universe. The outright level of longer-term Gilt yields is in the middle of the pack among the major advanced economies. The story is much different, however, when breaking those nominal UK yields into the real and inflation expectations components. The deeply negative real yields on UK inflation-linked Gilts are the lowest among the majors, even in a world where sub-0% real yields are prevalent in most countries (Chart 1). The flipside of that deeply negative real yield is a high level of inflation expectations. The breakeven inflation rate derived from the difference between the nominal and real 10-year Gilt yields is 3.3%, the highest in the developed “linkers” universe. Inflation expectations in UK consumer surveys are at similar levels, well above the 2% inflation target of the Bank of England (BoE), suggesting little confidence in the central bank’s ability or willingness to hit its own inflation goals. In this Special Report, jointly published by BCA Research Global Fixed Income Strategy and Foreign Exchange Strategy, we investigate why UK real interest rates have remained so persistently negative and assess the possibility of a shift in the low interest rate regime in a post-Brexit, post-pandemic UK – a move that could be quite bearish for UK fixed income markets and bullish for the British pound. Can The BoE Ignore Cyclical Upward Pressure On UK Bond Yields? The UK has suffered from a series of shocks, starting with the 2008 crisis, that have limited the ability of the BoE to attempt to tighten monetary policy. The 2011/12 European debt crisis hurt the UK’s most important trading partners, while the 2016 Brexit vote began a multi-year process of uncertainty over the future of those trading relationships. The COVID-19 pandemic is the latest shock, triggering a recession of historic proportions. The UK economy contracted by -10% in 2020, the largest decline since “The Great Frost” downturn of 1709. UK bond yields collapsed in response as the BoE cut rates to near-0% and reinforced that easy stance with aggressive quantitative easing and promises to keep rates unchanged over at the next few years. Today, UK financial markets are waking up to a world beyond the current COVID-19 lockdowns. The UK is running one of the world’s most successful vaccination rollouts, with 23 million jabs, or 35 per 100 people, already having been administered. UK Prime Minister Boris Johnson recently unveiled a bold plan to fully reopen the UK economy from the current severe lockdowns by mid-year. The UK government’s latest budget called for additional spending measures over the next year, including maintaining the work furlough scheme that has supported household incomes during the pandemic. As a result, UK growth expectations have exploded higher. According to the Bloomberg consensus economics survey, UK nominal GDP growth is expected to surge to 8.4% over calendar year 2021, an annual pace not seen since 1990 (Chart 2). Nominal Gilt yields have begun to reprice higher to reflect those surging growth expectations, with the 5-year/5-year forward Gilt yield climbing 67bps so far in 2021. Real Gilt yields are also moving higher with the 10-year inflation-linked Gilt climbing 38bps year to date, providing additional interest rate support that has fueled a surge in the pound versus the dollar (bottom panel). Our own BoE Monitor - containing growth, inflation and financial variables that typically lead to pressure on the central bank to adjust monetary policy – is signaling a reduced need for additional policy easing (Chart 3). The momentum of changes in longer-maturity UK Gilts and the trade-weighted UK currency index are usually correlated to the ebbs and flows of the BoE Monitor. The latest surge higher in yields and the currency suggests that the markets are anticipating the type of recovery that will put pressure on the BoE to tighten. Chart 2A Growth-Driven Repricing Of Gilts & GBP
A Growth-Driven Repricing Of Gilts & GBP
A Growth-Driven Repricing Of Gilts & GBP
Chart 3Gilts & GBP Sniffing Out A Less Dovish BoE?
Gilts & GBP Sniffing Out A Less Dovish BoE?
Gilts & GBP Sniffing Out A Less Dovish BoE?
It may take a while to see the BoE turn more hawkish, however. The BoE has become one of least active central banks in the world over the past decade. After the BoE cut its official policy interest rate, the Bank Rate, by 500bps during the 2008 financial crisis and 2009 recession, rates were kept in a range between 0.25% and 0.75% for ten consecutive years. The BoE cut rates aggressively in response to the COVID-19 pandemic, lowering the Bank Rate in March 2020 from 0.75% to 0.1%, where it still stands. The BoE has used quantitative easing (QE) and forward guidance to try and limit movements in bond yields whenever cyclical surges in inflation could have justified tighter monetary policy. That has led to an extended period of a negative BoE Bank Rate, something not seen since the inflationary 1970s (Chart 4). Back then, the BoE was lagging the surge in UK inflation, but still hiking nominal interest rates. Today, the central bank is keeping nominal rates near 0% with much lower levels of inflation. Chart 4Over A Decade Of Negative Real UK Interest Rates
Over A Decade Of Negative Real UK Interest Rates
Over A Decade Of Negative Real UK Interest Rates
Short-term interest rate markets are still pricing in a very slow response from the BoE to the current growth optimism. Only 36bps of rate hikes over the next two years are discounted in the UK overnight index swap (OIS) curve. This go-slow response is in line with the BoE’s guidance on future rate hikes which, similar to the language used by other central banks like the Fed, calls for no pre-emptive rate hikes before inflation has sustainably returned to the BoE target. That combination would be consistent with current forward market pricing on both short-term interest rates and inflation. Chart 5BoE Keeping Real Rates Well Below R*
BoE Keeping Real Rates Well Below R*
BoE Keeping Real Rates Well Below R*
In Chart 5, we show the real BoE Bank Rate, constructed by subtracting UK core CPI inflation from the Bank Rate. We also show a forward real rate calculated using the forward UK OIS and CPI swap curves. The market-implied path of the real Bank Rate shows very little change over the next decade, with the real Bank Rate expected to average around -2.5%. This is far below the estimates of a neutral UK real rate (or “r-star”) of just under 2%, as calculated by the New York Fed or recent academic studies. The neutral UK real rate has likely dipped because of the pandemic. The UK Office For Budget Responsibility (OBR) estimates that there has been a long-term “scarring” of the UK economy from COVID-19 through supply-side factors like weaker investment spending, lower productivity growth and diminished labor force participation – equal to three percentage points of the level of potential GDP.1 The BoE estimates a smaller “scarring” of 1.75 percentage points of potential output, but coming with a 6.5% reduction in the size of the UK capital stock. While these are significant reductions in the supply-side of the UK economy, they are not enough to account for the 4.5 percentage point difference between pre-pandemic estimates of the UK r-star and the market-implied path of the real BoE Bank Rate over the next decade. The implication is that the markets are not expecting the BoE to deviate from its strategy of doing very little with interest rates, even as growth recovers from the pandemic shock. That can be seen in the recent upturn in UK inflation expectations that is evident in both market-implied and survey-based measures. Chart 6UK Inflation Expectations Reflect BoE Policy, Not Actual Inflation
UK Inflation Expectations Reflect BoE Policy, Not Actual Inflation
UK Inflation Expectations Reflect BoE Policy, Not Actual Inflation
The 5-year/5-year forward UK CPI swap rate now sits at 3.6%, not far off the 3.3% level of 5-10 year consumer inflation expectations from the latest YouGov/Citigroup survey (Chart 6). The fact that inflation expectations can remain so elevated at a time when headline CPI inflation is struggling to avoid deflation is striking. This indicates a belief that the BoE will do very little in the future to stop a booming UK economy that is expected to put sustained downward pressure on the UK unemployment rate over the next few years (bottom panel). This is from a relatively low starting point of the unemployment rate given the massive government support programs that have limited the amount of pandemic-related layoffs over the past year. The BoE should have reasons to be more concerned about a resurgence of UK inflation. In its latest Monetary Policy Report, the BoE published estimates showing that the entire collapse in UK inflation in 2020 was attributable to weaker demand for goods and services – especially the latter (Chart 7). This suggests that UK inflation could rebound by a similar amount as the UK economy reopens from pandemic lockdowns. According to the UK OBR, 21% of UK household spending is on items described as “social consumption”, like restaurants and hotels (Chart 8). This is a much larger proportion than seen in other major developed economies (excluding Spain) and explains why consumer spending plunged so much more dramatically in the UK during 2020 than in other countries. Chart 7Only A Temporary Drag On UK Inflation From COVID-19
Why Are UK Interest Rates Still So Low?
Why Are UK Interest Rates Still So Low?
Chart 8UK Households More Focused On “Social Consumption”
Why Are UK Interest Rates Still So Low?
Why Are UK Interest Rates Still So Low?
If the UK pandemic-related restrictions are eased as planned over the next few months, the potential for a sharp snapback in UK consumer spending is significant. The BoE estimates that UK households now have £125bn of “excess” savings thanks to government income support and reduced spending on discretionary items like dining out and vacations. This is the fuel to support a rapid recovery in consumption over the next 6-12 months, especially as personal income growth will get a boost as furloughed workers begin returning to work (Chart 9). Chart 9UK Economy On The Mend
UK Economy On The Mend
UK Economy On The Mend
Chart 10Big Boost To UK Growth From Housing & Government Spending
Big Boost To UK Growth From Housing & Government Spending
Big Boost To UK Growth From Housing & Government Spending
A similar argument can be made for investment spending – the BoE estimates that UK businesses have amassed £100bn pounds of excess cash, and the latest reading on the BoE’s Agents' Survey of UK firms shows a slight increase after months of decline (bottom panel). With a Brexit deal with the EU finally reached at the start of 2021, UK businesses can also look to increase investment spending that had been delayed because of the years of Brexit uncertainty. The UK economy is already getting a boost from a recovery in the housing market fueled by low interest rates, high household savings and improving consumer confidence. Mortgage approvals have soared to the highest level since 2007, while house prices are now expanding at a 6.4% annual rate (Chart 10). Add it all up, and the economic momentum in the UK is positive and likely to accelerate further in the coming months as a greater share of the population becomes vaccinated. The BoE’s dovish policy stance is likely to appear increasingly inappropriate relative to accelerating UK growth and inflation trends over the next several months. Thus, on a cyclical basis, UK bond yields, both nominal and real, have more upside potential even after the recent increase. Bottom Line: A series of rolling shocks dating back to the 2008 financial crisis has prevented the Bank of England (BoE) from normalizing crisis-era levels of interest rates, even during years when inflation was overshooting the BoE 2% target. Brexit and COVID-19 were the last of those two shocks, but the growth- and inflation-dampening effects of both are fading fast. Structural Forces Keeping UK Interest Rates Low Are Fading Looking beyond the cyclical drivers, the structural factors that have held down UK interest rates in recent years are also starting to fade. The supply side of the UK economy has suffered because of Brexit uncertainty. The OECD’s estimate of potential UK GDP growth fell from 1.75% in 2015 to 1.0% in 2020 (Chart 11). This was mostly due to declining productivity growth – a consequence of years of very weak business investment. The 5-year annualized growth rate of real UK investment spending fell to -3% in 2020, a contraction only matched during the past 30 years after the 1992 ERM crisis and 2008 financial crisis. That plunge in investment coincided with almost no growth in UK labor productivity over that same 5-year window. Chart 11The Road To Faster Potential UK Growth Starts With Investment
The Road To Faster Potential UK Growth Starts With Investment
The Road To Faster Potential UK Growth Starts With Investment
Slowing population growth also weighed on UK potential growth, slowing to the lowest level in 15 years in 2019 as immigration from EU countries to the UK fell sharply. COVID-19 also hurt immigration flows into the UK last year. The UK Office for National Statistics estimated that the non-UK born population in the UK fell by 2.7% between June 2019 and June 2020. Diminished potential GDP growth is a factor that would structurally reduce the equilibrium real UK interest rate. We are likely past the worst for that downward pressure on potential growth and real rates. Population growth should also stabilize as the UK borders open up again and pandemic travel restrictions are loosened. Measured productivity is already starting to see a cyclical recovery, while investment spending is likely to improve as cash-rich UK companies began to ramp up capital spending plans deferred by Brexit and COVID-19. While the process leading from faster investment spending into speedier productivity growth is typically slow, the key point is that the worst of downtrend is likely over. This is an important development that has implications for UK fixed income markets. When looking at an international comparison of real central bank policy rates within the developed economies, the UK has fallen into the grouping of countries with persistently negative policy rates, namely Japan, the euro area, Switzerland, Sweden and Norway (Chart 12). We have dubbed that group the “Secular Stagnation 5”, after the term made famous by former US Treasury Secretary Lawrence Summers describing a state where the “natural” real rate of interest (r-star) that equates savings with investment is structurally negative. Chart 12Does The UK Belong In The 'Secular Stagnation 5'?
Does The UK Belong In The 'Secular Stagnation 5'?
Does The UK Belong In The 'Secular Stagnation 5'?
Does the UK belong in the “Secular Stagnation 5”? As a way to assess this, we made some comparisons of selected UK data with the same data for those five countries. When looking at potential GDP growth and population growth, the UK sits right in the middle of the range of those growth rates for the five countries (Chart 13). UK productivity growth has underperformed the others recently but, prior to the 2016 Brexit shock, UK productivity was also in the middle of the Secular Stagnation 5 range. Chart 13Brexit Became A Major Hit To UK Potential Growth
Brexit Became A Major Hit To UK Potential Growth
Brexit Became A Major Hit To UK Potential Growth
Chart 14UK Economy Less Focused On Investment & Exports
UK Economy Less Focused On Investment & Exports
UK Economy Less Focused On Investment & Exports
On other measures, the UK is nothing like those other countries. The UK’s economy is far less geared towards exports and investment (Chart 14) and is more tilted towards consumer spending. That can be seen most clearly when looking at the data on savings/investment balances. The UK continuously runs a current account deficit, as opposed to the persistent surpluses seen in the Secular Stagnation 5 (Chart 15). Put another way, the UK is not a “surplus” country that saves more than it invests on a structural basis, a condition that typically depresses real interest rates. Chart 15The UK Is Not A Surplus Country
The UK Is Not A Surplus Country
The UK Is Not A Surplus Country
Chart 16Gilts Will Not Become A Low-Beta Market
Gilts Will Not Become A Low-Beta Market
Gilts Will Not Become A Low-Beta Market
Based on these cross-country comparisons, it is unusual for the UK to have such persistently low real interest rates. This has implications for UK bond yields. Over the past few years, Gilts have been transitioning from a status as a “high yield beta” market – whose yield movements are more correlated to swings in the overall level of global bond yields. The lower beta markets are in countries like Germany, France and Japan – all members of the Secular Stagnation club (Chart 16). The UK does not appear to warrant a permanent membership in that low-yielding group, based on structural factors. That is evident when looking at how Gilt yields are rising even with the BoE absorbing an increasing share of the stock of outstanding Gilts (bottom panel). We conclude that the transition of the UK to a low-beta market is related to the Brexit uncertainty post 2016 and the pandemic shock that has hit the consumer-focused UK economy exceptionally hard – both factors that are set to fade over the next year. Bottom Line: The BoE’s dovish rhetoric, including hints that negative policy rates are still a viable option, looks increasingly inappropriate. The surge in real UK bond yields seen over the past month is just the beginning of a medium-term process of interest rate normalization. Investment Conclusions Chart 17Downgrade Gilts To Underweight
Downgrade Gilts To Underweight
Downgrade Gilts To Underweight
Our assessment of the cyclical and structural drivers of UK interest rates leads us to the following conclusions on UK fixed income and currency strategy: Duration: Maintain a below-benchmark exposure to UK interest rate movements. Gilt yields will rise by more than is discounted in the forwards over the next 6-12 months (Chart 17), coming more through rising real yields as the UK economy continues its post-Brexit, post-pandemic recovery. Country Allocation: Downgrade strategic allocations to UK Gilts to neutral from overweight in dedicated fixed income portfolios. Our long-standing view that Brexit uncertainty would lead to the outperformance of Gilts versus other developed bond markets is no longer valid. It is still too soon to move to a full underweight stance on Gilts – a better opportunity will develop by mid-year once it is more evident that the current success on UK vaccinations leads to a faster reopening of the UK economy. Yield Curve: Maintain positioning for a bearish steepening of the UK Gilt yield curve. While there is limited scope for more steepening through an even larger increase in inflation breakevens from current elevated levels, the long end of the Gilt curve can move higher by more than the front end as the market re-rates Gilts to a higher-beta status with a higher future trajectory for UK interest rates. Corporate Credit: Downgrade UK investment grade corporate bond exposure to neutral from overweight in dedicated fixed income portfolios. UK corporate spreads have returned to the 2017 lows and, while an improving growth dynamic is not overly bearish for credit, there is no longer a compelling valuation-based case for staying overweight UK investment grade corporates. This move brings our recommended UK allocation in line with our neutral stance on US and euro area investment grade corporates. Chart 18GBP/USD Appears Cheap On A PPP Basis
GBP/USD Appears Cheap On A PPP Basis
GBP/USD Appears Cheap On A PPP Basis
Chart 19Low Productivity Is Weighing On The Pound
Low Productivity Is Weighing On The Pound
Low Productivity Is Weighing On The Pound
Currency: A growth-driven path towards interest rate normalization should be positive for the British pound, which remains undervalued versus the US dollar on a purchasing power parity basis (Chart 18).2 A move to 1.45 on GBP/USD is possible within the next six months. A broader move towards pound strength will require an improvement in business investment, as the trade-weighted pound looks fairly valued on our productivity-based model (Chart 19). We do maintain our view that EUR/GBP can approach 0.80 by year-end based on a relatively stronger cyclical improvement in UK growth versus the euro area. Robert Robis, CFA Chief Fixed Income Strategist rrobis@bcaresearch.com Footnotes 1 For further details on the OBR estimates of UK growth, inflation and fiscal policy, please see the March 2021 OBR Economic & Financial Outlook, which can be found here: https://obr.uk/ 2 Please see BCA Research Foreign Exchange Strategy Report, "Thoughts On The British Pound", dated December 18, 2020, available at fes.bcaresearch.com.
Highlights China’s economic recovery is in a later stage than the US. A rebound in US Treasury yields is unlikely to trigger upward pressure on government bond yields in China. Imported inflation through mounting commodity and oil prices should be transitory and does not pose enough risk for Chinese authorities to further tighten policies. Historically, Chinese stocks have little correlation with changes in US Treasury yields; Chinese equity prices are primarily driven by the country’s domestic credit growth and economic conditions. We maintain our tactical (0 to 3 months) neutral position on Chinese stocks, in both absolute and relative terms. However, the near-term pullbacks are taking some air out of Chinese equities' frothy valuations, providing room for a cyclical upswing. Chinese offshore stocks, which are highly concentrated in the tech sector, are facing multiple challenges. We are closing our long investable consumer discretionary/short investable consumer staples trade and we recommend long A-shares/short MSCI China Index. Feature Chinese stocks extended their February losses into the first week of March. Market participants fear that escalating real government bond yields in the US and elsewhere will have a sustained negative impact on Chinese risk assets, reinforced by ongoing policy normalization in China. Global equity prices have been buffeted by crosscurrents. An acceleration in the deployment of vaccines and increased economic reopenings provide a positive backdrop to the recovery of corporate profits. At the same time, optimism about global growth and broadening fiscal stimulus in the US has prompted investors to expect higher policy rates sooner. The US 10-year Treasury yield is up by 68bps so far this year, depressing US equity valuations and sending ripple effects across global bourses. In this report, we examine how rising US and global bond yields would affect China’s domestic monetary policy and risk-asset prices. Will Climbing US Treasury Yields Push Up Chinese Rates? Chart 1Chinese Gov Bond Yields Have Led The US Counterpart Since 2015
Chinese Gov Bond Yields Have Led The US Counterpart Since 2015
Chinese Gov Bond Yields Have Led The US Counterpart Since 2015
Increasing bond yields in the US will not necessarily lead to higher bond yields in China. Chart 1 shows that the direction of China’s 10-year government bond yield has a tight correlation with its US counterpart. It is not surprising because business cycles in these giant economies have become more synchronized. Interestingly, China’s 10-year Treasury bond yield has led the US one since 2015. This may be due to China’s growing importance in the world economy. China’s credit and domestic demand growth leads the prices of many industrial metals and in turn, business cycles in many economies. China’s rising long-duration government bond yields reflect expectations of an improving domestic economy, and these expectations often spill over to the rest of the world, including the US. Although the recent sharp rebound in the US Treasury yield is mainly driven by domestic factors, the rebound is unlikely to spill over to their Chinese peers, because the countries are in different stages of their business and policy cycles. America is still at its early stage of economic recovery and fresh stimulus measures are still being rolled out, whereas China has already normalized its policy rates back to pre-pandemic levels and its credit growth peaked in Q4 last year. Chinese fixed-income markets will soon start pricing in moderating growth momentum in the second half of this year, suppressing the long-end of China’s Treasury yield curve (Chart 2). Importantly, none of the optimism that has lifted US Treasury yields - a vaccine-led global growth recovery and a massive US fiscal stimulus – would warrant a better outlook for China. Reopening worldwide economies will likely unleash pent-up demand for services, such as travel and catering, rather than merchandise trade. Chart 3 shows that since the pandemic US spending on goods, which benefited Chinese exports, has soared relative to spending on services. The trend will probably reverse when the US and world economy fully opens, limiting the upside for China’s exports and its contribution to growth this year. Chart 2China And The US Are In Different Stages Of Their Economic Recoveries
China And The US Are In Different Stages Of Their Economic Recoveries
China And The US Are In Different Stages Of Their Economic Recoveries
Chart 3US Consumers Have Been Spending Much More On Goods Than Services During The Pandemic
US Consumers Have Been Spending Much More On Goods Than Services During The Pandemic
US Consumers Have Been Spending Much More On Goods Than Services During The Pandemic
Bottom Line: China’s waning growth momentum will insulate Chinese bond yields from higher US Treasury yields. Do Rising Inflation Expectations In The US Pose Risks Of Policy Tightening In China? Chart 4Imported Inflation Shouldnt Constrain The PBoC
Imported Inflation Shouldnt Constrain The PBoC
Imported Inflation Shouldnt Constrain The PBoC
While China’s monetary policymaking is not entirely insulated from exogenous shocks, it is primarily driven by domestic economic conditions and inflation dynamics. We are not complacent about the risk of a meaningful uptick in global inflation, but we do not consider imported inflation a major policy constraint for the PBoC this year (Chart 4). Furthermore, at last week’s National People’s Congress (NPC), China set the inflation target in 2021 at 3%, which is a high bar to breach. Mounting commodity prices, particularly crude oil prices, may put upward pressures on China’s producer prices, but their impact on China’s overall inflation will be limited for the following reasons: China accounts for a large portion of the world’s commodity demand. Given that the country’s credit impulse has already peaked, domestic demand in capital-intensive sectors (such as construction and infrastructure spending) will slow this year. Reinforced policy restrictions on the property sector will also restrain the upside price potential in industrial raw materials such as steel and cement (Chart 5). For producers, the main and sustained risk for imported inflation will be concentrated in crude oil. The PPI may spike in Q2 and Q3 this year due to advancing oil prices and the extremely low base factor from the same period last year. The PBoC will likely view a spike in the PPI as transitory. Moreover, the recent improvement in producer pricing power appears to be narrow. The output price for consumer goods, which accounts for 25% of the PPI price basket, remains subdued (Chart 6). Chart 5Chinas Demand For Raw Materials Will Slow
Chinas Demand For Raw Materials Will Slow
Chinas Demand For Raw Materials Will Slow
Chart 6Output Price For Consumer Goods Remains In Contraction
Output Price For Consumer Goods Remains In Contraction
Output Price For Consumer Goods Remains In Contraction
Importantly, when oil prices plummeted in the first half of 2020, China’s crude oil inventories showed the fastest upturn on record (Chart 7). It suggests that China’s inventory restocking from last year may help to partially offset the impact from elevated oil prices this year. For consumers, oil prices account for a much smaller percentage of China’s CPI basket than in the US (Chart 8). Food prices, particularly pork, drive China’s headline CPI and can be idiosyncratic. We expect food price increases to be well contained this year due to improved supplies and the high base effect from last year. Chart 7Massive Buildup in Chinas Crude Oil Inventory In 2020
Massive Buildup in Chinas Crude Oil Inventory In 2020
Massive Buildup in Chinas Crude Oil Inventory In 2020
Chart 8Oil Prices Account For A Small Portion In China's Consumer Spending
Oil Prices Account For A Small Portion In Chinas Consumer Spending
Oil Prices Account For A Small Portion In Chinas Consumer Spending
Importantly, China’s inflation expectations have not recovered to their pre-pandemic levels and consumer confidence on future income growth also remains below its end-2019 figure (Chart 9). If this trend holds, then it will be difficult for producers to pass through escalating input costs to end users. Although China’s economy has strengthened, it is far from overheating (Chart 10). Without a sustained above-trend growth rebound, it is difficult to expect genuine inflationary pressures. The pandemic has distorted the balance of global supply and demand, propping up demand and price tags attached to it. In China’s case, however, production capacity and capital expenditures rebounded faster than demand and consumer spending, constraining the upsides in inflation (Chart 11). Chart 9Consumer Inflation Expectations Have Not Fully Recovered
Consumer Inflation Expectations Have Not Fully Recovered
Consumer Inflation Expectations Have Not Fully Recovered
Chart 10Chinese Economy Is Not Yet Overheating
Chinese Economy Is Not Yet Overheating
Chinese Economy Is Not Yet Overheating
China’s CPI is at its lowest point since 2009, making China’s real yields much greater than in the US. Rising real US government bond yields could be mildly positive for China because they help to narrow the Sino-US interest rate differential and temper the pace of the RMB’s appreciation (Chart 12). A breather in the RMB’s gains would be a welcome reflationary force for Chinese exporters and we doubt that Chinese policymakers will spoil it with a rush to hike domestic rates. Chart 11And Production Has Recovered Faster Than Demand
And Production Has Recovered Faster Than Demand
And Production Has Recovered Faster Than Demand
Chart 12Narrowing Real Rate Differentials Helps To Tamper The RMB Appreciation
Narrowing Real Rate Differentials Helps To Tamper The RMB Appreciation
Narrowing Real Rate Differentials Helps To Tamper The RMB Appreciation
Bottom Line: It is premature to worry about an inflation overshoot in China. The current environment is characterized as easing deflation rather than rising inflation. Our base case remains that inflationary pressures will stay at bay this year. Are Higher US Treasury Yields Headwinds For Chinese Stocks? Historically, Chinese stocks have exhibited a loose cyclical correlation with US government bond yields, particularly in the onshore market (Chart 13). Equity prices in China are more closely correlated with domestic long-duration government bond yields, but the relationship is inconsistent (Chart 14). Chart 13Chinese Stocks Have Little Correlation With US Treasury Yields
Chinese Stocks Have Little Correlation With US Treasury Yields
Chinese Stocks Have Little Correlation With US Treasury Yields
Chart 14Correlations Between Chinese Stocks And Domestic Gov Bond Yields Are Inconsistent
Correlations Between Chinese Stocks And Domestic Gov Bond Yields Are Inconsistent
Correlations Between Chinese Stocks And Domestic Gov Bond Yields Are Inconsistent
Chinese stocks are much more sensitive to changes in the quantity of domestic money supply than the price of money. A sharp rebound in China’s 10-year government bond yield in the second half of last year did not stop Chinese stocks from rallying. The insensitivity of Chinese stocks to changes in the price of money is particularly prevalent during the early stage of an economic recovery. As we pointed out in a previous report, since 2015 the PBoC has shifted its policy to target interest rates instead of the quantity of money supply. Thus, credit growth, which propels China’s business cycle and corporate profits, can still trend higher even as bond yields pick up. This explains why domestic credit growth, rather than China’s real government bond yields, has been the primary driver of the forward P/E of Chinese stocks (Chart 15A and 15B). This contrasts with the S&P, in which the forward P/E ratio moves in lockstep with the inverted real yield in US Treasuries (Chart 16). Chart 15ACredit Growth Has Been Driving Up Chinese Stock Valuations
Credit Growth Has Been Driving Up Chinese Stock Valuations
Credit Growth Has Been Driving Up Chinese Stock Valuations
Chart 15BCredit Growth Has Been Driving Up Chinese Stock Valuations
Credit Growth Has Been Driving Up Chinese Stock Valuations
Credit Growth Has Been Driving Up Chinese Stock Valuations
Credit growth in China peaked in Q4 last year and the intensity of the economic recovery has started to moderate. Hence, regardless of the changes in bond yields, Chinese stocks will need to rely on profit growth in order to sustain an upward trend (Chart 17). Chart 16Falling Real Rates Were Propping Up US Equity Valuations
Falling Real Rates Were Propping Up US Equity Valuations
Falling Real Rates Were Propping Up US Equity Valuations
Chart 17Earnings Growth Needs To Accelerate To Support Chinese Stock Performance
Earnings Growth Needs To Accelerate To Support Chinese Stock Performance
Earnings Growth Needs To Accelerate To Support Chinese Stock Performance
The good news is that recent gyrations in the US equity market, coupled with concerns about further tightening in China’s domestic economic policy have triggered shakeouts in China’s equity markets. The pullback in stock prices has helped to shed some excesses in frothy Chinese valuations and has opened a door for more upsides in Chinese stock on a cyclical basis. Bottom Line: Rising Treasury yields in the US or China will not have a direct negative impact on Chinese equities. Last year’s massive credit expansion has lifted both earnings and multiples in Chinese stocks and an acceleration in earnings growth is now needed to support stock performance. Investment Implications The key message from last week’s NPC meetings suggests that policy tightening will be gradual this year. While the 6% growth target was lower than expected, it represents a floor rather than a suggested range and it will likely be exceeded. Bond yields and policy rates are already at their pre-pandemic levels, indicating that there is not much room for further monetary policy tightening this year. The announced objectives for the fiscal deficit and local government bond quotas are only modestly smaller than last year. The economic and policy-support targets support our view that policymakers will be cautious and not overdo tightening. We will elaborate on our takeaways from this year’s NPC in next week’s report. Chart 18Chinese Cyclicals Can Still Benefit From An Improving Global Economic Backdrop
Chinese Cyclicals Can Still Benefit From An Improving Global Economic Backdrop
Chinese Cyclicals Can Still Benefit From An Improving Global Economic Backdrop
Meanwhile, there is still some room for Chinese cyclical stocks to run higher relative to defensives, given the current Goldilocks backdrop of global economic recovery and accommodative monetary policy (Chart 18). We maintain a tactical (0 to 3 months) neutral position on Chinese stocks, in both absolute and relative terms. The market correction has not fully run its course. However, the near-term pullbacks are taking some air out of Chinese equities' frothy valuations, providing room for a cyclical upswing. We are closing our long investable consumer discretionary/short investable consumer staples trade. Instead, we recommend the following trade: long A-share stocks/short MSCI China Index. Investable consumer discretionary sector stocks, which are concentrated in China’s technology giants, face a confluence of challenges ranging from the ripple effects of falling stock prices in the US tech sector and tightened antitrust regulations in China (Chart 19). In contrast, the A-share index is heavily weighted in value stocks while the MSCI China investable index has a large proportion of expensive new economy stocks (Chart 20). The trade is in line with our view that the investment backdrop has shifted in favor of global value versus growth stocks due to a strong US expansion, rising US bond yields and a weaker US dollar. Chart 19Chinese Investable Tech Sector Is Facing Strong Headwinds
Chinese Investable Tech Sector Is Facing Strong Headwinds
Chinese Investable Tech Sector Is Facing Strong Headwinds
Chart 20Overweight A Shares Versus Chinese Investable Stocks
Overweight A Shares Versus Chinese Investable Stocks
Overweight A Shares Versus Chinese Investable Stocks
Jing Sima China Strategist jings@bcaresearch.com Cyclical Investment Stance Equity Sector Recommendations
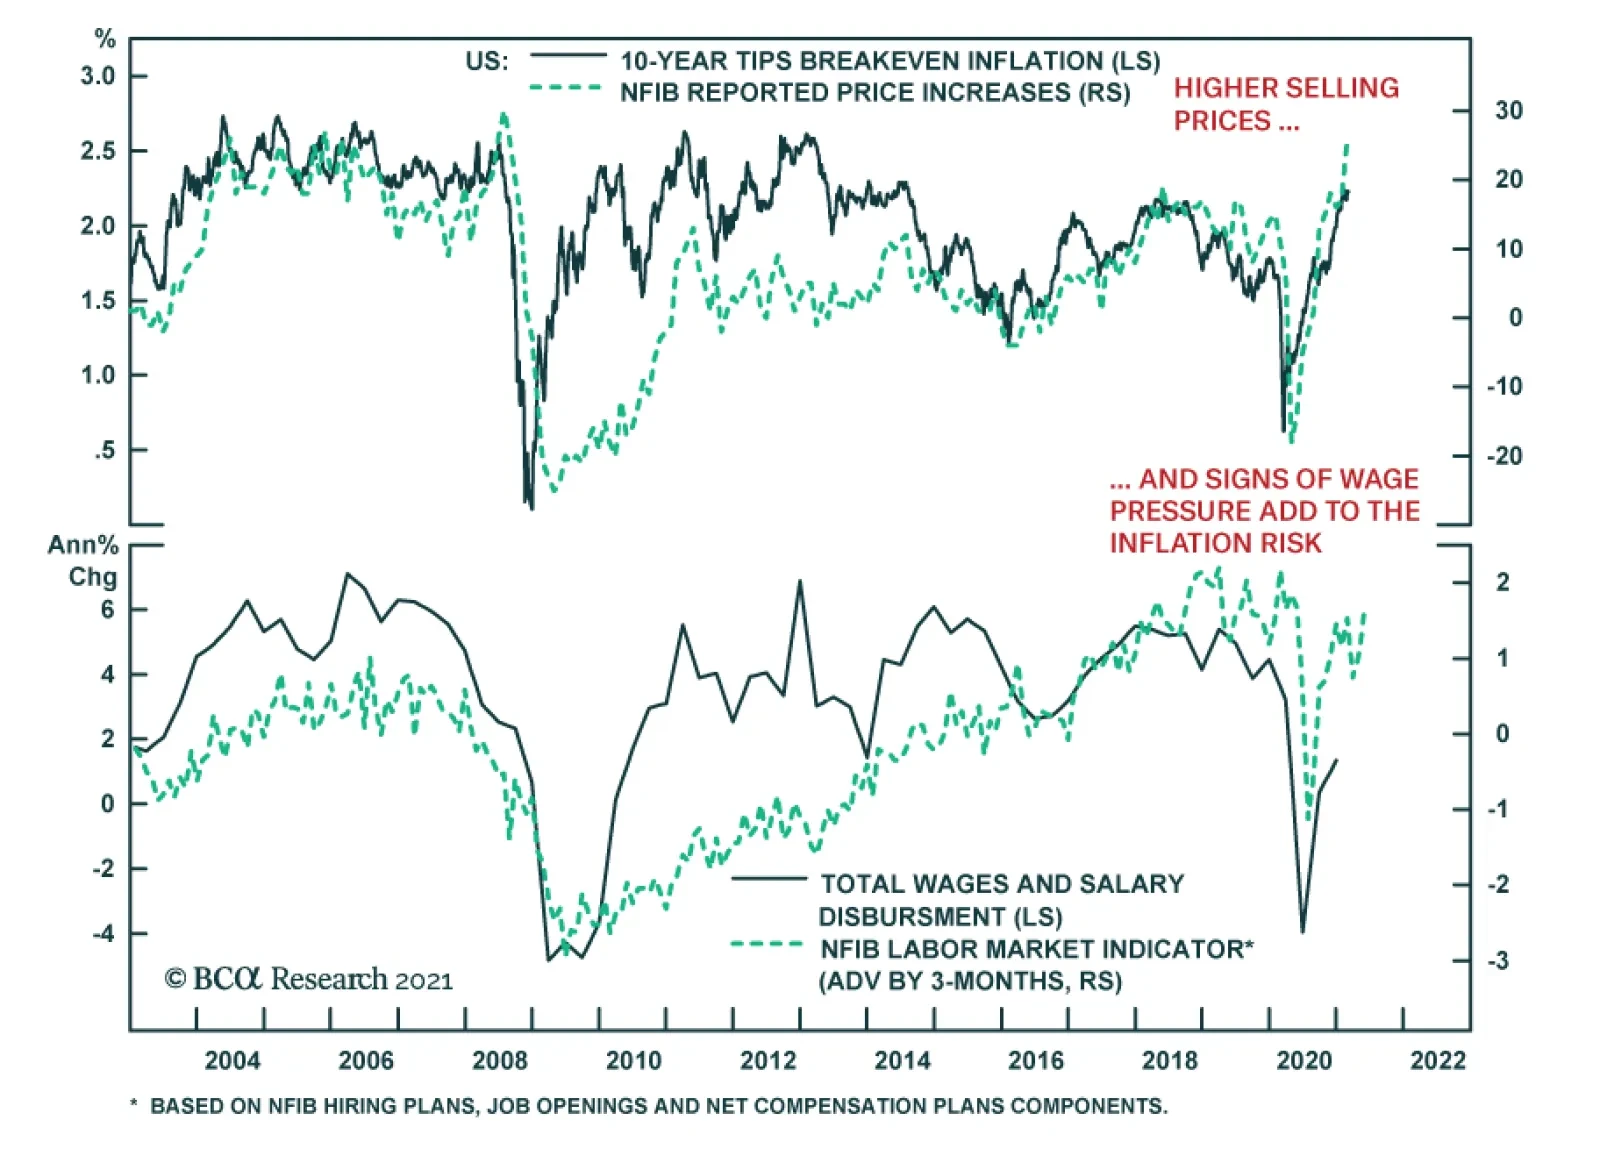
The NFIB Small Business Optimism Index was a slight disappointment, rising only 0.8 points in February to 95.8, versus expectations of stronger gains to 97.0. However, the contents of the report were somewhat more upbeat with upgrades to five of the index’s…
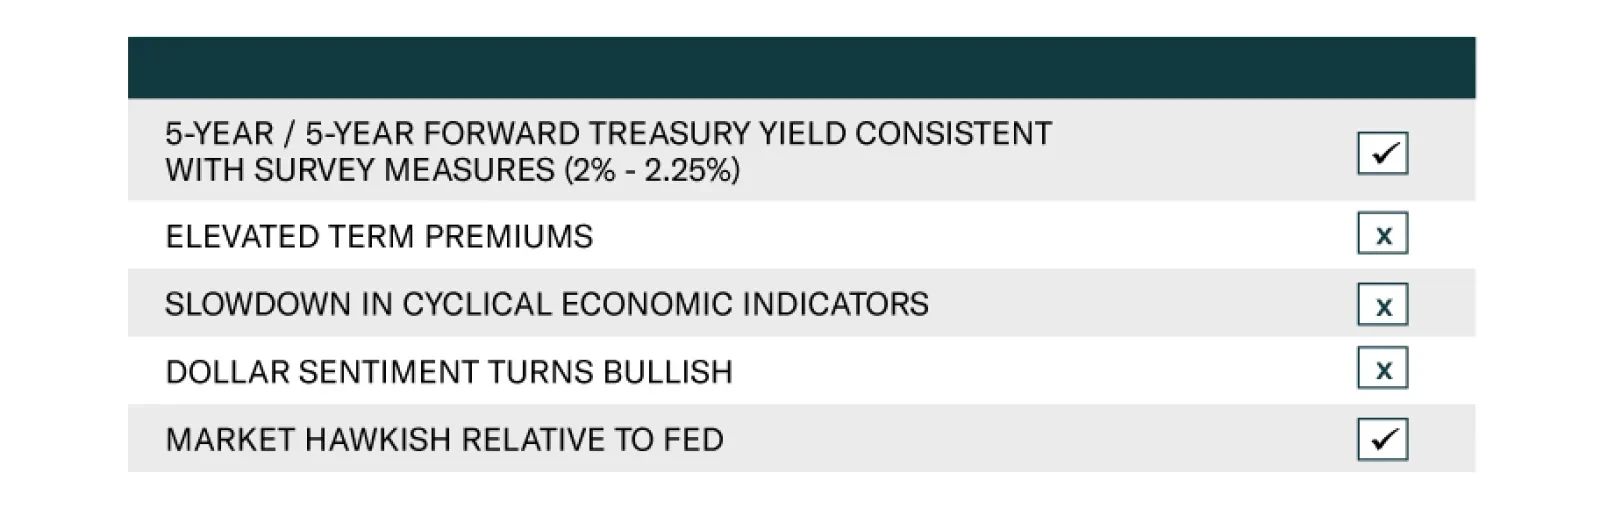
According to BCA Research’s US Bond Strategy service, only two of the five milestones on their Checklist For Increasing Portfolio Duration have been reached. Thus, a below-benchmark portfolio duration remains appropriate. The first item on the Checklist is…
Battery Malfunction
Battery Malfunction
Our Tesla-dominated S&P automobiles & components underweight is currently on fire (no pun intended) generating 34% in relative returns in just over a month. While our original rationale for the underweight exposure in this sub-sector remains intact, such impressive gains are forcing our hand to institute a 5% rolling stop as a portfolio management tool in order to protect profits. As a reminder, Tesla remains a mania stock that is due for a normalization phase especially given the melt up in the US 10-year Treasury yield that is weighing on still parabolic forward multiples, at the same time as new competitors are entering its end-demand market. Bottom Line: Institute a 5% rolling stop in the S&P automobiles & components index. The ticker symbols for the stocks in this index are: BLBG: S5AUCO – TSLA, GM, F, APTV, BWA.
Highlights Duration: Only 2 of the 5 items on our Checklist For Increasing Portfolio Duration have been checked. We will heed this message and stick with below-benchmark portfolio duration for the time being. We will have an opportunity to re-assess the items on our Checklist after the March FOMC meeting when the Fed’s interest rate forecasts will be updated. The Fed & Financial Conditions: The recent dip in the stock market is not the result of investors pricing-in worse economic outcomes. Rather, it is a sector rotation driven by extreme economic optimism. It is certainly not a concern for the Fed. The Fed & The Labor Market: We need to see monthly nonfarm payroll growth coming in consistently above 419 thousand before we can be confident that the Fed will hike rates by the end of 2022. Feature Chart 1Bearish Trend Intact
Bearish Trend Intact
Bearish Trend Intact
The bond bear market rages on. The Bloomberg Barclays Treasury Index returned -1.8% in February, its worst monthly performance since 2016. The sell-off then continued through the first week of March, culminating with the 10-year Treasury yield touching 1.56% as of Friday’s close (Chart 1). The 5-year/5-year forward Treasury yield ended the week at 2.41%, near the top-end of primary dealer estimates of the long-run neutral fed funds rate (Chart 1, bottom panel). We don’t want to catch a falling knife, but eventually, yields will look attractive enough for us to increase our recommended portfolio duration. To help us make that decision, we unveiled a Checklist For Increasing Portfolio Duration in our February Webcast (Table 1).1 Table 1Checklist For Increasing Portfolio Duration
No Panic From Powell
No Panic From Powell
This week, we check-in with our Checklist, concluding that it is still too early to increase portfolio duration. Checking-In With Our Duration Checklist Chart 2Cyclical & Valuation Indicators
Cyclical & Valuation Indicators
Cyclical & Valuation Indicators
The first item on our Checklist is the 5-year/5-year forward Treasury yield reaching levels consistent with survey estimates of the long-run neutral fed funds rate. As noted above, this condition has been met. Second, we would like to see survey-derived measures of the 10-year term premium reach extended levels. Specifically, we’d like to see them approach their 2018 peaks (Chart 2). Currently, our two measures are sending diverging signals. The term premium derived from the New York Fed’s Survey of Market Participants is 60 bps, only 15 bps off its 2018 peak. However, the term premium derived from the New York Fed’s Survey of Primary Dealers is only 22 bps, 53 bps off its 2018 peak. For now, our assessment is that this condition has not been met. It’s important to note that the surveys used to construct our two term premium measures and to obtain our fair value range for the 5-year/5-year forward Treasury yield have not been updated since January, and that they will be revised ahead of this month’s FOMC meeting. If primary dealers and market participants revise up their fed funds rate expectations, then our valuation measures will give the 10-year yield more room to rise. Third, we continue to track high-frequency cyclical economic indicators like the CRB/Gold ratio (Chart 2, panel 3) and the relative performance of cyclical versus defensive equity sectors (see section titled “The Fed’s Approach To Financial Conditions” below). These measures have yet to show any signs of deterioration, consistent with an environment where bond yields should be rising. Fourth, if current trends continue, we are concerned that US yields may rise too far compared to yields in the rest of the world. This could entice foreign inflows into the US bond market, sending yields back down. Historically, bullish sentiment toward the US dollar is a good indicator of when US yields have risen too far. At present, dollar sentiment remains extremely bearish (Chart 2, bottom panel). This suggests that we are not yet close to the point when foreign purchases will push US yields lower. Finally, we consider the market’s fed funds rate expectations relative to the Fed’s most recent forecast, as inferred from its quarterly “dot plot”. Currently, the market is priced for Fed liftoff to occur in January 2023, with a second rate hike delivered in May 2023 and a third in October 2023 (Chart 3). This is considerably more hawkish than the Fed’s median forecast from December, which called for no rate hikes until at least 2024! Chart 3Market Expects Liftoff In January 2023
Market Expects Liftoff In January 2023
Market Expects Liftoff In January 2023
We think it’s conceivable that economic conditions could warrant Fed liftoff in late-2022 (see section titled “Tracking Payrolls And The Countdown To Fed Liftoff” below), but the Fed will probably be more cautious about how quickly it brings its expected liftoff date forward. FOMC participants will have an opportunity to push back against the market when they update their funds rate forecasts at this month’s meeting. The Fed will likely bring forward its anticipated liftoff date, but probably not all the way to January 2023. This could halt the uptrend in bond yields, at least for a while. Bottom Line: Only 2 of the 5 items on our Checklist For Increasing Portfolio Duration have been checked. We will heed this message and stick with below-benchmark portfolio duration for the time being. We will have an opportunity to re-assess the items on our Checklist after the March FOMC meeting when the Fed’s interest rate forecasts will be updated. Other surveys used in the construction of our term premium estimates and 5-year/5-year yield targets will also be updated around this time. The Fed’s Approach To Financial Conditions Chart 4Financial Conditions Are Easy
Financial Conditions Are Easy
Financial Conditions Are Easy
Remarks from Fed Chair Jay Powell were a catalyst for higher bond yields last week. Apparently, there had been some expectation in the market that Powell would use his platform to express concern about the recent increase in long-maturity bond yields. In fact, many expected him to foreshadow changes to the Fed’s balance sheet policy, either extending the maturity of its ongoing asset purchases or initiating an Operation Twist, where the Fed sells short-dated securities and buys long-dated ones.2 Powell didn’t announce any of these things. In fact, he didn’t even express concern about the recent rise in long-dated yields despite being given several opportunities to do so. To understand why, we need to understand how the Fed thinks about financial conditions. The Fed only cares about conditions in financial markets to the extent that they are expected to influence the real economy. This means that the Fed takes a broad view of financial conditions, including bond yields, credit spreads and equity prices. From this perspective, financial markets do not currently pose a risk to the economy (Chart 4). Yes, long-dated bond yields have risen, but short-dated yields remain low. Credit spreads also remain very tight and equity prices have only dipped modestly from high levels. The Chicago Fed’s broad index of financial conditions shows that they are extremely accommodative (Chart 4), and thus support continued economic recovery. This financial market back-drop is not one that will cause the Fed to take additional actions to ease policy. Even the recent drop in the stock market appears to be more a reflection of economic optimism than a cause for concern. Looking at the performance of different equity sectors, we find that the sectors that stand to benefit from the end of the pandemic and economic re-opening are surging. Meanwhile, the sectors that are performing poorly are simply giving back some of the huge gains that were realized when the pandemic was raging last year. For example, cyclical sectors (Industrials, Energy and Materials) are soaring while defensive sectors (Healthcare, Communications, Consumer Staples and Utilities) have hooked down (Chart 5A). The ratio between the two remains tightly correlated with the 10-year Treasury yield. Similarly, Bank stocks have exploded higher since bond yields troughed last fall while the Technology sector has had difficulty making further gains (Chart 5B). Last year, the Tech sector benefited from low bond yields and surging demand. This year, Banks stand to profit from higher yields and an improving labor market. Finally, our US Equity Strategy team put together a basket of “COVID-19 Winners” designed to profit from the pandemic and a basket of “Back To Work” stocks designed to benefit from economic re-opening. Not surprisingly, the former is dragging the S&P 500 lower while the latter is on a tear (Chart 5C). Chart 5ASector Rotation: Cyclicals Vs. Defensives
Sector Rotation: Cyclicals Vs. Defensives
Sector Rotation: Cyclicals Vs. Defensives
Chart 5BSector Rotation: Banks Vs. Tech
Sector Rotation: Banks Vs. Tech
Sector Rotation: Banks Vs. Tech
Chart 5CSector Rotation: COVID Winners Vs. Re-Open Winners
Sector Rotation: COVID Winners Vs. Re-Open Winners
Sector Rotation: COVID Winners Vs. Re-Open Winners
The bottom line is that the recent dip in the stock market is not the result of investors pricing-in worse economic outcomes. Rather, it is a sector rotation driven by extreme economic optimism. It is certainly not a concern for the Fed. Other Reasons For The Fed To Change Its Balance Sheet Policy In addition to concerns about a drop in the stock market, several other reasons have been given for why the Fed might consider either increasing its asset purchases or shifting them toward the long end of the curve. 1) Treasury Market Liquidity Chart 6Treasury Market Liquidity
Treasury Market Liquidity
Treasury Market Liquidity
First, there is an ongoing tension in the Treasury market between imposing stricter capital regulations on dealer banks and ensuring that they have enough balance sheet capacity to maintain Treasury market liquidity during periods of stress.3 This delicate equilibrium broke down last March when Treasury market liquidity evaporated at a time when both equities and bonds were crashing. The Fed was forced to step into the Treasury market to sustain market functioning. Last week’s Treasury sell-off had a whiff of illiquidity about it as well. One liquidity index that measures the average curve fitting error across all government bond yields increased slightly, but not nearly as much as it did last March (Chart 6). Treasury bid/ask spreads also widened a touch, but unlike last March, Treasury ETFs continued to trade close to their net asset values. A significant deterioration in Treasury liquidity would prompt a quick response from the Fed. That is, the Fed would quickly ramp up purchases to restore market functioning. However, last week’s blip was not nearly severe enough to raise alarm bells. Other periods of Treasury market stress that have prompted the Fed to step in have occurred during periods of extreme economic deterioration and market panic, such as in March 2020 and 2008. With economic growth accelerating rapidly, we place low odds on a major Treasury market liquidity event occurring this year. 2) Expiry Of The SLR Exemption Chart 7Reserve Supply Is Massive
Reserve Supply Is Massive
Reserve Supply Is Massive
A second possible reason for the Fed to change its balance sheet policy is the upcoming expiry of the exemption to the Supplementary Leverage Ratio (SLR). The SLR is a regulation that requires large banks to hold common equity capital totaling at least 5% of assets. Assets are not risk-weighted for the purposes of the SLR. A problem arose with the SLR last March when the Fed bought massive amounts of bonds, flooding the banking system with reserves (Chart 7). The problem is that banks are forced to hold those reserves, and this makes it more difficult for them to meet their SLR requirement. To alleviate the problem, the Fed announced that reserves and Treasury securities would be exempted from the SLR calculation. Today, the issue is that this exemption is scheduled to expire at the end of March and the Fed has yet to announce whether it will be extended or allowed to lapse. Table 2US Bank Supplementary Leverage Ratios
No Panic From Powell
No Panic From Powell
If the exemption lapses, then banks may try to unload Treasury securities to remain compliant with the SLR. In theory, this could lead to upward pressure on Treasury yields that the Fed could mitigate by ramping up its asset purchases. However, it’s unclear how much of an impact a lapsing of the SLR exemption would actually have on the Treasury market. Even adjusting for a lapsing of the exemption, all major US banks remain compliant with the 5% SLR (Table 2). Also, banks could always decide to increase their SLRs by reducing share buybacks rather than by shedding Treasuries. In any event, an increase in Fed asset purchases to lean against rising Treasury yields driven by bank selling would be counterproductive. It would only flood the banking system with more reserves, making the SLR even more difficult to meet. Our view is that a fair compromise would be for the Fed to continue the SLR exemption for bank reserves, but to allow the Treasury security exemption to lapse. But even if the SLR exemption is allowed to lapse completely, we doubt that it will lead to enough market turmoil to prompt a change in the Fed’s balance sheet strategy. 3) Supply/Demand Imbalance In Money Markets Finally, some have noted that the large and growing supply of bank reserves could lead to problems in money markets. Specifically, with the Treasury Department now in the process of paying down its cash account (Chart 7, bottom panel), there is a lot of cash flooding into money markets and coming up against limited T-bill supply. In theory, the Fed could try to mitigate this problem by engaging in an Operation Twist – selling some T-bills and buying some coupon bonds. But we doubt this will occur. The Fed already has tools in place to maintain control over short rates in such circumstances. For example, the same situation arose in 2013 when an over-supply of bank reserves pushed short rates down toward the bottom of the Fed’s target range (Chart 8A). The Fed’s response was to create the Overnight Reverse Repo Facility (ON RRP). This facility allows counterparties to park excess cash at the Fed in exchange for a security off the Fed’s balance sheet. This proved to be an effective floor on repo rates and the fed funds rate, and we expect it will be again (Chart 8B). Chart 8AFed Created ON RRP In 2013...
Fed Created ON RRP In 2013...
Fed Created ON RRP In 2013...
Chart 8B... It Remains A Firm Floor On Rates
... It Remains A Firm Floor On Rates
... It Remains A Firm Floor On Rates
T-bill yields remained below the ON RRP rate for some time in 2014 and 2015, and the same thing could happen again this year. But this will not be a major concern for the Fed as long as it maintains control over the fed funds rate and the overnight repo rate. Eventually, the Treasury Department can deal with the lack of bill supply by increasing the amount of T-bill issuance. Bottom Line: Treasury market liquidity remains an ongoing concern for the Fed, and the possible expiry of the SLR exemption and lack of T-bill supply present additional near-term technical challenges. We think it’s unlikely that any of these things will prompt the Fed to deviate from its current pace and composition of asset purchases in 2021. Tracking Payrolls And The Countdown To Fed Liftoff Chart 9The Fed's Maximum Employment Targets
The Fed's Maximum Employment Targets
The Fed's Maximum Employment Targets
Employment growth surprised to the upside in February as 379 thousand jobs were added to nonfarm payrolls. This sent bond yields higher, but we caution that even stronger employment growth will be required to keep bond yields rising going forward. The Fed needs to see a return to “maximum employment” before it will lift rates off the zero bound. This means not only that the unemployment rate will have to fall to a range of 3.5% to 4.5%, but also that the labor force participation rate must make a full recovery to pre-pandemic levels (Chart 9). We calculate that average monthly employment growth of 419 thousand will be required to achieve this goal by the end of 2022 (Table 3). In other words, to justify the market’s January 2023 expected liftoff date, we will need to see average monthly payroll growth of at least 419 thousand going forward. Table 3Average Monthly Nonfarm Payroll Growth Required For The Unemployment Rate To Reach 4.5% By The Given Date
No Panic From Powell
No Panic From Powell
This number seems high, but it may be attainable. With vaccine distribution kicking into high gear, many service sectors of the economy will soon be able to re-open. This already started to happen last month when the Leisure & Hospitality sector added 355 thousand jobs. Even after last month’s gains, Leisure & Hospitality still accounts for 36% of the net job loss since last February (Table 4). This means that there is scope for extremely large employment gains this year if the coronavirus can be contained. Table 4Employment By Industry
No Panic From Powell
No Panic From Powell
Bottom Line: We need to see monthly nonfarm payroll growth coming in consistently above 419 thousand before we can be confident that the Fed will hike rates by the end of 2022. Ryan Swift US Bond Strategist rswift@bcaresearch.com Footnotes 1 https://www.bcaresearch.com/webcasts/detail/387 2 https://www.bloomberg.com/news/articles/2021-03-01/treasury-curve-dysfunction-ignites-talk-of-federal-reserve-twist?sref=Ij5V3tFi 3 For more details please see US Investment Strategy / US Bond Strategy Special Report, “Alphabet Soup, Part 2: Shocked And Awed”, dated July 28, 2020, available at usbs.bcaresearch.com Fixed Income Sector Performance Recommended Portfolio Specification
President Biden’s $1.9 trillion American Rescue Plan was approved by the Senate on Saturday and will be presented to the House on Tuesday for its final vote. Our Geopolitical Strategy team expects it to gain swift passage in the House in time for enactment…
The combination of large amounts of fiscal stimulus, accelerating vaccine rollouts, accumulated savings and ample monetary accommodation suggests that the moving average of sequential nominal GDP growth for the coming few quarters will hit levels last…
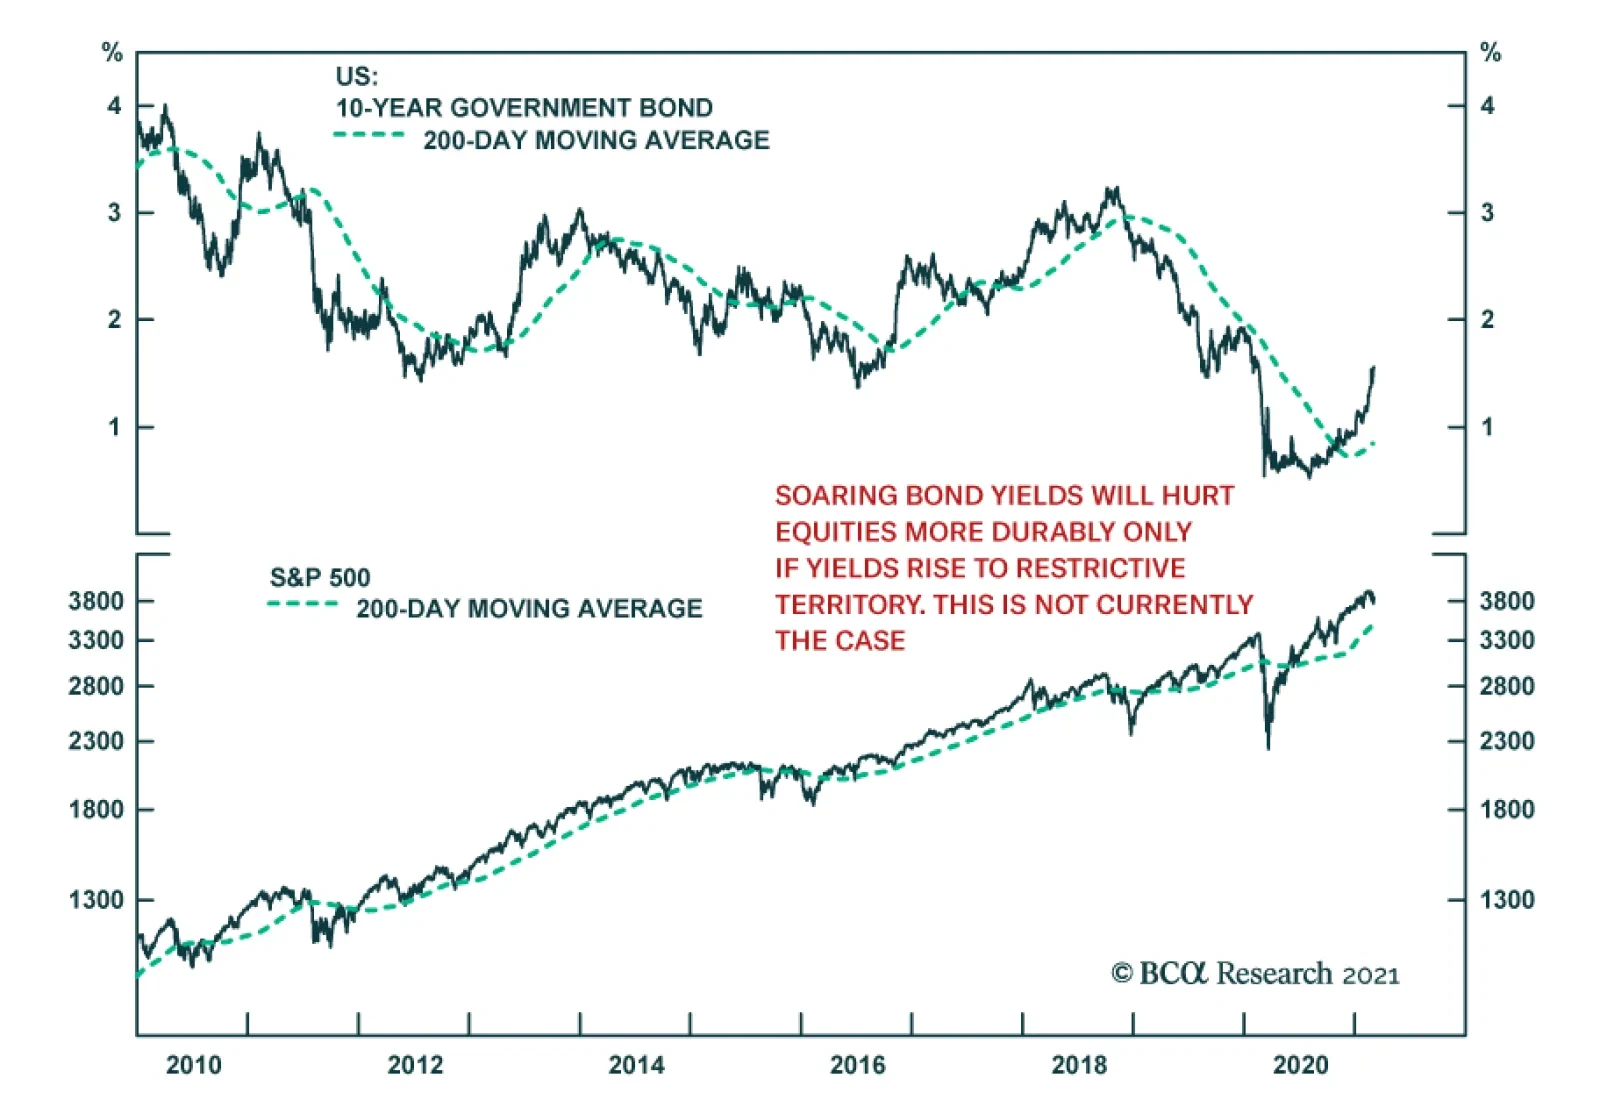
The US 10-year Treasury yield had climbed 16 basis points so far this month, alarming equity investors. March’s selloff to date follows a 35 basis point rise in February – the deepest monthly bond rout since November 2016. Although investors are…
Highlights The Senate will pass the $1.9 trillion American Rescue Plan largely as it stands. Markets will now turn to Biden’s second major reconciliation bill for FY2022 – the one with tax hikes. Democrats will go forward with tax hikes on corporations and the wealthy. But they will spend more than they tax for fear of squandering their term in power. Tax hikes threaten sectors like tech that already face headwinds from rising bond yields. The health sector is also at risk. Stick with cyclicals and value plays. Feature Markets have seesawed as volatility spikes in the face of rapidly rising bond yields. Value stocks such as financials stand to benefit relative to growth stocks as the market comes to grips with the first hint of normal inflation expectations since 2019 (Chart 1). Underlying the trend is a sea change in US fiscal policy. Chart 1Value Stocks To Reignite On Rising Bond Yields
Value Stocks To Reignite On Rising Bond Yields
Value Stocks To Reignite On Rising Bond Yields
The House of Representatives passed the $1.9 trillion American Rescue Plan so it will now go to the Senate for revision, back to the House for approval, and then to President Biden’s desk by around March 14. Investors will now turn to Biden’s second major legislative act prior to the 2022 midterm election cycle: the fiscal year 2022 budget reconciliation process. Before we outline the time frame and tax hikes that that process will entail, we should take a moment to review the current bill. Senate Will Pass American Rescue Plan Largely As Is The House version of the $1.9 trillion American Rescue Plan contains $1,400 household rebates, direct checks via the Internal Revenue Service, for people who make less than $75,000 per year (double those numbers for married couples). Unemployment benefits are supposed to rise from $300 to $400 per week for 73 weeks instead of 50 weeks, with an expiration on August 29 instead of March 14. Those with children or other dependents will receive additional payments. The bill also includes $75 billion for fighting COVID-19, $350 billion for state and local governments, $170 billion for schools and universities, $225 billion for small business, $38 billion for the airline industry and various other tax benefits for families and workers.1 Those who have been let go from their jobs can more easily retain their previous health insurance. Chart 2 provides a visual comparison of the American Rescue Plan with the $900 billion in fiscal relief passed at the end of 2020 prior to House passage and Senate revision. Already the Senate version excludes a hike to the minimum wage, from $7.25 to $15 per hour, as the Senate parliamentarian ruled that does not qualify under the “Byrd rule” because it does not directly impact spending or taxation.2 Vice President Kamala Harris, who is also president of the Senate, could reverse this decision but otherwise the minimum wage will have to be considered in a separate bill later. Chart 2American Rescue Plan
Taxes Will Rise But It Is Still A Fiscal Blowout
Taxes Will Rise But It Is Still A Fiscal Blowout
The Senate could pare back other aspects of the bill – such as state and local aid, given that local government revenues are in much better shape than expected. Chart 2 highlights that the state and local aid component is much larger this time around. Still, the purpose of Senate negotiations is to secure the votes of moderate Democrats, as winning over 10 Republicans is no longer feasible, and moderate senators are not going to sink the first legislative proposal of a president of their own party. The Senate is virtually guaranteed to pass the bill, likely by March 14 when current unemployment benefits expire. The bill’s economic impact will be to speed the vaccination process and provide another infusion of cash into households and various public institutions. Families are just starting to receive the last round of benefits passed in December and they had not exhausted the 14% year-on-year increase in real income that they saw as a result of last year’s CARES Act when the Coronavirus Response and Relief Act sent incomes soaring yet again (Chart 3). Economic growth will be supercharged as economic activity normalizes, consumer confidence recovers, and the service sector revives. Chart 3Washington Lavishes Households With Dole
Washington Lavishes Households With Dole
Washington Lavishes Households With Dole
Biden’s Second Bill Will Pass This Fall The second budget reconciliation procedure, for fiscal year 2022, will begin in mid-April. The formal deadline to adopt a budget resolution is April 15 but the average delay would put the resolution in June.3 The maximum delay would see the resolution passed in October but that is unlikely in today’s context (Diagram 1). After the resolution passes, the House and Senate must reconcile their budgets, pass the same bill, and send it to the president for his signature. Diagram 1Timeline Of Biden Administration’s Second Budget Reconciliation, FY2022
Taxes Will Rise But It Is Still A Fiscal Blowout
Taxes Will Rise But It Is Still A Fiscal Blowout
The average time between Congress adopting a budget resolution and the president signing a reconciliation bill into law is 150 days, putting completion on September 15, 2021. This period could easily extend to November. In the worst-case, judging by history, Democrats could fail to conclude the process until October 2022 – but that is highly unlikely. A delay till December of this year would be a fumble, but a more realistic fumble, say if moderate Democrats must be won over due to controversial provisions. The second reconciliation bill is supposed to consist of investments over a ten-year period rather than emergency relief for the lingering pandemic and economic recovery. Biden’s proposed $2-$3 trillion green infrastructure program is the highlight but we also expect Democrats to prioritize their health care plan, which is estimated to cost $1.7-$1.9 trillion. Hence $4 trillion is a reasonable expectation for new spending but in this case the headline spending figure will be at least partially defrayed by tax hikes, unlike the first reconciliation bill (Charts 4A & 4B). If Biden raises taxes by half as much as he intends, the full price tag would be $2 trillion. Chart 4ABiden Will Spend, Then Tax
Taxes Will Rise But It Is Still A Fiscal Blowout
Taxes Will Rise But It Is Still A Fiscal Blowout
Chart 4BBiden Will Spend, Then Tax
Taxes Will Rise But It Is Still A Fiscal Blowout
Taxes Will Rise But It Is Still A Fiscal Blowout
The precise contours of this bill will remain unknown until Biden presents an outline in April and the House of Representatives drafts a resolution. We test six different scenarios involving different assumptions about Biden’s tax-and-spend proposals, highlighted in Table 1. Generally, we assume that Democrats will much more readily compromise tax hikes rather than spending, given that they want to err on the side of firing up the economic recovery. They are just as capable as Republicans were in 2017 of manipulating the numbers when it comes to the reconciliation requirement that the budget deficit not increase beyond a ten-year time period. Table 1Scenarios For Biden’s Second Reconciliation Bill
Taxes Will Rise But It Is Still A Fiscal Blowout
Taxes Will Rise But It Is Still A Fiscal Blowout
The results are broken down in terms of revenue, expenditure, and net interest costs in Chart 5. The baseline is Biden’s campaign proposal. Scenario 1 assumes that Biden gets all of the spending he wants but is forced to compromise on tax hikes. Scenario 2 is more realistic as it assumes that Biden gets half of what he wants on both spending and taxes. Scenarios 3-6 examine what would happen if Biden were forced to strike out either his green infrastructure plan or his health and social security plan, depending on different revenue assumptions. In Scenarios 5 and 6 we grant Biden only half of his proposed taxes on corporations and wealthy folks, leaving other tax proposals to the side – otherwise the result would be a net tightening of fiscal conditions, which is neither intended nor politically possible. Chart 5Scenarios For Biden’s Second Reconciliation Bill
Taxes Will Rise But It Is Still A Fiscal Blowout
Taxes Will Rise But It Is Still A Fiscal Blowout
The impact on the budget deficit in each scenario is shown in Chart 6. The greatest economic stimulus would occur under Scenario 1, which would soon become a problem for investors as it would hasten inflation and rising interest rates. Chart 6Deficit Scenarios For Biden’s Second Reconciliation Bill
Taxes Will Rise But It Is Still A Fiscal Blowout
Taxes Will Rise But It Is Still A Fiscal Blowout
Scenario 2 is the most realistic policy scenario while being the least inflationary. By contrast, Scenario 4 is realistic but hardly less inflationary than the baseline case. In each of these scenarios it is important to bear in mind that the new government programs would be administered over a ten-year period and therefore the increase to the budget deficit would be more gradual than is the case of the American Rescue Plan, which clearly aims to be disbursed in the first few years. In the case of the Obama administration’s American Recovery and Reinvestment Act (2009) the peak in spending occurred in 2013, four years after the bill was passed (analogous to 2025 today) (Chart 7). Infrastructure and green energy projects are also expected to increase productivity and hence potential growth. Chart 7Infrastructure Spending Could Peak Four Years After Bill’s Passage, As In 2009-13
Taxes Will Rise But It Is Still A Fiscal Blowout
Taxes Will Rise But It Is Still A Fiscal Blowout
The Byrd rule will become even more important with Biden’s second reconciliation bill because the bill will contain a mishmash of Biden’s campaign proposals. Democrats will try to pass as much of their agenda via fast track as possible so as to meet promises ahead of the 2022 midterm election. An advantage of health care spending is that it is unlikely to be struck down by the Senate parliamentarian given that the Obama administration relied on reconciliation to pass a critical second installment to the Affordable Care Act (Obamacare). Biden’s health care plan is more popular than climate change policy, with both the general public and moderate Democrats, and it is guaranteed to pass reconciliation. Infrastructure spending faces greater challenges under reconciliation but they are not insurmountable. Infrastructure is normally handled via the traditional budget process or the Highway Trust Fund and some measures are likely to run afoul of the Byrd rule. Still, workarounds can be found.4 Hence the infrastructure plan is likely to be compromised but not prohibited due to technicalities. Even if infrastructure fails to make it into reconciliation, Biden can use the deadline to top up the exhausted Highway Trust Fund or to reauthorize the Surface Transportation Act as alternative pathways. It is not impossible to get Republican cooperation on infrastructure though the green agenda will meet resistance. The reconciliation process is nominally forbidden from increasing the budget deficit beyond ten years. Short-term spending is exempt, as is the case with the American Rescue Plan and its crisis-response measures, but the purpose of the second reconciliation bill is to invest in long-term, productivity-enhancing programs. A new government health insurance option and/or a green infrastructure buildout will take many years to implement and could increase deficits beyond the ten-year window. But Democrats, like Republicans, will be able to use accounting chicanery and gimmicks to make the budget outlook serve their purposes in passing the legislation. As long as they keep moderate members of the party on their side. Yes, Taxes Will Go Up … But That May Not Be All Bad For Markets Why should Democrats raise taxes at all? Why not focus on stimulus without taking on the political risk of higher taxes? After all, Republicans passed tax cuts via reconciliation without offsetting them by spending cuts. Was it not the higher taxes in Obamacare that greatly fueled resistance from Republicans and their victory in the House of Representatives in 2010? First, on the level of intentions, the Democrats clearly seek to increase taxes on corporations, high-income earners, and capital gains: Both Biden and Harris said they would raise taxes on the campaign trail and in the presidential debates despite the risk to their election prospects. Biden committed only to prevent tax hikes on those making less than $400,000 per year. Harris’s weakest moment in her debate with Mike Pence was her insistence that she would raise taxes but she stuck to her guns. Both factions of the Democratic Party want to raise taxes. Traditional Democrats view tax hikes as a way of paying for a larger government role in addressing social and economic imbalances. Populists view tax hikes as a way of redistributing from the ultra-rich. While budget deficits are not a general concern, combating inequality is a theme shared across the party. Second, on the level of capability, Democrats can get at least some of the tax increases that they want: The US is not overtaxed on the whole. True, Biden’s full tax agenda would push the US back up to the top of the OECD countries in terms of the corporate tax if an “integrated” view of both firm-level taxes and taxes on dividends and capital gains (Chart 8). But this point suggests that Biden will moderate his tax plan rather than abandon it altogether. Popular opinion did not favor Trump for cutting corporate taxes. Chart 8Biden’s Corporate Tax Proposal Would Make US An Outlier Again
Taxes Will Rise But It Is Still A Fiscal Blowout
Taxes Will Rise But It Is Still A Fiscal Blowout
The macroeconomic impact of raising taxes is manageable in the context of the extraordinary fiscal stimulus that the US is passing. There is no clear relationship between tax rates and economic growth but it is natural for the Democrats to fear that they could squander their term in power by excessive fiscal tightening. Yet the negative economic impact of raising the corporate rate is only 0.8% of GDP over the long run, and half of that if the corporate rate is raised only halfway to what Biden intends (25% instead of 28%) (Table 2), according to the conservative-leaning Tax Policy Foundation. Table 2Economic Impact Of Corporate Tax Not Dramatic
Taxes Will Rise But It Is Still A Fiscal Blowout
Taxes Will Rise But It Is Still A Fiscal Blowout
President Biden has the political capital early in his term to revise the Trump tax cuts according to Democratic prerogatives. His popularity will not hold up for long (Chart 9). And he only just has enough legislative power. While household sentiment is weak and economic conditions are moderate, both are set to improve as the pandemic fades and fiscal stimulus takes effect (Table 3). While tax hikes will embolden Republican opposition and the Democrats will have lost their chance to affect the tax code if Republicans win in 2022. At the moment, Republicans are divided and unpopular, so Democrats have a window of opportunity (Chart 10). Chart 9Thesis, Antithesis, Synthesis?
Taxes Will Rise But It Is Still A Fiscal Blowout
Taxes Will Rise But It Is Still A Fiscal Blowout
Chart 10Independents Up, Republicans Down
Independents Up, Republicans Down
Independents Up, Republicans Down
Table 3Political Capital Index
Taxes Will Rise But It Is Still A Fiscal Blowout
Taxes Will Rise But It Is Still A Fiscal Blowout
While Democrats could chuck all the Senate rules out the window in order to pass their spending plans without any offsets, this would anger moderates who tend to uphold Senate rules and norms. The party cannot afford to lose a single vote from their caucus in the Senate. Yet moderate Democrats are not against tax increases in principle. What they would oppose is either excessive tax hikes or a fiscal spending bonanza without any revenue offsets at all.5 It is entirely feasible to back-load tax increases so that they take effect in the latter half of the ten-year budget window, especially after the 2024 election. Treasury Secretary Janet Yellen is advising precisely this course of action and has herself argued that corporate tax hikes will go through.6 There may be some risk that Democrats go full left-wing populist and abandon any semblance of fiscal responsibility so as to supercharge the economy. So far they have agreed to maintain the Senate filibuster and scrap the minimum wage hike but this acceptance of Senate norms may not last as pressure builds. The second reconciliation bill is the last chance to fast-track major initiatives before the midterm. Vice President Harris could overrule the Senate parliamentarian across the board. This scenario is unlikely. The White House and Congress will find a balance that raises some revenue but errs on the fiscally accommodative side, as our scenarios above highlight. Investment Takeaways The market’s concern is that the Democrats will “overdo” the fiscal response and we fully share this concern. The American Rescue Plan alone will plug the output gap by almost three times more than the amount required. The coming tax hikes will not offset the wave of new spending that is coming down the pike. Democrats will partially reverse Trump’s tax cuts in the context of additional pump-priming that constitutes a net increase to the budget deficit. The net effect is inflationary. If Congress were to pass another $2 trillion bill without any substantial revenue offsets then the market would face an even bigger inflationary jolt and an even earlier return to rate hikes by the Fed. But this scenario is unlikely. So the inflationary risk is clear but investors need not panic in the short run. Our infrastructure trade is back on track as the reflation trade rumbles onward (Chart 11). The Democrats will get at least one more major bill passed and it will likely include at least half of Biden’s agenda, including around $2 trillion on green infrastructure. We will discuss the renewable energy portion at length in a forthcoming report. The health care sector faces headwinds from both Biden’s health policies and corporate tax hikes. The sectors that stand to benefit the most from a higher corporate tax rate are those that benefited least from Trump’s Tax Cut and Jobs Act – namely energy, industrials, materials, and financials, in that order (Chart 12A). These are also the cyclical plays that we favor in today’s accommodative policy environment. Chart 11Infrastructure Trade Back On Track
Infrastructure Trade Back On Track
Infrastructure Trade Back On Track
Chart 12ACyclicals Outperforming Health Care
Cyclicals Outperforming Health Care
Cyclicals Outperforming Health Care
Chart 12BCyclicals To Outperform Tech?
Cyclicals To Outperform Tech?
Cyclicals To Outperform Tech?
The same cyclical sectors are also trying to make headway against the tech sector, which stands to suffer from higher interest rates as well as higher taxes, including a minimum tax on book earnings, if that part of Biden’s agenda makes it through the negotiations this fall (Chart 12B). Matt Gertken Vice President Geopolitical Strategy mattg@bcaresearch.com Appendix Table A1APolitical Capital: White House And Congress
Taxes Will Rise But It Is Still A Fiscal Blowout
Taxes Will Rise But It Is Still A Fiscal Blowout
Table A1BPolitical Capital: Household And Business Sentiment
Taxes Will Rise But It Is Still A Fiscal Blowout
Taxes Will Rise But It Is Still A Fiscal Blowout
Table A1CPolitical Capital: The Economy And Markets
Taxes Will Rise But It Is Still A Fiscal Blowout
Taxes Will Rise But It Is Still A Fiscal Blowout
Table A2Political Risk Matrix
Taxes Will Rise But It Is Still A Fiscal Blowout
Taxes Will Rise But It Is Still A Fiscal Blowout
Table A3Biden’s Cabinet Position Appointments
Taxes Will Rise But It Is Still A Fiscal Blowout
Taxes Will Rise But It Is Still A Fiscal Blowout
Footnotes 1See Jeff Drew, “House passes $1.9 trillion stimulus bill with a variety of small business relief,” and Alistair M. Nevius, “Tax provisions in the American Rescue Plan Act,” February 27, 2021, Journal of Accountancy, journalofaccountancy.com. 2See “The Budget Reconciliation Process: The Senate’s ‘Byrd Rule,’” Congressional Research Service, December 1, 2020, fas.org. 3The current delay centers on whether the Senate will confirm Biden’s appointee for director of the Office of Management and Budget, Neera Tanden, who lost support from key moderate Democrat Joe Manchin. If she does not receive a compensatory Republican vote then Biden will have to appoint someone else and the Senate will have to confirm. Thus the budget resolution could easily be delayed into May or June. 4For the difficulties, see Peter Cohn, “Democrats plan a spending blowout, but hurdles remain,” Roll Call, January 11, 2021, rollcall.com. For workarounds, see Zach Moller and Gabe Horwitz, “Reconciliation: How It Works and How to Use It to Help American Workers Recover,” Third Way, February 1, 2021, thirdway.org. 5See Alexander Bolton, “Democrats hesitant to raise taxes amid pandemic,” The Hill, February 25, 2021, thehill.com. 6See Saleha Mohsin and Christopher Condon, “Yellen Favors Higher Company Tax, Signals Capital Gains Worth a Look”, Bloomberg, February 22, 2021, Bloomberg.com