United States
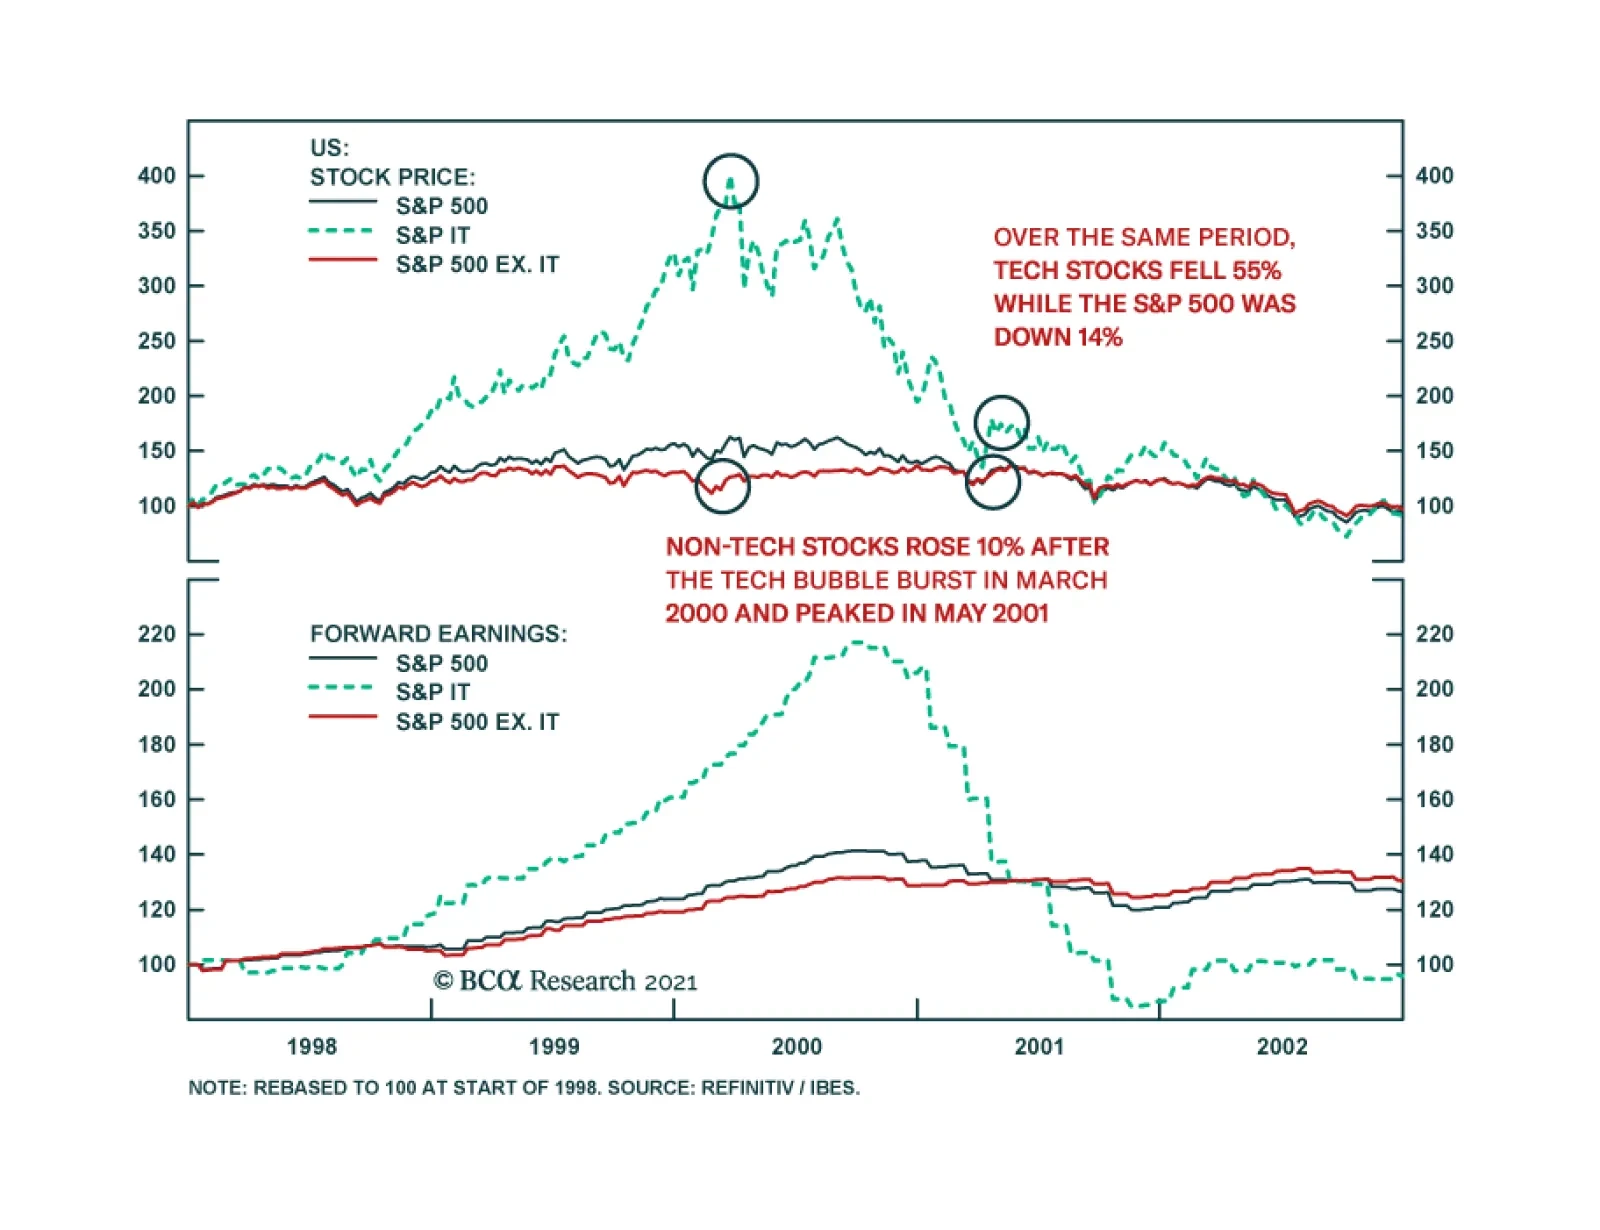
BCA Research’s Global Investment Strategy service concludes that the end of the pandemic will herald a period of value-oriented outperformance. There are some notable similarities between 2000 and the present. One potential parallel with 2000 that is worth…
The DXY index bottomed a nudge below the 90 level and is gaining momentum in March. Three reasons have catalyzed the rally in the greenback. First, the dollar was very much oversold, with net speculative positioning heavily short and sentiment close to a…
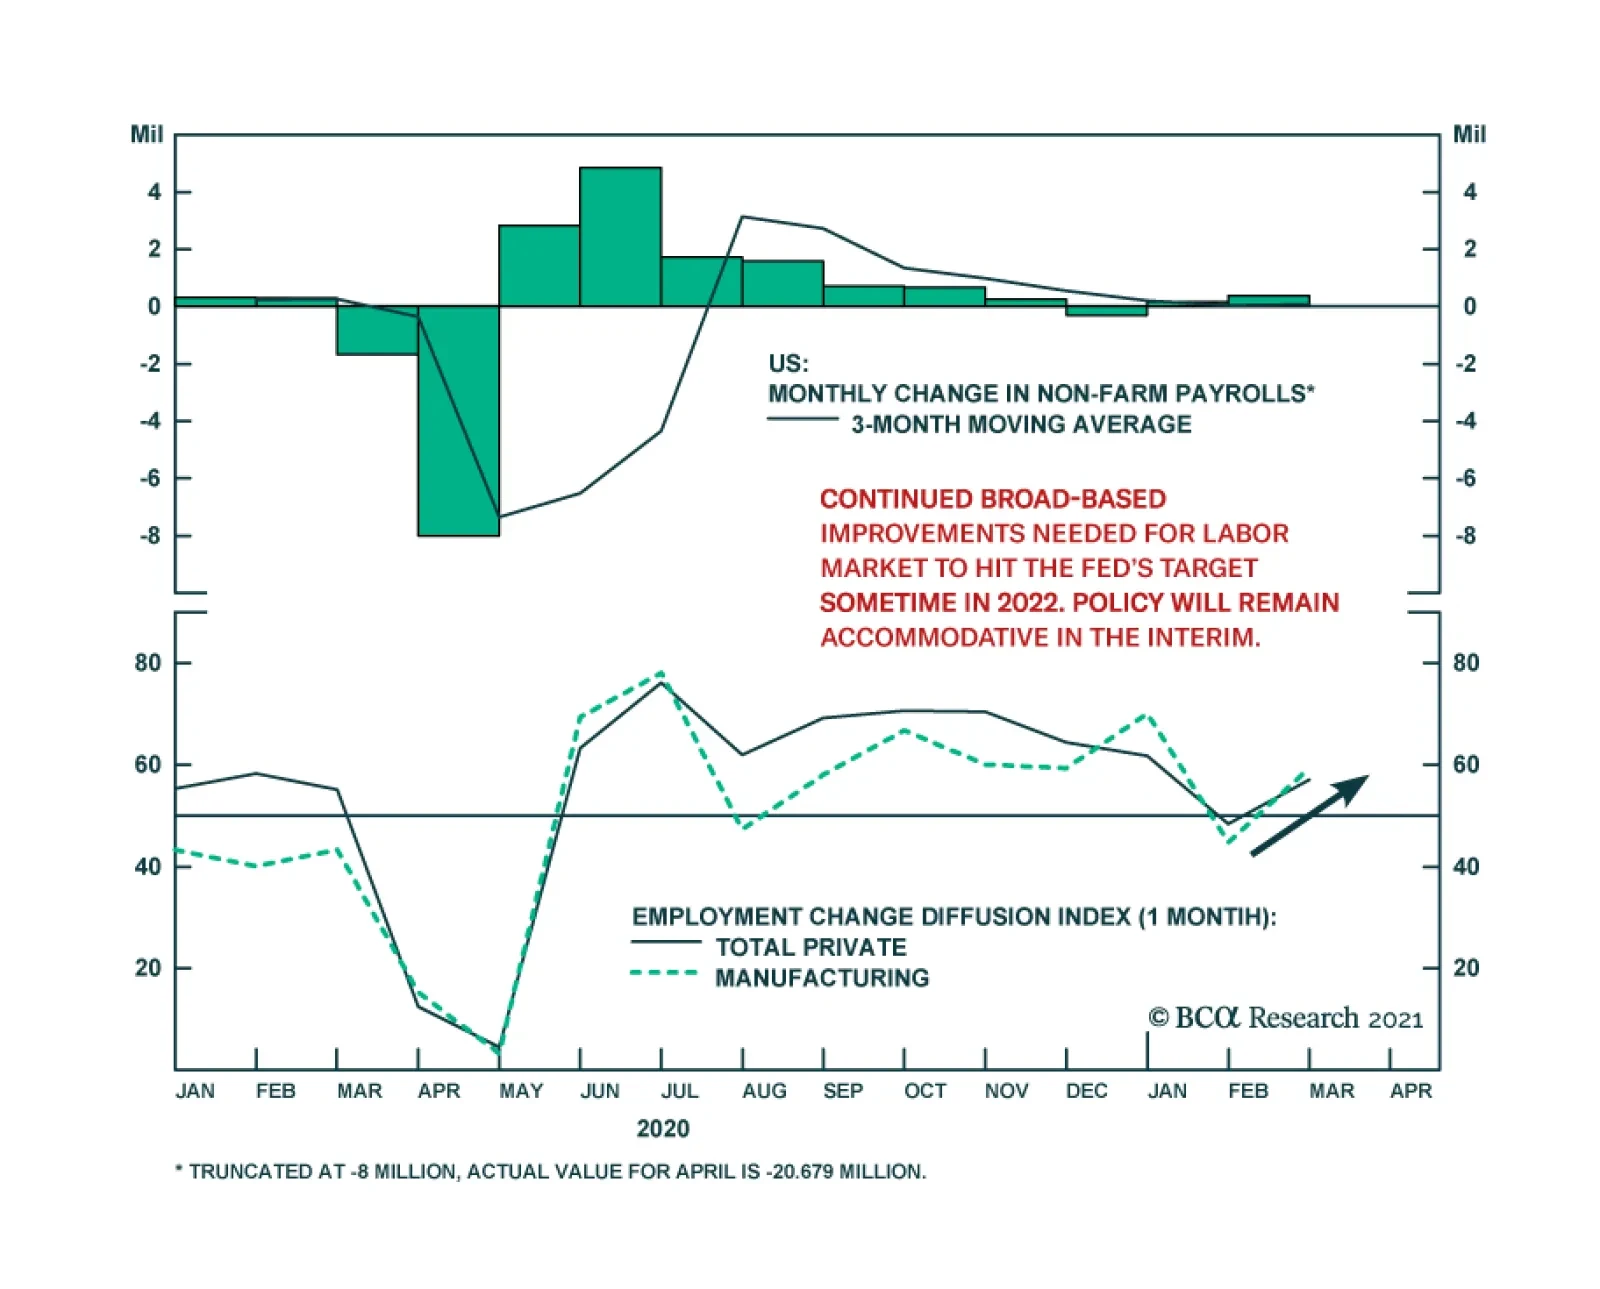
The US Jobs report for February was better than expected. Nonfarm payrolls increased by 379 thousand, nearly double the 200 thousand increase expected by the consensus. In addition, January’s figure was revised up to 166 thousand from 49 thousand. Notably,…

Dear client, In addition to this week’s abbreviated report, we are also sending you a Special Report on currency hedging, authored by my colleague Xiaoli Tang. Xiaoli’s previous work mapped out a dynamic hedging strategy for developed market equity investors in various home currencies. In this report, she extends the work to emerging market exposure. I hope you will find the report insightful. Next week, in lieu of our weekly report on Friday, we will be sending you a joint Special Report on the UK on Tuesday, together with our Global Fixed Income colleagues. Kind regards, Chester Highlights The DXY index is up for the year, but further gains will be capped at 2-3% from current levels. Long yen positions are offside amid the dollar rally. This should wash out stale longs, and underpin the bull case. Lower the limit-sell on the gold/silver ratio to 68. We were stopped out of our short AUD/MXN position amidst a broad-based selloff in EM currencies. We are reinitiating the trade this week. Feature Chart I-1The Dollar Has Been Strong In 2021
The Dollar Has Been Strong In 2021
The Dollar Has Been Strong In 2021
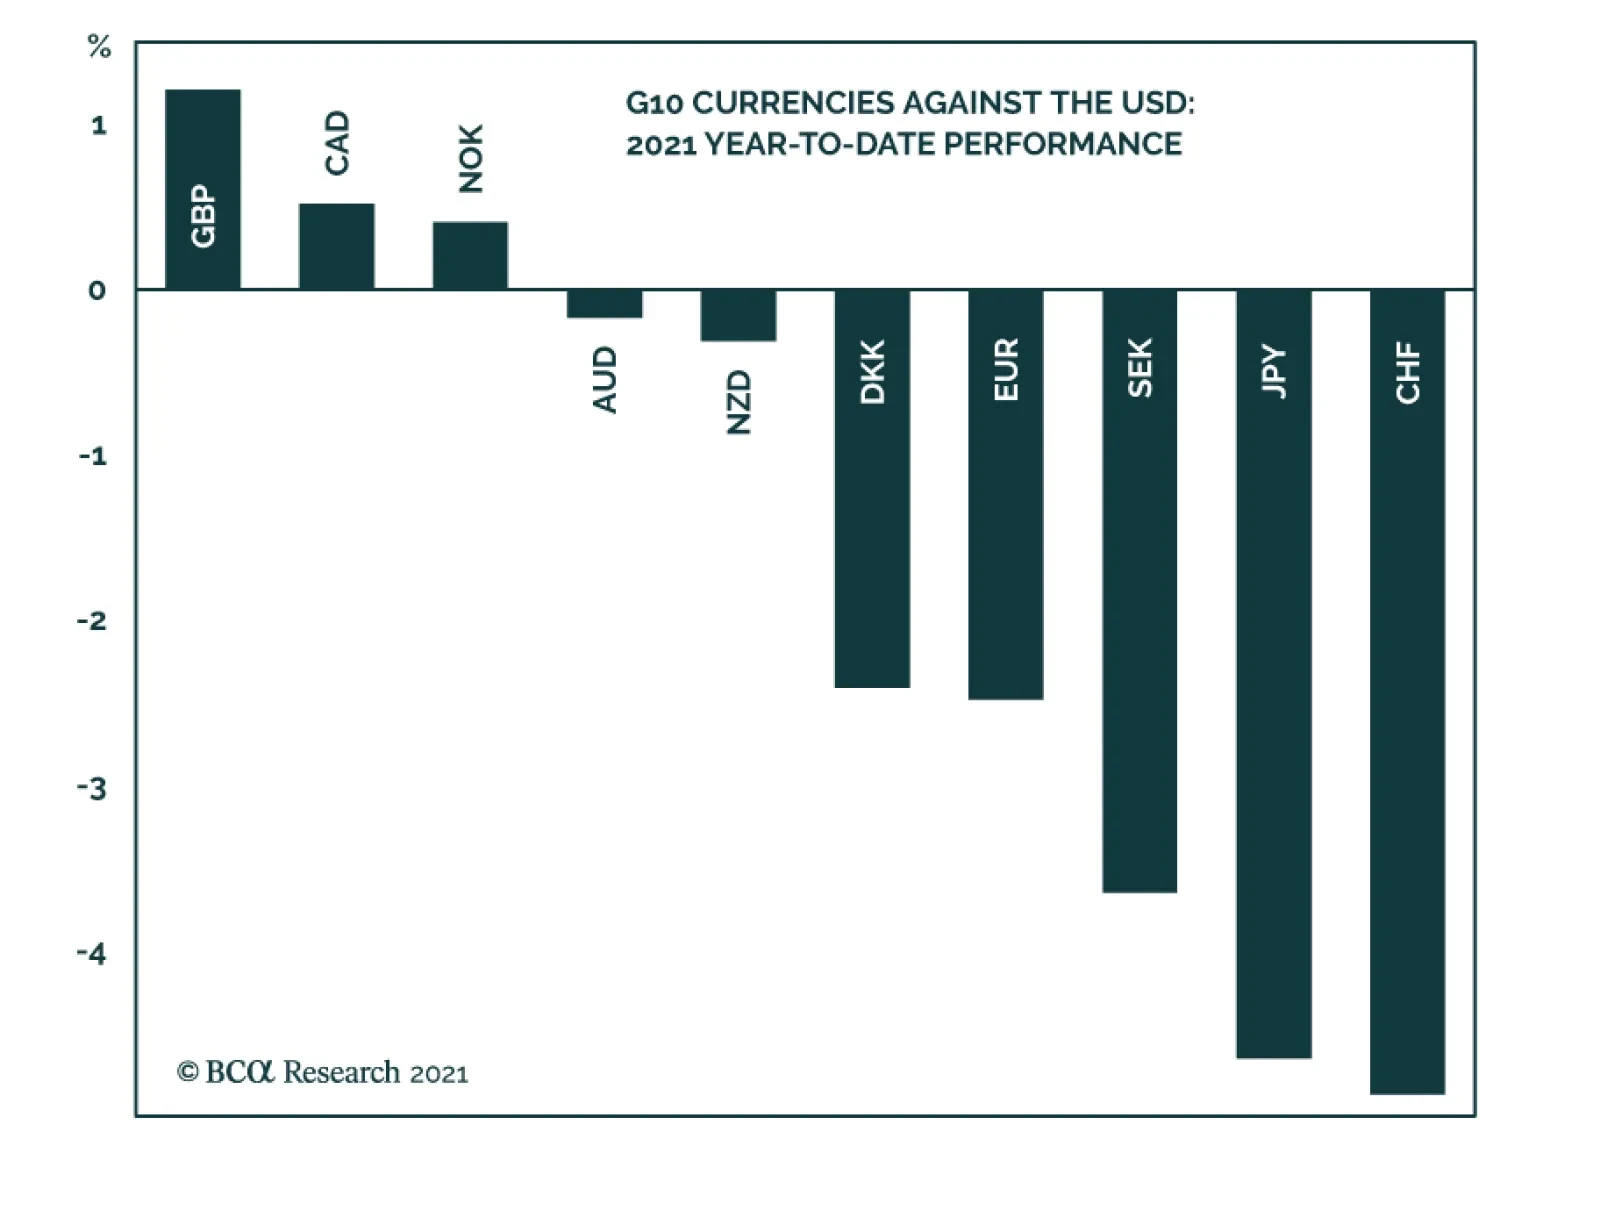
The DXY index has once again kissed off the 90 level and is gaining momentum in March. Year-to-date, the DXY index is up 1.1%. This performance has been particularly pronounced against other safe haven currencies, such as the Swiss franc and the Japanese yen. GBP and AUD have fared rather well in this environment (Chart I-1). As the “anti-dollar,” the euro has also suffered. Our technical indicators continue to warn that the dollar still has upside. Net speculative positions are at very depressed levels, consistent with many sentiment indicators that are bearish USD. However, this time around, any dollar rally could be capped at 2-3%, in sharp contrast to the bounce we witnessed in March 2020. The Message From Dollar Technical Indicators Our dollar capitulation index has bounced from very oversold levels, and is now sitting above neutral territory (Chart I-2). The index comprises a standardized measure of sentiment, net speculative positioning and momentum. It is very rare that a drop in this index below the -1.5 level does not trigger a rebound in the dollar. This time around, the bounce has been rather muted. Chart I-2BCA Dollar Capitulation Index Suggests Some Upside
BCA Dollar Capitulation Index Suggests Some Upside
BCA Dollar Capitulation Index Suggests Some Upside
Part of the reason has been concentration around dollar short positions. Investors throughout most of the pandemic executed their bearish dollar bets through the euro, yen and the Swiss franc (countries that already had negative interest rates). Positioning on risk on currencies such as the Australian dollar and the Mexican peso were neutral. This also explains the underperformance of the yen, as the dollar rises. From a sizing standpoint, ever since the dollar peaked in March 2020, counter-trend moves have been in the order of 2-3%. We expect this time to be no different. What To Do About The Yen The yen has been one of our core holdings on three fundamental pillars: it is cheap, it tends to rise during dollar bear markets and the economy in Japan is more hostage to deflation than the US. This bodes well for real rates in Japan, relative to the US. Over the last month, our long yen position has been put offside. First, demand for safe havens has ebbed as US interest rates have gapped higher (Chart I-3, panel 1). King dollar has once again become the safe haven of choice. As Chart I-1 illustrates, low beta currencies such as the Swiss franc and yen, that tend to do relatively well when the dollar is rallying, have underperformed. Yield curve control (YCC) in Japan is also negative for the yen as interest rates rise (panel 2). Economic momentum in Japan is also rolling over (panel 3). Prime Minister Yoshihide Suga’s mulling to extend the state of emergency in the Tokyo region could further cripple any Japanese economic recovery. Chart I-3A Healthy Reset In The Yen
A Healthy Reset In The Yen
A Healthy Reset In The Yen
Chart I-4USD/JPY Support Should Hold
USD/JPY Support Should Hold
USD/JPY Support Should Hold
For short-term investors, USD/JPY is very overbought and is approaching strong resistance (Chart I-4). In our view, a washing out of stale shorts would provide a healthy reset for the bear market to resume. Meanwhile, USD/JPY and the DXY change correlations during risk-off periods, where the yen appreciates versus the dollar. Therefore, a market reset is also positive for the yen. Housekeeping Chart I-5Remain Short AUD/MXN
Remain Short AUD/MXN
Remain Short AUD/MXN
We were stopped out of our short AUD/MXN trade last week for a loss of 6.1%. We are reinitiating the trade this week. The case for the trade, made a month ago, remains intact. A short-term recovery in the US economy, relative to the rest of the world, argues for an AUD/MXN short. In fact, a divergence has occurred between the BRL/MXN and the AUD/MXN exchange rate (Chart I-5). Domestic factors have certainly tempered the Brazilian real, but the underperformance of metal prices relative to oil in recent months is also a factor. We expect some convergence to occur, with MXN appreciating much faster than the AUD. Chester Ntonifor Foreign Exchange Strategist chestern@bcaresearch.com Currencies U.S. Dollar Chart II-1USD Technicals 1
USD Technicals 1
USD Technicals 1
Chart II-2USD Technicals 2
USD Technicals 2
USD Technicals 2
Recent data in the US have stepped up: Personal income rose by 10% in January, while personal spending rose by 2.4% month-on-month. The ISM report was stellar. The manufacturing PMI improved from 58.7 to 60.8 in February. Prices paid rose to 86. Factory orders were slightly above expectations at 2.6% month-on-month in January. The DXY index rose by 165 bps this week. The narrative of a counter-trend reversal in the DXY index isn playing out. As the story unfolds, it will be important to establish targets. Our bias is that the DXY stalls before 93-94 is reached. Report Links: Are Rising Bond Yields Bullish For The Dollar? - February 19, 2021 Portfolio And Model Review - February 5, 2021 Sizing A Potential Dollar Bounce - January 15, 2021 The Euro Chart II-3EUR Technicals 1
EUR Technicals 1
EUR Technicals 1
Chart II-4EUR Technicals 2
EUR Technicals 2
EUR Technicals 2
Recent data from the euro area remain weak: Core CPI in the Eurozone came in at 1.1%, in line with expectations. The unemployment rate declined from 8.3% to 8.1% in January. January retail sales were weak at -6.4% year-on-year. The euro fell by 1.7%% against the US dollar this week. It will be almost impossible for the euro to rise in an environment where the dollar is in a broad-based decline. Given elevated sentiment on the euro, a healthy reset is necessary for the bull market to resume. Report Links: Portfolio And Model Review - February 5, 2021 On Japanese Inflation And The Yen - January 29, 2021 The Dollar Conundrum And Protection - November 6, 2020 The Japanese Yen Chart II-5JPY Technicals 1
JPY Technicals 1
JPY Technicals 1
Chart II-6JPY Technicals 2
JPY Technicals 2
JPY Technicals 2
Recent data from Japan has been marginally positive: The employment report was positive, with the unemployment rate dipping to 2.9% and an improvement in the jobs-to-applicants ratio in January. Consumer confidence in February is rebounding from very low levels. The Japanese yen fell by 1.5% against the US dollar this week. The recovery in the Japanese economy is fragile, and tentative signs of a renewed lockdown will knock down confidence. In this transition phase, yen long positions could be hostage to losses. Longer-term, the yen is cheap and will benefit from a broad-based dollar decline. Report Links: On Japanese Inflation And The Yen - January 29, 2021 The Dollar Conundrum And Protection - November 6, 2020 The Near-Term Bull Case For The Dollar - February 28, 2020 British Pound Chart II-7GBP Technicals 1
GBP Technicals 1
GBP Technicals 1
Chart II-8GBP Technicals 2
GBP Technicals 2
GBP Technicals 2
Recent data out of the UK have been in line: Mortgage approvals rose 99K in January, in line with expectations. The construction PMI rose from 49.2 to 53.3 in February. Nationwide house prices are soaring, rising 6.9% in February on a year-on-year basis. The pound fell by 0.8% against the dollar this week. It is however the best performing currency this year. Our short EUR/GBP trade has benefited from faster vaccination in the UK (that could give way to a faster reopening of the economy) and a nice valuation starting point. Report Links: Portfolio And Model Review - February 5, 2021 The Dollar Conundrum And Protection - November 6, 2020 Revisiting Our High-Conviction Trades - September 11, 2020 Australian Dollar Chart II-9AUD Technicals 1
AUD Technicals 1
AUD Technicals 1
Chart II-10AUD Technicals 2
AUD Technicals 2
AUD Technicals 2
Recent data in Australia was robust: Home lending remained in an uptrend. Owner-occupied loans increased by 11% in January, while investor loans increased by 9.4%. Terms of trade are soaring, rising 24% year-on-year in February. The current account surplus came in near a record A$14.5 billion in Q4. GDP grew by 3.1% QoQ in Q4. The Aussie fell by 1.8% his week. Terms of trade will continue being a tailwind for the AUD/USD. We also like the AUD/NZD cross, as a valuation and terms-of-trade bet. However, we expect that any positive surprises in the US will hurt AUD relative to the Americas. One way to play this is by shorting AUD/MXN. Report Links: Portfolio And Model Review - February 5, 2021 Australia: Regime Change For Bond Yields & The Currency? - January 20, 2021 An Update On The Australian Dollar - September 18, 2020 New Zealand Dollar Chart II-11NZD Technicals 1
NZD Technicals 1
NZD Technicals 1
Chart II-12NZD Technicals 2
NZD Technicals 2
NZD Technicals 2
There was scant data out of New Zealand this week: Terms of trade rose by 1.3% in Q4. CoreLogic home prices rose 14.5% in February. The New Zealand dollar fell by 2.4% against the US dollar this week. The kiwi ranks as the most unattractive currency in our FX framework. For one, it has catapulted itself to the most expensive currency in our PPP models. Report Links: Portfolio And Model Review - February 5, 2021 Currencies And The Value-Versus-Growth Debate - July 10, 2020 Updating Our Balance Of Payments Monitor - November 29, 2019 Canadian Dollar Chart II-13CAD Technicals 1
CAD Technicals 1
CAD Technicals 1
Chart II-14CAD Technicals 2
CAD Technicals 2
CAD Technicals 2
Recent data from Canada was positive: The Nanos confidence index rose from 58.2 to 59.4 in February. Annualized 4Q GDP came in at 9.6%, above expectations. Building permits rose 8.2% month-on-month in January. The Canadian dollar fell 0.4% against the US dollar this week. Oil prices remain very much in an uptrend, which is underpinning the loonie. Better US economic performance in the near term should also help the CAD. Report Links: Will The Canadian Recovery Lead Or Lag The Global Cycle? - February 12, 2021 Currencies And The Value-Versus-Growth Debate - July 10, 2020 More On Competitive Devaluations, The CAD And The SEK - May 1, 2020 Swiss Franc Chart II-15CHF Technicals 1
CHF Technicals 1
CHF Technicals 1
Chart II-16CHF Technicals 2
CHF Technicals 2
CHF Technicals 2
Recent data out of Switzerland have been improving: Swiss GDP rose by 0.3% quarter-on-quarter in 4Q. The KOF leading indicator rose from 96.5 to 102.7 in February. The February manufacturing PMI rose from 59.4 to 61.3. Switzerland remains in deflation, with the core CPI that came in at -0.3% year-on-year in February. The Swiss franc fell by 2.6% against the US dollar this week. Safe -haven currencies continue to be laggards, as rates rise and gold falls to the wayside. This is bullish on procyclical currencies, and negative the Swiss franc. We are long EUR/CHF on this basis, but short USD/JPY purely as portfolio insurance. Report Links: Portfolio And Model Review - February 5, 2021 The Dollar Conundrum And Protection - November 6, 2020 On The DXY Breakout, Euro, And Swiss Franc - February 21, 2020 Norwegian Krone Chart II-17NOK Technicals 1
NOK Technicals 1
NOK Technicals 1
Chart II-18NOK Technicals 2
NOK Technicals 2
NOK Technicals 2
The data out of Norway has been robust: The unemployment rate fell from 4.4% to 4.3% The manufacturing PMI increased from 51.8 to 56.1 in February. The current account balance was robust in Q4. It should increase significantly in Q1 this year given the large trade balance in January. Being long the Norwegian krone is one of our high-conviction bets in the FX portfolio. The Norwegian krone fell by 1% against the US dollar this week, but outperformed the euro, amongst other currencies. The NOK ticks all the boxes of an attractive currency – cheap valuations, a liquidity discount, and primed to benefit from a global growth rebound. Report Links: Portfolio And Model Review - February 5, 2021 Revisiting Our High-Conviction Trades - September 11, 2020 A New Paradigm For Petrocurrencies - April 10, 2020 Swedish Krona Chart II-19SEK Technicals 1
SEK Technicals 1
SEK Technicals 1
Chart II-20SEK Technicals 2
SEK Technicals 2
SEK Technicals 2
Most Swedish data releases were in line with expectations: GDP came in at -0.2% quarter-on-quarter, below expectations. Retail sales rose 3.1% year-on-year, above expectations. The trade balance came in at a surplus of SEK 5.2 billion in January. The manufacturing PMI remained elevated at 61.6 in February. The Swedish krona fell by 2.4% against the US dollar this week. Manufacturing data is improving in Sweden but the economy remains hostage to COVID-19, compared to Norway. That is weighing on the krona. That said, Sweden is a highly levered play on the global cycle. Therefore, once the pandemic is behind us, the SEK will outperform. Report Links: Revisiting Our High-Conviction Trades - September 11, 2020 Updating Our Balance Of Payments Monitor - November 29, 2019 Where To Next For The US Dollar? - June 7, 2019 Trades & Forecasts Forecast Summary Core Portfolio Tactical Trades Limit Orders Closed Trades
No Changes In Costco-land
No Changes In Costco-land
Underweight “COVID-19 Winners” hypermarket equities remain a solid underweight call. Worrisomely, relative share prices recently broke down and propelled relative returns for our portfolio into the double digits since the late-August inception. While there is a number of factors that weigh on this defensive industry, today we turn our attention to the US dollar. As the greenback depreciates, it reduces the purchasing power of US importers, including Big Box retailers that source most of their goods from abroad (bottom panel, import prices shown inverted). As a result, relative margins bear the brunt of the USD’s fall – especially given that these input cost increases are difficult to pass on to the consumer – profits slip and relative share prices find an equilibrium lower. True, the US dollar has retraced part of its losses recently, but given the lag between the currency debasing and its effects on import prices and margins, the FX related damage will likely have a lasting effect (see chart). Tack on the stealing of demand from the future that these defensive retail stores enjoyed all of last year, as WMT recently admitted on their earnings call, and the revenue and profit outlooks darken further for this safe haven industry. Bottom Line: Remain underweight the S&P hypermarkets index. The ticker symbols for the stocks in this index are: BLBG: S5HYPC – WMT, COST.
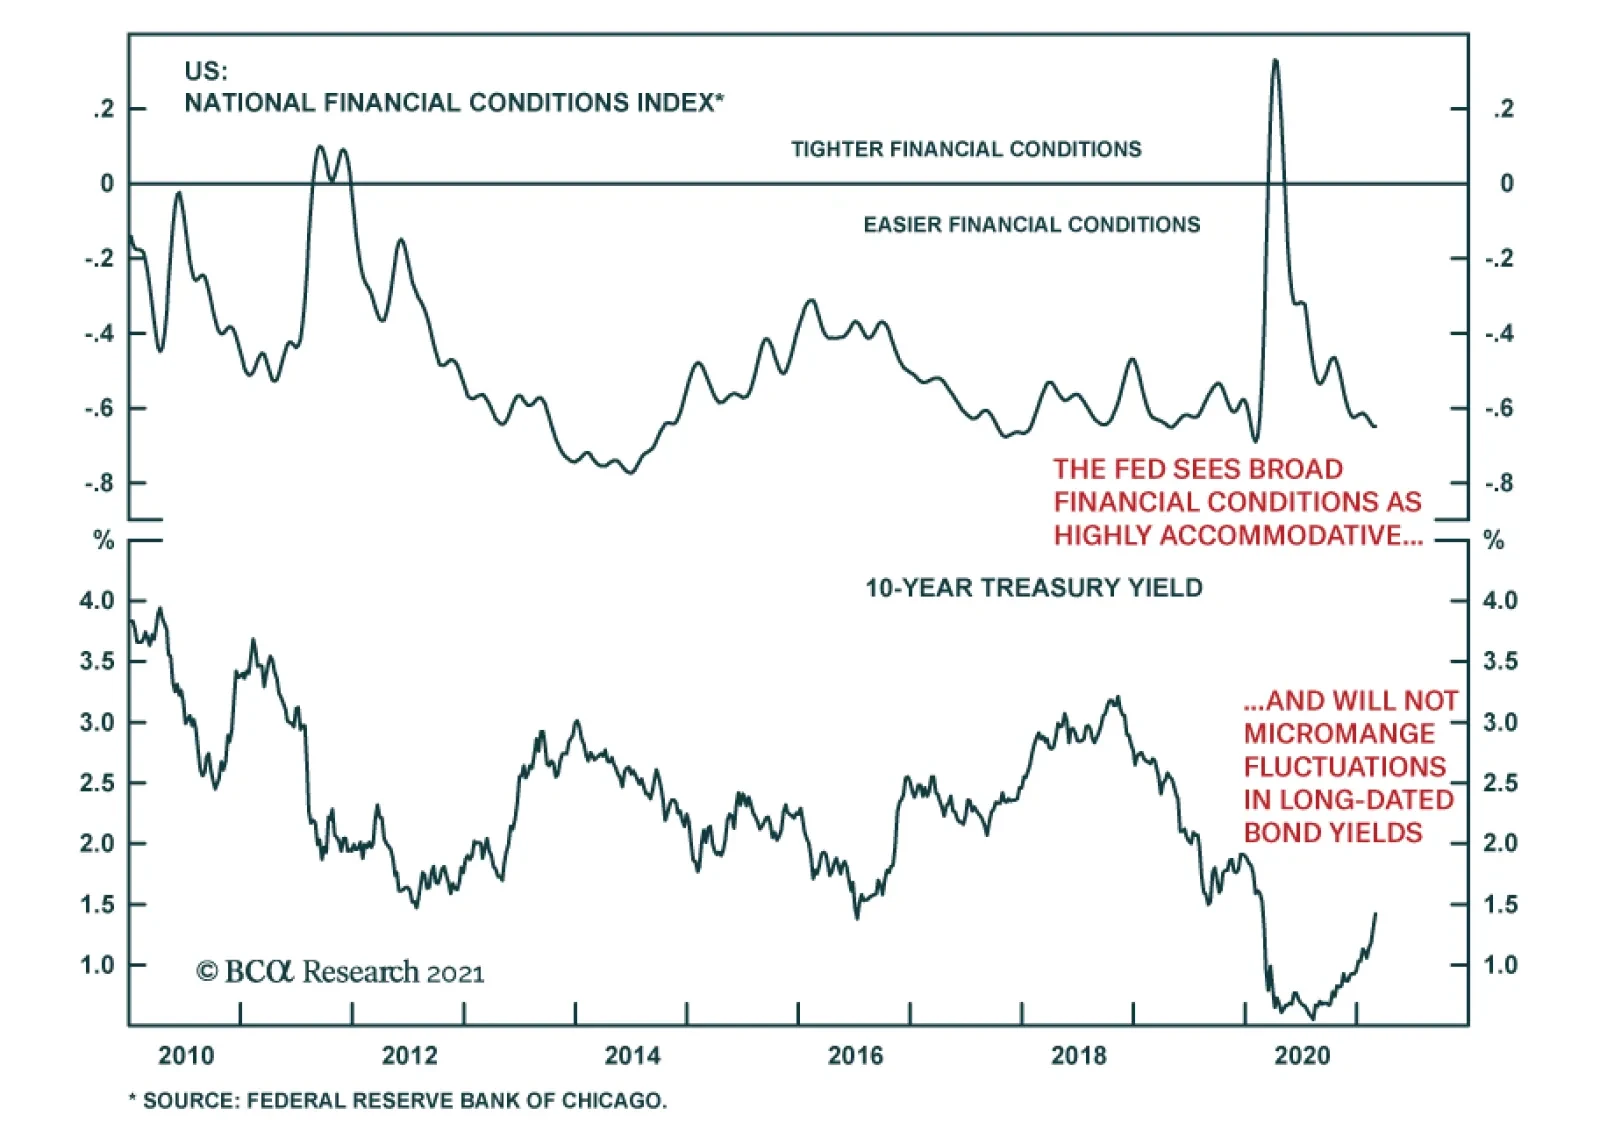
The sharp sell-off in US Treasuries in recent weeks raised hopes that the Fed would follow the footsteps of the RBA in taking a more active role in calming markets. There was speculation going into Chairman Jerome Powell’s talk at the WSJ Jobs Summit on…
Update On The Reopening Trade
Update On The Reopening Trade
Recently we reopened our long “Back-To-Work”/short “COVID-19 Winners” pair trade that we first instituted in the September 8th, 2020 Strategy Report, and subsequently closed earlier this year for a gain of 21.5%, since inception as our risk management rolling stop was hit. The selloff in the bond market last week served as a catalyst and turbocharged this pair trade that is highly levered to the economic reopening theme; already stellar gains have accrued for our portfolio to the tune of 20% since the early February second inception. Importantly, as the bottom panel of the chart on the right shows, the relative price ratio still has catch up potential to the parabolic move in yields. More recently, we took a deep dive into the economic reopening theme and created two baskets (laggards and overshooters) from the entire GICS4 universe we cover and recommended investors put an intra “Back-To-Work” trade on. Bottom Line: Stay with the long “Back-To-Work” / short “COVID-19 Winners” pair trade. The ticker symbols in the “Back-To-Work” and “COVID-19 Winners” baskets are: LUV, DAL, MAR, HLT, CVX, EOG, SBUX, MCD, CAT, HON, AXP, COF, NUE, GM; and TDOC, FCN, ZM, CTXS, JNJ, AMGN, REGN, CLX, RBGLY, WMT, COST, KR, NFLX, AMZN, respectively.
Highlights The Senate will pass the $1.9 trillion American Rescue Plan largely as it stands. Markets will now turn to Biden’s second major reconciliation bill for FY2022 – the one with tax hikes. Democrats will go forward with tax hikes on corporations and the wealthy. But they will spend more than they tax for fear of squandering their term in power. Tax hikes threaten sectors like tech that already face headwinds from rising bond yields. The health sector is also at risk. Stick with cyclicals and value plays. Feature Markets have seesawed as volatility spikes in the face of rapidly rising bond yields. Value stocks such as financials stand to benefit relative to growth stocks as the market comes to grips with the first hint of normal inflation expectations since 2019 (Chart 1). Underlying the trend is a sea change in US fiscal policy. Chart 1Value Stocks To Reignite On Rising Bond Yields
Value Stocks To Reignite On Rising Bond Yields
Value Stocks To Reignite On Rising Bond Yields
The House of Representatives passed the $1.9 trillion American Rescue Plan so it will now go to the Senate for revision, back to the House for approval, and then to President Biden’s desk by around March 14. Investors will now turn to Biden’s second major legislative act prior to the 2022 midterm election cycle: the fiscal year 2022 budget reconciliation process. Before we outline the time frame and tax hikes that that process will entail, we should take a moment to review the current bill. Senate Will Pass American Rescue Plan Largely As Is The House version of the $1.9 trillion American Rescue Plan contains $1,400 household rebates, direct checks via the Internal Revenue Service, for people who make less than $75,000 per year (double those numbers for married couples). Unemployment benefits are supposed to rise from $300 to $400 per week for 73 weeks instead of 50 weeks, with an expiration on August 29 instead of March 14. Those with children or other dependents will receive additional payments. The bill also includes $75 billion for fighting COVID-19, $350 billion for state and local governments, $170 billion for schools and universities, $225 billion for small business, $38 billion for the airline industry and various other tax benefits for families and workers.1 Those who have been let go from their jobs can more easily retain their previous health insurance. Chart 2 provides a visual comparison of the American Rescue Plan with the $900 billion in fiscal relief passed at the end of 2020 prior to House passage and Senate revision. Already the Senate version excludes a hike to the minimum wage, from $7.25 to $15 per hour, as the Senate parliamentarian ruled that does not qualify under the “Byrd rule” because it does not directly impact spending or taxation.2 Vice President Kamala Harris, who is also president of the Senate, could reverse this decision but otherwise the minimum wage will have to be considered in a separate bill later. Chart 2American Rescue Plan
Taxes Will Rise But It Is Still A Fiscal Blowout
Taxes Will Rise But It Is Still A Fiscal Blowout
The Senate could pare back other aspects of the bill – such as state and local aid, given that local government revenues are in much better shape than expected. Chart 2 highlights that the state and local aid component is much larger this time around. Still, the purpose of Senate negotiations is to secure the votes of moderate Democrats, as winning over 10 Republicans is no longer feasible, and moderate senators are not going to sink the first legislative proposal of a president of their own party. The Senate is virtually guaranteed to pass the bill, likely by March 14 when current unemployment benefits expire. The bill’s economic impact will be to speed the vaccination process and provide another infusion of cash into households and various public institutions. Families are just starting to receive the last round of benefits passed in December and they had not exhausted the 14% year-on-year increase in real income that they saw as a result of last year’s CARES Act when the Coronavirus Response and Relief Act sent incomes soaring yet again (Chart 3). Economic growth will be supercharged as economic activity normalizes, consumer confidence recovers, and the service sector revives. Chart 3Washington Lavishes Households With Dole
Washington Lavishes Households With Dole
Washington Lavishes Households With Dole
Biden’s Second Bill Will Pass This Fall The second budget reconciliation procedure, for fiscal year 2022, will begin in mid-April. The formal deadline to adopt a budget resolution is April 15 but the average delay would put the resolution in June.3 The maximum delay would see the resolution passed in October but that is unlikely in today’s context (Diagram 1). After the resolution passes, the House and Senate must reconcile their budgets, pass the same bill, and send it to the president for his signature. Diagram 1Timeline Of Biden Administration’s Second Budget Reconciliation, FY2022
Taxes Will Rise But It Is Still A Fiscal Blowout
Taxes Will Rise But It Is Still A Fiscal Blowout
The average time between Congress adopting a budget resolution and the president signing a reconciliation bill into law is 150 days, putting completion on September 15, 2021. This period could easily extend to November. In the worst-case, judging by history, Democrats could fail to conclude the process until October 2022 – but that is highly unlikely. A delay till December of this year would be a fumble, but a more realistic fumble, say if moderate Democrats must be won over due to controversial provisions. The second reconciliation bill is supposed to consist of investments over a ten-year period rather than emergency relief for the lingering pandemic and economic recovery. Biden’s proposed $2-$3 trillion green infrastructure program is the highlight but we also expect Democrats to prioritize their health care plan, which is estimated to cost $1.7-$1.9 trillion. Hence $4 trillion is a reasonable expectation for new spending but in this case the headline spending figure will be at least partially defrayed by tax hikes, unlike the first reconciliation bill (Charts 4A & 4B). If Biden raises taxes by half as much as he intends, the full price tag would be $2 trillion. Chart 4ABiden Will Spend, Then Tax
Taxes Will Rise But It Is Still A Fiscal Blowout
Taxes Will Rise But It Is Still A Fiscal Blowout
Chart 4BBiden Will Spend, Then Tax
Taxes Will Rise But It Is Still A Fiscal Blowout
Taxes Will Rise But It Is Still A Fiscal Blowout
The precise contours of this bill will remain unknown until Biden presents an outline in April and the House of Representatives drafts a resolution. We test six different scenarios involving different assumptions about Biden’s tax-and-spend proposals, highlighted in Table 1. Generally, we assume that Democrats will much more readily compromise tax hikes rather than spending, given that they want to err on the side of firing up the economic recovery. They are just as capable as Republicans were in 2017 of manipulating the numbers when it comes to the reconciliation requirement that the budget deficit not increase beyond a ten-year time period. Table 1Scenarios For Biden’s Second Reconciliation Bill
Taxes Will Rise But It Is Still A Fiscal Blowout
Taxes Will Rise But It Is Still A Fiscal Blowout
The results are broken down in terms of revenue, expenditure, and net interest costs in Chart 5. The baseline is Biden’s campaign proposal. Scenario 1 assumes that Biden gets all of the spending he wants but is forced to compromise on tax hikes. Scenario 2 is more realistic as it assumes that Biden gets half of what he wants on both spending and taxes. Scenarios 3-6 examine what would happen if Biden were forced to strike out either his green infrastructure plan or his health and social security plan, depending on different revenue assumptions. In Scenarios 5 and 6 we grant Biden only half of his proposed taxes on corporations and wealthy folks, leaving other tax proposals to the side – otherwise the result would be a net tightening of fiscal conditions, which is neither intended nor politically possible. Chart 5Scenarios For Biden’s Second Reconciliation Bill
Taxes Will Rise But It Is Still A Fiscal Blowout
Taxes Will Rise But It Is Still A Fiscal Blowout
The impact on the budget deficit in each scenario is shown in Chart 6. The greatest economic stimulus would occur under Scenario 1, which would soon become a problem for investors as it would hasten inflation and rising interest rates. Chart 6Deficit Scenarios For Biden’s Second Reconciliation Bill
Taxes Will Rise But It Is Still A Fiscal Blowout
Taxes Will Rise But It Is Still A Fiscal Blowout
Scenario 2 is the most realistic policy scenario while being the least inflationary. By contrast, Scenario 4 is realistic but hardly less inflationary than the baseline case. In each of these scenarios it is important to bear in mind that the new government programs would be administered over a ten-year period and therefore the increase to the budget deficit would be more gradual than is the case of the American Rescue Plan, which clearly aims to be disbursed in the first few years. In the case of the Obama administration’s American Recovery and Reinvestment Act (2009) the peak in spending occurred in 2013, four years after the bill was passed (analogous to 2025 today) (Chart 7). Infrastructure and green energy projects are also expected to increase productivity and hence potential growth. Chart 7Infrastructure Spending Could Peak Four Years After Bill’s Passage, As In 2009-13
Taxes Will Rise But It Is Still A Fiscal Blowout
Taxes Will Rise But It Is Still A Fiscal Blowout
The Byrd rule will become even more important with Biden’s second reconciliation bill because the bill will contain a mishmash of Biden’s campaign proposals. Democrats will try to pass as much of their agenda via fast track as possible so as to meet promises ahead of the 2022 midterm election. An advantage of health care spending is that it is unlikely to be struck down by the Senate parliamentarian given that the Obama administration relied on reconciliation to pass a critical second installment to the Affordable Care Act (Obamacare). Biden’s health care plan is more popular than climate change policy, with both the general public and moderate Democrats, and it is guaranteed to pass reconciliation. Infrastructure spending faces greater challenges under reconciliation but they are not insurmountable. Infrastructure is normally handled via the traditional budget process or the Highway Trust Fund and some measures are likely to run afoul of the Byrd rule. Still, workarounds can be found.4 Hence the infrastructure plan is likely to be compromised but not prohibited due to technicalities. Even if infrastructure fails to make it into reconciliation, Biden can use the deadline to top up the exhausted Highway Trust Fund or to reauthorize the Surface Transportation Act as alternative pathways. It is not impossible to get Republican cooperation on infrastructure though the green agenda will meet resistance. The reconciliation process is nominally forbidden from increasing the budget deficit beyond ten years. Short-term spending is exempt, as is the case with the American Rescue Plan and its crisis-response measures, but the purpose of the second reconciliation bill is to invest in long-term, productivity-enhancing programs. A new government health insurance option and/or a green infrastructure buildout will take many years to implement and could increase deficits beyond the ten-year window. But Democrats, like Republicans, will be able to use accounting chicanery and gimmicks to make the budget outlook serve their purposes in passing the legislation. As long as they keep moderate members of the party on their side. Yes, Taxes Will Go Up … But That May Not Be All Bad For Markets Why should Democrats raise taxes at all? Why not focus on stimulus without taking on the political risk of higher taxes? After all, Republicans passed tax cuts via reconciliation without offsetting them by spending cuts. Was it not the higher taxes in Obamacare that greatly fueled resistance from Republicans and their victory in the House of Representatives in 2010? First, on the level of intentions, the Democrats clearly seek to increase taxes on corporations, high-income earners, and capital gains: Both Biden and Harris said they would raise taxes on the campaign trail and in the presidential debates despite the risk to their election prospects. Biden committed only to prevent tax hikes on those making less than $400,000 per year. Harris’s weakest moment in her debate with Mike Pence was her insistence that she would raise taxes but she stuck to her guns. Both factions of the Democratic Party want to raise taxes. Traditional Democrats view tax hikes as a way of paying for a larger government role in addressing social and economic imbalances. Populists view tax hikes as a way of redistributing from the ultra-rich. While budget deficits are not a general concern, combating inequality is a theme shared across the party. Second, on the level of capability, Democrats can get at least some of the tax increases that they want: The US is not overtaxed on the whole. True, Biden’s full tax agenda would push the US back up to the top of the OECD countries in terms of the corporate tax if an “integrated” view of both firm-level taxes and taxes on dividends and capital gains (Chart 8). But this point suggests that Biden will moderate his tax plan rather than abandon it altogether. Popular opinion did not favor Trump for cutting corporate taxes. Chart 8Biden’s Corporate Tax Proposal Would Make US An Outlier Again
Taxes Will Rise But It Is Still A Fiscal Blowout
Taxes Will Rise But It Is Still A Fiscal Blowout
The macroeconomic impact of raising taxes is manageable in the context of the extraordinary fiscal stimulus that the US is passing. There is no clear relationship between tax rates and economic growth but it is natural for the Democrats to fear that they could squander their term in power by excessive fiscal tightening. Yet the negative economic impact of raising the corporate rate is only 0.8% of GDP over the long run, and half of that if the corporate rate is raised only halfway to what Biden intends (25% instead of 28%) (Table 2), according to the conservative-leaning Tax Policy Foundation. Table 2Economic Impact Of Corporate Tax Not Dramatic
Taxes Will Rise But It Is Still A Fiscal Blowout
Taxes Will Rise But It Is Still A Fiscal Blowout
President Biden has the political capital early in his term to revise the Trump tax cuts according to Democratic prerogatives. His popularity will not hold up for long (Chart 9). And he only just has enough legislative power. While household sentiment is weak and economic conditions are moderate, both are set to improve as the pandemic fades and fiscal stimulus takes effect (Table 3). While tax hikes will embolden Republican opposition and the Democrats will have lost their chance to affect the tax code if Republicans win in 2022. At the moment, Republicans are divided and unpopular, so Democrats have a window of opportunity (Chart 10). Chart 9Thesis, Antithesis, Synthesis?
Taxes Will Rise But It Is Still A Fiscal Blowout
Taxes Will Rise But It Is Still A Fiscal Blowout
Chart 10Independents Up, Republicans Down
Independents Up, Republicans Down
Independents Up, Republicans Down
Table 3Political Capital Index
Taxes Will Rise But It Is Still A Fiscal Blowout
Taxes Will Rise But It Is Still A Fiscal Blowout
While Democrats could chuck all the Senate rules out the window in order to pass their spending plans without any offsets, this would anger moderates who tend to uphold Senate rules and norms. The party cannot afford to lose a single vote from their caucus in the Senate. Yet moderate Democrats are not against tax increases in principle. What they would oppose is either excessive tax hikes or a fiscal spending bonanza without any revenue offsets at all.5 It is entirely feasible to back-load tax increases so that they take effect in the latter half of the ten-year budget window, especially after the 2024 election. Treasury Secretary Janet Yellen is advising precisely this course of action and has herself argued that corporate tax hikes will go through.6 There may be some risk that Democrats go full left-wing populist and abandon any semblance of fiscal responsibility so as to supercharge the economy. So far they have agreed to maintain the Senate filibuster and scrap the minimum wage hike but this acceptance of Senate norms may not last as pressure builds. The second reconciliation bill is the last chance to fast-track major initiatives before the midterm. Vice President Harris could overrule the Senate parliamentarian across the board. This scenario is unlikely. The White House and Congress will find a balance that raises some revenue but errs on the fiscally accommodative side, as our scenarios above highlight. Investment Takeaways The market’s concern is that the Democrats will “overdo” the fiscal response and we fully share this concern. The American Rescue Plan alone will plug the output gap by almost three times more than the amount required. The coming tax hikes will not offset the wave of new spending that is coming down the pike. Democrats will partially reverse Trump’s tax cuts in the context of additional pump-priming that constitutes a net increase to the budget deficit. The net effect is inflationary. If Congress were to pass another $2 trillion bill without any substantial revenue offsets then the market would face an even bigger inflationary jolt and an even earlier return to rate hikes by the Fed. But this scenario is unlikely. So the inflationary risk is clear but investors need not panic in the short run. Our infrastructure trade is back on track as the reflation trade rumbles onward (Chart 11). The Democrats will get at least one more major bill passed and it will likely include at least half of Biden’s agenda, including around $2 trillion on green infrastructure. We will discuss the renewable energy portion at length in a forthcoming report. The health care sector faces headwinds from both Biden’s health policies and corporate tax hikes. The sectors that stand to benefit the most from a higher corporate tax rate are those that benefited least from Trump’s Tax Cut and Jobs Act – namely energy, industrials, materials, and financials, in that order (Chart 12A). These are also the cyclical plays that we favor in today’s accommodative policy environment. Chart 11Infrastructure Trade Back On Track
Infrastructure Trade Back On Track
Infrastructure Trade Back On Track
Chart 12ACyclicals Outperforming Health Care
Cyclicals Outperforming Health Care
Cyclicals Outperforming Health Care
Chart 12BCyclicals To Outperform Tech?
Cyclicals To Outperform Tech?
Cyclicals To Outperform Tech?
The same cyclical sectors are also trying to make headway against the tech sector, which stands to suffer from higher interest rates as well as higher taxes, including a minimum tax on book earnings, if that part of Biden’s agenda makes it through the negotiations this fall (Chart 12B). Matt Gertken Vice President Geopolitical Strategy mattg@bcaresearch.com Appendix Table A1APolitical Capital: White House And Congress
Taxes Will Rise But It Is Still A Fiscal Blowout
Taxes Will Rise But It Is Still A Fiscal Blowout
Table A1BPolitical Capital: Household And Business Sentiment
Taxes Will Rise But It Is Still A Fiscal Blowout
Taxes Will Rise But It Is Still A Fiscal Blowout
Table A1CPolitical Capital: The Economy And Markets
Taxes Will Rise But It Is Still A Fiscal Blowout
Taxes Will Rise But It Is Still A Fiscal Blowout
Table A2Political Risk Matrix
Taxes Will Rise But It Is Still A Fiscal Blowout
Taxes Will Rise But It Is Still A Fiscal Blowout
Table A3Biden’s Cabinet Position Appointments
Taxes Will Rise But It Is Still A Fiscal Blowout
Taxes Will Rise But It Is Still A Fiscal Blowout
Footnotes 1 See Jeff Drew, “House passes $1.9 trillion stimulus bill with a variety of small business relief,” and Alistair M. Nevius, “Tax provisions in the American Rescue Plan Act,” February 27, 2021, Journal of Accountancy, journalofaccountancy.com. 2 See “The Budget Reconciliation Process: The Senate’s ‘Byrd Rule,’” Congressional Research Service, December 1, 2020, fas.org. 3 The current delay centers on whether the Senate will confirm Biden’s appointee for director of the Office of Management and Budget, Neera Tanden, who lost support from key moderate Democrat Joe Manchin. If she does not receive a compensatory Republican vote then Biden will have to appoint someone else and the Senate will have to confirm. Thus the budget resolution could easily be delayed into May or June. 4 For the difficulties, see Peter Cohn, “Democrats plan a spending blowout, but hurdles remain,” Roll Call, January 11, 2021, rollcall.com. For workarounds, see Zach Moller and Gabe Horwitz, “Reconciliation: How It Works and How to Use It to Help American Workers Recover,” Third Way, February 1, 2021, thirdway.org. 5 See Alexander Bolton, “Democrats hesitant to raise taxes amid pandemic,” The Hill, February 25, 2021, thehill.com. 6 See Saleha Mohsin and Christopher Condon, “Yellen Favors Higher Company Tax, Signals Capital Gains Worth a Look”, Bloomberg, February 22, 2021, Bloomberg.com

The 5-year TIPS breakeven inflation rate – the difference between the 5-year nominal US Treasury yield and the 5-year TIPS yield – is a measure of the market’s expectation for CPI inflation over the next five years. Recently, it has been surging. It even…
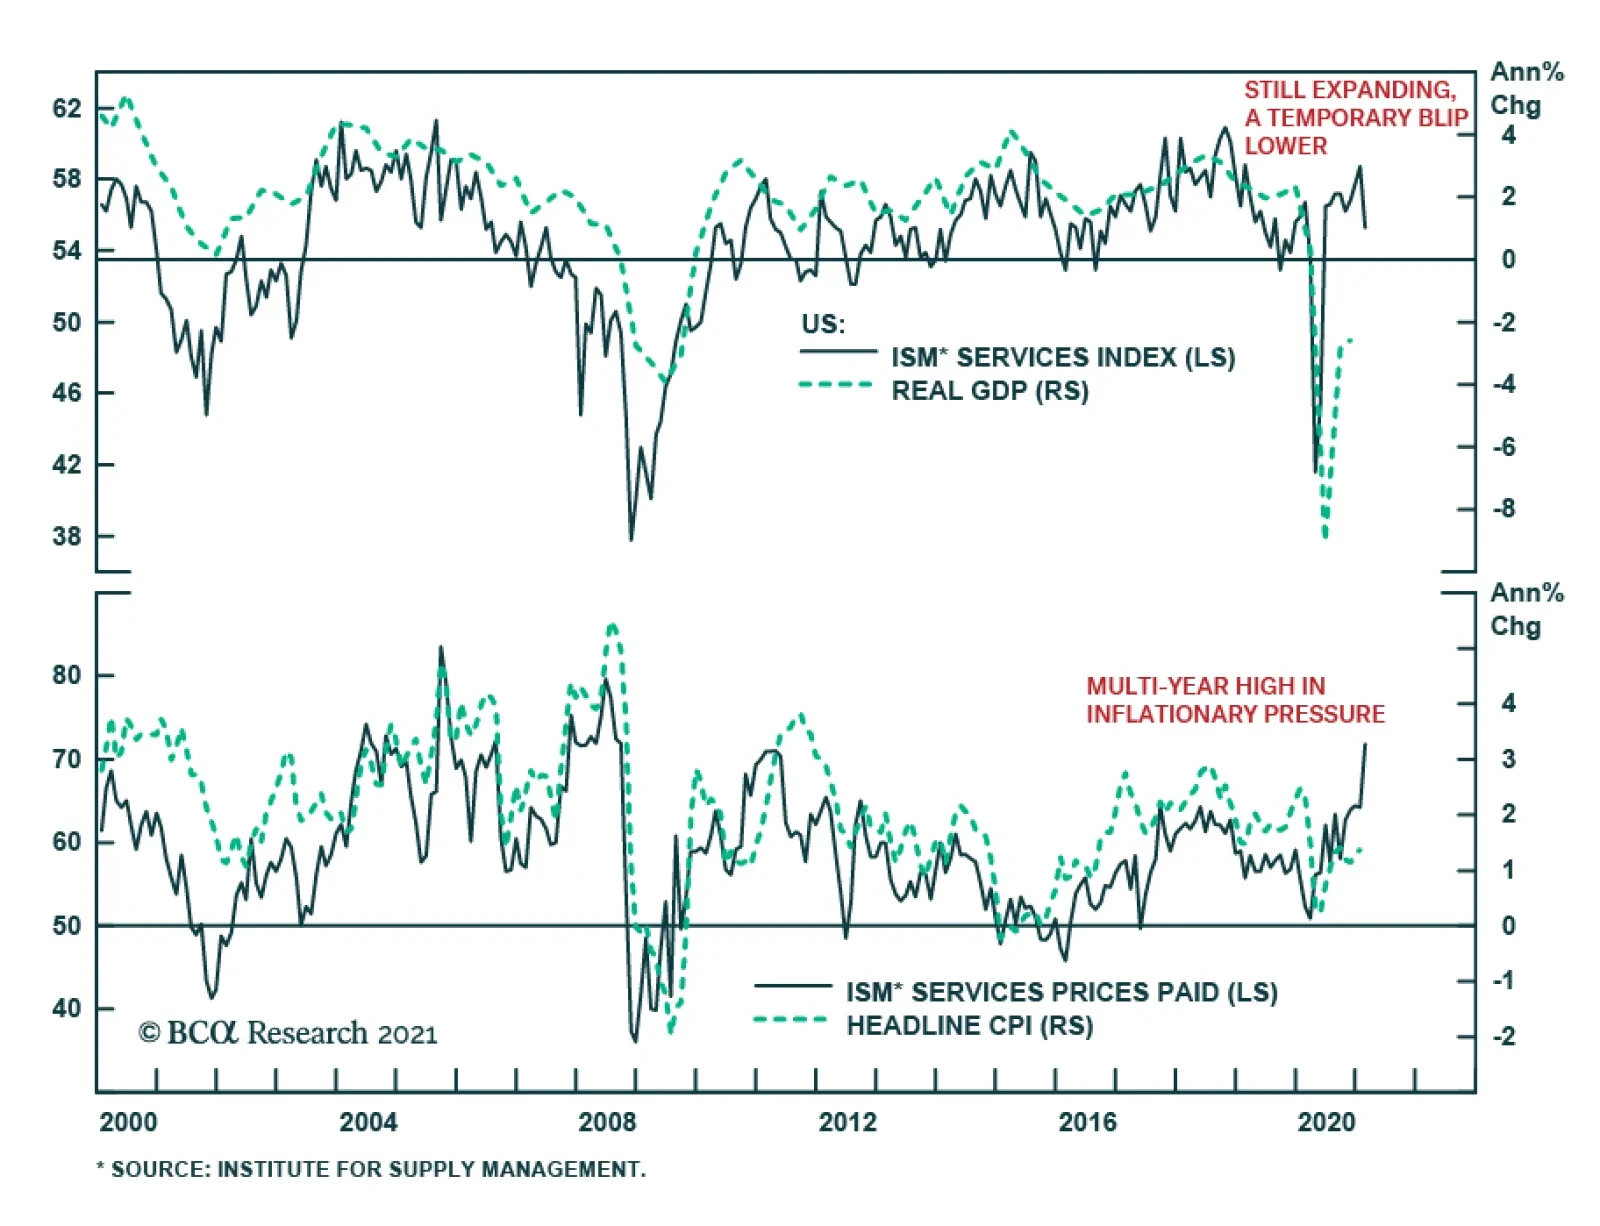
February’s ISM survey shows the US service sector expanding at the slowest pace since May 2020. The services PMI fell to 55.3, disappointing expectations it would remain at 58.7. The deterioration was led by a 9.9-point decline in New Orders to 51.9, and…