United States

Highlights We continue to believe that the distribution of Goldilocks economic and market outcomes is quite wide, … : Financial markets and the economy are in a good spot, supported by a combination of above-trend growth and easy monetary policy that will remain in place for at least the next year. … though an unwelcome COVID turn could put the US in the left-hand tail, … : Growth could fall short of expectations in the event of a negative pandemic surprise. As long as vaccinations occur at a pace that confers herd immunity by the end of September, the left-tail scenario is highly unlikely. … and a consumption tidal wave could bring the right tail into play: An explosive release of pent-up consumer demand could push US growth beyond the top of the sanguine consensus range. Too-strong growth would eventually become self-limiting because it would pull the Fed off the sidelines. Our recommendations are unchanged: Goldilocks is just right for risk assets, and we continue to favor equities over bonds and spread product over Treasuries. Feature The potential outcomes for financial markets and the US economy broadly align with Goldilocks’ porridge choices at the three bears’ house: one is too hot, one is too cold and one is just right. The just-right outcome is where we are positioned now: thanks to enormous infusions of emergency aid that have morphed into consumption pump-priming, above-trend growth appears to be assured. That would be plenty favorable for equities and credit on its own, but they also benefit from the Fed’s promise to maintain accommodative monetary policy longer than it previously would have. As our Chief Global Fixed Income Strategist Rob Robis puts it, emergency COVID monetary and fiscal policy will persist well beyond the COVID emergency. That’s an awfully good combination for risk assets and investors have taken note of it, driving equity multiples up and credit spreads down. It is entirely possible that they could spoil things by bidding prices too high, but so far the growth impacts – in the form of knockout earnings surprises and better-than-expected credit performance – have been able to keep the party going. It is our view that they will continue to do so this year, as the range of good-enough growth outcomes is so wide that a Goldilocks outcome is considerably more probable than not. Figure 1 doesn’t quite do it justice, because the area under the tails had to be large enough to accommodate lengthy words like “resurgent” and “consumption,” but we think the tails begin at least one standard deviation away from the middle of the distribution. Figure 1This One Is Just Right
Goldilocks And The Two Tails
Goldilocks And The Two Tails
How Did We Get Here? It is too soon for humanity to declare victory over COVID-19 but we do appear to have gained the upper hand as new case counts have plummeted from their January peaks in the US and the rest of the developed world (Chart 1). Much of Europe re-imposed stringent restrictions on activity for much of November and December, but US officials applied a loose patchwork of local measures, stepping in mostly when hospital capacity was strained (Chart 2). The good news going forward is that increased vigilance, and the cumulative infections that have already occurred, were apparently enough to slow the virus’ spread even during the northern hemisphere winter. The pandemic news can apparently be kept trending in the right direction without cutting off the economy’s oxygen. Chart 1The Tide Has Turned ...
The Tide Has Turned ...
The Tide Has Turned ...
Chart 2... Relieving Pressure On Local Health Care Systems
... Relieving Pressure On Local Health Care Systems
... Relieving Pressure On Local Health Care Systems
Lavish fiscal support has been the other critical element. The CARES Act swiftly rushed a great deal of aid to vulnerable households in two bursts spanning spring and early summer, with the first arriving mainly in April and May via economic impact payments of $1,200 per adult and $500 per child (Chart 3, top panel). The second burst came in the form of a weekly $600 federal unemployment insurance (UI) benefit supplement available through the end of July (though processing delays spread some of the flows into August) (Chart 3, middle panel). The transfers boosted aggregate household income above its pre-pandemic level despite a drop in compensation (Chart 3, bottom panel). Chart 3As Fiscal Transfers Wax And Wane, ...
Goldilocks And The Two Tails
Goldilocks And The Two Tails
Chart 4... So Does The Economy
... So Does The Economy
... So Does The Economy
By the end of the third quarter, however, the transfer flow had slowed to a trickle, with only the pandemic unemployment assistance (PUA) program, which expanded UI benefits to several categories of otherwise ineligible workers, still operating. President Trump’s executive order reallocating some FEMA funds briefly revived supplemental federal UI benefits, but the maximum $400 weekly bump only lasted for a handful of weeks in September and October. Once the fiscal transfers faded, signs of fraying rapidly emerged, with hiring flat-lining and retail sales falling sequentially in all three months of the fourth quarter (Chart 4). A New Paradigm No sooner had the economy begun to show signs of wear than the second round of economic impact payments, provided for in December’s compromise spending bill, arrived in two-thirds1 of American households and the federal government resumed topping up UI benefits. Both the direct payments ($600 per qualifying adult and $600 per child) and the supplemental UI benefits ($300 per week) were smaller than in the spring but we take the snapback in January retail sales as evidence that high marginal-propensity-to-consume households immediately put them to work. Households’ ability to satisfy their obligations to creditors (Chart 5) and landlords slipped as the year wore on as well. We expect that February rent collections and leading 30-day consumer delinquency rates will also show improvement (Chart 6), albeit not as dramatically as the retail series. Chart 560-Day Delinquency Rates Have Stopped Falling …
Goldilocks And The Two Tails
Goldilocks And The Two Tails
Chart 6... And Leading 30-Day Delinquencies Had Been Ticking Higher
Goldilocks And The Two Tails
Goldilocks And The Two Tails
With another, larger round of stimulus coming down the pike, the US economy will cease fraying around the edges. The immediate catalyst for the passage of the $1.9 trillion American Rescue Act was Georgia’s Senate run-off elections, but there were two longer-term developments at play. First, the mainstream economic consensus has come full circle since the global financial crisis and a chorus of expert voices is now warning governments of the perils of cutting off aid too quickly. Fed Chair Powell and Treasury Secretary Yellen have avidly taken up this theme, along with their central bank and finance ministry peers around the world. Second, and more lastingly and influentially, US voters have lost their taste for fiscal austerity. As we wrote with our US Political Strategy colleagues in last week’s Special Report, Democrats are actively renouncing Reaganite budget discipline and Republicans have quietly retired it. Now that the Fed has determined that Volcker-era inflation vigilance is no longer relevant, the stage is being set for a reversal of the investment-friendly inflation and interest rate trends that have been in place for four decades. That will weigh on financial market returns over the long run, but it should prop them up in the near term. Staying Out Of The Left Tail Central bankers are as prone as generals to fight the last war. Corrosively high inflation was every Fed official’s bête noire since the seventies, but a decade of missed inflation targets and tepid, plodding recoveries around the world has shifted central bankers’ focus to hysteresis and the specter of secular stagnation. Once the pandemic arrived, threatening self-reinforcing waves of defaults and bankruptcies, the Fed effectively declared that providing too much accommodation was a lesser evil than prematurely tightening to counter inflation fears that may prove to be unfounded. With fiscal policy makers also at pains to err on the side of doing too much, the near-term growth picture looks awfully good. Chart 7The Vaccination Effort Is Picking Up Steam
The Vaccination Effort Is Picking Up Steam
The Vaccination Effort Is Picking Up Steam
Against that policy backdrop, it will be hard for the US economy to slide into the left-hand tail of the distribution in the absence of a negative virus surprise. We cannot rule out the possibility of virus-resistant mutations or new rounds of outbreaks among a weary populace that lets its guard down, but a failure to vaccinate at a pace consistent with achieving herd immunity by the end of September looks to be the most likely route to disappointment. To that end, we are monitoring vaccination progress against the pace required to get enough of the population inoculated to effect herd immunity by the end of the third quarter (Chart 7). The US got off to a slow start, but we are confident that it will catch up by early spring under an administration that has made crushing the virus its top priority and a Congress that is providing the resources to enable local health authorities to get the job done. Overheating Is Not Inevitable The case for an upside near-term surprise stems from the notion that Congress has provided households with considerably more aid than they need. As we have previously noted, the number of households receiving economic impact payments is multiples of the number of households that have had to grapple with unemployment. Thanks to the first two rounds of fiscal transfers, we estimate that aggregate household income from March through January was nearly $600 billion greater than it would have been in the absence of COVID-19 (Table 1). The looming third round of direct payments could put incremental pandemic income in the neighborhood of $1 trillion. Table 1Households' Excess Pandemic Savings Keep Growing
Goldilocks And The Two Tails
Goldilocks And The Two Tails
Coupled with foregone consumption that already sums to $1.1 trillion, households’ excess pandemic savings is on course to top $2 trillion. That’s a lot of dry powder, even in a $21 trillion economy, and it underpins our view that the probability-adjusted distribution of Goldilocks outcomes is very wide. Without another major virus shock, it is hard to see a scenario where growth doesn’t comfortably exceed its 2% trend level. The question is whether or not enough of the savings will be spent in 2021 and 2022 to push the economy into the right-hand tail and potentially overheat. No one can say with much conviction, as the current backdrop is without precedent. Mount Rushmore-level economists David Ricardo and Milton Friedman would advise investors to temper their enthusiasm. Ricardian equivalence suggests that households will be reluctant to spend distributions they may be taxed to pay for later, and Friedman’s permanent income hypothesis posits that one-off windfalls have little effect on consumption decisions. The multiplier effect of the direct payments to households may not be all it’s cracked up to be, but the lion’s share of the savings stash has come from reduced consumption. How much of that reduced consumption was merely deferred rather than destroyed will determine how much growth can rise. Despite the vast household spending shortfall, consumption of goods has actually tracked above the level that would have been expected if the pandemic had not occurred; the spending gap has entirely been a function of diminished services spending, especially in pandemic-stricken categories like food service, recreation and transportation (Table 2). People surely have an appetite to resume that spending, and will flock to their favorite places once they can again enjoy them fully, but there’s a hitch. Last year’s forgone spending cannot be caught up by eating multiple restaurant dinners in a day, going back in time to attend last season’s sports and entertainment events, or flying on two planes2 and staying in two hotel rooms. Table 2The Spending Gap Is Almost Entirely On The Services Side
Goldilocks And The Two Tails
Goldilocks And The Two Tails
As a result, it seems that a fair amount of forgone services consumption is likely to turn into demand destroyed. Some demand for services could be diverted to demand for goods – one might build out a home theater instead of going to ballgames, movies and concerts; one might buy home exercise equipment in place of a gym membership – but much of that substitution has already taken place and may not persist going forward. The bottom line is that some goods demand appears to have been pulled forward by the pandemic while some services demand has likely been destroyed. There is surely pent-up consumer demand, but only some of the accumulated savings will be directed to satisfying it and we do not think they’ll push the economy to overheat. Investment Implications Our base case has the Goldilocks backdrop of solid growth and ample monetary accommodation remaining in place for at least the rest of the year. Markets have fully discounted that scenario but earnings growth has surprised to the upside by a remarkable margin over the last three quarters (Chart 8) and we expect that the fundamental backdrop will support mid- to high-single-digit equity returns. That will allow stocks to easily surpass bonds and we continue to overweight the former and underweight the latter. If some of the excess savings fuels multiple expansion, equity returns could be even better. Chart 8Earnings Have Been Beating Expectations By A Remarkable Margin
Goldilocks And The Two Tails
Goldilocks And The Two Tails
Although we are not worried that inflation is about to break out to uncomfortably high levels, we do expect further yield curve steepening from the combination of accelerating growth and an inflation-tolerant Fed. We continue to recommend that fixed income investors keep duration below benchmark levels. We expect an ongoing rotation from COVID winners to COVID losers as the virus is increasingly contained and look for value to outperform growth. Doug Peta, CFA Chief US Investment Strategist dougp@bcaresearch.com Footnotes 1 Every single adult taxpayer with adjusted gross income (AGI) of $75,000 or less (and every married filing jointly taxpayer with AGI of $150,000 or less) was eligible for the full payments. 2 Even GE’s CEO doesn’t have this option anymore.
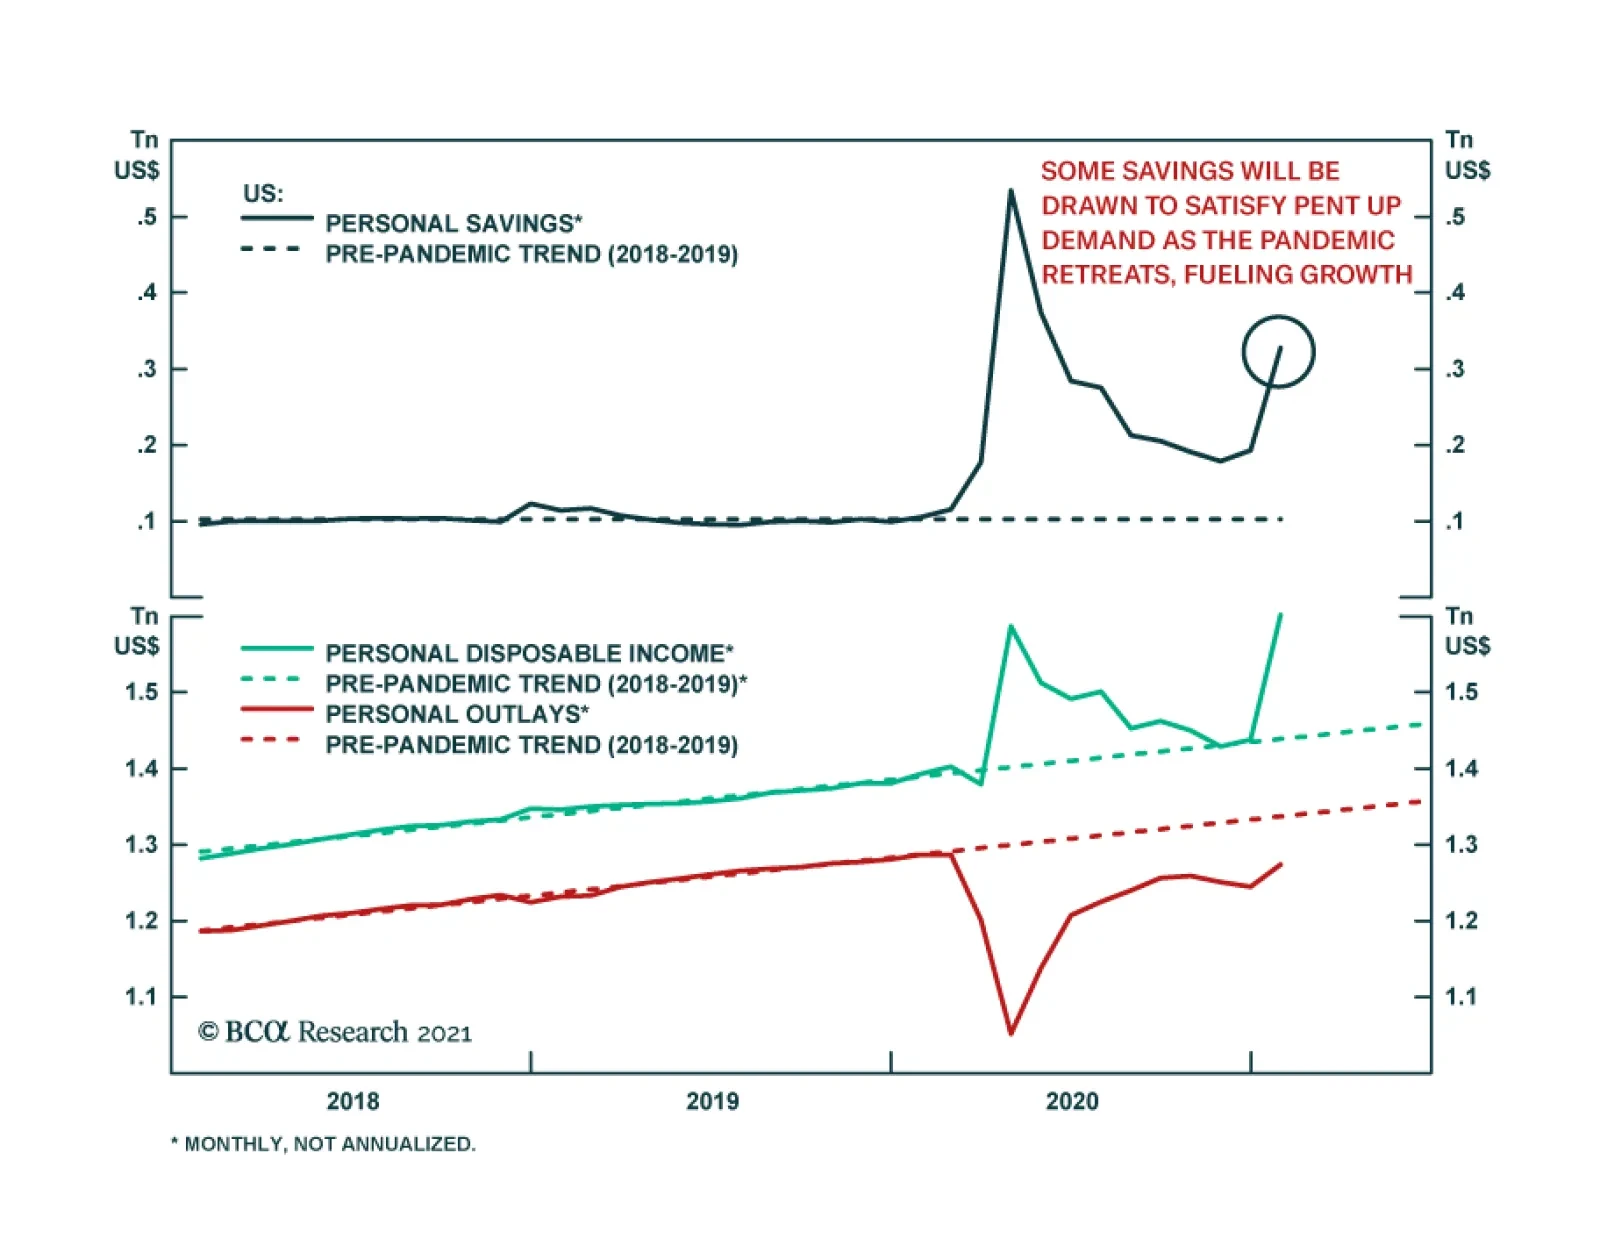
The US Personal Income and Outlays Report for January corroborates the message from retail sales earlier this month that fiscal handouts are providing a reflationary bridge until the pandemic is resolved. Personal income jumped the most since last April,…
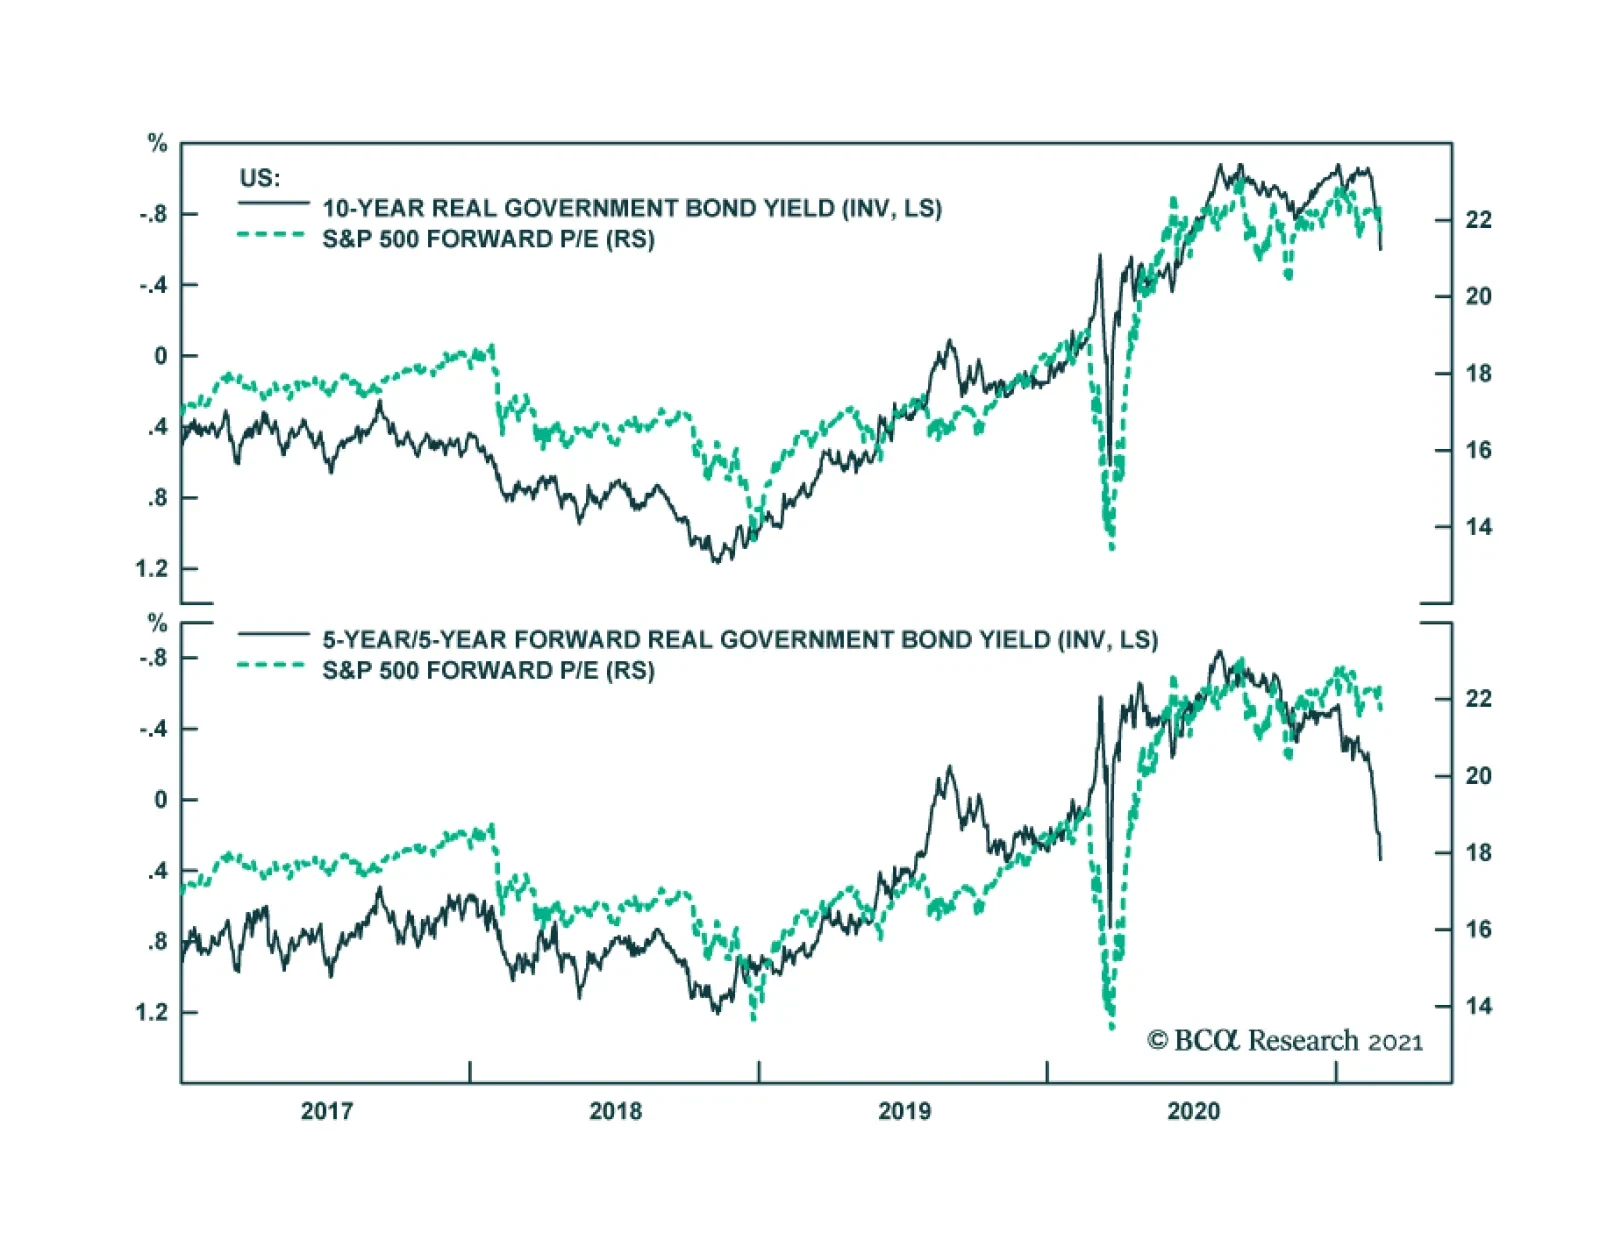
BCA Research’s Global Investment Strategy service concludes that the recent increase in real yields could put further downward pressure on equity prices in the near term. Bond yields have jumped in recent weeks. After bottoming at 0.52% in August, the US…
Underweight Recently we highlighted how the inclusion of TSLA in the S&P consumer discretionary sector catapulted the sector’s 5-year growth forecasts to the stratosphere. We also mentioned anecdotes of sell-side analysts having to conduct 20 year out DCF models to justify TSLA’s price. As a result of all of this mania-like behavior, we downgraded the S&P autos & components index to underweight coincidentally the same week that TSLA surpassed $900/share; this move also pushed the overall consumer discretionary sector to a below benchmark allocation.
Cult Stocks Versus The Bond Market
Cult Stocks Versus The Bond Market
Since then, the underweight stance in the S&P autos & components index has netted 19% in gains for our portfolio as the bond market vigilantes are trying to talk some sense into high-flying stocks. Not only is the bond market weighing heavily on stratospheric valuations, but also dark clouds are gathering on the operating front. For instance, VW Group outsold TSLA last year by a factor of over 3-to-1 in Norway, which is the most advanced BEV market in the world. Given that auto manufacturing is a cutthroat business with razor thin margins, we doubt it will be long before Japanese, German, Chinese and other BEV manufacturers enter the scene and question TSLA’s position in the market. As a reminder, TSLA continues to command a higher market capitalization than all the other global auto stocks put together. Something has got to give. Bottom Line: Stay underweight the S&P automobiles & components index. The ticker symbols for the stocks in this index are: BLBG: S5AUCO – TSLA, GM, F, APTV, BWA.
Highlights Higher yields in China should continue to encourage inflows into the RMB. However, the gap between Chinese and US/global interest rates will narrow. This will temper the pace of RMB appreciation. The RMB remains modestly undervalued. Higher productivity gains in China will raise the fair value of the currency. The US dollar could have entered a structural bear market. This will also buffet the CNY-USD exchange rate. A big driver for the RMB in the coming years will also be widespread diversification away from USD assets. This will dovetail nicely with the ascension of the RMB in global FX reserves. Feature Chart 1The RMB Often Moves With Relative Rates
The RMB Often Moves With Relative Rates
The RMB Often Moves With Relative Rates
The appreciation in the Chinese yuan has been a boon for global bond, equity and currency investors. With extremely low volatility, the yuan has appreciated by approximately 10% since its May 2020 lows. This places the rise in the RMB on par with what we saw in the 2017/2018 period. It also makes the yuan one of the best performing emerging market currencies this year. One of the key drivers of the yuan’s stellar performance has been the interest rate gap between China and the US (Chart 1). The Chinese economy was one of the first to emerge from the pandemic-driven lockdown. As economic activity recovered, so did local bond yields. With global bond yields now on the rise, this raises the specter that Sino-global bond yield spreads will narrow. The implications for the path of the Chinese yuan are worth monitoring. On the other hand, structural factors also argue that the path of least resistance for the US dollar over the next few years is down. This is positive for the Chinese yuan. Which force will dominate the path of the RMB going forward? In this Special Report, we discuss the intersection between the People’s Bank of China (PBoC) monetary policy and the global environment, and what that means for the Chinese yuan on a 12-month horizon. China And The Global Cycle The evolution of the global economic cycle has important implications for the yuan exchange rate in particular, because the RMB is a pro-cyclical currency. The USD/CNY has been moving tick for tick with emerging market equities, Asian currencies and commodity prices (Chart 2). Meanwhile, China has also been a major engine for global growth. Ever since the global financial crisis, the money and credit cycle in China has led the global recovery (Chart 3). With the authorities set to modestly decelerate the pace of credit creation, it will be important to gauge if this is a risk to global growth and, by extension, the path of the RMB. Chart 2The RMB Has Traded Like A Pro-cyclical Currency
The RMB Has Traded Like A Pro-cyclical Currency
The RMB Has Traded Like A Pro-cyclical Currency
Chart 3The Chinese Impulse Leads ##br##The Global Cycle
The Chinese Impulse Leads The Global Cycle
The Chinese Impulse Leads The Global Cycle
In our view, while the credit impulse in China will roll over, the impact will be to slow the pace of RMB appreciation rather than reverse it, because: The interest rate gap between China and the rest of the world will remain very wide. The current level of 10-year yields in China is 3.3% versus 1.4% in the US. In a world of very low nominal interest rates, a differential of almost 200 basis points makes all the difference. Our base case is that the Chinese credit impulse could slow to 30% of GDP. If past is prologue, this could compress the yield spread to 1.5% but will still provide a meaningful yield pickup for foreign investors (Chart 4). Meanwhile, the real rate differential between China and the US might not narrow much if China continues to reign in credit growth, while the US pursues inflationary policies. Already, inflation in China is collapsing relative to the US, which supports relative real rates in China. The credit impulse tends to lead the economy by six to nine months, thus, for much of 2021, Chinese growth will remain robust. Overall industrial production is picking up meaningfully, with the production of electricity and steel, and all inputs into the overall manufacturing value chain inflecting higher. This will continue to support bond yields in China (Chart 5). In recent weeks, both steel and iron ore prices have been soaring. While supply bottlenecks are playing a role, it is evident from both the manufacturing data and the trend in prices that demand is also a key driver (Chart 6). Chart 4The China-US Spread Will Stay Positive
The China-US Spread Will Stay Positive
The China-US Spread Will Stay Positive
Chart 5Underlying Economic Activity Is Resilient
Underlying Economic Activity Is Resilient
Underlying Economic Activity Is Resilient
Chart 6Strong Chinese Demand For Commodities
Strong Chinese Demand For Commodities
Strong Chinese Demand For Commodities
China has had a structurally higher productivity growth rate compared to the US or Europe for many years, which will continue. It is also the reason why the fair value of the currency has been rising over the last two decades (Chart 7). Higher productivity growth suggests the neutral rate of interest in China will remain high for many years and will attract further fixed income inflows. China is running a basic balance surplus, which indicates that the RMB does not need to cheapen to entice capital inflows (Chart 8). Chart 7The RMB Is Not Overvalued
The RMB Is Not Overvalued
The RMB Is Not Overvalued
Chart 8A Basic Balance Surplus
A Basic Balance Surplus
A Basic Balance Surplus
Chinese bonds are gaining wider investor appeal. Following their inclusion in the Bloomberg Barclays Global Aggregate Index (BBGA) since April 2019, and in the JP Morgan Government Bond - Emerging Market Index (GBI-EM) since February 2020, FTSE Russell announced the inclusion of Chinese government bonds in the FTSE World Government Bond Index (WGBI) as of October 2021. The inclusion of Chinese government bonds in all of the world’s three major bond indices is a seminal milestone in the process of liberalizing the Chinese fixed-income market. Based on both the US$2-4 trillion in AUM, tracking the WGBI index and a 5-6% weight of Chinese bonds, an additional US$150 billion in foreign investments will flow into China’s bond market following the WGBI inclusion. Moreover, the JPMorgan Global Index team predicts that the inclusion of Chinese bonds in the world’s three major bond indices will bring RMB inflows of up to US$250-300 billion. This will be particularly true if Chinese bonds are perceived as a better hedge against equity volatility (Chart 9). Finally, currencies respond to relative rates of return, which include equity returns in addition to fixed income ones. The relative performance of the Chinese equity market in common currency terms has also moved neck and neck with the performance of the RMB (Chart 10). Chart 9Chinese Bonds Could Become The Perfect Hedge
Chinese Bonds Could Become The Perfect Hedge
Chinese Bonds Could Become The Perfect Hedge
Chart 10The RMB Follows Domestic Equity Relative Performance
The RMB Follows Domestic Equity Relative Performance
The RMB Follows Domestic Equity Relative Performance
Bottom Line: Even though the Chinese credit impulse will continue to roll over, bond investors will still benefit from enticing real interest rates in China as its neutral rate of interest is higher. Equity investors will also benefit from a cheaper market, as well as exposure to sectors that are primed to benefit as the global economy reopens. This combination will sustain the pace of foreign capital inflows (Chart 11). Chart 11Inflows Into China Remain Strong
Inflows Into China Remain Strong
Inflows Into China Remain Strong
The Dollar Versus The RMB The path of the RMB in the short-term will follow relative growth dynamics between China and the rest of the world, but structural factors such as the dollar’s reserve status will also dictate its longer-term trend. What China (and other countries for that matter) decide to do with their war chest of US Treasuries is of critical importance. In recent years, foreign investors have been fleeing the US Treasury market at an exceptional pace. On a rolling 12-month total basis, the US saw an exodus of about US$500 billion in bond flows from foreigners, the largest on record (Chart 12). Vis-à-vis official flows, China has become the number one contributor to the US trade deficit. Concurrently, Beijing has been destocking its holdings of Treasuries, if only as retaliation against past US policies, or perhaps to make room for the internationalization of the RMB (Chart 13). Chart 12An Exodus From US Treasurys
An Exodus From US Treasurys
An Exodus From US Treasurys
Chart 13China Destocking Of Treasurys
China Destocking Of Treasurys
China Destocking Of Treasurys
Data from the International Monetary Fund (IMF) shows that the allocation of global foreign exchange reserves towards the US dollar peaked at about 72% in the early 2000s and has been in a downtrend since. Meanwhile, allocation to other currencies, including the RMB, is surging. Moreover, foreign central banks have been amassing tremendous gold reserves, notably Russia and China, almost to the tune of the total annual output of the yellow metal. A diversification away from dollars and into other currencies such as the RMB and gold will be a key factor in dictating currency trends in the next few years (Chart 14). Chart 14The RMB Rises In Global Currency Reserves
The RMB Rises In Global Currency Reserves
The RMB Rises In Global Currency Reserves
The US dollar will remain the reserve currency of the world for years to come, but that exorbitant privilege is clearly fraying at the edges. This is especially the case as balance-of-payments dynamics are deteriorating. Rising US twin deficits have usually been synonymous with a cheapening dollar. Bottom line: For one reason or another, foreign central banks are diversifying out of dollars. This could be a long-term trend, which will dictate the path of the dollar (and by extension the RMB) in the years to come. Other Considerations Chart 15A Forward Discount On The RMB
A Forward Discount On The RMB
A Forward Discount On The RMB
The RMB has historically suffered from capital outflows, especially illicit flows. This is less risky today than in 2015-2016.1 Nonetheless, investors must monitor this possibility. Typically, offshore markets have anticipated the yuan’s depreciation. Back in 2014, offshore markets started pricing in a rising USD/CNY rate, and maintained that view all the way through to 2018, when the yuan eventually bottomed. Right now, 12-month non-deliverable forwards expect a modest depreciation in the yuan (Chart 15). Offshore markets in Hong Kong and elsewhere can be prescient because more often than not, they are the destination for illicit flows out of China. However, this time might be different. First, higher relative interest rates in China have lowered the forward RMB rate investors will receive to hedge currency exposure. Second, junkets (key operators in Macau casinos) have been one of the often-rumored vehicles used for Chinese money to leave the country.2 These junkets bankroll their Chinese clients in Macau while collecting any debts in China, allowing for illicit capital outflows. This was particularly rampant before the Chinese 2015-2016 corruption clampdown, when Macau casino equities were surging while equity prices in China were subdued. This time around, with tourism taking a backseat, the Chinese MSCI index is heavily outpacing the performance of Macau casino stocks, suggesting little evidence of hot money outflows (Chart 16). Chart 16China Versus Macau Stocks: Little Hot Money Outflows Like In 2013/2014
China Versus Macau Stocks: Little Hot Money Outflows Like In 2013/2014
China Versus Macau Stocks: Little Hot Money Outflows Like In 2013/2014
Sino-US trade relations will also affect the exchange rate. China remains the biggest contributor to the US trade deficit, even though the gap has narrowed (Chart 17). There is little evidence that the Biden administration will engage in an all-out trade war with China, but the case for subtle skirmishes exists. Chart 17The US Trade Deficit With China Remains Wide
The US Trade Deficit With China Remains Wide
The US Trade Deficit With China Remains Wide
In a broader sense, the pandemic might have supercharged the de-globalization trend witnessed since 2011. The stability and self-sufficiency in the production capacity of any country's core supply chain have become paramount. From the perspective of the US, this means introducing more policies that attract investment into domestic manufacturing, such as clean energy. US multinational companies may also continue to diversify production risk away from China to other emerging countries, among them Vietnam, Myanmar, and India. This will curtail FDI flows into China at the margin (previously mentioned Chart 8). Concluding Thoughts Chart 18The RMB And The Trade-Weighted Dollar
The RMB And The Trade-Weighted Dollar
The RMB And The Trade-Weighted Dollar
While USD/CNY could bounce in the near term, it is likely to reach 6.2 in the next 12 months. Interest rate spreads at the long end already overtook their 2017 highs and are near cyclically elevated levels. The bond market tends to lead the currency market by a few months, since China does not yet have a fully flexible and open capital account. Meanwhile, the path of the US dollar will also be critical for the USD/CNY exchange rate. We expect the USD to keep depreciating, which will boost the RMB (Chart 18).3 A slower pace of RMB appreciation will fend off interventionist policies by the PBoC. While the exchange rate has appreciated sharply since mid-2020, the CFETS rate has not deviated much from the onshore USD/CNY rate. This will remain the case if the pace of RMB appreciation moderates. Chester Ntonifor Foreign Exchange Strategist chestern@bcaresearch.com Footnotes 1 Please see Chinese Investment Special Report, titled “Monitoring Chinese Capital Outflows,” dated March 20, 2019, available at fes.bcaresearch.com. 2 Please see Reuters article “Factbox: How Macau’s casino junket system works,” available at reuters.com. 3 Please see Foreign Exchange Strategy Special Report, titled “2021 Key Views: Tradeable Themes,” dated December 4, 2020, available at bcaresearch.com. Trades & Forecasts Forecast Summary Core Portfolio Tactical Trades Limit Orders Closed Trades
BCA Research’s Emerging Markets Strategy service concludes that there are many similarities between the current US macro picture and the late 1960s. In the late 1960s, US inflation was subdued, and interest rates were very low in the preceding two-three…
Global government bond markets are selling off in unison on greater optimism about the economic outlook, with yields at the long end of the curve increasing faster than yields on the short end. This bear steepening suggests that while investors are taking…
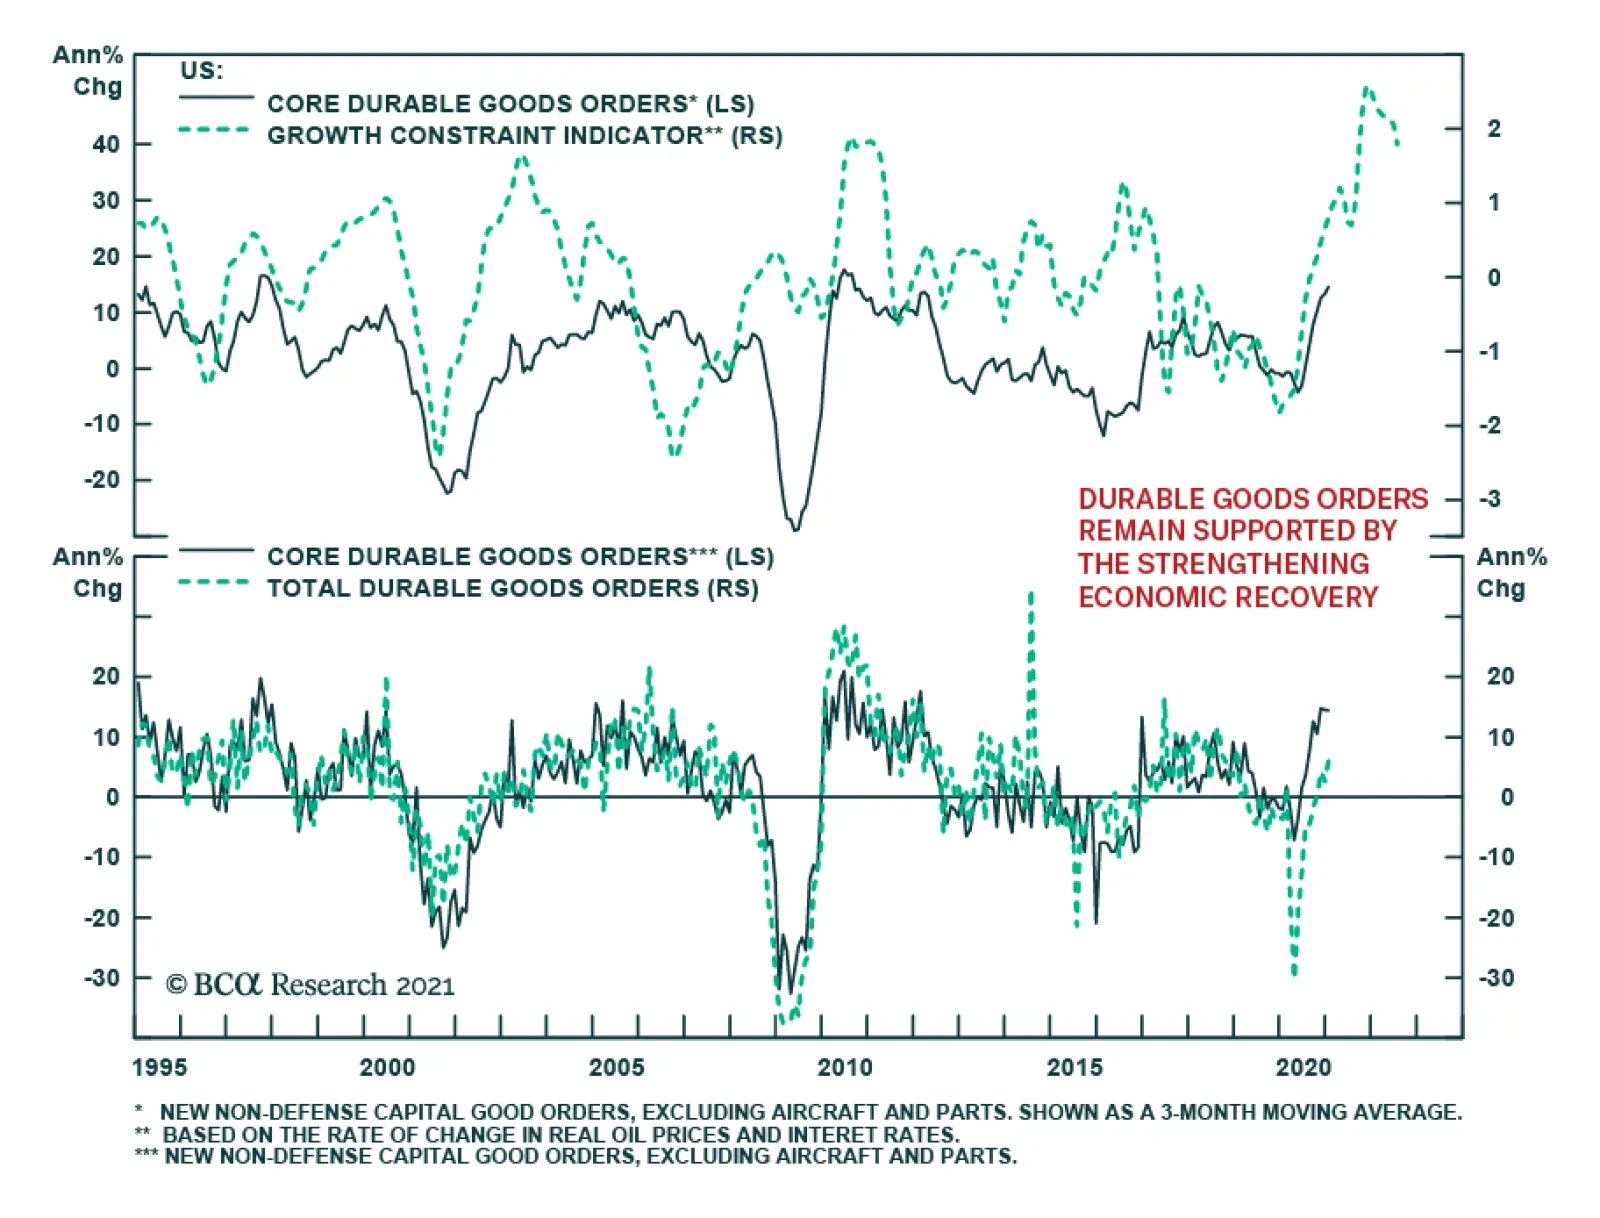
The US January Durable Goods Report shows a strong acceleration in the headline number to 3.4% m/m, triple the expectations. The jump comes on the back of civilian aircraft & parts orders, which surged by an eye-popping 389.9% m/m but are down 59.7% y/y.…
Highlights The positive correlation between share prices and US bond yields – that has been in place since 1997 – is likely to turn negative. Looking ahead, stock prices will fall when US bond yields rise and will rally when Treasury yields drop. The basis is that the key macro risk to equities is shifting from low inflation/deflation to higher inflation. Global growth stocks will underperform value stocks. US equities will lag international markets. Investment strategies and frameworks that have worked over the past 24 years might require modifications. Feature From 1966 until 1997, US equity prices were negatively correlated with US Treasury yields (Chart 1, top panel). Since 1997, US share prices have been positively correlated with US government bond yields. We believe we are now in the process of a major paradigm shift in the stock-bond correlation, reverting to the pre-1997 relationship. Chart 1US Stock-Bond Correlation: Paradigm Shifts In 1966 And 1997
US Stock-Bond Correlation: Paradigm Shifts In 1966 And 1997
US Stock-Bond Correlation: Paradigm Shifts In 1966 And 1997
The basis for the 1997 reversal in the stock-bond correlation was a regime shift in the global macro backdrop. Before 1997, the main risk to business cycles and share prices was inflation. From 1997 until very recently, the main risk to equity markets was deflation or very low inflation. The watershed event that triggered this global macro shift from inflation to deflation was the Asian currency devaluation of 1997. The latter followed the Chinese currency devaluations of early 1994 and the Mexican peso’s crash of early 1995 (Chart 2). All these currency devaluations allowed local producers – operating in these large manufacturing hubs – to cut their export prices in US dollar terms. The price reductions unleashed deflationary forces that spread all over the world, including the US. US import prices from emerging Asia ex-China began plummeting in 1997 (Chart 3). Chart 2EM Currency Devaluations Set Off A Deflation Shock In Second Half Of 1990s
EM Currency Devaluations Set Off A Deflation Shock In Second Half Of 1990s
EM Currency Devaluations Set Off A Deflation Shock In Second Half Of 1990s
Chart 3Deflating Asian Export Prices Reinforced Disinflation Trends In US
Deflating Asian Export Prices Reinforced Disinflation Trends In US
Deflating Asian Export Prices Reinforced Disinflation Trends In US
Due to this deflationary shock from EM currency devaluations and other forces (productivity gains, globalization and outsourcing, among others), the US core inflation rate dropped to 2% in 1997 (Chart 3). This marked a regime shift in global equity markets where concerns about deflation, rather than inflation, became the prime focus of investors. Consequently, share prices rallied when bond yields rose, i.e., stock investors cheered stronger growth because the latter meant diminished deflation risks and only a modest inflation pickup. The positive relationship also prevailed in the period prior to the mid-1960s when inflation was below 2% (Chart 1). Looking ahead, the main risk to share prices, at least in the US, will be higher inflation. As investors gain confidence that US core inflation will exceed 2%, US share prices will once again exhibit a negative correlation with Treasury yields, as they did prior to 1997. Inflation Redux Odds are that US core inflation will rise well above 2%, and could potentially overshoot, over the coming 12-36 months. Chart 4US Core Inflation Lags Business Cycle By About 12 Months
US Core Inflation Lags Business Cycle By About 12 Months
US Core Inflation Lags Business Cycle By About 12 Months
Cyclical factors driving core inflation higher in the US are as follows: 1. Core inflation lags the business cycle by about 12 months (Chart 4). A continuous economic recovery points to higher core inflation starting this spring. 2. A combination of surging money supply and a potential revival in the velocity of money heralds higher nominal GDP growth and inflation. It is critical to realize that in contrast to the last decade when the Fed was also undertaking QE programs, US money supply is now skyrocketing, as shown in Chart 5. In the Special Report from October 22, BCA’s Emerging Markets team discussed in depth why US money growth is currently substantially stronger than it was in the post-GFC period. Chart 5An Unprecedented US Broad Money Boom
An Unprecedented US Broad Money Boom
An Unprecedented US Broad Money Boom
With household income and deposits (money supply) booming due to fiscal transfers funded by the Fed (genuine public debt monetization), the only missing ingredient for inflation to transpire is a pickup in the velocity of money. Lets’ recall: Nominal GDP = Price Level x Output Volume = Velocity of Money x Money Supply Solving the above equation for inflation, we arrive at: Price Level = (Velocity of Money x Money Supply) / (Output Volume) Going forward, the velocity of US money will likely recover, for it is closely associated with consumer and businesses’ willingness to spend. At that point, a rising velocity of money and greater money supply will work together to exert upward pressure on nominal GDP and inflation (Chart 6). Chart 6As Velocity Of Money Rises, Inflation Will Accelerate
As Velocity Of Money Rises, Inflation Will Accelerate
As Velocity Of Money Rises, Inflation Will Accelerate
Chart 7US Goods Prices Are Rising
US Goods Prices Are Rising
US Goods Prices Are Rising
3. Demand-supply distortions and shortages will lead to higher prices. The pandemic has distorted supply chains while the overwhelming demand for manufacturing goods has, accordingly, produced shortages. US household spending on goods is booming and US core goods prices as well as import prices from emerging Asia, China and Mexico are rising (Chart 7). Lockdowns will likely permanently curtail capacity in some service sectors. Meanwhile, the reopening of the economy will likely release pent-up demand for services. As a result, demand for some services will overwhelm supply and companies will take advantage of this new reality by charging considerably higher prices. Consumers will not mind paying higher prices to enjoy services that were not available to them for 18 months or so. This will lead to higher inflation expectations, which might become engrained. Critically, this could happen even if the unemployment rate is high or the output gap is large. 4. Pandemic-related fiscal stimulus in the US has amounted to 21% of GDP. We reckon this exceeds the lingering output gap that opened up in response to the economic crash last year. In short, US authorities are over-stimulating. On top of cyclical forces, there are several structural forces pointing to higher inflation: Higher concentration in US industries and the consequent reduction in competition create fertile grounds for inflation. Over the past two decades, the competitive structure of many US industries has changed: it has become oligopolistic. Due to cheap financing and weak enforcement of anti-trust regulations, large companies have acquired smaller competitors. Chart 8 shows the number of anti-trust enforcement cases has been in a secular decline and is currently very low. In the recent past, there were slightly more than 100 cases per annum while the 1970s averaged more than 400 cases per annum when the economy was much smaller and industry concentration was much lower than now. In many industries, several dominant players now have a substantial market share. Such a high concentration across many industries raises odds of collusion and price increases where conditions permit. Chart 9 demonstrates a measure of market concentration across all US industries. A higher number indicates higher industry concentration. Presently, we have the highest concentration in 50 years, which creates fertile ground for companies to raise their prices. Notably, the sharp drop in this measure of market concentration in the early 1980s was one of reasons behind the secular disinflation trend that followed. Chart 8In Past 20 Years Antitrust Regulations Have Not Been Reinforced In US
In Past 20 Years Antitrust Regulations Have Not Been Reinforced In US
In Past 20 Years Antitrust Regulations Have Not Been Reinforced In US
Chart 9US Industry Concentration Is At A Record High
US Industry Concentration Is At A Record High
US Industry Concentration Is At A Record High
Chart 10US Demographic Points Towards Higher Wage Inflation
US Demographic Points Towards Higher Wage Inflation
US Demographic Points Towards Higher Wage Inflation
Retirement of baby boomers entails more consumption and less production and is inflationary, ceteris paribus. The US support ratio1 (shown inverted on the chart) portends that the US is transitioning from an environment of low to higher wage growth (Chart 10). This ratio is calculated as the number of workers relative to consumers. This means more consumers exist versus workers available to produce goods and services and, hence, entails higher wages. Higher employee compensation, unless supported by rapid productivity gains, will beget higher inflation. Government policies targeting faster growth in employee compensation are conducive to higher inflation. One of the Biden administration’s key priorities is to boost wages and reduce income inequality. Unless productivity growth accelerates considerably in the coming years, odds are that labor’s share in national income will rise and companies’ profit margins will be jeopardized. Businesses will attempt to raise prices to restore their profit margins. Provided that income and spending are robust, companies might succeed in raising their prices. In the US, a (moderate) wage-inflation spiral is probable in the coming years. De-globalization – the ongoing shift away from the lowest price producer – entails higher costs of production and, ultimately, higher prices. US import prices are already rising (Chart 7 above). If the US dollar continues to depreciate, exporters to the US will have no other choice but to raise US dollar prices to protect their profit margins. Bottom Line: The US core inflation rate will rise well above 2% in the coming years. Inflationary pressures will become evident later this year when the economy opens up. The main risk to this view is that technology and automation will boost productivity and allow companies to cut or maintain prices despite rising wages. An Invincible Fed? Many investors are relying on the Fed and other central banks to get things right. Yet, policymakers are not always infallible. We offer several reasons why putting one’s faith squarely in the Fed at present might not be the most appropriate investment strategy. It is not unusual for central banks and other government agencies to fight previous wars. As long as the same war lingers, the Fed’s vision and strategy will remain adequate and its policies and actions will secure financial and economic stability, to the benefit of both bond and equity markets. Chart 11US Financial Markets Aggregate Volatility
US Financial Markets Aggregate Volatility
US Financial Markets Aggregate Volatility
However, if we are experiencing a macro paradigm shift from low to higher inflation, the Fed’s strategy and actions will likely prove inadequate, begetting higher financial market volatility, i.e., instability (Chart 11). In brief, if our inflation redux thesis is correct, the Fed will fall behind the inflation curve. In such a scenario, the bond market will continue selling off and rising yields will depress equity valuations. The Fed is excessively and singularly relying on the output gap models and the Phillips curve to forecast inflation. Yet, inflation is a complex and intricate phenomenon, and it is shaped by numerous cyclical and structural forces beyond the output gap and unemployment. Importantly, the output gap and the Phillip’s curve are theoretical models that do not have great success in real-time forecasting. If these models turn out to be wrong, policy decisions will be suboptimal. Financial markets, which up until now have put their faith in the Fed, will riot. Chart 12Inflation Could Rise And Stay High Amid High Unemployment
Inflation Could Rise And Stay High Amid High Unemployment
Inflation Could Rise And Stay High Amid High Unemployment
Interestingly, a popular economic index in the 1970s was the Misery Index, which is calculated as the sum of the inflation rate and the unemployment rate (Chart 12, top panel). The Misery Index was extremely elevated in the 1970s because both unemployment and inflation were high (Chart 12, bottom panel). The point is that inflation can be high alongside elevated unemployment. In its recent report, BCA Research’s Global Investment Strategy service argued: “Some of the mistakes that policymakers made during the 60s and 70s were far from obvious at the time. Athanasios Orphanides, who formerly served as a member of the ECB’s Governing Council, has documented that central banks in the US and other major economies systematically overestimated the amount of slack in their economies. They also overestimated trend growth, with the result that they came to see the combination of sluggish growth and seemingly high unemployment as evidence of inadequate demand.” Inflation is a very inert and persistent phenomenon, and it is not easy to reverse its trajectory. The Fed is now explicitly targeting higher inflation with full confidence that it can easily deal with high inflation when it transpires. We would bet that the Fed will get higher inflation this time, but that high inflation will turn out to be an unpleasant outcome for US policymakers. The basis is that US equity and credit markets are not priced for higher interest rates. By directly and indirectly super-charging equity and bond prices, the Fed has crafted excesses that are vulnerable to higher interest rates (Chart 13). Chart 13US Markets Are Priced To Perfection
US Markets Are Priced To Perfection
US Markets Are Priced To Perfection
On the whole, the Fed is set to fall behind the inflation curve as policymakers will be late to acknowledge higher inflation and alter their policy accordingly. This will be bad news for both equity and corporate bond markets that are priced for perfection. The 1960s Roadmap For Financial Markets? There are many similarities between the US macro picture now and as it was in the late 1960s. In the late 1960s: US inflation was subdued, and interest rates were very low in the preceding two-three decades, i.e., inflation expectations were well anchored heading into the second half of the 1960s. America’s fiscal policy was extremely easy, and the budget deficit was swelling. US domestic demand was robust, and the current account deficit was widening. Chart 14FAANGM Now And Nifty-Fifty Mania In The 1960s
FAANGM Now And Nifty-Fifty Mania In The 1960s
FAANGM Now And Nifty-Fifty Mania In The 1960s
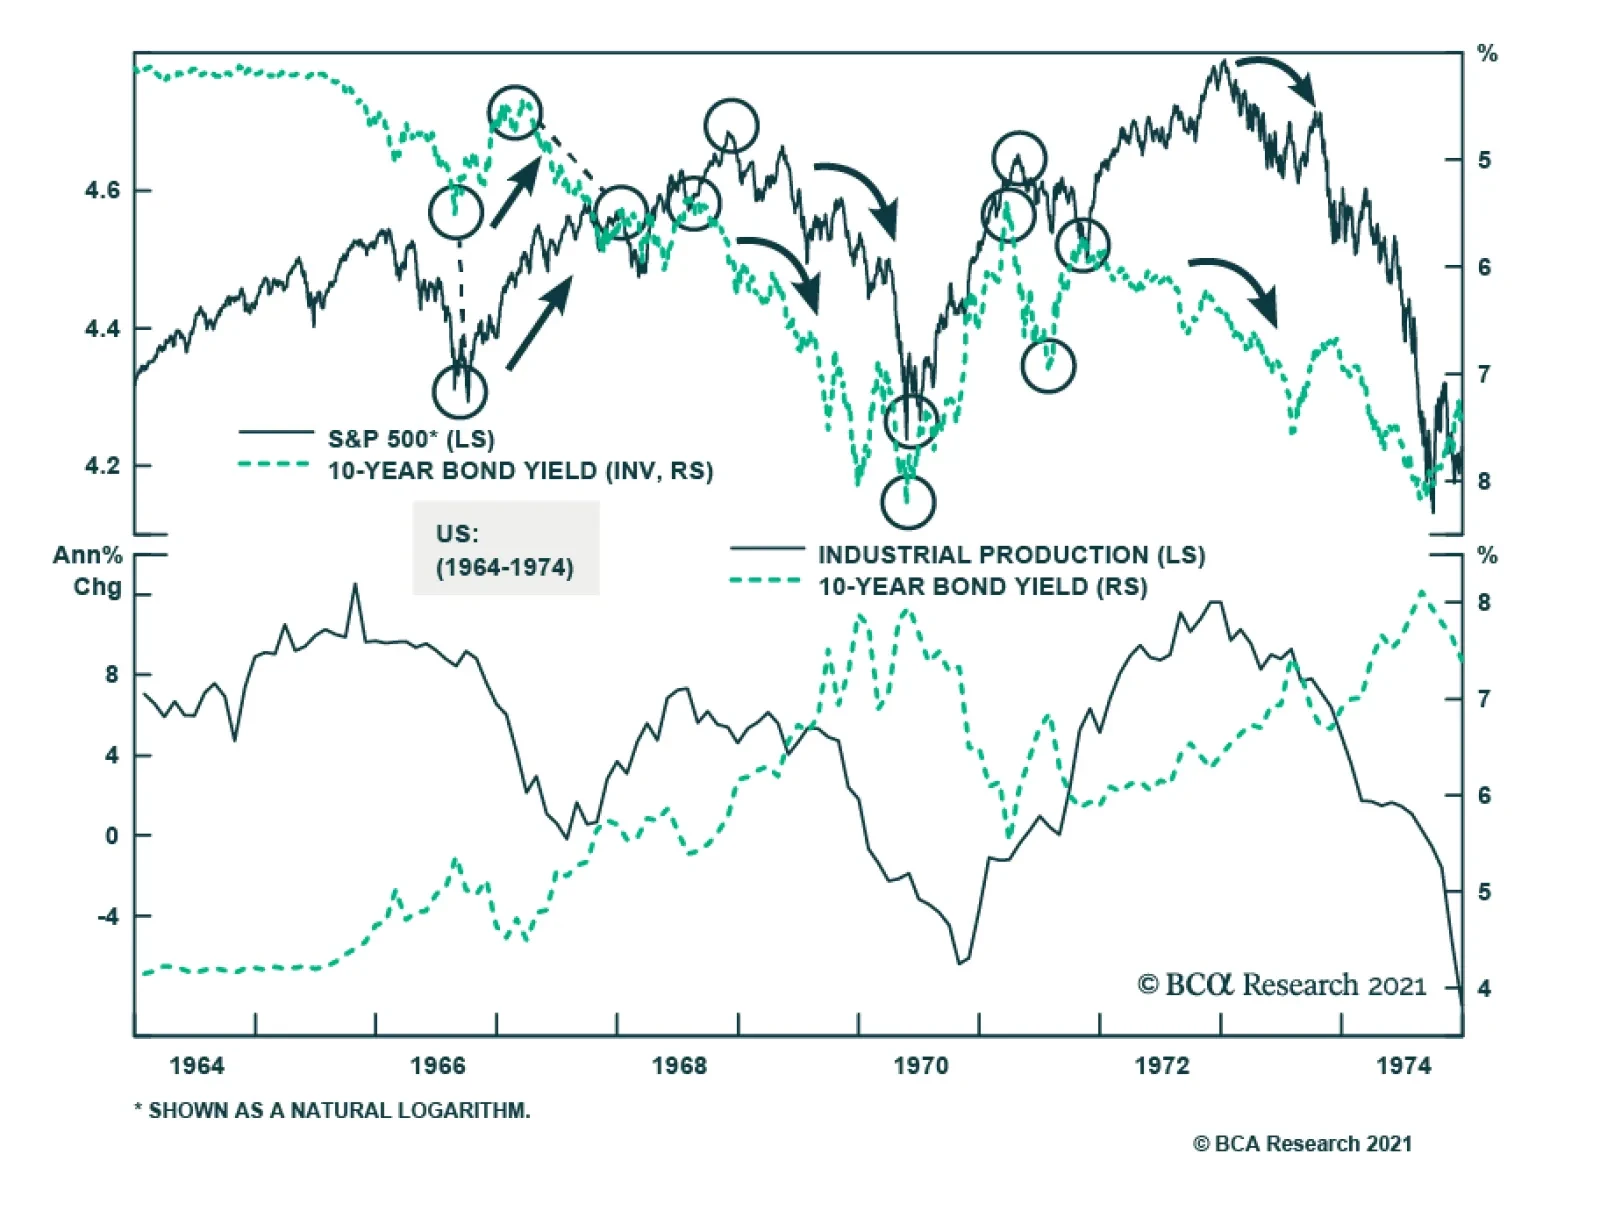
Finally, US equities were in a long bull market and a dozen large-cap stocks (the Nifty-Fifty) was leading the rally. Notably, the decade-long profile of FAANGM2 stock prices in real terms (adjusted for inflation) resembles that of Walt Disney – one of the leaders of the Nifty-Fifty pack – in the 1960s (Chart 14). The following dynamics of financial markets in the 1960s and 1970s are noteworthy and could serve as a roadmap for the present: In the mid-1960s, US share prices initially ignored rising bond yields. However, obstinately rising Treasury yields eventually led to a major equity sell-off (bond yields are shown inverted on this panel) (Chart 15, top panel). Yet, bond yields continued ascending despite plunging share prices. Chart 151962-1974: Stock Prices, Bond Yields, Business Cycle And Inflation
1962-1974: Stock Prices, Bond Yields, Business Cycle And Inflation
1962-1974: Stock Prices, Bond Yields, Business Cycle And Inflation
The culprit was US core inflation surging well above 2% in 1966. This marked a paradigm shift in the relationship between equity prices and US Treasury yields. Share prices bottomed in late 1966 only after bond yields began declining. Notably, the S&P 500 fell by 22% in 1966, even though economic growth remained robust (Chart 15, middle panel). Critically, US bond yields in the period from 1966 until the early 1980s were more correlated with the core inflation rate than with the business cycle (Chart 15, middle and bottom panels). In short, sticky and persistent inflation not economic growth was the main worry for both US bond and stock markets from the mid-1960s until the early-1980s. Presently, the US recovery will continue, and economic growth will be rather robust. However, core inflation will climb well above 2% and US Treasury yields will increase further. At some point, this will upset the equity market. Chart 16US And EM EPS Growth Expectations Are Already Very Elevated
US And EM EPS Growth Expectations Are Already Very Elevated
US And EM EPS Growth Expectations Are Already Very Elevated
A pertinent question for stocks from a valuation standpoint is whether profit growth expectations can continue to increase enough to offset the rise in the discount factor. US equities are already pricing in a lot of earning growth: analysts’ expectations for the S&P 500’s EPS growth are 24% for 2021 and another 15% for 2022. Worth noting is that long-term EPS growth expectations have skyrocketed for both US and EM equities (Chart 16). In short, the main problem with US equities is that their valuations are expensive at a time when inflation and interest rates are set to rise. Investment Strategy The equity rally is entering a risky period. Major shakeouts are likely. Share prices will advance when US bond yields drop, and they will dip when Treasury yields ascend. As and when US share prices drop due to concerns about higher inflation, the Fed will attempt to calm investors arguing that inflation is transitory, and it knows how to deal with it. Stocks and bonds will likely rally on reassurances of this kind. However, financial markets will resume selling off if evidence from the real economy corroborates the thesis of higher inflation. The Fed will again soothe the investment community. Although equity and bond prices might firm up anew, such a rebound might not last long as investors will begin to question the appropriateness of the Fed’s policy. Chart 17No Contrarian Buy Signal For US Treasurys
No Contrarian Buy Signal For US Treasurys
No Contrarian Buy Signal For US Treasurys
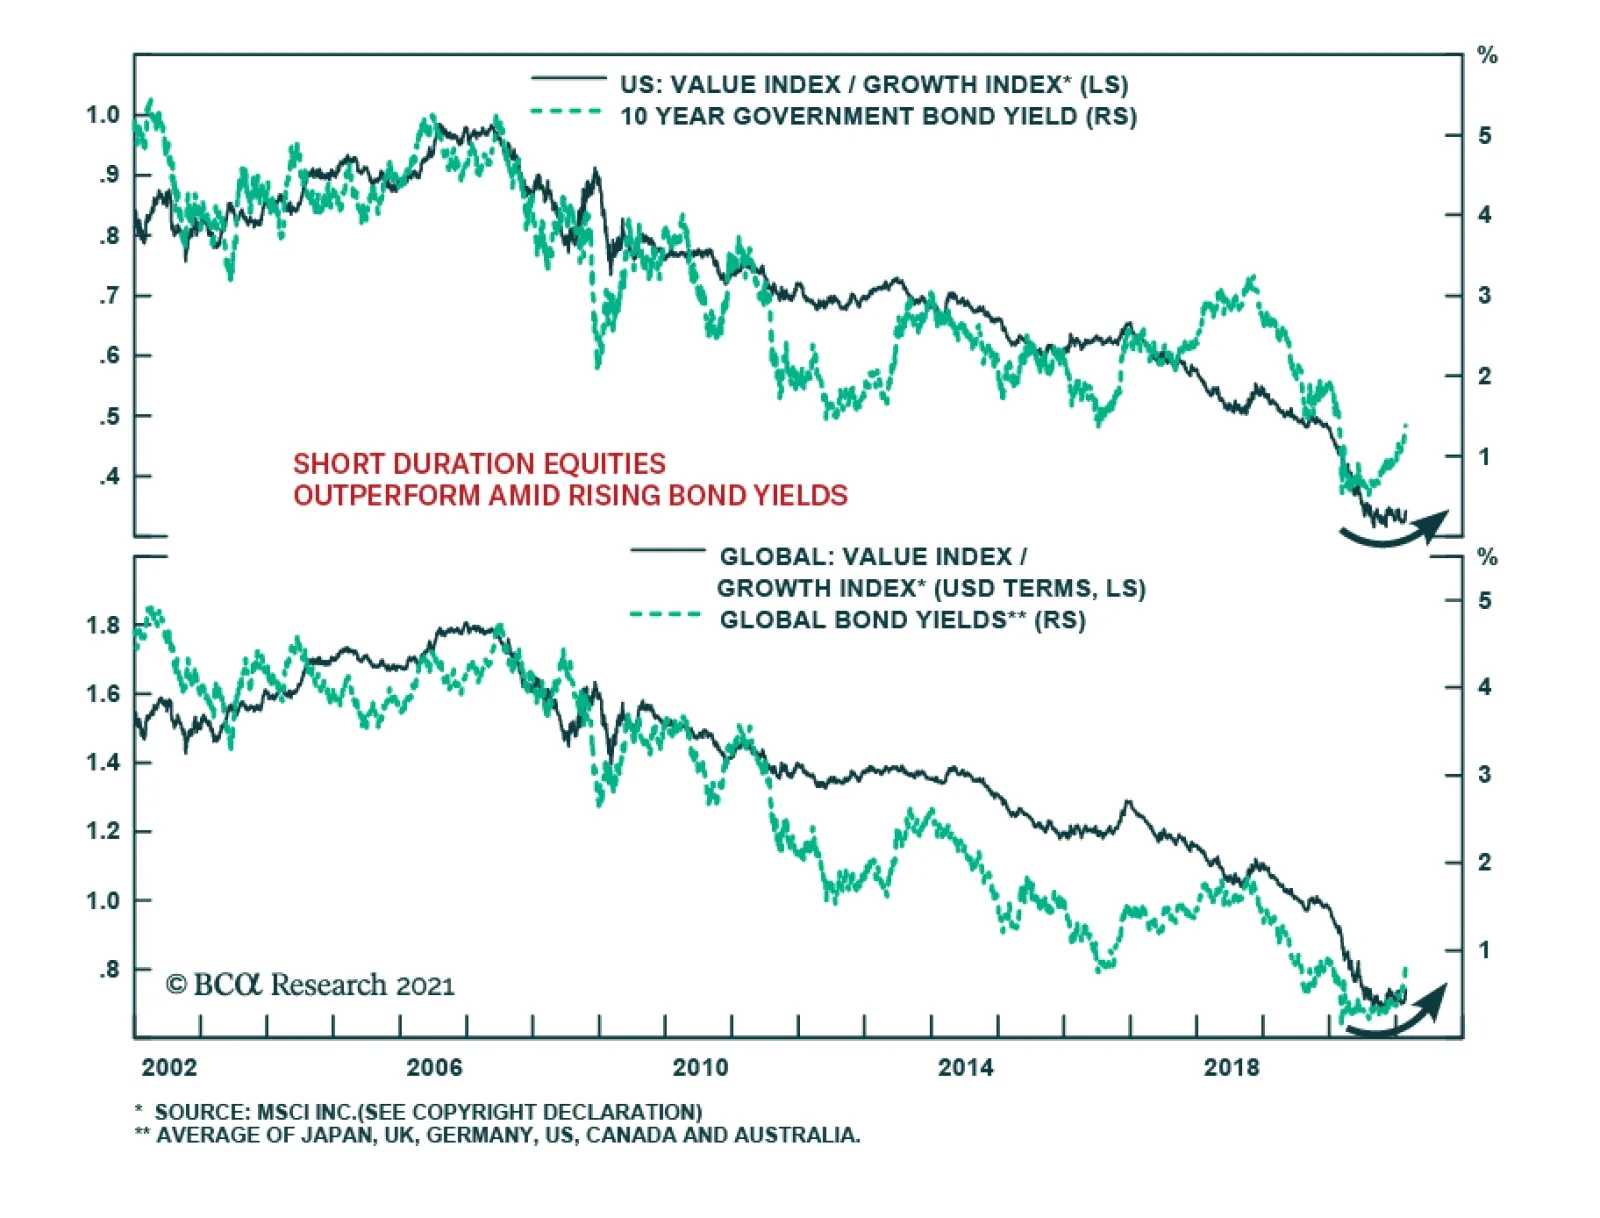
The sell-off in US Treasurys is unlikely to be over for now as traders’ sentiment on government bonds is far from a bearish extreme (Chart 17). Ultimately, to cap inflation, the Fed will have to hike interest rates more than the fixed-income market is currently pricing. This will not go down well with stock or bond markets. Higher US bond yields entail that global growth stocks will underperform global value stocks. The former is much more expensive and, hence, is more vulnerable to a rising discount rate. Global equity portfolios should underweight the US, adopt a neutral stance on EM and overweight Europe and Japan. The market-cap weight of growth stocks is the highest in the US followed by EM. European and Japanese bourses are less vulnerable to rising bond yields. The Fed falling behind the inflation curve is fundamentally bearish for the US dollar. That is why the primary trend for the dollar remains down. However, the greenback is very oversold and a rebound is likely, especially if US yields continue to rise, triggering a period of risk-off in global financial markets. Arthur Budaghyan Chief Emerging Markets Strategist arthurb@bcaresearch.com Footnotes 1This measure was originally shown by BCA’s Global Investment Strategy team and is calculated as the ratio of the number of workers to the number of consumers. The number of workers incorporates age-specific variation in labor force participation, unemployment, hours worked, and productivity while the number of consumers incorporates age-specific variation in needs or wants based on age-specific consumption data. 2An equally-weighted index of Facebook, Amazon, Apple, Netflix, Google (Alphabet) and Microsoft stock prices.
Looking To Re-establish Small Cap Bias
Looking To Re-establish Small Cap Bias
Upgrade Alert Small cap indexes regained their footing late last year and recovered two years of losses relative to the SPX in a mere quarter. During that uprising in mid-January we monetized sizable gains both on a cyclical and tactical (high-conviction) time horizon, and subsequently added the small cap bias back to our upgrade watch list. Following a drubbing in absolute and relative valuations, small caps have regained their luster and are now trading at a near 15% premium on a 10-year Cyclically Adjusted P/E (CAPE) basis. Given BCA’s view that the sell-off in the bond market has staying power, we are monitoring this ratio closely for a better entry point. Bottom Line: Small cap stock indexes remain on our upgrade alert list, awaiting a more compelling level to re-establish a small cap size portfolio bias.