United States

Highlights The positive correlation between share prices and US bond yields – that has been in place since 1997 – is likely to turn negative. Looking ahead, stock prices will fall when US bond yields rise and will rally when Treasury yields drop. The basis is that the key macro risk to equities is shifting from low inflation/deflation to higher inflation. Global growth stocks will underperform value stocks. US equities will lag international markets. Investment strategies and frameworks that have worked over the past 24 years might require modifications. Feature From 1966 until 1997, US equity prices were negatively correlated with US Treasury yields (Chart 1, top panel). Since 1997, US share prices have been positively correlated with US government bond yields. We believe we are now in the process of a major paradigm shift in the stock-bond correlation, reverting to the pre-1997 relationship. Chart 1US Stock-Bond Correlation: Paradigm Shifts In 1966 And 1997
US Stock-Bond Correlation: Paradigm Shifts In 1966 And 1997
US Stock-Bond Correlation: Paradigm Shifts In 1966 And 1997
The basis for the 1997 reversal in the stock-bond correlation was a regime shift in the global macro backdrop. Before 1997, the main risk to business cycles and share prices was inflation. From 1997 until very recently, the main risk to equity markets was deflation or very low inflation. The watershed event that triggered this global macro shift from inflation to deflation was the Asian currency devaluation of 1997. The latter followed the Chinese currency devaluations of early 1994 and the Mexican peso’s crash of early 1995 (Chart 2). All these currency devaluations allowed local producers – operating in these large manufacturing hubs – to cut their export prices in US dollar terms. The price reductions unleashed deflationary forces that spread all over the world, including the US. US import prices from emerging Asia ex-China began plummeting in 1997 (Chart 3). Chart 2EM Currency Devaluations Set Off A Deflation Shock In Second Half Of 1990s
EM Currency Devaluations Set Off A Deflation Shock In Second Half Of 1990s
EM Currency Devaluations Set Off A Deflation Shock In Second Half Of 1990s
Chart 3Deflating Asian Export Prices Reinforced Disinflation Trends In US
Deflating Asian Export Prices Reinforced Disinflation Trends In US
Deflating Asian Export Prices Reinforced Disinflation Trends In US
Due to this deflationary shock from EM currency devaluations and other forces (productivity gains, globalization and outsourcing, among others), the US core inflation rate dropped to 2% in 1997 (Chart 3). This marked a regime shift in global equity markets where concerns about deflation, rather than inflation, became the prime focus of investors. Consequently, share prices rallied when bond yields rose, i.e., stock investors cheered stronger growth because the latter meant diminished deflation risks and only a modest inflation pickup. The positive relationship also prevailed in the period prior to the mid-1960s when inflation was below 2% (Chart 1). Looking ahead, the main risk to share prices, at least in the US, will be higher inflation. As investors gain confidence that US core inflation will exceed 2%, US share prices will once again exhibit a negative correlation with Treasury yields, as they did prior to 1997. Inflation Redux Odds are that US core inflation will rise well above 2%, and could potentially overshoot, over the coming 12-36 months. Chart 4US Core Inflation Lags Business Cycle By About 12 Months
US Core Inflation Lags Business Cycle By About 12 Months
US Core Inflation Lags Business Cycle By About 12 Months
Cyclical factors driving core inflation higher in the US are as follows: 1. Core inflation lags the business cycle by about 12 months (Chart 4). A continuous economic recovery points to higher core inflation starting this spring. 2. A combination of surging money supply and a potential revival in the velocity of money heralds higher nominal GDP growth and inflation. It is critical to realize that in contrast to the last decade when the Fed was also undertaking QE programs, US money supply is now skyrocketing, as shown in Chart 5. In the Special Report from October 22, BCA’s Emerging Markets team discussed in depth why US money growth is currently substantially stronger than it was in the post-GFC period. Chart 5An Unprecedented US Broad Money Boom
An Unprecedented US Broad Money Boom
An Unprecedented US Broad Money Boom
With household income and deposits (money supply) booming due to fiscal transfers funded by the Fed (genuine public debt monetization), the only missing ingredient for inflation to transpire is a pickup in the velocity of money. Lets’ recall: Nominal GDP = Price Level x Output Volume = Velocity of Money x Money Supply Solving the above equation for inflation, we arrive at: Price Level = (Velocity of Money x Money Supply) / (Output Volume) Going forward, the velocity of US money will likely recover, for it is closely associated with consumer and businesses’ willingness to spend. At that point, a rising velocity of money and greater money supply will work together to exert upward pressure on nominal GDP and inflation (Chart 6). Chart 6As Velocity Of Money Rises, Inflation Will Accelerate
As Velocity Of Money Rises, Inflation Will Accelerate
As Velocity Of Money Rises, Inflation Will Accelerate
Chart 7US Goods Prices Are Rising
US Goods Prices Are Rising
US Goods Prices Are Rising
3. Demand-supply distortions and shortages will lead to higher prices. The pandemic has distorted supply chains while the overwhelming demand for manufacturing goods has, accordingly, produced shortages. US household spending on goods is booming and US core goods prices as well as import prices from emerging Asia, China and Mexico are rising (Chart 7). Lockdowns will likely permanently curtail capacity in some service sectors. Meanwhile, the reopening of the economy will likely release pent-up demand for services. As a result, demand for some services will overwhelm supply and companies will take advantage of this new reality by charging considerably higher prices. Consumers will not mind paying higher prices to enjoy services that were not available to them for 18 months or so. This will lead to higher inflation expectations, which might become engrained. Critically, this could happen even if the unemployment rate is high or the output gap is large. 4. Pandemic-related fiscal stimulus in the US has amounted to 21% of GDP. We reckon this exceeds the lingering output gap that opened up in response to the economic crash last year. In short, US authorities are over-stimulating. On top of cyclical forces, there are several structural forces pointing to higher inflation: Higher concentration in US industries and the consequent reduction in competition create fertile grounds for inflation. Over the past two decades, the competitive structure of many US industries has changed: it has become oligopolistic. Due to cheap financing and weak enforcement of anti-trust regulations, large companies have acquired smaller competitors. Chart 8 shows the number of anti-trust enforcement cases has been in a secular decline and is currently very low. In the recent past, there were slightly more than 100 cases per annum while the 1970s averaged more than 400 cases per annum when the economy was much smaller and industry concentration was much lower than now. In many industries, several dominant players now have a substantial market share. Such a high concentration across many industries raises odds of collusion and price increases where conditions permit. Chart 9 demonstrates a measure of market concentration across all US industries. A higher number indicates higher industry concentration. Presently, we have the highest concentration in 50 years, which creates fertile ground for companies to raise their prices. Notably, the sharp drop in this measure of market concentration in the early 1980s was one of reasons behind the secular disinflation trend that followed. Chart 8In Past 20 Years Antitrust Regulations Have Not Been Reinforced In US
In Past 20 Years Antitrust Regulations Have Not Been Reinforced In US
In Past 20 Years Antitrust Regulations Have Not Been Reinforced In US
Chart 9US Industry Concentration Is At A Record High
US Industry Concentration Is At A Record High
US Industry Concentration Is At A Record High
Chart 10US Demographic Points Towards Higher Wage Inflation
US Demographic Points Towards Higher Wage Inflation
US Demographic Points Towards Higher Wage Inflation
Retirement of baby boomers entails more consumption and less production and is inflationary, ceteris paribus. The US support ratio1 (shown inverted on the chart) portends that the US is transitioning from an environment of low to higher wage growth (Chart 10). This ratio is calculated as the number of workers relative to consumers. This means more consumers exist versus workers available to produce goods and services and, hence, entails higher wages. Higher employee compensation, unless supported by rapid productivity gains, will beget higher inflation. Government policies targeting faster growth in employee compensation are conducive to higher inflation. One of the Biden administration’s key priorities is to boost wages and reduce income inequality. Unless productivity growth accelerates considerably in the coming years, odds are that labor’s share in national income will rise and companies’ profit margins will be jeopardized. Businesses will attempt to raise prices to restore their profit margins. Provided that income and spending are robust, companies might succeed in raising their prices. In the US, a (moderate) wage-inflation spiral is probable in the coming years. De-globalization – the ongoing shift away from the lowest price producer – entails higher costs of production and, ultimately, higher prices. US import prices are already rising (Chart 7 above). If the US dollar continues to depreciate, exporters to the US will have no other choice but to raise US dollar prices to protect their profit margins. Bottom Line: The US core inflation rate will rise well above 2% in the coming years. Inflationary pressures will become evident later this year when the economy opens up. The main risk to this view is that technology and automation will boost productivity and allow companies to cut or maintain prices despite rising wages. An Invincible Fed? Many investors are relying on the Fed and other central banks to get things right. Yet, policymakers are not always infallible. We offer several reasons why putting one’s faith squarely in the Fed at present might not be the most appropriate investment strategy. It is not unusual for central banks and other government agencies to fight previous wars. As long as the same war lingers, the Fed’s vision and strategy will remain adequate and its policies and actions will secure financial and economic stability, to the benefit of both bond and equity markets. Chart 11US Financial Markets Aggregate Volatility
US Financial Markets Aggregate Volatility
US Financial Markets Aggregate Volatility
However, if we are experiencing a macro paradigm shift from low to higher inflation, the Fed’s strategy and actions will likely prove inadequate, begetting higher financial market volatility, i.e., instability (Chart 11). In brief, if our inflation redux thesis is correct, the Fed will fall behind the inflation curve. In such a scenario, the bond market will continue selling off and rising yields will depress equity valuations. The Fed is excessively and singularly relying on the output gap models and the Phillips curve to forecast inflation. Yet, inflation is a complex and intricate phenomenon, and it is shaped by numerous cyclical and structural forces beyond the output gap and unemployment. Importantly, the output gap and the Phillip’s curve are theoretical models that do not have great success in real-time forecasting. If these models turn out to be wrong, policy decisions will be suboptimal. Financial markets, which up until now have put their faith in the Fed, will riot. Chart 12Inflation Could Rise And Stay High Amid High Unemployment
Inflation Could Rise And Stay High Amid High Unemployment
Inflation Could Rise And Stay High Amid High Unemployment
Interestingly, a popular economic index in the 1970s was the Misery Index, which is calculated as the sum of the inflation rate and the unemployment rate (Chart 12, top panel). The Misery Index was extremely elevated in the 1970s because both unemployment and inflation were high (Chart 12, bottom panel). The point is that inflation can be high alongside elevated unemployment. In its recent report, BCA Research’s Global Investment Strategy service argued: “Some of the mistakes that policymakers made during the 60s and 70s were far from obvious at the time. Athanasios Orphanides, who formerly served as a member of the ECB’s Governing Council, has documented that central banks in the US and other major economies systematically overestimated the amount of slack in their economies. They also overestimated trend growth, with the result that they came to see the combination of sluggish growth and seemingly high unemployment as evidence of inadequate demand.” Inflation is a very inert and persistent phenomenon, and it is not easy to reverse its trajectory. The Fed is now explicitly targeting higher inflation with full confidence that it can easily deal with high inflation when it transpires. We would bet that the Fed will get higher inflation this time, but that high inflation will turn out to be an unpleasant outcome for US policymakers. The basis is that US equity and credit markets are not priced for higher interest rates. By directly and indirectly super-charging equity and bond prices, the Fed has crafted excesses that are vulnerable to higher interest rates (Chart 13). Chart 13US Markets Are Priced To Perfection
US Markets Are Priced To Perfection
US Markets Are Priced To Perfection
On the whole, the Fed is set to fall behind the inflation curve as policymakers will be late to acknowledge higher inflation and alter their policy accordingly. This will be bad news for both equity and corporate bond markets that are priced for perfection. The 1960s Roadmap For Financial Markets? There are many similarities between the US macro picture now and as it was in the late 1960s. In the late 1960s: US inflation was subdued, and interest rates were very low in the preceding two-three decades, i.e., inflation expectations were well anchored heading into the second half of the 1960s. America’s fiscal policy was extremely easy, and the budget deficit was swelling. US domestic demand was robust, and the current account deficit was widening. Chart 14FAANGM Now And Nifty-Fifty Mania In The 1960s
FAANGM Now And Nifty-Fifty Mania In The 1960s
FAANGM Now And Nifty-Fifty Mania In The 1960s
Finally, US equities were in a long bull market and a dozen large-cap stocks (the Nifty-Fifty) was leading the rally. Notably, the decade-long profile of FAANGM2 stock prices in real terms (adjusted for inflation) resembles that of Walt Disney – one of the leaders of the Nifty-Fifty pack – in the 1960s (Chart 14). The following dynamics of financial markets in the 1960s and 1970s are noteworthy and could serve as a roadmap for the present: In the mid-1960s, US share prices initially ignored rising bond yields. However, obstinately rising Treasury yields eventually led to a major equity sell-off (bond yields are shown inverted on this panel) (Chart 15, top panel). Yet, bond yields continued ascending despite plunging share prices. Chart 151962-1974: Stock Prices, Bond Yields, Business Cycle And Inflation
1962-1974: Stock Prices, Bond Yields, Business Cycle And Inflation
1962-1974: Stock Prices, Bond Yields, Business Cycle And Inflation
The culprit was US core inflation surging well above 2% in 1966. This marked a paradigm shift in the relationship between equity prices and US Treasury yields. Share prices bottomed in late 1966 only after bond yields began declining. Notably, the S&P 500 fell by 22% in 1966, even though economic growth remained robust (Chart 15, middle panel). Critically, US bond yields in the period from 1966 until the early 1980s were more correlated with the core inflation rate than with the business cycle (Chart 15, middle and bottom panels). In short, sticky and persistent inflation not economic growth was the main worry for both US bond and stock markets from the mid-1960s until the early-1980s. Presently, the US recovery will continue, and economic growth will be rather robust. However, core inflation will climb well above 2% and US Treasury yields will increase further. At some point, this will upset the equity market. Chart 16US And EM EPS Growth Expectations Are Already Very Elevated
US And EM EPS Growth Expectations Are Already Very Elevated
US And EM EPS Growth Expectations Are Already Very Elevated
A pertinent question for stocks from a valuation standpoint is whether profit growth expectations can continue to increase enough to offset the rise in the discount factor. US equities are already pricing in a lot of earning growth: analysts’ expectations for the S&P 500’s EPS growth are 24% for 2021 and another 15% for 2022. Worth noting is that long-term EPS growth expectations have skyrocketed for both US and EM equities (Chart 16). In short, the main problem with US equities is that their valuations are expensive at a time when inflation and interest rates are set to rise. Investment Strategy The equity rally is entering a risky period. Major shakeouts are likely. Share prices will advance when US bond yields drop, and they will dip when Treasury yields ascend. As and when US share prices drop due to concerns about higher inflation, the Fed will attempt to calm investors arguing that inflation is transitory, and it knows how to deal with it. Stocks and bonds will likely rally on reassurances of this kind. However, financial markets will resume selling off if evidence from the real economy corroborates the thesis of higher inflation. The Fed will again soothe the investment community. Although equity and bond prices might firm up anew, such a rebound might not last long as investors will begin to question the appropriateness of the Fed’s policy. Chart 17No Contrarian Buy Signal For US Treasurys
No Contrarian Buy Signal For US Treasurys
No Contrarian Buy Signal For US Treasurys
The sell-off in US Treasurys is unlikely to be over for now as traders’ sentiment on government bonds is far from a bearish extreme (Chart 17). Ultimately, to cap inflation, the Fed will have to hike interest rates more than the fixed-income market is currently pricing. This will not go down well with stock or bond markets. Higher US bond yields entail that global growth stocks will underperform global value stocks. The former is much more expensive and, hence, is more vulnerable to a rising discount rate. Global equity portfolios should underweight the US, adopt a neutral stance on EM and overweight Europe and Japan. The market-cap weight of growth stocks is the highest in the US followed by EM. European and Japanese bourses are less vulnerable to rising bond yields. The Fed falling behind the inflation curve is fundamentally bearish for the US dollar. That is why the primary trend for the dollar remains down. However, the greenback is very oversold and a rebound is likely, especially if US yields continue to rise, triggering a period of risk-off in global financial markets. Arthur Budaghyan Chief Emerging Markets Strategist arthurb@bcaresearch.com Footnotes 1This measure was originally shown by BCA’s Global Investment Strategy team and is calculated as the ratio of the number of workers to the number of consumers. The number of workers incorporates age-specific variation in labor force participation, unemployment, hours worked, and productivity while the number of consumers incorporates age-specific variation in needs or wants based on age-specific consumption data. 2An equally-weighted index of Facebook, Amazon, Apple, Netflix, Google (Alphabet) and Microsoft stock prices.
For this month’s Special Report, we are sending you a collaboration between our US Investment Strategy and US Political Strategy teams. US Political Strategy is our newest strategy service and it extends the proprietary framework of our Geopolitical Strategy service to provide analysis of political developments that is relevant for US-focused investors. Please contact your relationship manager if you would like more information or to begin trialing the service. Highlights Ronald Reagan cast a long shadow over the elected officials who followed him … :The influence of the economic policies associated with Ronald Reagan held such persistent sway that even the Clinton and Obama administrations had to follow their broad outlines. … just as Paul Volcker did over central bankers at home and abroad … : The Volcker Fed’s uncompromising resistance to the 1970s’ runaway inflation established the Fed’s credibility and enshrined a new global central banking orthodoxy. … but it appears their enduring influence may have finally run its course … : The pandemic overrode everything else in real time, but investors may ultimately view 2020 as the year in which Democrats broke away from post-Reagan orthodoxy and the Fed decided Volcker’s vigilance was no longer relevant. … to investors’ potential chagrin: If inflation, big government and organized labor come back from the dead, globalization loses ground, regulation expands, anti-trust enforcement regains some bite and tax rates rise and become more progressive, then the four-decade investment golden age that Reagan and Volcker helped launch may be on its last legs. Feature The pandemic dominated everything in real time in 2020, as investors scrambled to keep up with its disruptions and the countermeasures policymakers deployed to shelter the economy from them. With some distance, however, investors may come to view it as a year of two critical policy inflection points: the end of the Reagan fiscal era and the end of the Volcker monetary era. The shifts could mark a watershed because Reagan’s and Volcker’s enduring influence helped power an investment golden age that has lasted for nearly 40 years. What comes next may not be so supportive for financial markets. Political history often unfolds in cycles even if their starting and ending dates are never as clear cut in real life as they are in dissertations. Broadly, the FDR administration kicked off the New Deal era, a 48-year period of increased government involvement in daily life via the introduction and steady expansion of the social safety net, broadened regulatory powers and sweeping worker protections. It was followed by the 40-year Reagan era, with a continuous soundtrack of limited government rhetoric made manifest in policies that sought to curtail the spread of social welfare programs, deregulate commercial activity, devolve power to state and local government units and the private sector and push back against unions. The Obama and Trump administrations challenged different aspects of Reaganism, but the 2020 election cycle finally toppled it. Ordinarily, that might only matter to historians and political scientists, but the Reagan era coincided with a fantastic run in financial markets. So, too, did the inflation vigilance that lasted long after Paul Volcker’s 1979-1987 tenure at the helm of the Federal Reserve, which drove an extended period of disinflation, falling interest rates and rising central bank credibility. Our focus here is on fiscal policy, and we touch on monetary policy only to note that last summer’s revision of the Fed’s statement of long-run monetary policy goals shut the door on the Volcker era. The end of both eras could mark an inflection point in the trajectory of asset returns. The Happy Warrior The nine most terrifying words in the English language are, “I’m from the government, and I’m here to help.”1 Chart II-1After The Recession, Reagan Was A Hit
After The Recession, Reagan Was A Hit
After The Recession, Reagan Was A Hit
Ronald Reagan held his conservative views with the zeal of the convert that he was.2 Those views were probably to the right of much of the electorate, but his personal appeal was strong enough to make them palatable to a sizable majority (Chart II-1). Substitute “left” for “right” and the sentiment just as easily sums up FDR’s ability to get the New Deal off the ground. Personal magnetism played a big role in each era’s rise, with both men radiating relatability and optimism that imbued their sagging fellow citizens with a sense of comfort and security that made them willing to try something very different. 1980 was hardly 1932 on the distress scale, but America was in a funk after the upheaval of the sixties, the humiliating end to Vietnam, Watergate, stagflation and a term and a half of uninspiring and ineffectual presidential leadership. Enter the Great Communicator, whose initial weekly radio address evoked the FDR of the Fireside Chats – jovial, resolute and confident, with palpable can-do energy – buffed to a shine by a professional actor and broadcaster whose vocal inflections hit every mark.3 The Gipper,4 with his avuncular bearing, physical robustness and ever-present twinkle in his eye, was just what the country needed to feel better about itself. Reaganomics 101 Government does not tax to get the money it needs; government always finds a need for the money it gets.5 President Reagan’s economic plan had three simple goals: cut taxes, tame government spending and reduce regulation. From the start of his entry into politics in the mid-sixties, Reagan cast himself as a defender of hard-working Americans’ right to keep more of the fruits of their labor from a grasping federal government seeking funding for wasteful, poorly designed programs. He harbored an intense animus for LBJ’s Great Society, which extended the reach of the federal government in ways that he characterized as a drag on initiative, accomplishment and freedom, no matter how well intentioned it may have been. That message hung a historic loss on Barry Goldwater in 1964 when inflation was somnolent but it proved to be far more persuasive after the runaway inflation of the seventies exposed the perils of excessive government (Chart II-2). Chart II-2Inflation Rises When The Labor Market Heats Up
Inflation Rises When The Labor Market Heats Up
Inflation Rises When The Labor Market Heats Up
As the Reagan Foundation website describes the impact of his presidency’s economic policies, “Millions … were able to keep more of the money for which they worked so hard. Families could reliably plan a budget and pay their bills. The seemingly insatiable Federal government was on a much-needed diet. And businesses and individual entrepreneurs were no longer hassled by their government, or paralyzed by burdensome and unnecessary regulations every time they wanted to expand.” “In a phrase, the American dream had been restored.” The Enduring Reach Of Reaganomics I’m not in favor of abolishing the government. I just want to shrink it down to the size where we can drown it in the bathtub. – Grover Norquist Though President-Elect Clinton bridled at limited government’s inherent restrictions, bursting out during a transition briefing, “You mean to tell me that the success of the economic program and my re-election hinges on the Federal Reserve and a bunch of f***ing bond traders?” his administration largely observed them. This was especially true after the drubbing Democrats endured in the 1994 midterms, when the Republicans captured their first House majority in four decades behind the Contract with America, a skillfully packaged legislative agenda explicitly founded on Reagan principles. Humbled in the face of Republican majorities in both houses of Congress, and hemmed in by roving bands of bond vigilantes, Clinton was forced to tack to the center. James Carville, a leading architect of Clinton’s 1992 victory, captured the moment, saying, “I used to think that if there was reincarnation, I wanted to come back as the president or the pope or … a .400 … hitter. But now I would like to come back as the bond market. You can intimidate everybody.” Reagan’s legacy informed the Bush administration’s sweeping tax cuts (and its push to privatize social security), and forced the Obama administration to tread carefully with the stimulus package it devised to combat the Great Recession. Although the administration’s economic advisors considered the $787 billion (5%-of-peak-GDP) bill insufficient, political staffers carried the day and the price tag was kept below $800 billion to appease the three Republican senators whose votes were required to pass it. Even with the economy in its worst state since the Depression, the Obama administration had to acquiesce to Reaganite budget pieties if it wanted any stimulus bill at all. Its leash got shorter after it agreed with House Republicans to “sequester” excess spending under the Budget Control Act of 2011. On the Republican side of the aisle, Grover Norquist, who claims to have founded Americans for Tax Reform (ATR) at Reagan’s request, enforced legislative fealty to the no-new-tax mantra. ATR, which opposes all tax increases as a matter of principle, corrals legislators with the Taxpayer Protection Pledge, “commit[ting] them to oppose any effort to increase income taxes on individuals and businesses.” ATR’s influence has waned since its 2012 peak, when 95% of Republicans in Congress had signed the pledge, and Norquist no longer strikes fear in the hearts of Republicans inclined to waver on taxes. His declining influence is testament to Reaganism’s success on the one hand (the tax burden has already been reduced) and the fading appeal of its signature fiscal restraint on the other. Did Government Really Shrink? When the legend becomes fact, print the legend. – The Man Who Shot Liberty Valance For all of its denunciations of government spending, the Reagan administration ran up the largest expansionary budget deficits (as a share of GDP) of any postwar administration until the global financial crisis (Chart II-3). Although it aggressively slashed non-defense discretionary spending, it couldn’t cut enough to offset the Pentagon’s voracious appetite. The Reagan deficits were not all bad: increased defense spending hastened the end of the Cold War, so they were in a sense an investment that paid off in the form of the ‘90s peace dividend and the budget surpluses it engendered. Chart II-3Cutting The Federal Deficit Is Harder Than It Seems
Cutting The Federal Deficit Is Harder Than It Seems
Cutting The Federal Deficit Is Harder Than It Seems
Nonetheless, the Reagan experience reveals the uncomfortable truth that there is little scope for any administration or Congressional session to cut federal spending. Mandatory entitlement spending on social security, Medicare and Medicaid constitutes the bulk of federal expenditures (Chart II-4) and they are very popular with the electorate, as the Trump campaign shrewdly recognized in the 2016 Republican primaries (Table II-1). Discretionary spending, especially ex-defense, is a drop in the bucket, thanks largely to a Reagan administration that already cut it to the bone (Chart II-5). Chart II-4The Relentless Rise In Mandatory Spending ...
The Relentless Rise In Mandatory Spending ...
The Relentless Rise In Mandatory Spending ...
Chart II-5Overwhlems Any Plausible Discretionary Cuts
Overwhlems Any Plausible Discretionary Cuts
Overwhlems Any Plausible Discretionary Cuts
Table II-1How Trump Broke Republican Orthodoxy On Entitlement Spending
March 2021
March 2021
The Reagan tax cuts therefore accomplished the easy part of the “starve the beast” strategy but his administration failed to make commensurate cuts in outlays (Chart II-6). If overall spending wasn’t cut amidst oppressive inflation, while the Great Communicator was in the Oval Office to make the case for it to a considerably more fiscally conservative electorate, there is no chance that it will be cut this decade. As our Geopolitical Strategy service has flagged for several years, the median US voter has moved to the left on economic policy. Reagan-era fiscal conservatism has gone the way of iconic eighties features like synthesizers, leg warmers and big hair, even if it had one last gasp in the form of the post-crisis “Tea Party” and Obama’s compromise on budget controls. Chart II-6Grover Norquist Is Going To Need A Bigger Bathtub
Grover Norquist Is Going To Need A Bigger Bathtub
Grover Norquist Is Going To Need A Bigger Bathtub
Do Republicans Still Want The Reagan Mantle? Chart II-7“Limited Government” Falling Out Of Fashion
March 2021
March 2021
Reaganism is dead, killed by a decided shift in broad American public opinion, and within the Republican and Democratic parties themselves. Americans are just as divided today as they were in Reagan’s era about the size of the government but the trend since the late 1990s is plainly in favor of bigger government (Chart II-7). Recent developments, including the 2020 election, reinforce our conviction that trend will not reverse any time soon. The Republicans are the natural heirs of Reagan’s legacy. Much of President Trump’s appeal to conservatives lay in his successful self-branding as the new Reagan. Though he lacked the Gipper’s charisma and affability, his unapologetic assertion of American exceptionalism rekindled some of the glow of Morning-in-America confidence. Following the outsider trail blazed by Reagan, he lambasted the Washington establishment and promised to slash bureaucracy, deregulate the economy and shake things up. Trump’s signature legislative accomplishment was the largest tax reform since Reagan’s in 1986. He oversaw defense spending increases to take on China, which he all but named the new “evil empire.”6 Like Reagan, he was willing to weather criticism for face-to-face meetings with rival nations’ dictators. Even his trade protectionism had more in common with the Reagan administration than is widely recognized.7 Chart II-8Reagan’s Amnesty On Immigration
March 2021
March 2021
But major differences in the two presidents’ policy portfolios underline the erosion of the Reagan legacy’s hold. President Trump outflanked his Republican competitors for the 2016 nomination by running against cutting government spending – he was the only candidate who opposed entitlement reform. His signature proposal was to stem immigration by means of a Mexican border wall. While Reagan had sought to crack down on illegal immigration, he pursued a compromise approach and granted amnesty to 2.9 million illegal immigrants living in America to pass the Immigration Reform and Control Act of 1986, sparing businesses from having to scramble to replace them (Chart II-8). While Reagan curtailed non-defense spending, Trump signed budget-busting bills with relish, even before the COVID pandemic necessitated emergency deficit spending. Trump tried to use the power of government to intervene in the economy and alienated the business community, which revered Reagan, with his scattershot trade war. Trump’s greater hawkishness on immigration and trade and his permissiveness on fiscal spending differentiated him from Reagan orthodoxy and signaled a more populist Republican Party. Chart II-9Trump Could Start Third Party, Give Democrats A Decade-Plus Ascendancy
March 2021
March 2021
More fundamentally, Trump represents a new strain of Republican that is at odds with the party’s traditional support for big business and disdain for big government. If he leads that strain to take on the party establishment by challenging moderate Republicans in primary elections and insisting on running as the party’s next presidential candidate, the GOP will be swimming upstream in the 2022 and 2024 elections. It is too soon to make predictions about either of these elections other than to say that Trump is capable of splitting the party in a way not seen since Ross Perot in the 1990s or Theodore Roosevelt in the early 1900s (Chart II-9).8 If he does so, the Democrats will remain firmly in charge and lingering Reaganist policies will be actively dismantled. Even if the party manages to preserve its fragile Trumpist/traditionalist coalition, it is hard to imagine it will recover its appetite for shrinking entitlements, siding against labor or following a laissez-faire approach to corporate conduct and combinations. Republicans will pay lip service to fiscal restraint but Trump’s demonstration that austerity does not win votes will lead them to downplay spending cuts and entitlement reform as policy priorities – at least until inflation again becomes a popular grievance (Chart II-10). Republicans will also fail to gain traction with voters if they campaign merely on restoring the Trump tax cuts after Biden’s likely partial repeal of them. Support for the Tax Cut and Jobs Act hardly reached 40% for the general public and 30% for independents and it is well known that the tax reform did little to help Republicans in the 2018 midterm elections, when Democrats took the House (Chart II-11). Chart II-10Republicans Have Many Priorities Above Budget Deficits
March 2021
March 2021
Chart II-11Trump Tax Cuts Were Never Very Popular
March 2021
March 2021
On immigration the Republican Party will follow Trump and refuse amnesty. Immigration levels are elevated and Biden’s lax approach to the border, combined with a looming growth disparity with Latin America, will generate new waves of incomers and provoke a Republican backlash. On trade and foreign policy, Republicans will follow a synthesis of Reagan and Trump in pursuing a cold war with China. The Chinese economy is set to surpass the American economy by the year 2028 and is already bigger in purchasing power parity terms (Chart II-12). The Chinese administration is becoming more oppressive at home, more closed to liberal and western ideas, more focused on import substitution, and more technologically ambitious. The Chinese threat will escalate in the coming decade and the Republican Party will present itself as the anti-communist party by proposing a major military-industrial build-up. Yet it is far from assured that the Democrats will be soft on China, which is to say that they will not be able to cut defense spending substantially. Chart II-12China Is the New "Evil Empire" For GOP
China Is the New "Evil Empire" For GOP
China Is the New "Evil Empire" For GOP
Will Biden Take Up The Cause? One might ask if the Biden administration might seek to adopt some elements of the Reagan program. President Biden is among the last of the pro-market Democrats who emerged in the wake of the Reagan revolution. Those “third-way” Democrats thrived in the 1990s by accommodating themselves to Reagan’s free-market message while maintaining there was a place for a larger federal role in certain aspects of the economy and society. The 2020 election demonstrated that the Democrats’ political base is larger than the Republicans’ and third-way policies could be a way to make further inroads with affluent suburbanites who helped deliver Georgia and Virginia. Alas, the answer appears to be no. The Democrats’ base increasingly abhors Reagan-era economic and social policies, and the country’s future demographic changes reinforce the party’s current, progressive trajectory. That means fiery younger Democrats don’t have to compromise their principles with third-way policies when they can just wait for Texas to turn blue. Chart II-13Democrats Look To New Deal, Eschew ‘Third Way’
March 2021
March 2021
Biden has only been in office for one month but a rule of thumb is that his party will pull him further to the left the longer Republicans remain divided and ineffective. His cabinet appointments have been center-left, not far-left, though his executive orders have catered to the far-left, particularly on immigration. In order to pass his two major legislative proposals through an evenly split Senate he must appeal to Democratic moderates, as every vote in the party will be needed to get the FY2021 and FY2022 budget reconciliation bills across the line, with Vice President Kamala Harris acting as the Senate tie breaker. Nevertheless his agenda still highlights that the twenty-first century Democrats are taking a page out of the FDR playbook and unabashedly promoting big government solutions (Chart II-13). Biden’s $1.9 trillion American Rescue Plan is not only directed at emergency pandemic relief but also aims to shore up state and local finances, education, subsidized housing, and child care. His health care proposals include a government-provided insurance option (originally struck from the Affordable Care Act to secure its passage in 2010) and a role for Medicare in negotiating drug prices. And his infrastructure plan is likely to provide cover for a more ambitious set of green energy projects that will initiate the Democratic Party’s next big policy pursuit after health care: environmentalism. The takeaway is not that Biden’s administration is necessarily radical – he eschews government-administered health care and is only proposing a partial reversal of Trump’s tax cuts – but rather that his party has taken a decisive turn away from the “third-way” pragmatism that defined his generation of Democrats in favor of a return to the “Old-Left” and pro-labor policies of the New Deal era (Chart II-14). The party has veered to the left in reaction to the Iraq War, the financial crisis, and Trumpism. Vice President Harris, Biden’s presumptive heir, had the second-most progressive voting record during her time in the Senate and would undoubtedly install a more progressive cabinet. Table II-2 shows her voting record alongside other senators who ran against Biden in the Democratic primary election. All of them except perhaps Senator Amy Klobuchar stood to his left on the policy spectrum. Chart II-14Democrats Eschew Budget Constraints
March 2021
March 2021
Fundamentally the American electorate is becoming more open to a larger role for the government in the economy and society. While voters almost always prioritize the economy and jobs, policy preferences have changed. The morass of excessive inflation, deficits, taxation, regulation, strikes and business inefficiencies that gave rise to the Reagan movement is not remembered as ancient history – it is not even remembered. The problems of slow growth, inadequate health and education, racial injustice, creaky public services, and stagnant wages are by far the more prevalent concerns – and they require more, not less, spending and government involvement (Chart II-15). Insofar as voters worry about foreign threats they focus on the China challenge, where Biden will be forced to adopt some of Trump’s approach. Table II-2Harris Stood To The Left Of Democratic Senators
March 2021
March 2021
Chart II-15Public Concern For Economy Means Greater Government Help
March 2021
March 2021
When inflation picks up in the coming years, voters will not reflexively ask for government to be pared back so that the economy becomes more efficient, as they did once they had a taste of Reagan’s medicine in the early 1980s. Rather, they will ask the government to step in to provide higher wages, indexation schemes, price caps, and assistance for labor, as is increasingly the case. The ruling party will be offering these options and the opposition Republicans will render themselves obsolete if they focus single-mindedly on austerity measures. Americans will have to experience a recession caused by inflation – i.e. stagflation – before they call for anything resembling Reagan again. The Post-Reagan Market Landscape Many investors and conservative economists were shocked9 that the Bernanke Fed’s mix of zero interest rates and massive securities purchases did not foster runaway inflation and destroy the dollar. They failed to anticipate that widespread private-sector deleveraging would put a lid on money creation (and that other major central banks would follow in the Fed’s ZIRP and QE footsteps). But a longer view of four decades of disinflation suggests another conclusion: Taking away the monetary punch bowl when the labor party gets going and pursuing limited-government fiscal policy can keep inflation pressures from gaining traction. Globalization, technology-enabled elimination of many lower-skilled white-collar functions and the hollowing out of the organized labor movement all helped as well, though they helped foment a revolt among a meaningful segment of the Republican rank-and-file against Reagan-style policies. The Volcker Fed set the tone for pre-emptive monetary tightening and subsequent FOMCs have reliably intervened to cool off the economy when the labor market begins heating up. The Phillips Curve may be out of favor with investors, but wage inflation only gathers steam when the unemployment rate falls below its natural level (Chart II-16), and the Fed did not allow negative unemployment gaps to persist for very long in the Volcker era. Without wage inflation putting more money in the hands of a broad cross-section of households with a fairly high marginal propensity to consume, it’s hard to get inflation in consumer prices. Chart II-16Taking The Punch Bowl Away From The Union Hall
Taking The Punch Bowl Away From The Union Hall
Taking The Punch Bowl Away From The Union Hall
The Fed took the cyclical wind from the labor market’s sails but the Reagan administration introduced a stiff secular headwind when it crushed PATCO, the air traffic controllers’ union, in 1981, marking an inflection point in the relationship between management and labor. That watershed event opened the door for employers to deploy much rougher tactics against unions than they had since before the New Deal.10 Reagan’s championing of free markets helped establish globalization as an economic policy that the third-way Clinton administration eagerly embraced with NAFTA and a campaign to admit China to the WTO. The latter coincided with a sharp decline in labor’s share of income (Chart II-17). Chart II-17Outsourcing Has Not Been Good For US Labor
Outsourcing Has Not Been Good For US Labor
Outsourcing Has Not Been Good For US Labor
The core Reagan tenets – limited government, favoring management over labor, globalization, sleepy anti-trust enforcement, reduced regulation and less progressive tax systems with lower rates – are all at risk of Biden administration rollbacks. While the easy monetary/tight fiscal combination promoted a rise in asset prices rather than consumer prices ever since the end of the global financial crisis, today’s easy monetary/easy fiscal could promote consumer price inflation and asset price deflation. We do not think inflation will be an issue in 2021 but we expect it will in the later years of Biden’s term. Ultimately, we expect massive fiscal accommodation will stoke inflation pressures and those pressures, abetted by a Fed which has pledged not to pre-emptively remove accommodation when the labor market tightens, will eventually bring about the end of the bull market in risk assets and the expansion. Investment Implications Business revered the Reagan administration and investors rightfully associate it with the four-decade bull market that began early in its first term. Biden is no wild-eyed liberal, but rolling back core Reagan-era tenets has the potential to roll back juicy Reagan-era returns. Only equities have the lengthy data series to allow a full comparison of Reagan-era returns with postwar New Deal-era returns (Table II-3), but the path of Treasury bond yields in the three-decade bear market that preceded the current four-decade bull market suggests that bonds generated little, if any, real returns in the pre-Reagan postwar period (Chart II-18). Stagnant precious metal returns point to tame Reagan-era inflation and downward pressure on input costs. Table II-3Annualized Real Market Returns Before And After Reagan
March 2021
March 2021
Chart II-18Bond Investors Loved Volcker And The Gipper
Bond Investors Loved Volcker And The Gipper
Bond Investors Loved Volcker And The Gipper
Owning the market is not likely to be as rewarding going forward as it was in the Reagan era. Active management may again have its day in the sun as the end of the Reagan tailwinds open up disparities between sectors, sub-industries and individual companies. Even short-sellers may experience a renaissance. We recommend that multi-asset investors underweight bonds, especially Treasuries. We expect the clamor for bigger government will contribute to a secular bear market that could rival the one that persisted from the fifties to the eighties. Within Treasury portfolios, we would maintain below-benchmark duration and favor TIPS over nominal bonds at least until the Fed signals that its campaign to re-anchor inflation expectations higher has achieved its goal. Gold and/or other precious metals merit a place in portfolios as a hedge against rising inflation and other real assets, from land to buildings to other resources, are worthy of consideration as well. BCA has been cautioning of a downward inflection in long-run financial asset returns for a few years, based on demanding valuations and a steadily shrinking scope for ongoing declines in inflation and interest rates. Mean reversion has been part of the thesis as well; trees simply don’t grow to the sky. Now that the curtain has fallen on the Volcker and Reagan eras, the inevitable downward inflection has received a catalyst. We remain constructive on risk assets over the next twelve months, but we expect that intermediate- and long-term returns will fall well short of their post-1982 pace going forward. Doug Peta, CFA Chief US Investment Strategist dougp@bcaresearch.com Matt Gertken Vice President Geopolitical Strategy mattg@bcaresearch.com Footnotes 1 August 12, 1986 Press Conference News Conference | The Ronald Reagan Presidential Foundation & Institute (reaganfoundation.org), accessed February 4, 2021. Reagan makes the quip in his prepared opening remarks. 2 Reagan was a Democrat until he entered politics in his fifties. He claimed to have voted for FDR four times. 3 April 3, 1982 Radio Address President Reagan's Radio Address to the Nation on the Program for Economic Recovery - 4/3/82 - YouTube, accessed February 4, 2021. 4 As an actor, Reagan was perhaps best known for his portrayal of Notre Dame football legend George Gipp, who is immortalized in popular culture as the subject of the “win one for the Gipper” halftime speech. 5 July 22, 1981 White House Remarks to Visiting Editors and Broadcasters reaganfoundation.org, accessed February 8, 2021. 6 Reagan famously urged his followers, in reference to the USSR, “I urge you to beware the temptation of pride—the temptation of blithely declaring yourselves above it all and label both sides equally at fault, to ignore the facts of history and the aggressive impulses of an evil empire.” See his “Address to the National Association of Evangelicals,” March 8, 1983, voicesofdemocracy.umd.edu. 7 Robert Lighthizer, the Trump administration trade representative who directed its tariff battles, was a veteran of Reagan’s trade wars against Japan in the 1980s. 8 “Exclusive: The Trump Party? He still holds the loyalty of GOP voters,” USA Today, February 21, 2021, usatoday.com. 9 Open Letter to Ben Bernanke,” November 15, 2010. Open Letter to Ben Bernanke | Hoover Institution Accessed February 23, 2021. 10 Please see the following US Investment Strategy Special Reports, “Labor Strikes Back, Parts 1, 2 and 3,” dated January 13, January 20 and February 3, 2020, available at usis.bcaresearch.com.
Highlights The pandemic is not yet over, but it appears that infections have peaked in the developed world and in most of the major developing economies. Economic growth will reaccelerate as social distancing abates and vaccination programs gather momentum. The current policy orthodoxy is night-and-day different from the orthodoxy that prevailed in the wake of the global financial crisis, as deficit shaming has given way to deficit positivity. Rapid expansion is more likely than a repeat of last decade’s tepid, plodding recovery and inflation will eventually supplant hysteresis as policymakers’ biggest worry. The impending passage of the $1.9 trillion American Rescue Act will vault the US ahead of its major economy counterparts in terms of pandemic spending. Washington’s massive fiscal commitment speeds up the timetable for closing the output gap in the US. Although inflation has become a hot topic among US investors, we do not see it materializing until next year at the earliest. Our base case has the Goldilocks backdrop of solid growth and ample monetary accommodation remaining in place for at least the rest of the year. Markets have fully discounted that scenario but investors should be aware that both downside and upside surprises are possible; bad virus news could drive a growth shortfall while households’ enormous excess savings could power a consumption breakout. The broad take-up of the Goldilocks scenario among equity investors will make it hard for stocks to dazzle in 2021. Nonetheless, we think conditions support mid-to-high single-digit returns, which will allow equities to outperform bonds. The combination of accelerating growth and quiescent central banks is catnip for equities but not so much for bonds, especially investment-grade sovereigns. Fixed-income investors should maintain below-benchmark duration as yield curves steepen. Steepening yield curves have given Financials a shot in the arm while weighing on the high-flying Tech sector. Reopening in the wake of COVID’s retreat should also redound to recent laggards’ benefit and we continue to expect value stocks will outperform their growth counterparts over the rest of the year. The US dollar will resume its downtrend as the virus is beaten back, albeit at a gentler pace than in 2020. Humanity Retakes The Lead Humankind cannot yet declare victory over COVID-19 but it does appear to have gained the upper hand as new case counts have plummeted from their January peak (Chart I-1). Restrictions helped turn the tide in Europe, albeit at the cost of cutting off oxygen to the economy (Chart I-2), but even in Sweden and the US, which eschewed EU-style restrictions, the virus has lost momentum. Increased vigilance apparently trumped fears that the coronavirus would flourish in the northern hemisphere winter. The potential for vaccine-resistant variants is a concern, but the pandemic news is clearly trending in the right direction. Chart I-1The Fever Has Broken
The Fever Has Broken
The Fever Has Broken
Chart I-2Throwing The Merchants Out With The Bathwater
Throwing The Merchants Out With The Bathwater
Throwing The Merchants Out With The Bathwater
As infections fall, so too does the strain on public health care systems. Plunging hospitalizations (Chart I-3) indicate that health care systems have recovered capacity. Hospitalizations are an important metric for tracking COVID’s impact on the economy because they lead restrictions on activity; when they are high and rising, officials are prone to limit person-to-person interaction, and when they are low and falling, officials roll back emergency limits. For services-heavy developed economies, easier restrictions are the key to a return to something more closely resembling normal activity until vaccinations confer herd immunity (Chart I-4). Chart I-3Restrictions Can Be Lifted As Health Care Systems Regain Capacity
Restrictions Can Be Lifted As Health Care Systems Regain Capacity
Restrictions Can Be Lifted As Health Care Systems Regain Capacity
In the meantime, those who continue to be displaced by the pandemic and the distancing measures taken to combat it will fall back on fiscal support. Fourth-quarter deceleration in the United States highlighted the important role that fiscal transfers have played in keeping vulnerable households, businesses and communities afloat. The bulk of the transfers authorized under the CARES Act were distributed in two bursts. The first arrived in April and May via economic impact payments of $1,200 per adult and $500 per child that were paid in full to about two-thirds of American households1 (Chart I-5, top panel). Chart I-4Lockdowns Are A Drag
Lockdowns Are A Drag
Lockdowns Are A Drag
Chart I-5Transfers Slowed To A Trickle In The Fall
March 2021
March 2021
Chart I-6Fewer Transfers, Fewer Sales, ...
Fewer Transfers, Fewer Sales, ...
Fewer Transfers, Fewer Sales, ...
The second burst came in the form of a weekly $600 federal unemployment insurance (UI) benefit supplement in April, May, June and July (Chart I-5, middle panel). Additional aid was provided by the pandemic unemployment assistance (PUA) program, which expanded UI benefits to independent contractors, self-employed individuals and other workers who would not otherwise qualify to receive them. The PUA program was the smallest of the three major transfer plans and the only one that ran until the end of the year, and as the arrival of the direct payment checks and final UI benefit supplements receded further into the past, the US economy began to show some signs of wear. Retail sales fell sequentially in all three months of the fourth quarter (Chart I-6) as total employment hit a wall (Chart I-7) and the economic surprise index swooned (Chart I-8). Chart I-7... Fewer Jobs ...
... Fewer Jobs ...
... Fewer Jobs ...
Chart I-8... And Fewer Positive Surprises
... And Fewer Positive Surprises
... And Fewer Positive Surprises
Households’ ability to satisfy their obligations to creditors and landlords slipped as the year wore on as well. Fiscal transfers and forbearance programs have limited credit distress far more effectively than one would have expected when the COVID meteor hit the earth (Table I-1), but leading 30-day delinquency rates reveal a modest erosion since late summer (Chart I-9). The share of apartment renters paying at least some of their rent fell by more than one-and-a-half percentage points from year-ago levels in October, November, December and January, a first since the CARES Act transfers began to flow in time to help with the May rent (Chart I-10). It seems clear that lower-income households who relied most heavily on aid felt its absence as the year wore on. Table I-160- And 90-Day Consumer Delinquencies Are Down Year-Over-Year, ...
March 2021
March 2021
Chart I-9... But Leading 30-Day Delinquencies Are On The Rise ...
March 2021
March 2021
Chart I-10... And Apartment Rent Collections Have Been Slipping
March 2021
March 2021
We take the snapback in January retail sales as evidence that high marginal-propensity-to-consume households needed the second round of transfers provided for in December’s compromise spending bill. Both the economic impact payments ($600 per qualifying adult and $600 per child) and the supplemental UI benefits ($300 per week) were smaller, but the most vulnerable households put them to immediate use. We expect that February rent collections and consumer loan delinquencies will also show improvement, albeit not as dramatically as the retail sales series. With another, larger round of stimulus coming down the pike, it appears that the US economy will avoid a repeat of its fourth quarter fraying around the edges but slumps remain a possibility in economies that allow transfer schemes to lapse before COVID-19 can be tamed. And Now For Something Completely Different The global economy has confronted two significant crises in the space of a dozen years. The events that precipitated them could hardly have been more different: the global financial crisis (GFC) was an endogenous event with enough avarice, hubris, folly and villainy to support a cottage industry of books, movies and TV shows revisiting it, while the pandemic, for all of the official complacency and bumbling it laid bare, was simply an exogenous occurrence of great misfortune. The monetary policy response to both events has been substantially identical; the Fed swiftly took the fed funds rate back to zero, bought copious quantities of Treasury and agency securities, and launched a mix of old and new emergency measures. Other major central banks, which were largely unable to make any moves toward normalization between crises, simply maintained zero or negative interest rate policy and ramped up the pace and/or scope of their own asset purchase programs. The fiscal response has been dramatically different, however, in line with a 180-degree turn in budget orthodoxy. Chastened, perhaps, by Europe’s double-dip recession, or the protractedly tepid US expansion, economic mandarins have experienced a road-to-Damascus conversion. Whereas the OECD and the IMF began wagging their fingers at prodigal legislators while the global economy was still submerged under the GFC rubble, today they counsel that there is no rush to pull back on spending. As the OECD’s chief economist said in a January interview, “The first lesson [from the aftermath of the GFC] is to make sure governments are not tightening in the one to two years following the trough of GDP.2” The IMF has declared that “the near-term priority is to avoid premature withdrawal of fiscal support. Support should persist, at least into 2021, to sustain the recovery and to limit long-term scarring.3” Chart I-11What Goes Up Must ... Go Up Again
What Goes Up Must ... Go Up Again
What Goes Up Must ... Go Up Again
The about-face in terms of fiscal deficits could have a profound effect on the character of the post-pandemic expansions. The plodding and protracted post-GFC recovery/expansion might be viewed as an object lesson in monetary policy’s limits. There is no gainsaying that central banks acted boldly to counter the GFC, cutting policy rates to zero and beyond, purchasing vast quantities of sovereign bonds, government agency securities and even debt and equity issued by private entities. The purchases caused central bank balance sheets to swell (Chart I-11), but the money creation impact was stunted by an offsetting wave of defaults and a general reluctance on the part of lenders and would-be borrowers to add to the stock of debt. Chart I-12GFC Stimulus Was Fleeting
March 2021
March 2021
GFC fiscal spending was modest and largely limited to automatic stabilizers once emergency measures ran their course. Even the most celebrated efforts, like the United States’ 2009 Recovery Act, were intentionally modest in scope and limited in duration. Following the prevailing wisdom, national governments quickly moved to withdraw assistance and reduce their budget deficits once the worst of the crisis had passed (Chart I-12). Tepid investment, sluggish employment gains and fiscal drag all weighed on growth, defying the typical bigger-the-decline, bigger-the-bounce business cycle pattern. The picture is quite different today as central banks have gained a powerful and willing partner in their efforts to combat the damage wrought by a sudden shock. Pandemic fiscal stimulus initiatives have dwarfed GFC efforts across the major economies (Chart I-13). Once Congress passes the $1.9 trillion American Rescue Act, the US will have doubled down on its 2020 initiatives, committing to aid equivalent to an extraordinary 25% of its annual output. The ultimate effect on inflation, interest rates and exchange rates remains to be seen, but it is clear that the post-pandemic expansion will not unfold at the plodding pace of the post-GFC expansion. Chart I-13The COVID Fiscal Response Has Dwarfed The GFC's
March 2021
March 2021
Goldilocks And The Two Tails Narrowing our focus to the US, which comprises nearly 60% of the market cap of the benchmark MSCI All-Country World Index, our base case is the Goldilocks scenario that markets appear to be discounting. That scenario would entail the just-right outcome of solid growth and continued monetary accommodation (Figure I-1). Since the Fed will only dial back accommodation if the economy appears to be at risk of overheating, it will take a growth disappointment, most likely from a negative virus surprise, for the US economy to tumble into the left-hand tail of the distribution. Figure I-1Goldilocks And The Two Tails
March 2021
March 2021
Chart I-14Making Up For Lost Time
Making Up For Lost Time
Making Up For Lost Time
We cannot rule out the possibility of virus-resistant mutations or new rounds of outbreaks from a weary populace that lets its guard down, but a failure to vaccinate at a pace consistent with achieving herd immunity by the end of September looks to be the most likely route to disappointment. To that end, we are monitoring vaccination progress against the pace required to get 50-80% of the population inoculated by the end of the third quarter (Chart I-14). The US got off to a slow start, but we are confident that it will catch up by early spring under an administration that has made crushing the virus its top priority and a Congress that is providing the resources to enable local health authorities to get the job done. The case for an upside near-term surprise stems from the notion that America’s solons have provided considerably more aid to households than was strictly necessary. As Chart I-7 showed, total employment fell by 25 million at the trough in April and close to 9 million fewer people are employed now than at the pre-pandemic peak. They can surely use a lifeline, along with the many Americans who are involuntarily working part time and those who are barely holding on even if they are fully employed. But they number far less than the 100 million households4 (two-thirds of all taxpayers) that received the full $1,800-per-adult economic impact payments ($1,200 last spring and $600 in January), and will be in line for another $1,400, as soon as March, under the terms of the new bill. Households who did not need the largesse have presumably saved the distributions, helping contribute to the $1.5 trillion of excess savings accumulated during the pandemic. Thanks to the transfers provided for by the CARES Act, our US Investment Strategy service estimates that aggregate household income from March through December was $450 billion greater than it would have been in the absence of COVID-19 (Table I-2). With the second round of direct payments amounting to about $150 billion and the third round likely to be more than double the second, household incomes will be boosted by another $500 billion and the excess savings horde will be on its way to $2 trillion and beyond. Even in a $21 trillion economy, that much dry powder has the potential to move the needle. Table I-2Households' Excess Pandemic Savings
March 2021
March 2021
In the absence of even a somewhat related antecedent, no one can say for sure how much of the excess savings will be spent. Ricardian equivalence, which posits that households will be reluctant to spend fiscal windfalls if they anticipate that they will have to pay for them with higher future taxes, and Milton Friedman’s permanent income hypothesis, which posits that consumption decisions are based on lifetime earnings, both suggest that the multiplier effect of the direct payments to households may not be all it's cracked up to be. Empirical evidence does not definitively support either model, but increased income has only accounted for a third of households’ mountain of savings in any event. The remaining two-thirds, amounting to over a trillion dollars, came from reduced consumption. Even if Ricardo’s and Friedman’s hypotheses are mostly on the mark, if much of the $1 trillion of 2020’s reduced consumption was merely deferred rather than destroyed (Box I-1), pent-up consumer demand could be significant. The range of potential outcomes is wide: on the one hand, money has tended to burn a hole in US households’ pockets; on the other, Ricardo and Friedman aren’t exactly Larry Kudlow or Peter Navarro. It is hard to assert with any conviction how much of the savings cache will be spent, or how quickly, but we highlight its presence to point out that near-term US growth could surprise to the upside. BOX I-1 Demand Deferral Or Demand Destruction? February’s Bank Credit Analyst presented a table with simple estimates of the US pandemic spending gap. It showed that spending on goods is tracking above the level that would have been expected if the pandemic had not occurred but that spending on services is down sharply, with an enormous gap in categories like food service, recreation and transportation. The fate of US households’ massive excess savings might come down to what happens to the forgone consumption. Consumption that is not deferred to some later period will simply disappear. Given that the consumption shortfall is entirely confined to services, the key question becomes: Is forgone services consumption more likely to turn into demand destroyed than forgone goods consumption? We suspect the answer is yes. Considering it from the perspective of the categories that suffered the biggest shortfalls, one cannot catch up by eating multiple restaurant dinners in a day, going back in time to attend last season’s sports and entertainment events, or taking more than one flight and staying in more than one hotel room. Services demand may also incorporate more of a discretionary component: one might want to go to a ballgame or a concert, or get out of town over a long weekend, but one eventually has to replace a sputtering car or refrigerator. Some forgone services demand likely turned into accelerated goods demand as white-collar workers redirected workday spending to building out office capabilities at home. Even more may have been diverted to home theater and exercise equipment, or to making one’s outdoor space into a more inviting place to while away the pandemic. The bottom line is that some goods demand appears to have been pulled forward by the pandemic while some services demand has likely been destroyed. There is surely pent-up consumer demand, and it will begin to be released once the pandemic has been subdued, but only some of the accumulated savings will be directed to satisfying it. Conclusions And Investment Recommendations For investors focused on the coming 6-12 months, the key takeaways from our analysis are as follows: Provided that official measures and personal vigilance continue to curtail COVID-19 until vaccinations can stifle it, the growth outlook should steadily improve. In the United States, where the federal government is determined to err on the side of providing too much fiscal support, growth could pick up a lot of steam. If enough pandemic-weary people fail to maintain their vigilance and observe social distancing measures, vaccine distribution efforts become snagged or vaccine-resistant strains emerge, growth could fall short of the consensus expectation embedded in financial market prices. Based on its plans to double down on its initial infusion of fiscal support, the US is the major economy most likely to exceed expectations, perhaps even to the point of overheating. After drilling into the increased income/foregone consumption components of the mountain of savings American households have amassed during the pandemic, however, we reiterate our conclusion that all of the savings will not be spent. The US economy will accelerate smartly this year but overheating is a low-probability event. Chart I-15The Coming Regional And Style Rotation
The Coming Regional And Style Rotation
The Coming Regional And Style Rotation
Given these conclusions, we recommend the following investment stance over the next 6-12 months: Overweight equities, which will generate excess returns over sovereign bonds and cash in the absence of a negative COVID surprise, and underweight fixed income. Maintain below-benchmark duration in fixed income portfolios. Underweight US stocks and overweight global ex-US stocks, which will benefit from the reopening of the global economy, and value over growth stocks, which will benefit from reopening and a steeper yield curve. The former broke out in January and held their lead last month (Chart I-15, top panel) while value is testing resistance at its 200-day moving average (Chart I-15, bottom panel). Underweight the US dollar versus the euro in particular and other more cyclical currencies in general. We do not expect the greenback to fall as sharply as it did last year from May through December but we do expect it will resume declining over the rest of the year. Doug Peta, CFA Chief US Investment Strategist dougp@bcaresearch.com February 25, 2021 Next Report: March 31, 2021 II. Requiem For Volcker And The Gipper For this month’s Special Report, we are sending you a collaboration between our US Investment Strategy and US Political Strategy teams. US Political Strategy is our newest strategy service and it extends the proprietary framework of our Geopolitical Strategy service to provide analysis of political developments that is relevant for US-focused investors. Please contact your relationship manager if you would like more information or to begin trialing the service. Ronald Reagan cast a long shadow over the elected officials who followed him … :The influence of the economic policies associated with Ronald Reagan held such persistent sway that even the Clinton and Obama administrations had to follow their broad outlines. … just as Paul Volcker did over central bankers at home and abroad … : The Volcker Fed’s uncompromising resistance to the 1970s’ runaway inflation established the Fed’s credibility and enshrined a new global central banking orthodoxy. … but it appears their enduring influence may have finally run its course … : The pandemic overrode everything else in real time, but investors may ultimately view 2020 as the year in which Democrats broke away from post-Reagan orthodoxy and the Fed decided Volcker’s vigilance was no longer relevant. … to investors’ potential chagrin: If inflation, big government and organized labor come back from the dead, globalization loses ground, regulation expands, anti-trust enforcement regains some bite and tax rates rise and become more progressive, then the four-decade investment golden age that Reagan and Volcker helped launch may be on its last legs. The pandemic dominated everything in real time in 2020, as investors scrambled to keep up with its disruptions and the countermeasures policymakers deployed to shelter the economy from them. With some distance, however, investors may come to view it as a year of two critical policy inflection points: the end of the Reagan fiscal era and the end of the Volcker monetary era. The shifts could mark a watershed because Reagan’s and Volcker’s enduring influence helped power an investment golden age that has lasted for nearly 40 years. What comes next may not be so supportive for financial markets. Political history often unfolds in cycles even if their starting and ending dates are never as clear cut in real life as they are in dissertations. Broadly, the FDR administration kicked off the New Deal era, a 48-year period of increased government involvement in daily life via the introduction and steady expansion of the social safety net, broadened regulatory powers and sweeping worker protections. It was followed by the 40-year Reagan era, with a continuous soundtrack of limited government rhetoric made manifest in policies that sought to curtail the spread of social welfare programs, deregulate commercial activity, devolve power to state and local government units and the private sector and push back against unions. The Obama and Trump administrations challenged different aspects of Reaganism, but the 2020 election cycle finally toppled it. Ordinarily, that might only matter to historians and political scientists, but the Reagan era coincided with a fantastic run in financial markets. So, too, did the inflation vigilance that lasted long after Paul Volcker’s 1979-1987 tenure at the helm of the Federal Reserve, which drove an extended period of disinflation, falling interest rates and rising central bank credibility. Our focus here is on fiscal policy, and we touch on monetary policy only to note that last summer’s revision of the Fed’s statement of long-run monetary policy goals shut the door on the Volcker era. The end of both eras could mark an inflection point in the trajectory of asset returns. The Happy Warrior The nine most terrifying words in the English language are, “I’m from the government, and I’m here to help.”5 Chart II-1After The Recession, Reagan Was A Hit
After The Recession, Reagan Was A Hit
After The Recession, Reagan Was A Hit
Ronald Reagan held his conservative views with the zeal of the convert that he was.6 Those views were probably to the right of much of the electorate, but his personal appeal was strong enough to make them palatable to a sizable majority (Chart II-1). Substitute “left” for “right” and the sentiment just as easily sums up FDR’s ability to get the New Deal off the ground. Personal magnetism played a big role in each era’s rise, with both men radiating relatability and optimism that imbued their sagging fellow citizens with a sense of comfort and security that made them willing to try something very different. 1980 was hardly 1932 on the distress scale, but America was in a funk after the upheaval of the sixties, the humiliating end to Vietnam, Watergate, stagflation and a term and a half of uninspiring and ineffectual presidential leadership. Enter the Great Communicator, whose initial weekly radio address evoked the FDR of the Fireside Chats – jovial, resolute and confident, with palpable can-do energy – buffed to a shine by a professional actor and broadcaster whose vocal inflections hit every mark.7 The Gipper,8 with his avuncular bearing, physical robustness and ever-present twinkle in his eye, was just what the country needed to feel better about itself. Reaganomics 101 Government does not tax to get the money it needs; government always finds a need for the money it gets.9 President Reagan’s economic plan had three simple goals: cut taxes, tame government spending and reduce regulation. From the start of his entry into politics in the mid-sixties, Reagan cast himself as a defender of hard-working Americans’ right to keep more of the fruits of their labor from a grasping federal government seeking funding for wasteful, poorly designed programs. He harbored an intense animus for LBJ’s Great Society, which extended the reach of the federal government in ways that he characterized as a drag on initiative, accomplishment and freedom, no matter how well intentioned it may have been. That message hung a historic loss on Barry Goldwater in 1964 when inflation was somnolent but it proved to be far more persuasive after the runaway inflation of the seventies exposed the perils of excessive government (Chart II-2). Chart II-2Inflation Rises When The Labor Market Heats Up
Inflation Rises When The Labor Market Heats Up
Inflation Rises When The Labor Market Heats Up
As the Reagan Foundation website describes the impact of his presidency’s economic policies, “Millions … were able to keep more of the money for which they worked so hard. Families could reliably plan a budget and pay their bills. The seemingly insatiable Federal government was on a much-needed diet. And businesses and individual entrepreneurs were no longer hassled by their government, or paralyzed by burdensome and unnecessary regulations every time they wanted to expand.” “In a phrase, the American dream had been restored.” The Enduring Reach Of Reaganomics I’m not in favor of abolishing the government. I just want to shrink it down to the size where we can drown it in the bathtub. – Grover Norquist Though President-Elect Clinton bridled at limited government’s inherent restrictions, bursting out during a transition briefing, “You mean to tell me that the success of the economic program and my re-election hinges on the Federal Reserve and a bunch of f***ing bond traders?” his administration largely observed them. This was especially true after the drubbing Democrats endured in the 1994 midterms, when the Republicans captured their first House majority in four decades behind the Contract with America, a skillfully packaged legislative agenda explicitly founded on Reagan principles. Humbled in the face of Republican majorities in both houses of Congress, and hemmed in by roving bands of bond vigilantes, Clinton was forced to tack to the center. James Carville, a leading architect of Clinton’s 1992 victory, captured the moment, saying, “I used to think that if there was reincarnation, I wanted to come back as the president or the pope or … a .400 … hitter. But now I would like to come back as the bond market. You can intimidate everybody.” Reagan’s legacy informed the Bush administration’s sweeping tax cuts (and its push to privatize social security), and forced the Obama administration to tread carefully with the stimulus package it devised to combat the Great Recession. Although the administration’s economic advisors considered the $787 billion (5%-of-peak-GDP) bill insufficient, political staffers carried the day and the price tag was kept below $800 billion to appease the three Republican senators whose votes were required to pass it. Even with the economy in its worst state since the Depression, the Obama administration had to acquiesce to Reaganite budget pieties if it wanted any stimulus bill at all. Its leash got shorter after it agreed with House Republicans to “sequester” excess spending under the Budget Control Act of 2011. On the Republican side of the aisle, Grover Norquist, who claims to have founded Americans for Tax Reform (ATR) at Reagan’s request, enforced legislative fealty to the no-new-tax mantra. ATR, which opposes all tax increases as a matter of principle, corrals legislators with the Taxpayer Protection Pledge, “commit[ting] them to oppose any effort to increase income taxes on individuals and businesses.” ATR’s influence has waned since its 2012 peak, when 95% of Republicans in Congress had signed the pledge, and Norquist no longer strikes fear in the hearts of Republicans inclined to waver on taxes. His declining influence is testament to Reaganism’s success on the one hand (the tax burden has already been reduced) and the fading appeal of its signature fiscal restraint on the other. Did Government Really Shrink? When the legend becomes fact, print the legend. – The Man Who Shot Liberty Valance For all of its denunciations of government spending, the Reagan administration ran up the largest expansionary budget deficits (as a share of GDP) of any postwar administration until the global financial crisis (Chart II-3). Although it aggressively slashed non-defense discretionary spending, it couldn’t cut enough to offset the Pentagon’s voracious appetite. The Reagan deficits were not all bad: increased defense spending hastened the end of the Cold War, so they were in a sense an investment that paid off in the form of the ‘90s peace dividend and the budget surpluses it engendered. Chart II-3Cutting The Federal Deficit Is Harder Than It Seems
Cutting The Federal Deficit Is Harder Than It Seems
Cutting The Federal Deficit Is Harder Than It Seems
Nonetheless, the Reagan experience reveals the uncomfortable truth that there is little scope for any administration or Congressional session to cut federal spending. Mandatory entitlement spending on social security, Medicare and Medicaid constitutes the bulk of federal expenditures (Chart II-4) and they are very popular with the electorate, as the Trump campaign shrewdly recognized in the 2016 Republican primaries (Table II-1). Discretionary spending, especially ex-defense, is a drop in the bucket, thanks largely to a Reagan administration that already cut it to the bone (Chart II-5). Chart II-4The Relentless Rise In Mandatory Spending ...
The Relentless Rise In Mandatory Spending ...
The Relentless Rise In Mandatory Spending ...
Chart II-5Overwhlems Any Plausible Discretionary Cuts
Overwhlems Any Plausible Discretionary Cuts
Overwhlems Any Plausible Discretionary Cuts
Table II-1How Trump Broke Republican Orthodoxy On Entitlement Spending
March 2021
March 2021
The Reagan tax cuts therefore accomplished the easy part of the “starve the beast” strategy but his administration failed to make commensurate cuts in outlays (Chart II-6). If overall spending wasn’t cut amidst oppressive inflation, while the Great Communicator was in the Oval Office to make the case for it to a considerably more fiscally conservative electorate, there is no chance that it will be cut this decade. As our Geopolitical Strategy service has flagged for several years, the median US voter has moved to the left on economic policy. Reagan-era fiscal conservatism has gone the way of iconic eighties features like synthesizers, leg warmers and big hair, even if it had one last gasp in the form of the post-crisis “Tea Party” and Obama’s compromise on budget controls. Chart II-6Grover Norquist Is Going To Need A Bigger Bathtub
Grover Norquist Is Going To Need A Bigger Bathtub
Grover Norquist Is Going To Need A Bigger Bathtub
Do Republicans Still Want The Reagan Mantle? Chart II-7“Limited Government” Falling Out Of Fashion
March 2021
March 2021
Reaganism is dead, killed by a decided shift in broad American public opinion, and within the Republican and Democratic parties themselves. Americans are just as divided today as they were in Reagan’s era about the size of the government but the trend since the late 1990s is plainly in favor of bigger government (Chart II-7). Recent developments, including the 2020 election, reinforce our conviction that trend will not reverse any time soon. The Republicans are the natural heirs of Reagan’s legacy. Much of President Trump’s appeal to conservatives lay in his successful self-branding as the new Reagan. Though he lacked the Gipper’s charisma and affability, his unapologetic assertion of American exceptionalism rekindled some of the glow of Morning-in-America confidence. Following the outsider trail blazed by Reagan, he lambasted the Washington establishment and promised to slash bureaucracy, deregulate the economy and shake things up. Trump’s signature legislative accomplishment was the largest tax reform since Reagan’s in 1986. He oversaw defense spending increases to take on China, which he all but named the new “evil empire.”10 Like Reagan, he was willing to weather criticism for face-to-face meetings with rival nations’ dictators. Even his trade protectionism had more in common with the Reagan administration than is widely recognized.11 Chart II-8Reagan’s Amnesty On Immigration
March 2021
March 2021
But major differences in the two presidents’ policy portfolios underline the erosion of the Reagan legacy’s hold. President Trump outflanked his Republican competitors for the 2016 nomination by running against cutting government spending – he was the only candidate who opposed entitlement reform. His signature proposal was to stem immigration by means of a Mexican border wall. While Reagan had sought to crack down on illegal immigration, he pursued a compromise approach and granted amnesty to 2.9 million illegal immigrants living in America to pass the Immigration Reform and Control Act of 1986, sparing businesses from having to scramble to replace them (Chart II-8). While Reagan curtailed non-defense spending, Trump signed budget-busting bills with relish, even before the COVID pandemic necessitated emergency deficit spending. Trump tried to use the power of government to intervene in the economy and alienated the business community, which revered Reagan, with his scattershot trade war. Trump’s greater hawkishness on immigration and trade and his permissiveness on fiscal spending differentiated him from Reagan orthodoxy and signaled a more populist Republican Party. Chart II-9Trump Could Start Third Party, Give Democrats A Decade-Plus Ascendancy
March 2021
March 2021
More fundamentally, Trump represents a new strain of Republican that is at odds with the party’s traditional support for big business and disdain for big government. If he leads that strain to take on the party establishment by challenging moderate Republicans in primary elections and insisting on running as the party’s next presidential candidate, the GOP will be swimming upstream in the 2022 and 2024 elections. It is too soon to make predictions about either of these elections other than to say that Trump is capable of splitting the party in a way not seen since Ross Perot in the 1990s or Theodore Roosevelt in the early 1900s (Chart II-9).12 If he does so, the Democrats will remain firmly in charge and lingering Reaganist policies will be actively dismantled. Even if the party manages to preserve its fragile Trumpist/traditionalist coalition, it is hard to imagine it will recover its appetite for shrinking entitlements, siding against labor or following a laissez-faire approach to corporate conduct and combinations. Republicans will pay lip service to fiscal restraint but Trump’s demonstration that austerity does not win votes will lead them to downplay spending cuts and entitlement reform as policy priorities – at least until inflation again becomes a popular grievance (Chart II-10). Republicans will also fail to gain traction with voters if they campaign merely on restoring the Trump tax cuts after Biden’s likely partial repeal of them. Support for the Tax Cut and Jobs Act hardly reached 40% for the general public and 30% for independents and it is well known that the tax reform did little to help Republicans in the 2018 midterm elections, when Democrats took the House (Chart II-11). Chart II-10Republicans Have Many Priorities Above Budget Deficits
March 2021
March 2021
Chart II-11Trump Tax Cuts Were Never Very Popular
March 2021
March 2021
On immigration the Republican Party will follow Trump and refuse amnesty. Immigration levels are elevated and Biden’s lax approach to the border, combined with a looming growth disparity with Latin America, will generate new waves of incomers and provoke a Republican backlash. On trade and foreign policy, Republicans will follow a synthesis of Reagan and Trump in pursuing a cold war with China. The Chinese economy is set to surpass the American economy by the year 2028 and is already bigger in purchasing power parity terms (Chart II-12). The Chinese administration is becoming more oppressive at home, more closed to liberal and western ideas, more focused on import substitution, and more technologically ambitious. The Chinese threat will escalate in the coming decade and the Republican Party will present itself as the anti-communist party by proposing a major military-industrial build-up. Yet it is far from assured that the Democrats will be soft on China, which is to say that they will not be able to cut defense spending substantially. Chart II-12China Is the New "Evil Empire" For GOP
China Is the New "Evil Empire" For GOP
China Is the New "Evil Empire" For GOP
Will Biden Take Up The Cause? One might ask if the Biden administration might seek to adopt some elements of the Reagan program. President Biden is among the last of the pro-market Democrats who emerged in the wake of the Reagan revolution. Those “third-way” Democrats thrived in the 1990s by accommodating themselves to Reagan’s free-market message while maintaining there was a place for a larger federal role in certain aspects of the economy and society. The 2020 election demonstrated that the Democrats’ political base is larger than the Republicans’ and third-way policies could be a way to make further inroads with affluent suburbanites who helped deliver Georgia and Virginia. Alas, the answer appears to be no. The Democrats’ base increasingly abhors Reagan-era economic and social policies, and the country’s future demographic changes reinforce the party’s current, progressive trajectory. That means fiery younger Democrats don’t have to compromise their principles with third-way policies when they can just wait for Texas to turn blue. Chart II-13Democrats Look To New Deal, Eschew ‘Third Way’
March 2021
March 2021
Biden has only been in office for one month but a rule of thumb is that his party will pull him further to the left the longer Republicans remain divided and ineffective. His cabinet appointments have been center-left, not far-left, though his executive orders have catered to the far-left, particularly on immigration. In order to pass his two major legislative proposals through an evenly split Senate he must appeal to Democratic moderates, as every vote in the party will be needed to get the FY2021 and FY2022 budget reconciliation bills across the line, with Vice President Kamala Harris acting as the Senate tie breaker. Nevertheless his agenda still highlights that the twenty-first century Democrats are taking a page out of the FDR playbook and unabashedly promoting big government solutions (Chart II-13). Biden’s $1.9 trillion American Rescue Plan is not only directed at emergency pandemic relief but also aims to shore up state and local finances, education, subsidized housing, and child care. His health care proposals include a government-provided insurance option (originally struck from the Affordable Care Act to secure its passage in 2010) and a role for Medicare in negotiating drug prices. And his infrastructure plan is likely to provide cover for a more ambitious set of green energy projects that will initiate the Democratic Party’s next big policy pursuit after health care: environmentalism. The takeaway is not that Biden’s administration is necessarily radical – he eschews government-administered health care and is only proposing a partial reversal of Trump’s tax cuts – but rather that his party has taken a decisive turn away from the “third-way” pragmatism that defined his generation of Democrats in favor of a return to the “Old-Left” and pro-labor policies of the New Deal era (Chart II-14). The party has veered to the left in reaction to the Iraq War, the financial crisis, and Trumpism. Vice President Harris, Biden’s presumptive heir, had the second-most progressive voting record during her time in the Senate and would undoubtedly install a more progressive cabinet. Table II-2 shows her voting record alongside other senators who ran against Biden in the Democratic primary election. All of them except perhaps Senator Amy Klobuchar stood to his left on the policy spectrum. Chart II-14Democrats Eschew Budget Constraints
March 2021
March 2021
Fundamentally the American electorate is becoming more open to a larger role for the government in the economy and society. While voters almost always prioritize the economy and jobs, policy preferences have changed. The morass of excessive inflation, deficits, taxation, regulation, strikes and business inefficiencies that gave rise to the Reagan movement is not remembered as ancient history – it is not even remembered. The problems of slow growth, inadequate health and education, racial injustice, creaky public services, and stagnant wages are by far the more prevalent concerns – and they require more, not less, spending and government involvement (Chart II-15). Insofar as voters worry about foreign threats they focus on the China challenge, where Biden will be forced to adopt some of Trump’s approach. Table II-2Harris Stood To The Left Of Democratic Senators
March 2021
March 2021
Chart II-15Public Concern For Economy Means Greater Government Help
March 2021
March 2021
When inflation picks up in the coming years, voters will not reflexively ask for government to be pared back so that the economy becomes more efficient, as they did once they had a taste of Reagan’s medicine in the early 1980s. Rather, they will ask the government to step in to provide higher wages, indexation schemes, price caps, and assistance for labor, as is increasingly the case. The ruling party will be offering these options and the opposition Republicans will render themselves obsolete if they focus single-mindedly on austerity measures. Americans will have to experience a recession caused by inflation – i.e. stagflation – before they call for anything resembling Reagan again. The Post-Reagan Market Landscape Many investors and conservative economists were shocked13 that the Bernanke Fed’s mix of zero interest rates and massive securities purchases did not foster runaway inflation and destroy the dollar. They failed to anticipate that widespread private-sector deleveraging would put a lid on money creation (and that other major central banks would follow in the Fed’s ZIRP and QE footsteps). But a longer view of four decades of disinflation suggests another conclusion: Taking away the monetary punch bowl when the labor party gets going and pursuing limited-government fiscal policy can keep inflation pressures from gaining traction. Globalization, technology-enabled elimination of many lower-skilled white-collar functions and the hollowing out of the organized labor movement all helped as well, though they helped foment a revolt among a meaningful segment of the Republican rank-and-file against Reagan-style policies. The Volcker Fed set the tone for pre-emptive monetary tightening and subsequent FOMCs have reliably intervened to cool off the economy when the labor market begins heating up. The Phillips Curve may be out of favor with investors, but wage inflation only gathers steam when the unemployment rate falls below its natural level (Chart II-16), and the Fed did not allow negative unemployment gaps to persist for very long in the Volcker era. Without wage inflation putting more money in the hands of a broad cross-section of households with a fairly high marginal propensity to consume, it’s hard to get inflation in consumer prices. Chart II-16Taking The Punch Bowl Away From The Union Hall
Taking The Punch Bowl Away From The Union Hall
Taking The Punch Bowl Away From The Union Hall
The Fed took the cyclical wind from the labor market’s sails but the Reagan administration introduced a stiff secular headwind when it crushed PATCO, the air traffic controllers’ union, in 1981, marking an inflection point in the relationship between management and labor. That watershed event opened the door for employers to deploy much rougher tactics against unions than they had since before the New Deal.14 Reagan’s championing of free markets helped establish globalization as an economic policy that the third-way Clinton administration eagerly embraced with NAFTA and a campaign to admit China to the WTO. The latter coincided with a sharp decline in labor’s share of income (Chart II-17). Chart II-17Outsourcing Has Not Been Good For US Labor
Outsourcing Has Not Been Good For US Labor
Outsourcing Has Not Been Good For US Labor
The core Reagan tenets – limited government, favoring management over labor, globalization, sleepy anti-trust enforcement, reduced regulation and less progressive tax systems with lower rates – are all at risk of Biden administration rollbacks. While the easy monetary/tight fiscal combination promoted a rise in asset prices rather than consumer prices ever since the end of the global financial crisis, today’s easy monetary/easy fiscal could promote consumer price inflation and asset price deflation. We do not think inflation will be an issue in 2021 but we expect it will in the later years of Biden’s term. Ultimately, we expect massive fiscal accommodation will stoke inflation pressures and those pressures, abetted by a Fed which has pledged not to pre-emptively remove accommodation when the labor market tightens, will eventually bring about the end of the bull market in risk assets and the expansion. Investment Implications Business revered the Reagan administration and investors rightfully associate it with the four-decade bull market that began early in its first term. Biden is no wild-eyed liberal, but rolling back core Reagan-era tenets has the potential to roll back juicy Reagan-era returns. Only equities have the lengthy data series to allow a full comparison of Reagan-era returns with postwar New Deal-era returns (Table II-3), but the path of Treasury bond yields in the three-decade bear market that preceded the current four-decade bull market suggests that bonds generated little, if any, real returns in the pre-Reagan postwar period (Chart II-18). Stagnant precious metal returns point to tame Reagan-era inflation and downward pressure on input costs. Table II-3Annualized Real Market Returns Before And After Reagan
March 2021
March 2021
Chart II-18Bond Investors Loved Volcker And The Gipper
Bond Investors Loved Volcker And The Gipper
Bond Investors Loved Volcker And The Gipper
Owning the market is not likely to be as rewarding going forward as it was in the Reagan era. Active management may again have its day in the sun as the end of the Reagan tailwinds open up disparities between sectors, sub-industries and individual companies. Even short-sellers may experience a renaissance. We recommend that multi-asset investors underweight bonds, especially Treasuries. We expect the clamor for bigger government will contribute to a secular bear market that could rival the one that persisted from the fifties to the eighties. Within Treasury portfolios, we would maintain below-benchmark duration and favor TIPS over nominal bonds at least until the Fed signals that its campaign to re-anchor inflation expectations higher has achieved its goal. Gold and/or other precious metals merit a place in portfolios as a hedge against rising inflation and other real assets, from land to buildings to other resources, are worthy of consideration as well. BCA has been cautioning of a downward inflection in long-run financial asset returns for a few years, based on demanding valuations and a steadily shrinking scope for ongoing declines in inflation and interest rates. Mean reversion has been part of the thesis as well; trees simply don’t grow to the sky. Now that the curtain has fallen on the Volcker and Reagan eras, the inevitable downward inflection has received a catalyst. We remain constructive on risk assets over the next twelve months, but we expect that intermediate- and long-term returns will fall well short of their post-1982 pace going forward. Doug Peta, CFA Chief US Investment Strategist dougp@bcaresearch.com Matt Gertken Vice President Geopolitical Strategy mattg@bcaresearch.com III. Indicators And Reference Charts BCA’s equity indicators continue to demonstrate that US stocks are running hot. Our technical, valuation, and speculation indicators are very extended, and margin debt has soared since the S&P 500 bottomed last spring. With so little room for error, a near-term pullback in stock prices remains a significant risk. Our monetary indicator extended its downtrend, reflecting a diminished intensity of monetary support, but it remains above the boom/bust line. The upshot is that while the marginal stimulus provided by monetary policy is falling, the level of stimulus from easy monetary conditions remains significant. Forward equity earnings are pricing in a remarkably swift earnings recovery, but after a third consecutive quarter of double-digit earnings beats, the 2021 earnings outlook continues to gather momentum. Net revisions and positive earnings surprises remain near multi-decade highs. Among global equities, the US extended its modest underperformance after a decade of leading the pack. China continues to outperform, though at a slower rate since it became the first country to escape COVID-19’s grip, while emerging markets and Australia have also outperformed. Euro area stocks continue to lag, but we expect they will eventually take their place among the cyclical winners later this year. The US 10-Year Treasury yield surged in February, following through on January’s convincing break above its 200-day moving average. Our technical indicator shows that long-dated bonds are firmly in oversold territory, though they remain extremely expensive. Our valuation index points to higher yields over the cyclical investment horizon even if the rate of ascent eventually slows. The technical and valuation profile is similar for the US dollar. The greenback is technically oversold, even after its modest rally, but it remains expensive according to our models. If our base-case Goldilocks scenario unfolds globally this year, the counter-cyclical dollar should encounter a mild headwind. As with Treasuries, we expect valuation to trump technicals and see the USD continuing to trend lower over the full year. Commodity prices are surging across the board, ex-gold. Sentiment is bullish and speculative positioning in the CFTC’s 17-commodity aggregate grouping is at its post-GFC high, although it may have peaked for the time being. The move in commodities underscores the risk-on profile across financial markets and aligns with EM, Chinese and Australian equity outperformance. US and global LEIs remain in a solid uptrend. A peak in our global LEI (GLEI) diffusion index suggests that the pace of advance in the GLEI will moderate, but the diffusion index has not yet fallen to a level that would herald a meaningful decline in the LEI. EQUITIES: Chart III-1US Equity Indicators
US Equity Indicators
US Equity Indicators
Chart III-2Willingness To Pay For Risk
Willingness To Pay For Risk
Willingness To Pay For Risk
Chart III-3US Equity Sentiment Indicators
US Equity Sentiment Indicators
US Equity Sentiment Indicators
Chart III-4Revealed Preference Indicator
Revealed Preference Indicator
Revealed Preference Indicator
Chart III-5US Stock Market Valuation
US Stock Market Valuation
US Stock Market Valuation
Chart III-6US Earnings
US Earnings
US Earnings
Chart III-7Global Stock Market And Earnings: Relative Performance
Global Stock Market And Earnings: Relative Performance
Global Stock Market And Earnings: Relative Performance
Chart III-8Global Stock Market And Earnings: Relative Performance
Global Stock Market And Earnings: Relative Performance
Global Stock Market And Earnings: Relative Performance
FIXED INCOME: Chart III-9US Treasurys And Valuations
US Treasurys And Valuations
US Treasurys And Valuations
Chart III-10Yield Curve Slopes
Yield Curve Slopes
Yield Curve Slopes
Chart III-11Selected US Bond Yields
Selected US Bond Yields
Selected US Bond Yields
Chart III-1210-Year Treasury Yield Components
10-Year Treasury Yield Components
10-Year Treasury Yield Components
Chart III-13US Corporate Bonds And Health Monitor
US Corporate Bonds And Health Monitor
US Corporate Bonds And Health Monitor
Chart III-14Global Bonds: Developed Markets
Global Bonds: Developed Markets
Global Bonds: Developed Markets
Chart III-15Global Bonds: Emerging Markets
Global Bonds: Emerging Markets
Global Bonds: Emerging Markets
CURRENCIES: Chart III-16US Dollar And PPP
US Dollar And PPP
US Dollar And PPP
Chart III-17US Dollar And Indicator
US Dollar And Indicator
US Dollar And Indicator
Chart III-18US Dollar Fundamentals
US Dollar Fundamentals
US Dollar Fundamentals
Chart III-19Japanese Yen Technicals
Japanese Yen Technicals
Japanese Yen Technicals
Chart III-20Euro Technicals
Euro Technicals
Euro Technicals
Chart III-21Euro/Yen Technicals
Euro/Yen Technicals
Euro/Yen Technicals
Chart III-22Euro/Pound Technicals
Euro/Pound Technicals
Euro/Pound Technicals
COMMODITIES: Chart III-23Broad Commodity Indicators
Broad Commodity Indicators
Broad Commodity Indicators
Chart III-24Commodity Prices
Commodity Prices
Commodity Prices
Chart III-25Commodity Prices
Commodity Prices
Commodity Prices
Chart III-26Commodity Sentiment
Commodity Sentiment
Commodity Sentiment
Chart III-27Speculative Positioning
Speculative Positioning
Speculative Positioning
ECONOMY: Chart III-28US And Global Macro Backdrop
US And Global Macro Backdrop
US And Global Macro Backdrop
Chart III-29US Macro Snapshot
US Macro Snapshot
US Macro Snapshot
Chart III-30US Growth Outlook
US Growth Outlook
US Growth Outlook
Chart III-31US Cyclical Spending
US Cyclical Spending
US Cyclical Spending
Chart III-32US Labor Market
US Labor Market
US Labor Market
Chart III-33US Consumption
US Consumption
US Consumption
Chart III-34US Housing
US Housing
US Housing
Chart III-35US Debt And Deleveraging
US Debt And Deleveraging
US Debt And Deleveraging
Chart III-36US Financial Conditions
US Financial Conditions
US Financial Conditions
Chart III-37Global Economic Snapshot: Europe
Global Economic Snapshot: Europe
Global Economic Snapshot: Europe
Chart III-38Global Economic Snapshot: China
Global Economic Snapshot: China
Global Economic Snapshot: China
Doug Peta, CFA Chief US Investment Strategist Footnotes 1 Every single adult taxpayer with adjusted gross income (AGI) of $75,000 or less (and every married filing jointly taxpayer with AGI of $150,000 or less) was eligible for the full payments, and taxpayers with AGIs below $99,000 and $198,000, respectively, were eligible for partial payments. 2 Giles, Chris. “OECD warns governments to rethink constraints on public spending,” Financial Times, January 4, 2021. OECD warns governments to rethink constraints on public spending | Financial Times (ft.com) Accessed February 20, 2021. 3 International Monetary Fund (IMF). 2020. Fiscal Monitor: Policies for the Recovery. Washington, October. p. ix. 4 An additional 20 million households have received partial payments. 5 August 12, 1986 Press Conference News Conference | The Ronald Reagan Presidential Foundation & Institute (reaganfoundation.org), accessed February 4, 2021. Reagan makes the quip in his prepared opening remarks. 6 Reagan was a Democrat until he entered politics in his fifties. He claimed to have voted for FDR four times. 7 April 3, 1982 Radio Address President Reagan's Radio Address to the Nation on the Program for Economic Recovery - 4/3/82 - YouTube, accessed February 4, 2021. 8 As an actor, Reagan was perhaps best known for his portrayal of Notre Dame football legend George Gipp, who is immortalized in popular culture as the subject of the “win one for the Gipper” halftime speech. 9 July 22, 1981 White House Remarks to Visiting Editors and Broadcasters reaganfoundation.org, accessed February 8, 2021. 10 Reagan famously urged his followers, in reference to the USSR, “I urge you to beware the temptation of pride—the temptation of blithely declaring yourselves above it all and label both sides equally at fault, to ignore the facts of history and the aggressive impulses of an evil empire.” See his “Address to the National Association of Evangelicals,” March 8, 1983, voicesofdemocracy.umd.edu. 11 Robert Lighthizer, the Trump administration trade representative who directed its tariff battles, was a veteran of Reagan’s trade wars against Japan in the 1980s. 12 “Exclusive: The Trump Party? He still holds the loyalty of GOP voters,” USA Today, February 21, 2021, usatoday.com. 13 Open Letter to Ben Bernanke,” November 15, 2010. Open Letter to Ben Bernanke | Hoover Institution Accessed February 23, 2021. 14 Please see the following US Investment Strategy Special Reports, “Labor Strikes Back, Parts 1, 2 and 3,” dated January 13, January 20 and February 3, 2020, available at usis.bcaresearch.com.
Highlights Ronald Reagan cast a long shadow over the elected officials who followed him … : The influence of the economic policies associated with Ronald Reagan held such persistent sway that even the Clinton and Obama administrations had to follow their broad outlines. … just as Paul Volcker did over central bankers at home and abroad … : The Volcker Fed’s uncompromising resistance to the 1970s’ runaway inflation established the Fed’s credibility and enshrined a new global central banking orthodoxy. … but it appears their enduring influence may have finally run its course … : The pandemic overrode everything else in real time, but investors may ultimately view 2020 as the year in which Democrats broke away from post-Reagan orthodoxy and the Fed decided Volcker’s vigilance was no longer relevant. … to investors’ potential chagrin: If inflation, big government and organized labor come back from the dead, globalization loses ground, regulation expands, anti-trust enforcement regains some bite and tax rates rise and become more progressive, then the four-decade investment golden age that Reagan and Volcker helped launch may be on its last legs. Feature The pandemic dominated everything in real time in 2020, as investors scrambled to keep up with its disruptions and the countermeasures policymakers deployed to shelter the economy from them. With some distance, however, investors may come to view it as a year of two critical policy inflection points: the end of the Reagan fiscal era and the end of the Volcker monetary era. The shifts could mark a watershed because Reagan’s and Volcker’s enduring influence helped power an investment golden age that has lasted for nearly 40 years. What comes next may not be so supportive for financial markets. Political history often unfolds in cycles even if their starting and ending dates are never as clear cut in real life as they are in dissertations. Broadly, the FDR administration kicked off the New Deal era, a 48-year period of increased government involvement in daily life via the introduction and steady expansion of the social safety net, broadened regulatory powers and sweeping worker protections. It was followed by the 40-year Reagan era, with a continuous soundtrack of limited government rhetoric made manifest in policies that sought to curtail the spread of social welfare programs, deregulate commercial activity, devolve power to state and local government units and the private sector and push back against unions. The Obama and Trump administrations challenged different aspects of Reaganism, but the 2020 election cycle finally toppled it. Ordinarily, that might only matter to historians and political scientists, but the Reagan era coincided with a fantastic run in financial markets. So, too, did the inflation vigilance that lasted long after Paul Volcker’s 1979-1987 tenure at the helm of the Federal Reserve, which drove an extended period of disinflation, falling interest rates and rising central bank credibility. Our focus here is on fiscal policy, and we touch on monetary policy only to note that last summer’s revision of the Fed’s statement of long-run monetary policy goals shut the door on the Volcker era. The end of both eras could mark an inflection point in the trajectory of asset returns. The Happy Warrior The nine most terrifying words in the English language are, “I’m from the government, and I’m here to help.”1 Ronald Reagan held his conservative views with the zeal of the convert that he was.2 Those views were probably to the right of much of the electorate, but his personal appeal was strong enough to make them palatable to a sizable majority (Chart 1). Substitute “left” for “right” and the sentiment just as easily sums up FDR’s ability to get the New Deal off the ground. Personal magnetism played a big role in each era’s rise, with both men radiating relatability and optimism that imbued their sagging fellow citizens with a sense of comfort and security that made them willing to try something very different. Chart 1After The Recession, Reagan Was A Hit
After The Recession, Reagan Was A Hit
After The Recession, Reagan Was A Hit
1980 was hardly 1932 on the distress scale, but America was in a funk after the upheaval of the sixties, the humiliating end to Vietnam, Watergate, stagflation and a term and a half of uninspiring and ineffectual presidential leadership. Enter the Great Communicator, whose initial weekly radio address evoked the FDR of the Fireside Chats – jovial, resolute and confident, with palpable can-do energy – buffed to a shine by a professional actor and broadcaster whose vocal inflections hit every mark.3 The Gipper,4 with his avuncular bearing, physical robustness and ever-present twinkle in his eye, was just what the country needed to feel better about itself. Reaganomics 101 Government does not tax to get the money it needs; government always finds a need for the money it gets.5 President Reagan’s economic plan had three simple goals: cut taxes, tame government spending and reduce regulation. From the start of his entry into politics in the mid-sixties, Reagan cast himself as a defender of hard-working Americans’ right to keep more of the fruits of their labor from a grasping federal government seeking funding for wasteful, poorly designed programs. He harbored an intense animus for LBJ’s Great Society, which extended the reach of the federal government in ways that he characterized as a drag on initiative, accomplishment and freedom, no matter how well intentioned it may have been. That message hung a historic loss on Barry Goldwater in 1964 when inflation was somnolent but it proved to be far more persuasive after the runaway inflation of the seventies exposed the perils of excessive government (Chart 2). Chart 2Inflation Rises When The Labor Market Heats Up
Inflation Rises When The Labor Market Heats Up
Inflation Rises When The Labor Market Heats Up
As the Reagan Foundation website describes the impact of his presidency’s economic policies, “Millions … were able to keep more of the money for which they worked so hard. Families could reliably plan a budget and pay their bills. The seemingly insatiable Federal government was on a much-needed diet. And businesses and individual entrepreneurs were no longer hassled by their government, or paralyzed by burdensome and unnecessary regulations every time they wanted to expand.” “In a phrase, the American dream had been restored.” The Enduring Reach Of Reaganomics I’m not in favor of abolishing the government. I just want to shrink it down to the size where we can drown it in the bathtub. – Grover Norquist Though President-Elect Clinton bridled at limited government’s inherent restrictions, bursting out during a transition briefing, “You mean to tell me that the success of the economic program and my re-election hinges on the Federal Reserve and a bunch of f***ing bond traders?” his administration largely observed them. This was especially true after the drubbing Democrats endured in the 1994 midterms, when the Republicans captured their first House majority in four decades behind the Contract with America, a skillfully packaged legislative agenda explicitly founded on Reagan principles. Humbled in the face of Republican majorities in both houses of Congress, and hemmed in by roving bands of bond vigilantes, Clinton was forced to tack to the center. James Carville, a leading architect of Clinton’s 1992 victory, captured the moment, saying, “I used to think that if there was reincarnation, I wanted to come back as the president or the pope or … a .400 … hitter. But now I would like to come back as the bond market. You can intimidate everybody.” Reagan’s legacy informed the Bush administration’s sweeping tax cuts (and its push to privatize social security), and forced the Obama administration to tread carefully with the stimulus package it devised to combat the Great Recession. Although the administration’s economic advisors considered the $787 billion (5%-of-peak-GDP) bill insufficient, political staffers carried the day and the price tag was kept below $800 billion to appease the three Republican senators whose votes were required to pass it. Even with the economy in its worst state since the Depression, the Obama administration had to acquiesce to Reaganite budget pieties if it wanted any stimulus bill at all. Its leash got shorter after it agreed with House Republicans to “sequester” excess spending under the Budget Control Act of 2011. On the Republican side of the aisle, Grover Norquist, who claims to have founded Americans for Tax Reform (ATR) at Reagan’s request, enforced legislative fealty to the no-new-tax mantra. ATR, which opposes all tax increases as a matter of principle, corrals legislators with the Taxpayer Protection Pledge, “commit[ting] them to oppose any effort to increase income taxes on individuals and businesses.” ATR’s influence has waned since its 2012 peak, when 95% of Republicans in Congress had signed the pledge, and Norquist no longer strikes fear in the hearts of Republicans inclined to waver on taxes. His declining influence is testament to Reaganism’s success on the one hand (the tax burden has already been reduced) and the fading appeal of its signature fiscal restraint on the other. Did Government Really Shrink? When the legend becomes fact, print the legend. – The Man Who Shot Liberty Valance For all of its denunciations of government spending, the Reagan administration ran up the largest expansionary budget deficits (as a share of GDP) of any postwar administration until the global financial crisis (Chart 3). Although it aggressively slashed non-defense discretionary spending, it couldn’t cut enough to offset the Pentagon’s voracious appetite. The Reagan deficits were not all bad: increased defense spending hastened the end of the Cold War, so they were in a sense an investment that paid off in the form of the ‘90s peace dividend and the budget surpluses it engendered. Chart 3Cutting The Federal Deficit Is Harder Than It Seems
Cutting The Federal Deficit Is Harder Than It Seems
Cutting The Federal Deficit Is Harder Than It Seems
Nonetheless, the Reagan experience reveals the uncomfortable truth that there is little scope for any administration or Congressional session to cut federal spending. Mandatory entitlement spending on social security, Medicare and Medicaid constitutes the bulk of federal expenditures (Chart 4) and they are very popular with the electorate, as the Trump campaign shrewdly recognized in the 2016 Republican primaries (Table 1). Discretionary spending, especially ex-defense, is a drop in the bucket, thanks largely to a Reagan administration that already cut it to the bone (Chart 5). Chart 4The Relentless Rise In Mandatory Spending ...
The Relentless Rise In Mandatory Spending ...
The Relentless Rise In Mandatory Spending ...
Chart 5Overwhlems Any Plausible Discretionary Cuts
Overwhlems Any Plausible Discretionary Cuts
Overwhlems Any Plausible Discretionary Cuts
Table 1How Trump Broke Republican Orthodoxy On Entitlement Spending
Requiem For Volcker And The Gipper
Requiem For Volcker And The Gipper
The Reagan tax cuts therefore accomplished the easy part of the “starve the beast” strategy but his administration failed to make commensurate cuts in outlays (Chart 6). If overall spending wasn’t cut amidst oppressive inflation, while the Great Communicator was in the Oval Office to make the case for it to a considerably more fiscally conservative electorate, there is no chance that it will be cut this decade. As our Geopolitical Strategy service has flagged for several years, the median US voter has moved to the left on economic policy. Reagan-era fiscal conservatism has gone the way of iconic eighties features like synthesizers, leg warmers and big hair, even if it had one last gasp in the form of the post-crisis “Tea Party” and Obama’s compromise on budget controls. Chart 6Grover Norquist Is Going To Need A Bigger Bathtub
Grover Norquist Is Going To Need A Bigger Bathtub
Grover Norquist Is Going To Need A Bigger Bathtub
Do Republicans Still Want The Reagan Mantle? Reaganism is dead, killed by a decided shift in broad American public opinion, and within the Republican and Democratic parties themselves. Americans are just as divided today as they were in Reagan’s era about the size of the government but the trend since the late 1990s is plainly in favor of bigger government (Chart 7). Recent developments, including the 2020 election, reinforce our conviction that that trend will not reverse any time soon. The Republicans are the natural heirs of Reagan’s legacy. Much of President Trump’s appeal to conservatives lay in his successful self-branding as the new Reagan. Though he lacked the Gipper’s charisma and affability, his unapologetic assertion of American exceptionalism rekindled some of the glow of Morning-in-America confidence. Following the outsider trail blazed by Reagan, he lambasted the Washington establishment and promised to slash bureaucracy, deregulate the economy and shake things up. Chart 7"Limited Government" Falling Out Of Fashion
Requiem For Volcker And The Gipper
Requiem For Volcker And The Gipper
Trump’s signature legislative accomplishment was the largest tax reform since Reagan’s in 1986. He oversaw defense spending increases to take on China, which he all but named the new “evil empire.”6 Like Reagan, he was willing to weather criticism for face-to-face meetings with rival nations’ dictators. Even his trade protectionism had more in common with the Reagan administration than is widely recognized.7 But major differences in the two presidents’ policy portfolios underline the erosion of the Reagan legacy’s hold. President Trump outflanked his Republican competitors for the 2016 nomination by running against cutting government spending – he was the only candidate who opposed entitlement reform. His signature proposal was to stem immigration by means of a Mexican border wall. While Reagan had sought to crack down on illegal immigration, he pursued a compromise approach and granted amnesty to 2.9 million illegal immigrants living in America to pass the Immigration Reform and Control Act of 1986, sparing businesses from having to scramble to replace them (Chart 8). While Reagan curtailed non-defense spending, Trump signed budget-busting bills with relish, even before the COVID pandemic necessitated emergency deficit spending. Trump tried to use the power of government to intervene in the economy and alienated the business community, which revered Reagan, with his scattershot trade war. Trump’s greater hawkishness on immigration and trade and his permissiveness on fiscal spending differentiated him from Reagan orthodoxy and signaled a more populist Republican Party. More fundamentally, Trump represents a new strain of Republican that is at odds with the party’s traditional support for big business and disdain for big government. If he leads that strain to take on the party establishment by challenging moderate Republicans in primary elections and insisting on running as the party’s next presidential candidate, the GOP will be swimming upstream in the 2022 and 2024 elections. It is too soon to make predictions about either of these elections other than to say that Trump is capable of splitting the party in a way not seen since Ross Perot in the 1990s or Theodore Roosevelt in the early 1900s (Chart 9).8 If he does so, the Democrats will remain firmly in charge and lingering Reaganist policies will be actively dismantled. Chart 8Reagan’s Amnesty On Immigration
Requiem For Volcker And The Gipper
Requiem For Volcker And The Gipper
Chart 9Trump Could Start Third Party, Give Democrats A Decade-Plus Ascendancy
Requiem For Volcker And The Gipper
Requiem For Volcker And The Gipper
Even if the party manages to preserve its fragile Trumpist/traditionalist coalition, it is hard to imagine it will recover its appetite for shrinking entitlements, siding against labor or following a laissez-faire approach to corporate conduct and combinations. Republicans will pay lip service to fiscal restraint but Trump’s demonstration that austerity does not win votes will lead them to downplay spending cuts and entitlement reform as policy priorities – at least until inflation again becomes a popular grievance (Chart 10). Republicans will also fail to gain traction with voters if they campaign merely on restoring the Trump tax cuts after Biden’s likely partial repeal of them. Support for the Tax Cut and Jobs Act hardly reached 40% for the general public and 30% for independents and it is well known that the tax reform did little to help Republicans in the 2018 midterm elections, when Democrats took the House (Chart 11). Chart 10Republicans Have Many Priorities Above Budget Deficits
Requiem For Volcker And The Gipper
Requiem For Volcker And The Gipper
On immigration the Republican Party will follow Trump and refuse amnesty. Immigration levels are elevated and Biden’s lax approach to the border, combined with a looming growth disparity with Latin America, will generate new waves of incomers and provoke a Republican backlash. Chart 11Trump Tax Cuts Were Never Very Popular
Requiem For Volcker And The Gipper
Requiem For Volcker And The Gipper
On trade and foreign policy, Republicans will follow a synthesis of Reagan and Trump in pursuing a cold war with China. The Chinese economy is set to surpass the American economy by the year 2028 and is already bigger in purchasing power parity terms (Chart 12). The Chinese administration is becoming more oppressive at home, more closed to liberal and western ideas, more focused on import substitution, and more technologically ambitious. The Chinese threat will escalate in the coming decade and the Republican Party will present itself as the anti-communist party by proposing a major military-industrial build-up. Yet it is far from assured that the Democrats will be soft on China, which is to say that they will not be able to cut defense spending substantially. Chart 12China Is the New "Evil Empire" For GOP
China Is the New "Evil Empire" For GOP
China Is the New "Evil Empire" For GOP
Will Biden Take Up The Cause? One might ask if the Biden administration might seek to adopt some elements of the Reagan program. President Biden is among the last of the pro-market Democrats who emerged in the wake of the Reagan revolution. Those “third-way” Democrats thrived in the 1990s by accommodating themselves to Reagan’s free-market message while maintaining there was a place for a larger federal role in certain aspects of the economy and society. The 2020 election demonstrated that the Democrats’ political base is larger than the Republicans’ and third-way policies could be a way to make further inroads with affluent suburbanites who helped deliver Georgia and Virginia. Alas, the answer appears to be no. The Democrats’ base increasingly abhors Reagan-era economic and social policies, and the country’s future demographic changes reinforce the party’s current, progressive trajectory. That means fiery younger Democrats don’t have to compromise their principles with third-way policies when they can just wait for Texas to turn blue. Biden has only been in office for one month but a rule of thumb is that his party will pull him further to the left the longer Republicans remain divided and ineffective. His cabinet appointments have been center-left, not far-left, though his executive orders have catered to the far-left, particularly on immigration. In order to pass his two major legislative proposals through an evenly split Senate he must appeal to Democratic moderates, as every vote in the party will be needed to get the FY2021 and FY2022 budget reconciliation bills across the line, with Vice President Kamala Harris acting as the Senate tie breaker. Nevertheless his agenda still highlights that the twenty-first century Democrats are taking a page out of the FDR playbook and unabashedly promoting big government solutions (Chart 13). Chart 13Democrats Look To New Deal, Eschew 'Third Way'
Requiem For Volcker And The Gipper
Requiem For Volcker And The Gipper
Biden’s $1.9 trillion American Rescue Plan is not only directed at emergency pandemic relief but also aims to shore up state and local finances, education, subsidized housing, and child care. His health care proposals include a government-provided insurance option (originally struck from the Affordable Care Act to secure its passage in 2010) and a role for Medicare in negotiating drug prices. And his infrastructure plan is likely to provide cover for a more ambitious set of green energy projects that will initiate the Democratic Party’s next big policy pursuit after health care: environmentalism. The takeaway is not that Biden’s administration is necessarily radical – he eschews government-administered health care and is only proposing a partial reversal of Trump’s tax cuts – but rather that his party has taken a decisive turn away from the “third-way” pragmatism that defined his generation of Democrats in favor of a return to the “Old-Left” and pro-labor policies of the New Deal era (Chart 14). The party has veered to the left in reaction to the Iraq War, the financial crisis, and Trumpism. Vice President Harris, Biden’s presumptive heir, had the second-most progressive voting record during her time in the Senate and would undoubtedly install a more progressive cabinet. Table 2 shows her voting record alongside other senators who ran against Biden in the Democratic primary election. All of them except perhaps Senator Amy Klobuchar stood to his left on the policy spectrum. Chart 14Democrats Eschew Budget Constraints
Requiem For Volcker And The Gipper
Requiem For Volcker And The Gipper
Fundamentally the American electorate is becoming more open to a larger role for the government in the economy and society. While voters almost always prioritize the economy and jobs, policy preferences have changed. The morass of excessive inflation, deficits, taxation, regulation, strikes and business inefficiencies that gave rise to the Reagan movement is not remembered as ancient history – it is not even remembered. The problems of slow growth, inadequate health and education, racial injustice, creaky public services, and stagnant wages are by far the more prevalent concerns – and they require more, not less, spending and government involvement (Chart 15). Insofar as voters worry about foreign threats they focus on the China challenge, where Biden will be forced to adopt some of Trump’s approach. Table 2Harris Stood To The Left Of Democratic Senators
Requiem For Volcker And The Gipper
Requiem For Volcker And The Gipper
Chart 15Public Concern For Economy Means Greater Government Help
Requiem For Volcker And The Gipper
Requiem For Volcker And The Gipper
When inflation picks up in the coming years, voters will not reflexively ask for government to be pared back so that the economy becomes more efficient, as they did once they had a taste of Reagan’s medicine in the early 1980s. Rather, they will ask the government to step in to provide higher wages, indexation schemes, price caps, and assistance for labor, as is increasingly the case. The ruling party will be offering these options and the opposition Republicans will render themselves obsolete if they focus single-mindedly on austerity measures. Americans will have to experience a recession caused by inflation – i.e. stagflation – before they call for anything resembling Reagan again. The Post-Reagan Market Landscape Many investors and conservative economists were shocked9 that the Bernanke Fed’s mix of zero interest rates and massive securities purchases did not foster runaway inflation and destroy the dollar. They failed to anticipate that widespread private-sector deleveraging would put a lid on money creation (and that other major central banks would follow in the Fed’s ZIRP and QE footsteps). But a longer view of four decades of disinflation suggests another conclusion: Taking away the monetary punch bowl when the labor party gets going and pursuing limited-government fiscal policy can keep inflation pressures from gaining traction. Globalization, technology-enabled elimination of many lower-skilled white-collar functions and the hollowing out of the organized labor movement all helped as well, though they helped foment a revolt among a meaningful segment of the Republican rank-and-file against Reagan-style policies. The Volcker Fed set the tone for pre-emptive monetary tightening and subsequent FOMCs have reliably intervened to cool off the economy when the labor market begins heating up. The Phillips Curve may be out of favor with investors, but wage inflation only gathers steam when the unemployment rate falls below its natural level (Chart 16), and the Fed did not allow negative unemployment gaps to persist for very long in the Volcker era. Without wage inflation putting more money in the hands of a broad cross-section of households with a fairly high marginal propensity to consume, it’s hard to get inflation in consumer prices. Chart 16Taking The Punch Bowl Away From The Union Hall
Taking The Punch Bowl Away From The Union Hall
Taking The Punch Bowl Away From The Union Hall
The Fed took the cyclical wind from the labor market’s sails but the Reagan administration introduced a stiff secular headwind when it crushed PATCO, the air traffic controllers’ union, in 1981, marking an inflection point in the relationship between management and labor. That watershed event opened the door for employers to deploy much rougher tactics against unions than they had since before the New Deal.10 Reagan’s championing of free markets helped establish globalization as an economic policy that the third-way Clinton administration eagerly embraced with NAFTA and a campaign to admit China to the WTO. The latter coincided with a sharp decline in labor’s share of income (Chart 17). Chart 17Outsourcing Has Not Been Good For US Labor
Outsourcing Has Not Been Good For US Labor
Outsourcing Has Not Been Good For US Labor
The core Reagan tenets – limited government, favoring management over labor, globalization, sleepy anti-trust enforcement, reduced regulation and less progressive tax systems with lower rates – are all at risk of Biden administration rollbacks. While the easy monetary/tight fiscal combination promoted a rise in asset prices rather than consumer prices ever since the end of the global financial crisis, today’s easy monetary/easy fiscal could promote consumer price inflation and asset price deflation. We do not think inflation will be an issue in 2021 but we expect it will in the later years of Biden’s term. Ultimately, we expect massive fiscal accommodation will stoke inflation pressures and those pressures, abetted by a Fed which has pledged not to pre-emptively remove accommodation when the labor market tightens, will eventually bring about the end of the bull market in risk assets and the expansion. Investment Implications Business revered the Reagan administration and investors rightfully associate it with the four-decade bull market that began early in its first term. Biden is no wild-eyed liberal, but rolling back core Reagan-era tenets has the potential to roll back juicy Reagan-era returns. Only equities have the lengthy data series to allow a full comparison of Reagan-era returns with postwar New Deal-era returns (Table 3), but the path of Treasury bond yields in the three-decade bear market that preceded the current four-decade bull market suggests that bonds generated little, if any, real returns in the pre-Reagan postwar period (Chart 18). Stagnant precious metal returns point to tame Reagan-era inflation and downward pressure on input costs. Chart 18Bond Investors Loved Volcker And The Gipper
Bond Investors Loved Volcker And The Gipper
Bond Investors Loved Volcker And The Gipper
Table 3Annualized Real Market Returns Before And After Reagan
Requiem For Volcker And The Gipper
Requiem For Volcker And The Gipper
Owning the market is not likely to be as rewarding going forward as it was in the Reagan era. Active management may again have its day in the sun as the end of the Reagan tailwinds open up disparities between sectors, sub-industries and individual companies. Even short-sellers may experience a renaissance. We recommend that multi-asset investors underweight bonds, especially Treasuries. We expect the clamor for bigger government will contribute to a secular bear market that could rival the one that persisted from the fifties to the eighties. Within Treasury portfolios, we would maintain below-benchmark duration and favor TIPS over nominal bonds at least until the Fed signals that its campaign to re-anchor inflation expectations higher has achieved its goal. Gold and/or other precious metals merit a place in portfolios as a hedge against rising inflation and other real assets, from land to buildings to other resources, are worthy of consideration as well. BCA has been cautioning of a downward inflection in long-run financial asset returns for a few years, based on demanding valuations and a steadily shrinking scope for ongoing declines in inflation and interest rates. Mean reversion has been part of the thesis as well; trees simply don’t grow to the sky. Now that the curtain has fallen on the Volcker and Reagan eras, the inevitable downward inflection has received a catalyst. We remain constructive on risk assets over the next twelve months, but we expect that intermediate- and long-term returns will fall well short of their post-1982 pace going forward. Doug Peta, CFA Chief US Investment Strategist dougp@bcaresearch.com Matt Gertken Vice President Geopolitical Strategy mattg@bcaresearch.com Appendix Table A1APolitical Capital: White House And Congress
Requiem For Volcker And The Gipper
Requiem For Volcker And The Gipper
Table A1BPolitical Capital: Household And Business Sentiment
Requiem For Volcker And The Gipper
Requiem For Volcker And The Gipper
Table A1CPolitical Capital: The Economy And Markets
Requiem For Volcker And The Gipper
Requiem For Volcker And The Gipper
Table A2Political Risk Matrix
Requiem For Volcker And The Gipper
Requiem For Volcker And The Gipper
Table A3Political Capital Index
Requiem For Volcker And The Gipper
Requiem For Volcker And The Gipper
Table A4Biden’s Cabinet Position Appointments
Requiem For Volcker And The Gipper
Requiem For Volcker And The Gipper
Footnotes 1 August 12, 1986 Press Conference News Conference | The Ronald Reagan Presidential Foundation & Institute (reaganfoundation.org), accessed February 4, 2021. Reagan makes the quip in his prepared opening remarks. 2 Reagan was a Democrat until he entered politics in his fifties. He claimed to have voted for FDR four times. 3 April 3, 1982 Radio Address President Reagan's Radio Address to the Nation on the Program for Economic Recovery - 4/3/82 - YouTube, accessed February 4, 2021. 4 As an actor, Reagan was perhaps best known for his portrayal of Notre Dame football legend George Gipp, who is immortalized in popular culture as the subject of the “win one for the Gipper” halftime speech. 5 July 22, 1981 White House Remarks to Visiting Editors and Broadcasters reaganfoundation.org, accessed February 8, 2021. 6 Reagan famously urged his followers, in reference to the USSR, “I urge you to beware the temptation of pride—the temptation of blithely declaring yourselves above it all and label both sides equally at fault, to ignore the facts of history and the aggressive impulses of an evil empire.” See his “Address to the National Association of Evangelicals,” March 8, 1983, voicesofdemocracy.umd.edu. 7 Robert Lighthizer, the Trump administration trade representative who directed its tariff battles, was a veteran of Reagan’s trade wars against Japan in the 1980s. 8 “Exclusive: The Trump Party? He still holds the loyalty of GOP voters,” USA Today, February 21, 2021, usatoday.com. 9 Open Letter to Ben Bernanke,” November 15, 2010. Open Letter to Ben Bernanke | Hoover Institution Accessed February 23, 2021. 10 Please see the following US Investment Strategy Special Reports, “Labor Strikes Back, Parts 1, 2 and 3,” dated January 13, January 20 and February 3, 2020, available at usis.bcaresearch.com.
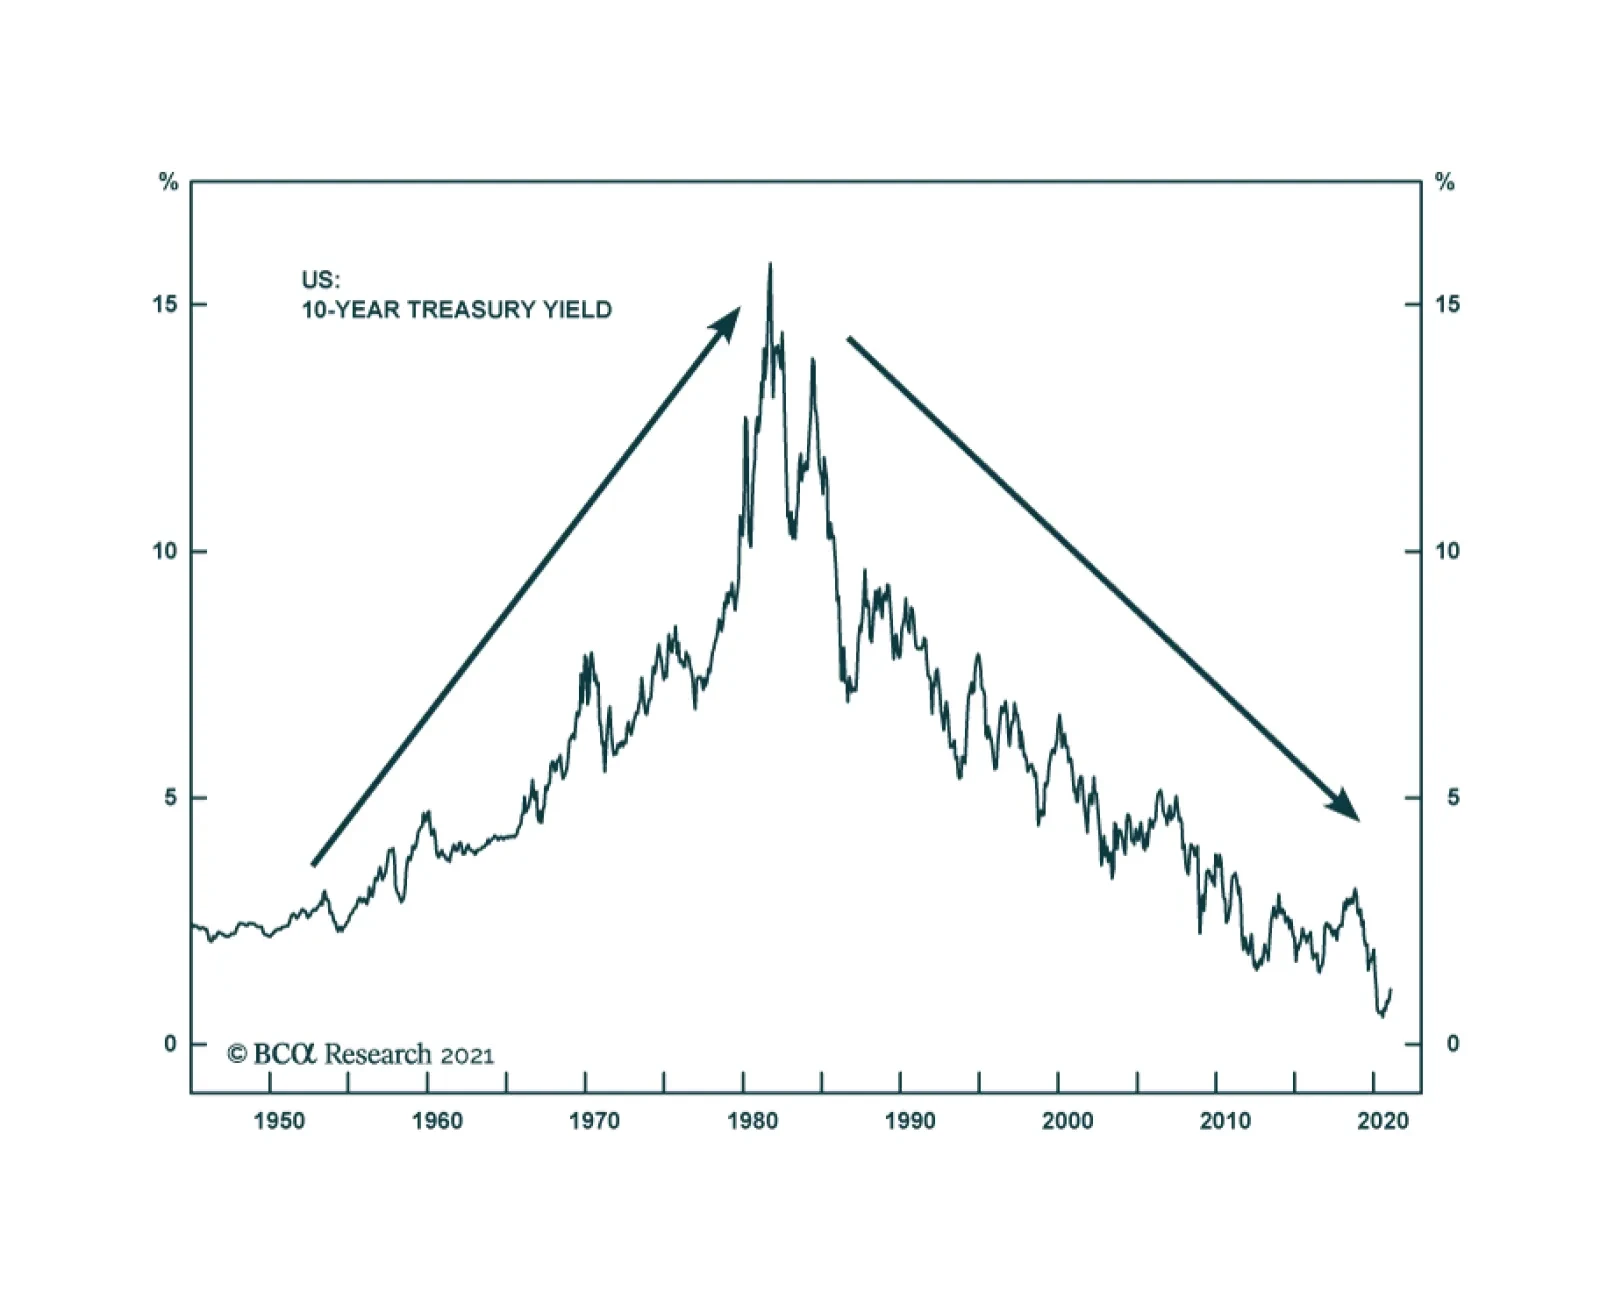
Reagan & Volcker’s Influence May Have Run Its Course
…
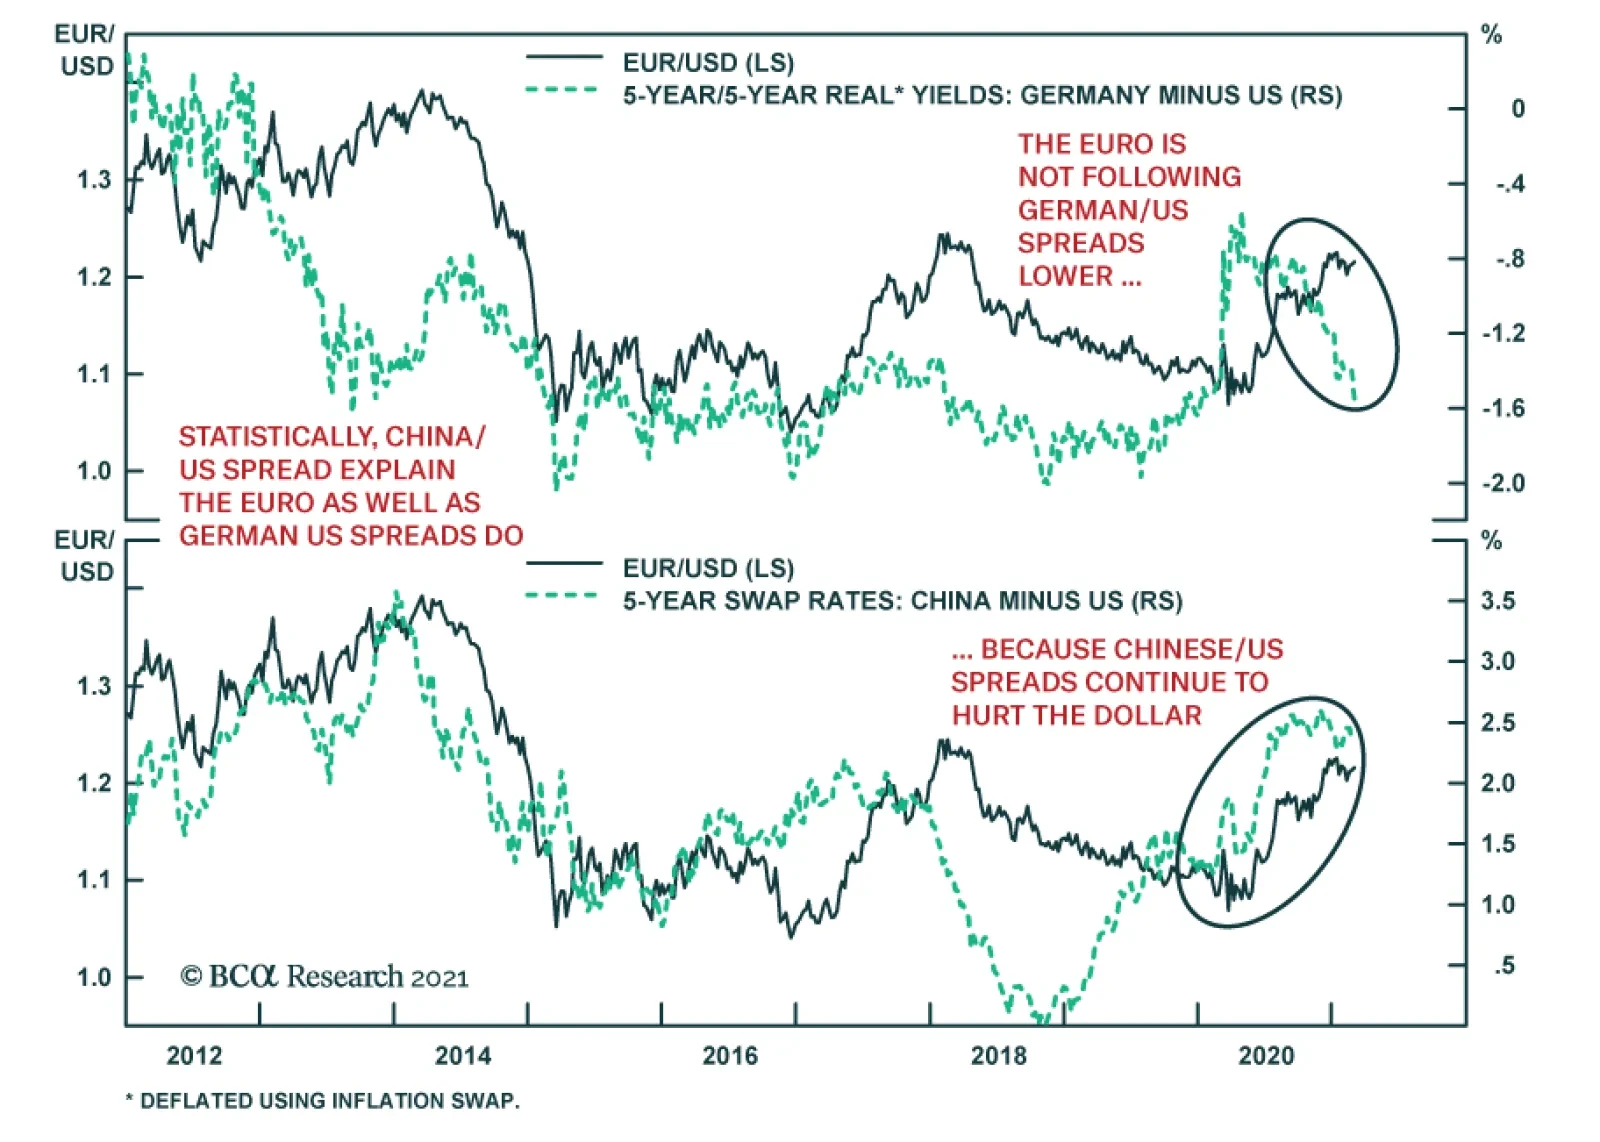
Despite large net-long speculative positions in EUR/USD and a substantial decline in German 5-year/5-year forward real rates relative to the US, the euro only softened marginally in the past two months. The euro’s resilience reflects the dollar’s…
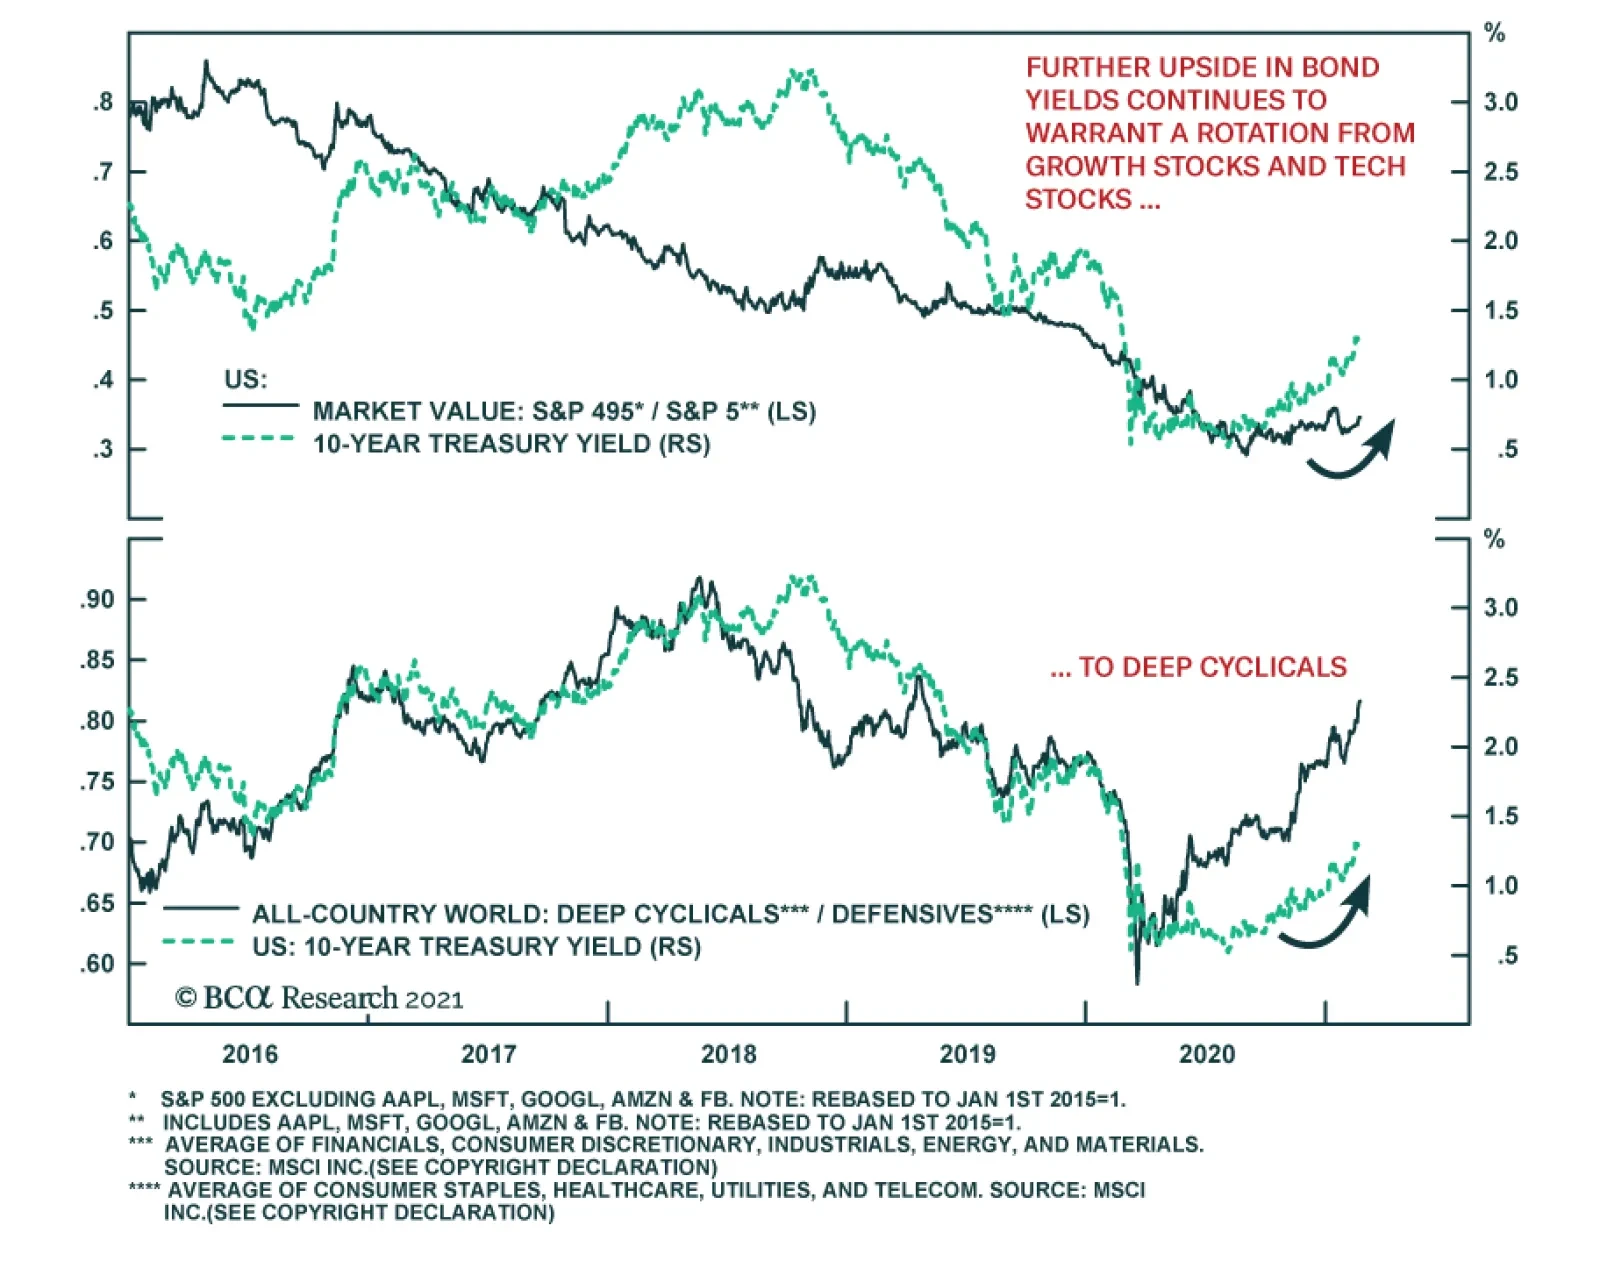
US Treasury yields are rising on both higher inflation expectations and climbing real rates. This is causing some indigestion in equity markets, especially the tech heavy NASDAQ. Jerome Powell’s continued resolve to maintain the Fed’s accommodative forward…
Crystalize Handsome Gains In The Deep Cyclicals/Defensives Portfolio Bent And Move To The Sidelines
Crystalize Handsome Gains In The Deep Cyclicals/Defensives Portfolio Bent And Move To The Sidelines
Yesterday our 2.5% rolling stop on the cyclicals vs. defensives ratio was triggered intraday and we are obeying this risk management metric we recently instituted to our portfolio, capitalizing 17% in gains since the July 27 2020 inception. This move pushes the ratio back down to neutral from previously overweight. To be clear, we do not recommend to flip positions i.e. to buy defensives at the expense of deep cyclicals, but given the plethora of warning signs from China that we highlighted in a recent Strategy Report on top of the relentless bond market sell off, the risk/reward trade-off of maintaining a cyclicals/defensives portfolio bent is no longer compelling. We will also be looking to reinstate a deep cyclical preference to our portfolio once the market offers a better entry point. Bottom Line: Obey the trailing stop and crystalize 17% in gains since last summer’s inception in the cyclicals vs. defensives portfolio bent, and downgrade it from overweight to neutral. Stay tuned.
Highlights US Treasuries: The uptrend in US Treasury yields has more room to run. However, the primary driver is starting to shift from increased inflation expectations to higher real yields amid greater confidence on the cyclical US economic outlook. Fed Outlook: It is still too soon to expect the Fed to begin signaling a move to turn less accommodative. However, rising realized US inflation amid dwindling spare economic capacity will make the Fed more nervous about its ultra-dovish policy stance in the second half of 2021. This will trigger a repricing of the future path of US interest rates embedded in the Treasury curve, but a Taper Tantrum repeat will be avoided. US Duration: Maintain below-benchmark US duration exposure, with the 10-year Treasury yield likely to soon test the 1.5% level. Feature Chart 1A Cyclical Rise In Global Bond Yields
A Cyclical Rise In Global Bond Yields
A Cyclical Rise In Global Bond Yields
The selloff in global government bond markets that began in the final few months of 2020 has gained momentum over the past few weeks. The benchmark 10-year US Treasury yield now sits at 1.37%, up 45bps so far in 2021, while the 30-year Treasury yield is at a six-year high of 2.22%. Yields are on the move in other countries, as well, with longer-maturity yields moving higher in the UK, Canada, Australia, New Zealand – even Germany, where the 30yr is now back in positive yield territory at 0.20%, a 34bp increase over the past month alone. The main reason for this move higher in yields can be summed up in one word: “optimism”. Economic growth expectations are improving according to investor surveys like the global ZEW, which is a reliable leading indicator of global bond yields (Chart 1). Falling global COVID-19 case numbers with rising vaccination rates, combined with very large US fiscal stimulus measures proposed by the Biden administration, have given investors hope that a return to some form of pre-pandemic economic normalcy can be achieved later this year. That means faster global growth and a risk of higher inflation, both of which must be reflected in higher bond yields. With the 10-year US Treasury yield now already in the middle of our 2021 year-end target range of 1.25-1.5%, and the macro backdrop remaining bond-bearish, we think it is timely to discuss the possibility that our yield target is too conservative Good Cyclical News Is Bad News For Treasuries The more recent move higher in US Treasury yields is notable because it has not been all about higher inflation breakevens, as has been the case since yields bottomed in mid-2020; real yields are finally starting to inch higher. The 30-year TIPS yield now sits in positive territory at +0.09%, ending a period of negative real yields dating back to the pandemic-induced market shock of last spring (Chart 2). Real yields across the rest of the TIPS curve are also starting to stir, even at the 2-year point, yet remain negative. Thus, the price action has supported one of US Bond Strategy’s Key Views for 2021 that the real yield curve will steepen.1 This uptick in US real yields has occurred alongside a string of positive developments on the US economy, suggesting that improved growth prospects – and what that means for future US inflation and Fed policy - are the key driver. Improving US domestic demand US economic data is not only showing resilience but gaining positive momentum. The preliminary US Markit composite PMI (combining both manufacturing and services industries) for February rose to the highest level in six years (Chart 3). Retail sales in January rose by an eye-popping 5.3% versus the month prior, due in no small part to the impact of government stimulus checks issued in the December pandemic relief package. The Conference Board measure of consumer confidence also picked up in January. The improving trend in US data so far in 2021 is pointing to some potentially big GDP numbers – the New York Fed’s “Nowcast” is calling for Q1 real GDP growth of 8.3%. Chart 2US Real Yields Starting Are Stirring
US Real Yields Starting Are Stirring
US Real Yields Starting Are Stirring
Chart 3US Growing Faster Than Lockdown-Stricken Europe
US Growing Faster Than Lockdown-Stricken Europe
US Growing Faster Than Lockdown-Stricken Europe
Vaccine rollout success After a sloppy start to the COVID-19 vaccination program in the US, the numbers are starting to improve with 19% of the US population having received at least one dose (Chart 4). Numbers of new cases and hospitalizations due to the virus have been collapsing as well, a sign that new lockdowns can be avoided, particularly in the larger US coastal cities. The vaccination numbers are even higher in the UK, where Prime Minister Boris Johnson this week revealed an ambitious plan to fully reopen the UK economy by June. While the pace of inoculation has been far slower within the euro area and other developed countries like Canada, developments in the US and UK are a hopeful sign that the vaccines can help free the world economy from the shackles of COVID-19. Chart 4The US & UK Leading The Way On The Vaccine Rollout
Optimism Reigns Supreme
Optimism Reigns Supreme
Even more fiscal stimulus Our US political strategists expect the Biden Administration’s $1.9 trillion pandemic relief package (the “American Rescue Plan”) to be passed by the US Senate in mid-March via a simple majority through a reconciliation bill.2 A second bill is likely to be passed this autumn or next spring with a much larger number, potentially up to $8 trillion worth of spending on infrastructure, health care, child care and green projects over the next ten years (Chart 5). These are big numbers for a $21 trillion US economy that will increasingly need less stimulus as lockdowns ease. Chart 5Biden’s Agenda AFTER The American Rescue Plan
Optimism Reigns Supreme
Optimism Reigns Supreme
Chart 6Welcome Back, Inflation?
Welcome Back, Inflation?
Welcome Back, Inflation?
Chart 7Price Pressures From US Manufacturing Bottlenecks
Price Pressures From US Manufacturing Bottlenecks
Price Pressures From US Manufacturing Bottlenecks
The combined impact of fiscal stimulus, accommodative monetary policy, easy financial conditions and fewer pandemic related economic restrictions has the potential to boost US economic growth quite sharply this year. If US GDP growth follows the Bloomberg consensus forecasts, the US output gap will be fully closed by Q1/2022 (Chart 6).That would be a much faster elimination of the spare capacity created by the 2020 recession compared to the post-2009 experience, raising the risk of upside inflation surprises later this year and in 2022. Signs of growing inflation pressures will make many FOMC members increasingly uncomfortable, even under the Fed’s new Average Inflation Targeting strategy where inflation overshoots will be more tolerated. Already, there are signs of sharply increased price pressures in the US economy stemming from factory bottlenecks (Chart 7). US manufacturers have had to deal with pandemic-induced disruptions to supply chains, in addition to the unexpectedly fast recovery of US consumer demand from last year’s recession that left companies short of inventory.3 The ISM Manufacturing Prices Paid index hit a 10-year high in January, fueled by surging commodity prices, which is already showing up in some inflation data. The US Producer Price Index for finished goods jumped 1.3% in January – the largest monthly surge since 2009 – boosting the annual inflation rate to 1.7% from 0.8% the prior month. Chart 8A Boost To US Inflation Coming Soon From Base Effects
A Boost To US Inflation Coming Soon From Base Effects
A Boost To US Inflation Coming Soon From Base Effects
Chart 9Additional Upside US Inflation Risks
Additional Upside US Inflation Risks
Additional Upside US Inflation Risks
Chart 10US Shelter Inflation Set To Bottom Out
US Shelter Inflation Set To Bottom Out
US Shelter Inflation Set To Bottom Out
A pickup in US annual inflation rates over the next few months was already essentially a done deal because of base effect comparisons versus the collapse in inflation during the 2020 COVID-19 recession (Chart 8). Additional inflation pressures stemming from factory bottlenecks could provide an additional lift to realized inflation rates. When looking at the main components of the US inflation data, there is scope for a broad-based pickup that goes beyond simple base effect moves. Core Goods CPI inflation is now rising at a 1.7% year-over-year rate, the highest since 2012, with more to come based on the acceleration of growth in US non-oil import prices (Chart 9). Core Services CPI inflation has plunged during the pandemic and is now growing at a 0.5% annual rate. As the US economy reopens from pandemic restrictions, services inflation should begin to recover and add to the rising trend of goods inflation. This will especially be true if the Shelter component of US inflation also begins to recover in response to a tightening demand/supply balance for US housing (Chart 10). Bottom Line: US Treasury yields are rising in response to positive upward momentum in US economic growth, the likelihood of some pickup in inflation over the next 6-12 months and, most importantly, shifting expectations that the Fed will turn less dovish later this year. Evaluating The Fed’s Next Moves Fed officials have continued to signal that they are not yet ready to consider any change to monetary policy settings or forward guidance on future rate moves. In his semi-annual testimony before US Congress this week, Fed Chair Jerome Powell reiterated that the pace of the Fed’s asset purchases would only begin to slow once “substantial progress” has been made towards the Fed’s inflation and unemployment objectives. Powell also stuck to his previous messaging that the Fed would “continue to clearly communicate our assessment of progress toward our goals well in advance of any change in the pace of purchases”.4 According to the New York Fed’s Primary Dealer and Market Participant surveys for January, however, the Fed is not expected to stay silent on the topic of tapering for much longer. According to the surveys, the Fed is expected to begin tapering its purchases of Treasuries and Agency MBS in the first quarter of 2022 (Chart 11). A full tapering to zero (net of rollovers of maturing debt) is expected by the first quarter of 2023. Clearly, bond traders and asset managers believe that US growth and inflation dynamics will both improve over the course of this year such that the Fed will have little choice but to begin the signaling of tapering sometime before the end of 2021. Chart 11Fed Surveys Expect A Full QE Tapering In 2022
Optimism Reigns Supreme
Optimism Reigns Supreme
The Fed has been a bit more transparent on the conditions that must be in place before rate hikes would begin. Labor market conditions must be consistent with full employment, while headline PCE inflation must reach at least 2% and be “on track” to moderately exceed that target for some time. On that front, markets believe these conditions will all be met by early 2023, based on pricing in the US overnight index swap (OIS) curve. The first 25bp rate hike is now priced to occur in February 2023 (Chart 12). This is a big shift from the start of the year, when Fed “liftoff” was expected to occur in October 2023. Thus, in a span of just six weeks, interest rate markets have pulled forward the timing of the first Fed rate hike by eight months. Liftoff would occur almost immediately after the Fed was done fully tapering asset purchases, based on the timetable laid out in the New York Fed surveys, although Fed officials have noted that rate hikes could begin before tapering is complete. Chart 12Pulling Forward The Timing Of Future Fed Rate Hikes
Pulling Forward The Timing Of Future Fed Rate Hikes
Pulling Forward The Timing Of Future Fed Rate Hikes
In our view, the timetable laid out in the New York Fed surveys and in the US OIS curve is not only plausible but probable. If the US economy does indeed print the 4-5% real GDP consensus growth forecasts during the second half of this year, with realized inflation approaching 2% as outlined above, then it will be very difficult for the Fed to justify the need to maintain the current pace of asset purchases. The Fed will want to avoid another 2013 Taper Tantrum by signaling less QE well in advance, to avoid triggering a spike in Treasury yields that could upset equity and credit markets or cause an unwelcome appreciation of the US dollar. However, the New York Fed surveys indicate that the bond market is well prepared for a 2022 taper, so the Fed only has to meet those expectations to prevent an unruly move in the Treasury market. That means the Fed will likely signal tapering toward the end of this year. Chart 13Markets Expect A Negative Real Fed Funds Rate
Optimism Reigns Supreme
Optimism Reigns Supreme
The Fed can maintain caution on signaling the timing of the first rate hike once tapering begins, based on how rapidly the US unemployment rate falls towards the Fed’s estimate of full employment. The median projection from the FOMC’s latest Summary of Economic Projections is for the US unemployment rate to fall to 4.2% in 2022 and 3.7% in 2023, compared to the median longer-run estimate of 4.1%. Thus, if the Fed sticks to current guidance on the employment conditions that must be in place before rate hikes can begin, then liftoff would occur sometime in late 2022 or early 2023 – not far off current market pricing – as long as US inflation is at or above the Fed’s 2% target at the same time. Once the Fed begins rate hikes, the pace of the hikes relative to inflation will determine how high real bond yields can rise. The 10-year TIPS yield has become highly correlated over the past few years to the level of the real fed funds rate (Chart 13). The current forward pricing in US OIS and CPI swap curves indicates that the markets are priced for a negative real fed funds rate until at least 2030. That is highly dovish pricing that will be revised higher once the Fed begins tapering and the market begins to debate the timing and pace of the Fed’s next rate hike cycle. Thus, it is highly unlikely that real Treasury yields will stay as low as implied by the forward curves over the next few years. Bottom Line: It is still too soon to expect the Fed to begin signaling a move to turn less accommodative. However, rising realized US inflation amid dwindling spare economic capacity will make the Fed more nervous about its ultra-dovish policy stance in the second half of 2021. This will trigger a repricing of the future path of US interest rates embedded in the Treasury curve, but a Taper Tantrum repeat will be avoided. How High Can Treasury Yields Go In The Current Move? Our preferred financial market-based cyclical bond indicators are still trending in a direction pointing to higher Treasury yields (Chart 14). The ratio of the industrial commodity prices (copper, most notably) to the price of gold, the relative equity market performance of US cyclicals (excluding technology) to defensives, and the total return of a basket of emerging market currencies are all consistent with a 10-year US Treasury yield above 1.5%. With regards to other valuation measures, the 5-year/5-year Treasury forward rate is already at or close to the top of the range of the longer-run fed funds rate projection from the New York Fed surveys (Chart 15). We have used that range to provide guidance as to how high Treasury yields can go during the current bond bear market. On this basis, longer maturity yields do not have much more upside unless survey respondents start to revise up their fed fund rate expectations, something that could easily happen if inflation surprises to the upside in the back-half of the year. Chart 14Cyclical Indicators Support Rising UST Yields
Cyclical Indicators Support Rising UST Yields
Cyclical Indicators Support Rising UST Yields
Chart 15A Rapid Move Higher In UST Forward Rates
A Rapid Move Higher In UST Forward Rates
A Rapid Move Higher In UST Forward Rates
Chart 16This UST Selloff Not Yet Stretched
This UST Selloff Not Yet Stretched
This UST Selloff Not Yet Stretched
Finally, the rising uptrend in longer-maturity Treasury yields is not overly stretched from a technical perspective (Chart 16). The 10-year yield is currently 55bps above its 200-day moving average, but yields got as high as 80-90bps above the moving average during the previous cyclical troughs in 2013 and 2016. The survey of fixed income client duration positioning from JP Morgan shows that bond investors are running duration exposure below benchmarks, but not yet at the bearish extremes seen in 2011, 2014 and 2017. A similar message can be seen in the Market Vane Treasury Sentiment indicator, which has been falling but remains well above recent cyclical lows. Summing it all up, it appears that the 1.5% ceiling of our 2021 10-year Treasury yield target range may prove to be too low. A move 20-30bps above that is quite possible, although those levels would only be sustainable if the Fed alters the forward guidance to pull forward the timing of rate hikes. We view that as a risk for 2022, not 2021. Bottom Line: Maintain below-benchmark US duration exposure, with the 10-year Treasury yield likely to soon test the 1.5% level. Robert Robis, CFA Chief Fixed Income Strategist rrobis@bcaresearch.com Footnotes 1 Please see BCA Research US Bond Strategy Special Report, "2011 Key Views: US Fixed Income", dated December 15, 2020, available at usbs.bcaresearch.com. 2 Please see BCA Research US Political Strategy Weekly Report, "Don’t Forget Biden’s Health Care Policy", dated February 17, 2021, available at usps.bcaresearch.com. 3https://www.wsj.com/articles/consumer-demand-snaps-back-factories-cant-keep-up-11614019305?page=1 4https://www.federalreserve.gov/newsevents/testimony/powell20210223a.htm Recommendations The GFIS Recommended Portfolio Vs. The Custom Benchmark Index
Optimism Reigns Supreme
Optimism Reigns Supreme
Duration Regional Allocation Spread Product Tactical Trades Yields & Returns Global Bond Yields Historical Returns
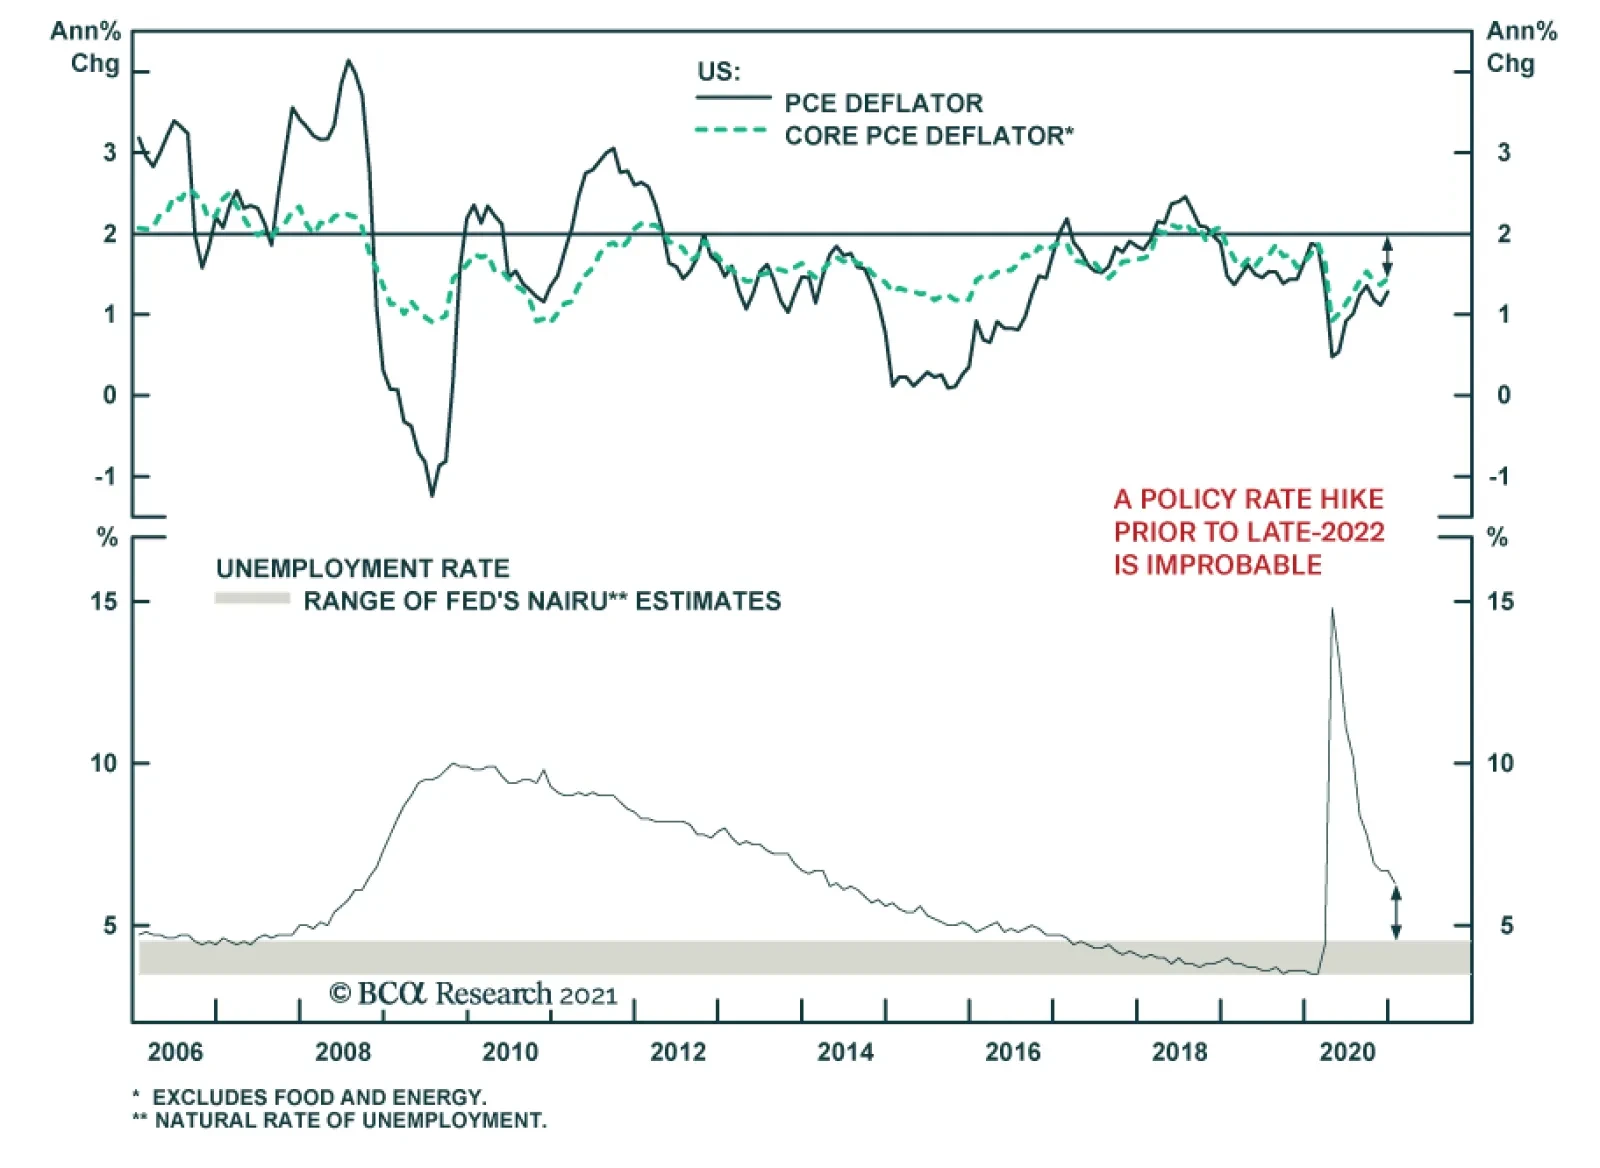
Jerome Powell’s testimony to the Senate Banking Committee on Tuesday appears to have somewhat calmed markets. The S&P 500 closed higher after falling for over a week amid fears around rising bond yields. Powell assured markets that the Fed remains…