United States

Highlights Both the US and Iran have the intention and capability of restoring the 2015 nuclear deal so investors should presume that an escalation in tensions will conclude with a new arrangement by August this year. However, the deal that the Iranians will offer, and that Biden can accept, may be unacceptable to the Israeli government, depending on Israel’s March 23 election. Moreover if a deal is not clinched by August, the timeframe will stretch out for most of Biden’s term and strategic tensions will escalate. Major Middle Eastern conflicts and crises tend to occur at the top of the business cycle when commodity prices are soaring rather than in the early stages where we stand today. But regional instability is possible regardless, especially if the US-Iran talks fall apart. Maintain gold and safe-haven assets as the Iranian question can lead to near-term escalation even if a deal is the end-game. Feature Geopolitics is far from investors’ concerns today, so it could create some nasty surprises. Two urgent tests await the Biden administration – China/Taiwan and Iran – and provide a basis for investors to add some safe-haven assets and hedges amidst an exuberant stock rally in which complacency is very high. The past week’s developments underscore these two tests. First, Chinese officials flagged that they would cut off rare earth elements to the US, implying that they would retaliate if Biden refuses to issue waivers for US export controls on semiconductors to China.1 Second, Biden spoke on the phone with Benjamin Netanyahu for the first time. The delay signaled Biden’s distance from Netanyahu and intention to normalize ties with Israel’s arch-enemy Iran. In both the Taiwan Strait and the Persian Gulf, the base case is not a full-fledged military conflict in the short run. This is positive for the bull market. But major incidents short of war are likely in the near term and major wars cannot be ruled out. In this report we update our view of the Iran risk. A long-term solution to the nuclear threat is not at hand, which means that Israel could in the worst-case take military action on its own. Meanwhile tensions and attacks will escalate until a deal is agreed. Iranian-backed forces in Iraq have already attacked a US base near Erbil, killing an American military contractor.2 In the event of an Iranian diplomatic crisis, the stock market selloff will be short. The macro backdrop is highly reflationary and investors will buy on the dips. In the event of full-scale war, the US dollar will suffer for a longer period. Oil Price A Boon But Middle East Regimes Still Vulnerable Chart 1Oil Recovery A Boon For Middle East Markets
Oil Recovery A Boon For Middle East Markets
Oil Recovery A Boon For Middle East Markets
Brent crude oil prices have rebounded to $65 per barrel on the global economic recovery. Middle Eastern equities are rallying in absolute terms, though not relative to other emerging markets (Chart 1). This underperformance is fitting given that the region suffers from poor governance, obstacles to doing business, resource dependency, insufficient technology and capital, and high levels of political and geopolitical risk. Non-oil producers and non-oil sectors in the Middle East have generally lagged the global economic recovery (Chart 2). The continuation of the recovery is essential to these regimes because most of them lack the fiscal room to provide large fiscal relief packages. The global average in fiscal support over the past year has been 7.4% but most Middle Eastern governments have provided 2% or less (Chart 3). Current account deficits have plagued oil producers since the commodity bust of 2014 and twin deficits have become a feature of the region, limiting the fiscal response to the global pandemic. Chart 2Middle East Economy Starts To Recover
Middle East Economy Starts To Recover
Middle East Economy Starts To Recover
Chart 3Middle Eastern Regimes Fiscally Constrained
Biden, Iran, Markets
Biden, Iran, Markets
The good news is that the recovery is likely to continue on the back of vaccines and fiscal pump-priming in all of the major economies. The bad news is that a black cloud hangs over the Middle East in the form of geopolitics. Given the underperformance of regional equities, global investors are not ignoring these risks – but they are a persistent factor until the Biden administration survives its initial tests in the region to create a new equilibrium. The unfinished geopolitical business in the region centers on the role of the US and the question of Iran. It is widely understood that the US has less and less interest in the region due to its newfound energy independence on the back of the shale revolution (Chart 4). This is why the US can afford to sign and break deals as it pleases under different administrations, namely the 2015 Iranian nuclear deal, otherwise known as the Joint Comprehensive Plan of Action (JCPA). The Obama administration spent two terms concluding the deal while the Trump administration spent one term nullifying it, leaving the central geopolitical question of the region in limbo. Israel and Arab governments feel increasingly insecure in light of the US’s apparent lack of foreign policy coherence and declining interest in the region. The US has not truly abandoned the region – if anything the Biden administration is looking to maintain or increase US international involvement.3 Washington still sees the need to preserve a strategic balance between Iran and the Arab states, prevent Iran from gaining nuclear weapons, and maintain security in the critical oil chokepoint of the Persian Gulf and Strait of Hormuz (Chart 5). But Washington’s appetite for commitment and sacrifice is obviously waning. The American public is openly hostile to the idea of Middle Eastern entanglements, and three presidents in a row have been elected on the assurance that they would scale down America’s “forever wars.” A decisive majority of Americans, including military veterans and Republicans, believe the wars in Afghanistan and Iraq were not worth fighting.4 And only 6% of Americans view Iran as the top threat to their country. Chart 4Waning US Interest In Middle East
Waning US Interest In Middle East
Waning US Interest In Middle East
Chart 5Strait Of Hormuz Critical To Global Stability
Biden, Iran, Markets
Biden, Iran, Markets
America’s lack of concern about the Iranian threat marks a difference from the early 2000s and especially from its critical Middle Eastern ally Israel. Naturally Israelis have a much greater fear of Iran, and 58% see it as the nation’s top threat (Chart 6). Israel and the Gulf Arab states are drawing together, under the framework of the Trump administration’s Abraham Accords, in case the US abandons the region. A deal normalizing relations with Iran would enable Iran to expand its power and influence and, if unchecked by the US, would pose a long-lasting threat to US allies. Chart 6No US Appetite For War With Iran – Israel A Different Story
Biden, Iran, Markets
Biden, Iran, Markets
Chart 7China/Asia, Not Iran, The Strategic Priority For The US
China/Asia, Not Iran, The Strategic Priority For The US
China/Asia, Not Iran, The Strategic Priority For The US
The US’s reason for dealing with Iran is that it needs to devote more attention to its strategy in the western Pacific in countering China (Chart 7). But China is also a reason for the US to stay involved in the Middle East. China’s role is expanding because of resource dependency and the desire to expand economic integration. Beijing wants to deepen its global investments, open up new markets, and create closer links with Europe (Chart 8). Chart 8AChina's Expanding Role In Middle East
China's Expanding Role In Middle East
China's Expanding Role In Middle East
Chart 8BChina's Expanding Role In Middle East
China's Expanding Role In Middle East
China's Expanding Role In Middle East
Chart 9Unresolved US-Iran Deal A Geopolitical Risk
Unresolved US-Iran Deal A Geopolitical Risk
Unresolved US-Iran Deal A Geopolitical Risk
The opening of the Iranian economy would give the US (and EU) a greater role in Iran’s development, where China has a special advantage as long as Iran is a pariah. The US would add economic leverage to its military leverage in a region that provides China with its energy. The Chinese are not yet as capable of projecting power into the region but that is changing rapidly. There is a possible strategic balance to be established between these simultaneous foreign policy revolutions: the US-Iran détente, the Israeli-Arab détente, and the rise of Mideast-China ties. But balance is an ideal and not yet a reality. In the meantime these foreign policy revolutions must actually take place – and revolutions are rarely bloodless. It is possible for a meltdown to occur in light of the region’s profound changes. In particular, the US-Iran détente is incomplete and faces Israeli/Arab opposition, Iranian paranoia, and US foreign policy incoherence. At the moment it is premature to declare an end to the bull market in US-Iran tensions. That will come when a deal is actually sealed, and then tested and enforced. In the meantime Iranian incidents will occur (Chart 9). Geopolitical risks threaten to reduce global oil supply. Different regimes and their militant proxies will strike out against each other to establish red lines. But a US-Iran deal is highly likely – and once that occurs, the risk to oil supply shifts to the upside, as Iran’s economy will open up. Not only will Iran start exporting again but Gulf Arab producers will want to preserve their market share, which means they will pump more oil. Iran’s Regime Hardens Its Shell Ahead Of Leadership Succession The COVID-19 crisis has weakened regimes in the Middle East, much like the Great Recession sowed the seeds for the Arab Spring and many other sweeping changes in the region. But unlike the Arab Spring, the regimes most at risk today are majority Shia Muslim – with Lebanon, Iran, and Iraq all teetering on the verge of chaos (Chart 10). Chart 10Iranian Sphere De-Stabilized Amid COVID
Biden, Iran, Markets
Biden, Iran, Markets
Chart 11Iranian Economy Weak (Despite Green Shoots)
Iranian Economy Weak (Despite Green Shoots)
Iranian Economy Weak (Despite Green Shoots)
Chart 12Jobless Iranian Youth
Jobless Iranian Youth
Jobless Iranian Youth
The Iranian economy is starting to show the faintest green shoots but it is far too soon to give the all-clear signal. US sanctions have shut off access to oil export revenues. Domestic demand is weak and imports are still contracting, albeit much less rapidly. The country has seen a double dip recession over the past ten years (Chart 11). Unemployment is rife, especially among the youth. The working-age population makes up 60% of total and periodically rises up in protest (Chart 12). Inflation is soaring and the currency is still wallowing in deep depreciation (Chart 13). All of these points suggest Iran is weaker than it looks and will seek to negotiate a deal with the Biden administration. But Iran cannot trust the US so it will simultaneously prepare for the worst outcome – no deal, sanctions, and eventually war. Chart 13Iran Still Ripe For Social Unrest
Iran Still Ripe For Social Unrest
Iran Still Ripe For Social Unrest
Chart 14Iranian Regime Turning Hawkish
Biden, Iran, Markets
Biden, Iran, Markets
Iran’s response to the US’s withdrawal from the 2015 nuclear deal and imposition of maximum pressure sanctions has been to adopt a siege mentality and fortify the regime for a potential military confrontation. The country is preparing for a highly uncertain and vulnerable transition from Supreme Leader Ali Khamenei to a future leader or group of leaders. The government fixed the 2020 parliamentary elections so that hardliners or “principlists” rose to prominence at the expense of independents and especially the so-called reformists. The reformists have been humiliated by the US betrayal of the deal and re-imposition of sanctions, which exploded the economic reforms of President Hassan Rouhani, who will step down in August (Chart 14). The Timeline Of Biden’s Iran Deal Still, it is likely that the US and Iran will return to some form of the 2015 nuclear deal. Lame duck Rouhani is politically capable of returning to the deal: President Rouhani is a lame duck president whose popularity has cratered. If he can restore the deal before August then he can salvage his legacy and provide a pathway for Iran out of economic ruin by removing sanctions. It is manifestly in Iran’s interests to restore the deal – one reason why it has never left the deal and has only made incremental and reversible infractions against it. If Rouhani falls on his sword he provides the Supreme Leader and the next administration with a convenient scapegoat to enable the deal to be restored. Freshman President Biden has enough political capital to return to the deal: Biden is capable of restoring the deal, as he clearly intends to do judging by his statements, cabinet appointments, and diplomatic actions thus far. He has demanded that Iran enter back into full compliance with the deal before he eases sanctions but even this demand can be fudged. After all, it was the US that exited the deal in the first place, and Iran remains in partial compliance, so it stands to reason that the US should make the first concession to bring Iran back into compliance. None of the signatories have nullified the deal other than the US, and it was an executive (not legislative) deal, so President Biden can ultimately rejoin it by fiat. This would not be a popular move at home but the US public is preoccupied. Biden would achieve a foreign policy objective early in his term. The timeline is critical – an early deal is our base case. But if it falls through, then it could take the rest of Biden’s term in office, or longer, to forge a deal. Tensions would skyrocket over that period. The timeline is shown in Table 1. The US has identified April or May as the time when Iran will reach “breakout” capability, i.e. produce enough highly enriched uranium to make a nuclear bomb. The Israelis, for their part, estimate that breakout phase will be reached in August – the same month Rouhani is set to step down. Both the US and Israel view breakout as a red line, though there is some room for interpretation. Table 1Can Lame Duck Rouhani Salvage US Deal For Legacy By August?
Biden, Iran, Markets
Biden, Iran, Markets
The option of rejoining the old deal with Rouhani as a scapegoat will end when Rouhani exits in August. The next Iranian president is unlikely to repeat Rouhani’s mistake of pinning his administration on a promise from the Americans that could be revoked as early as January 20, 2025. The next Iranian president will be a nationalist or hardliner. Opinion shows that the public looks most favorably upon the firebrand ex-President Mahmoud Ahmadinejad or the hardline candidate from 2017 Ebrahim Raisi. Another possible candidate is Hossein Dehghan, a brigadier general. The least favorable political figures are the reformists like Rouhani (Chart 15). Chart 15Iran’s Next President Will Be Hawkish
Biden, Iran, Markets
Biden, Iran, Markets
We cannot vouch for the quality of these opinion polls but they are corroborated by other polls we have seen and they make sense with what we know and have observed in recent years. Apparently the public has turned its back on the dream of greater economic opening, with self-sufficiency making a comeback in the face of US sanctions (Chart 16). The regime will promote this attitude in advance of the leadership transition as it must be prepared to conduct a smooth succession even under the worst-case scenario of sanctions or war. Chart 16Iran Preparing For Supreme Leader’s Succession
Biden, Iran, Markets
Biden, Iran, Markets
Chart 17Nuclear Bomb Key To Regime Survival
Biden, Iran, Markets
Biden, Iran, Markets
The hitch is that Iran is interested in rejoining the deal it signed in 2015, not a grander deal. It will not sign an expanded deal that covers its regional militant proxies and ballistic missile program or requires irreversible denuclearization. The Supreme Leader has witnessed that an active nuclear weapon program and ballistic missile program provide the surest guarantees of regime survival over the long haul. The contrasting cases of Libya and North Korea illustrate the point (Chart 17). Libya gave up its nuclear program and weapons of mass destruction in the wake of the US invasion of Iraq in 2003 only to see the regime collapse in 2011 and leader Muammar Gaddafi die under NATO military pressure. By contrast, North Korea refused to give up its nuclear and missile programs and repeatedly cut deals with the US that served only to buy time and ease sanctions, and today North Korea possesses an estimated 30-45 nuclear weapons deliverable through multiple platforms. Leader Kim Jong Un has used this leverage to bargain with the great powers. The lesson for Iran could not be clearer: a short-term deal with the Americans may buy time and a reprieve from sanctions. But total, verifiable, and irreversible denuclearization means regime suicide. The Biden administration would prefer to create a much more robust deal rather than suffer the criticism of rejoining the 2015 deal, given its flaws and that the first set of deadlines in 2025 is only four years away. But Biden cannot possibly reconstruct the P5+1 coalition of countries to force Iran into a grander bargain in the context of US-Russia and US-China tensions. The sacrifices that would be necessary to bring Russia and China on board would not be worth it. Therefore Biden’s solution will be to rejoin the existing deal plus an Iranian promise to enter negotiations on a more comprehensive deal in future. The Iranians can accept this option since it serves their purpose of buying time without making irreversible concessions on their nuclear and missile programs. Israel then becomes the sticking point, as Iranian officials have said that the US rejoining the original 2015 deal would be a “calamity” and unacceptable. The Israeli government is studying options for military action in the event that Iran reaches nuclear breakout. However, the Israeli election on March 23 will determine the fate of Benjamin Netanyahu and his government’s hawkish approach to Iran. A change of government in Israel would likely bring the US and Israel into line on concluding a deal with Iran so as to avoid military conflict for the time being. If Netanyahu wins, yet the US and Iran fall back into compliance with the 2015 deal (Table 2), then Iran is still limiting its nuclear capabilities through 2025, obviating the need for a unilateral Israeli strike in the near term. Israel will not launch a unilateral strike except as a last resort, as it fears permanent alienation from its greatest security guarantor, the United States. Table 2Iran’s Compliance (And Non-Compliance) With The Joint Comprehensive Plan Of Action
Biden, Iran, Markets
Biden, Iran, Markets
If a deal cannot be put together by the time Rouhani steps down then the risk of conflict will increase as there will not be a prospect of a short-term fix. A much longer diplomatic arc will be required as Iran would draw out negotiations and the US would have to court allies to pressure Iran. The US and/or Israel could conduct sabotage or air strikes to set back the Iranian nuclear program. It is possible that the Iranian leadership or the increasingly powerful Iranian Revolutionary Guard Corps could overplay their hand in the belief that the US has no stomach for waging war. While it is true that the US public is war-weary, it is also true that that attitude would change overnight in the event of a national humiliation or attack. Investment Takeaways The Trump administration drew a hard line on nuclear proliferation. Trump’s defeat marks a softening in the US line regarding proliferation. This does not mean that the Biden administration will be ineffective – it could be even more effective with a more flexible approach – but it does mean that nuclear aspirants currently feel less pressure to make major concessions. This will hold at least until Biden demonstrates that he too can impose maximum pressure. Hence nuclear and missile tests will go up in the near term – as will various countries’ demonstrations of credible threats and red lines. The global economic recovery will strengthen oil producers by giving them greater government revenues with which to stabilize their domestic politics and restart foreign policy initiatives. The global oil price is reasonably correlated with international conflicts involving oil producers (Chart 18). With rising oil revenues, Russia, Saudi Arabia, Iran, Iraq, and others will be emboldened to pursue their national interests. Chart 18Oil Price And Global Conflict Go Hand In Hand
Biden, Iran, Markets
Biden, Iran, Markets
While the Biden administration’s end-game is a nuclear deal with Iran, the period between now and the conclusion of a deal will see an increase rather than a decrease in tensions and tit-for-tat military strikes across the region. Unexpected cutoffs of oil supplies and a risk premium in the oil price will be injected first, as we have argued. When a deal is visible on the horizon then oil prices face a downside risk, due to the resumption of Iranian oil exports and any loss of OPEC 2.0 discipline. It is possible that this moment is already upon us. This report shows a clear path to a US-Iran deal by August. US Secretary of State Anthony Blinken is reaching out to the Iranians. Saudi Arabia has recently announced that it will not continue with large production cuts. Russian oil officials have argued that the global market is balanced and production cuts are no longer necessary.5 But given that the Russians and Saudis fought an oil market share war as recently as last year, it is not clear that a collapse in OPEC 2.0 discipline is imminent. What will be the market impact if hostilities revive in anticipation of a deal? Or worse, if a deal cannot be achieved and a much longer period of US-Iran conflict opens up for Biden’s term in office? Table 3 provides a list of major geopolitical incidents and crises in the Middle East since the Yom Kippur war. We look at the S&P500’s peak and trough within the three months before and after each crisis. The median drawdown is 8% and the market has usually recovered within one month. Twelve months later the S&P is up by 12%. Table 3Stock Market Reaction To Middle East Geopolitical Crises
Biden, Iran, Markets
Biden, Iran, Markets
Table 4 shows a shortened list of the same incidents with the impact on the trade-weighted dollar, which is notable in the short run but is only persistent in the long run in the case of full-fledged wars like the first and second Persian Gulf wars. Table 4US Dollar Falls On Middle East Geopolitical Crises
Biden, Iran, Markets
Biden, Iran, Markets
The stock market impact can last for a year if the crisis coincides with a bear market and recession. Middle Eastern crises tend to occur at the height of business cycles when economic activity is running hot, inflationary pressures are high, and governments feel confident enough in their economic foundation to take foreign policy risks. The Yom Kippur war and first oil shock initiated a recession in 1973. The first Iraq war also coincided with the onset of a recession. The terrorist attack on the USS Cole occurred near the height of the Dotcom bubble and was followed by the 2001 recession. The 2019 Iranian attack on Saudi Arabia’s Abqaiq refinery also occurred at the peak of the cycle. More analogous to the situation today are crises that occurred in the early stages of the global cycle. The Arab Spring and related events in 2011 coincided with a period of market weakness that lasted for most of the year as the aftershocks of the Great Recession rippled across the emerging world. This scenario is relevant in 2021 and especially 2022, as global stimulus wears off and governments strive to navigate the deceleration in growth. Middle Eastern instability could compound that problem. The chief risk in the coming years would be a failure to resolve the Iranian question followed by a US-Iran or Israel-Iran conflict that generates instability across the Middle East. Such a catastrophe could cause major energy supply shock that would short-circuit the global economy. History shows this risk is more likely to come late in the cycle rather than early but the above analysis indicates that a failure of the Biden administration to conclude a deal this year could lead to a multi-year escalation in strategic tensions with a new hawkish Iranian president. That path, in turn, could bring forward the time frame of a major war and supply shock. The Iranians have taken a hawkish turn, are fortifying their regime for the future, and will reject total denuclearization. The US is fundamentally less interested in the region and thus susceptible to continued foreign policy incoherence. The Israelis are just capable of taking military action on their own in the event of impending Iranian nuclear weaponization. These points suggest that the risk of war with Iran is non-trivial, even though a US-Iran deal is the base case. Matt Gertken Vice President Geopolitical Strategy mattg@bcaresearch.com Footnotes 1 See Sun Yu and Demetri Sevastopulo, "China targets rare earth export curbs to hobble US defence industry," Financial Times, February 15, 2021, ft.com. 2 For the US response to the Erbil attack see Jim Garamone, "Austin Pleased With Discussions With NATO Leaders," Department of Defense News, February 17, 2021, defense.gov. 3 For example, Biden is unlikely to withdraw precipitously from the region, including Afghanistan, as Trump intended, especially as long as he is in a high-stakes negotiation with Iran. 4 Ruth Igielnik and Kim Parker, "Majorities of U.S. veterans, public say the wars in Iraq and Afghanistan were not worth fighting," Pew Research, July 10, 2019, pewresearch.org. 5 See Benoit Faucon and Summer Said, "Saudi Arabia Set to Raise Oil Output Amid Recovery in Prices," Wall Street Journal, February 17, 2021, wsj.com; Yuliya Fedorinova and Olga Tanas, "Global Oil Markets Are Now Balanced, Russia’s Novak Says," Bloomberg, February 14, 2021, Bloomberg.com.
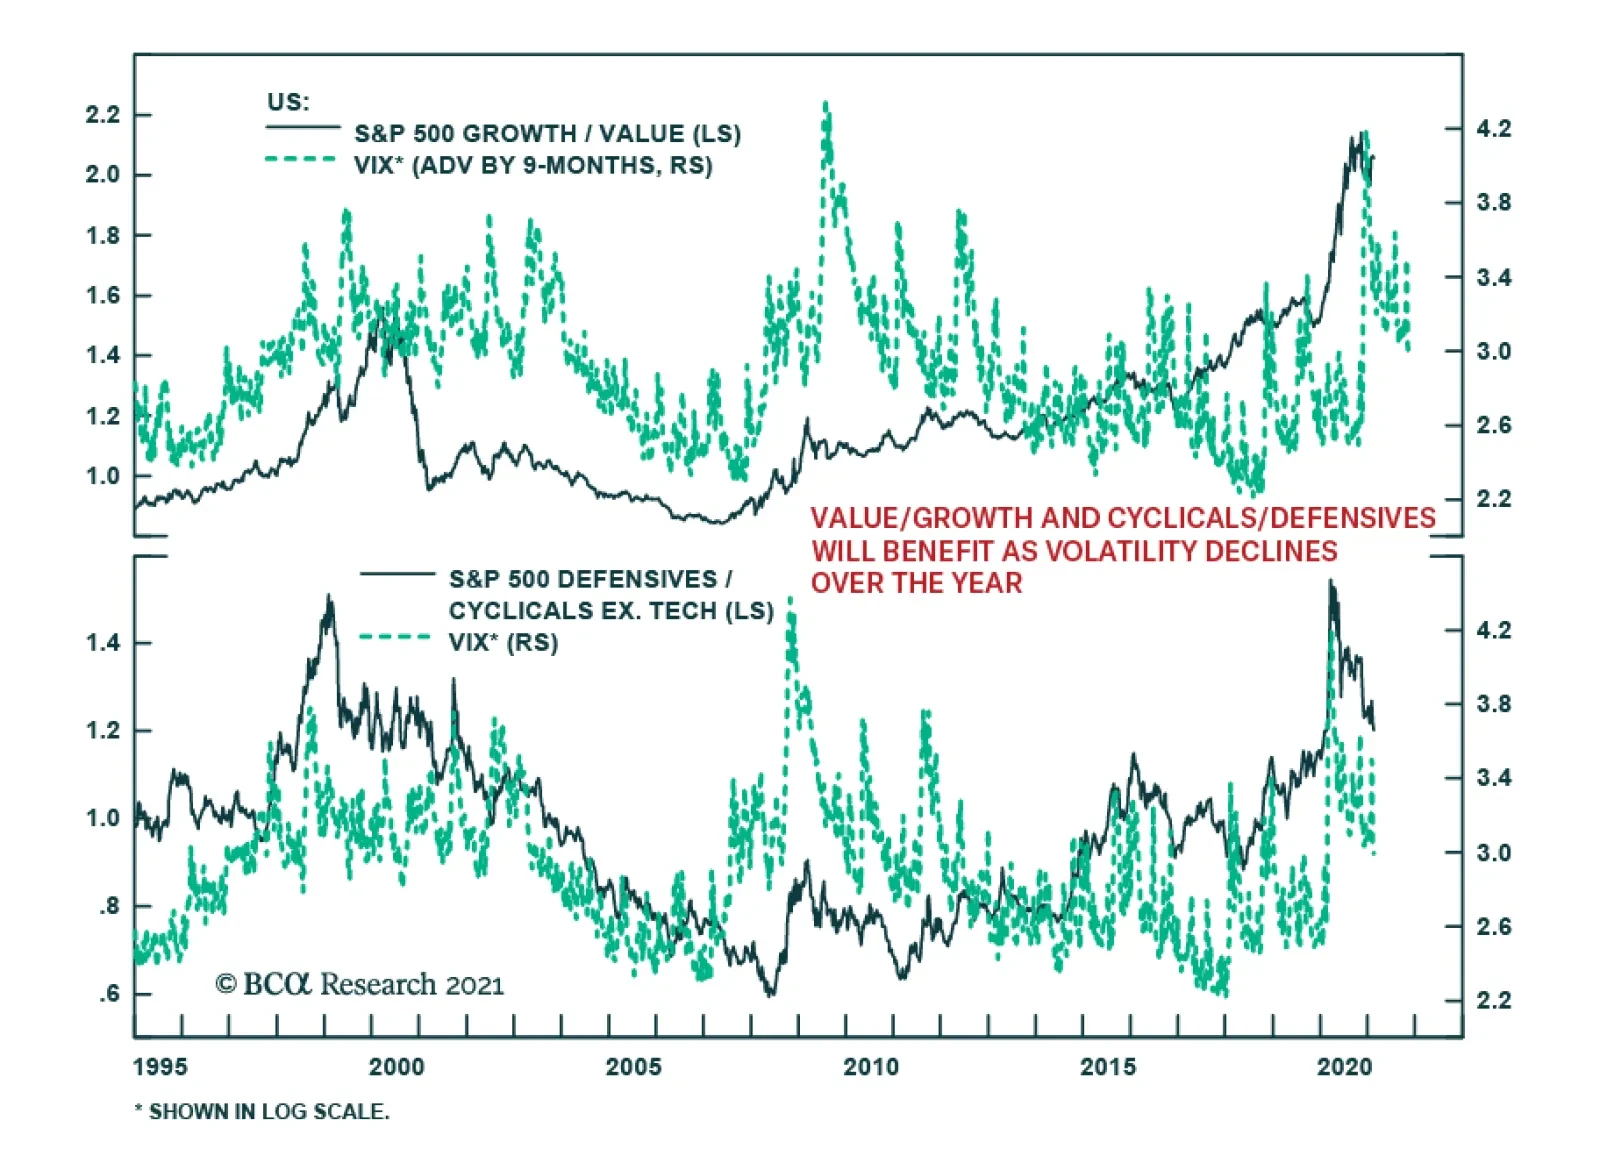
Last Friday, the VIX closed below 20 for the first time since February 2020. Uncertainty abounds regarding the outlook for inflation, central bank reaction functions, and COVID-19 variants, among others. However, ebbing COVID-19 infections and the broadening…
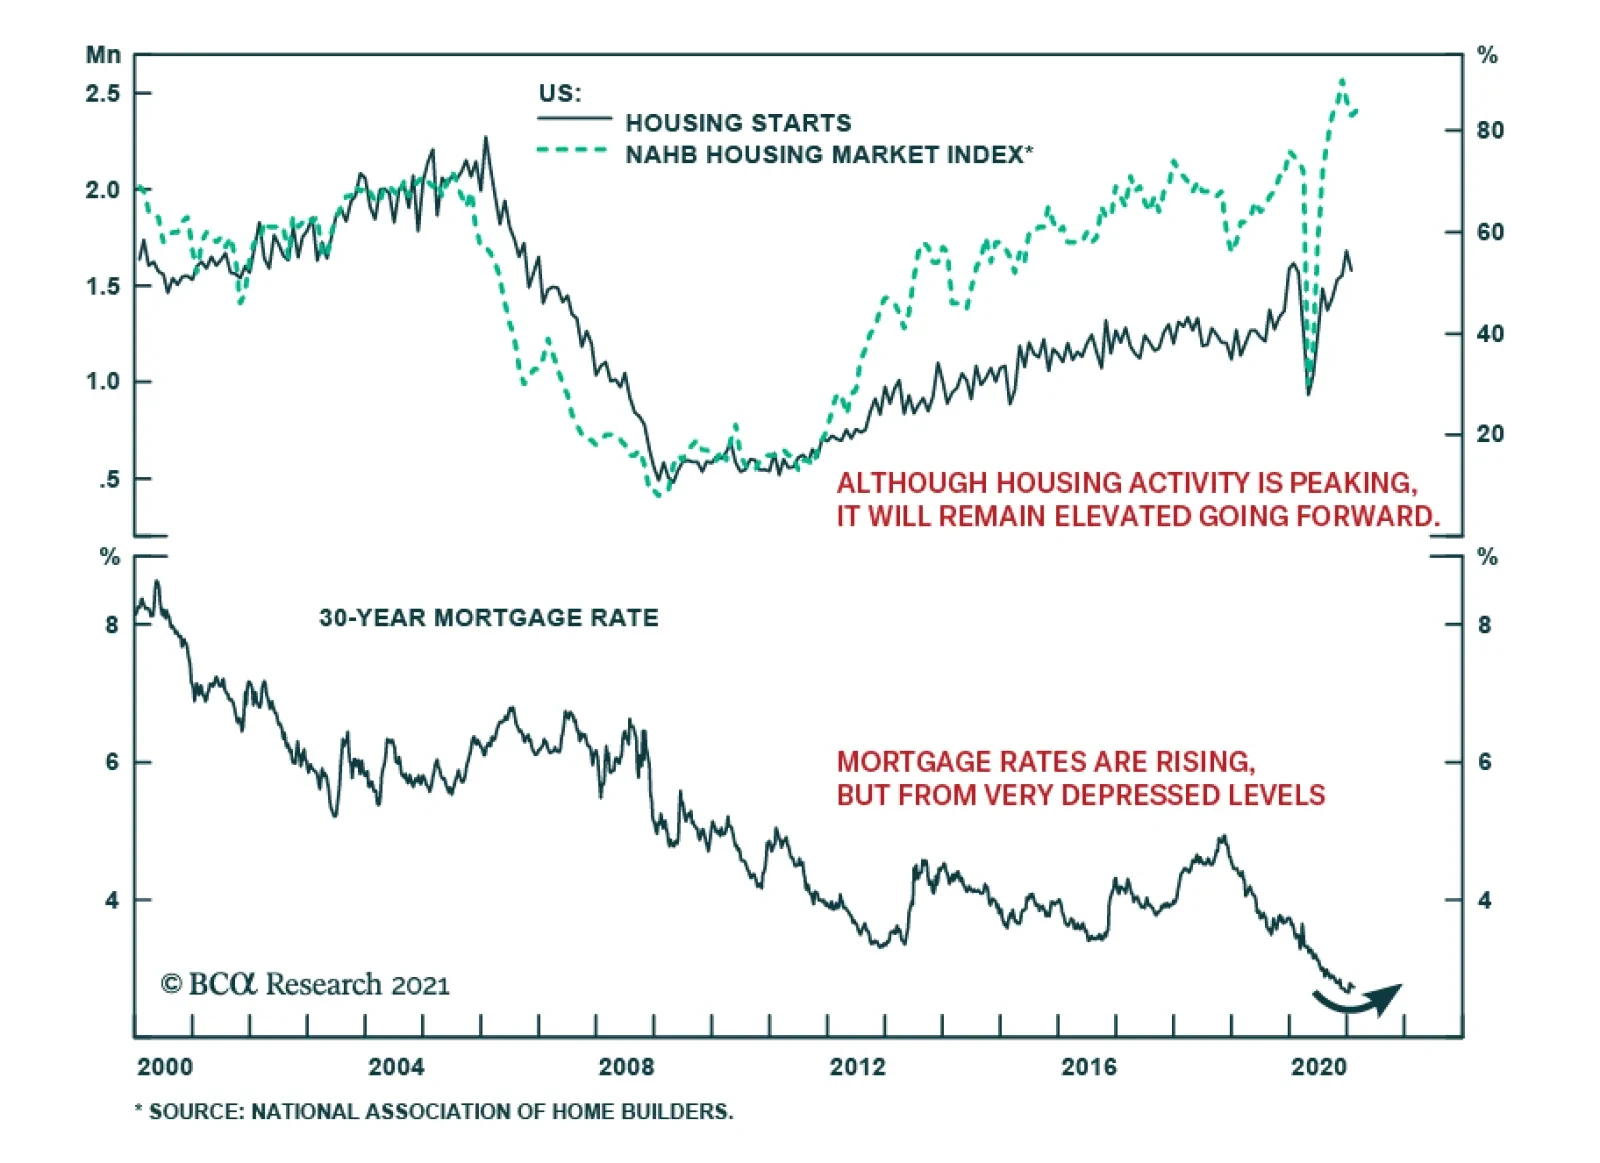
Recent data suggests that the US housing market is slowing. A decline in single-family housing starts brought down total housing starts in January by 6% m/m – the first decline since August – significantly below the expected 0.5% m/m decline. And while the…
Highlights Transitory dislocations – i.e., supply and demand disruptions in the wake of the Polar Vortex engulfing the US midcontinent – are wreaking havoc on spot oil markets; however, they will not profoundly alter longer-term fundamentals (Chart of the Week). Gasoline prices in the US are up 10 cents/gal this month, as are diesel prices, indicating the impact on production and consumption is affecting the former slightly more at the margin. In the hard-hit Midwest and US Gulf regions, price gains are slightly less, according to the US EIA. Oil production in the vanguard Permian Basin likely will fall 7-8mm barrels this month. Refineries and pipelines experiencing power outages and severe cold are reducing operations, which will dampen exports. The weather-induced rally pushed Brent above $63/bbl this week, our average price forecast for this year in January. This month, we are lifting our 2021 average price forecast back to $65/bbl and lowering our 2022 forecast slightly to $70/bbl. The balance of price risks remains to the upside. Nonetheless, we remain cautious given ongoing COVID-19 risks – particularly around variants; a strong USD; and the resumption of Saudi-Russian tensions that likely will arise within OPEC 2.0 with prices above $60/bbl. Feature Despite headline-grabbing reports of the Polar Vortex engulfing the US Midwest and Gulf regions, supply-demand fundamentals are unlikely to experience a prolonged dislocation in its wake. Oil output likely will be hit hard in the short term, particularly in the Permian Basin, where producers, by and large, are unaccustomed to the deep-freeze conditions their colleagues to the north take for granted. We expect some 7-8mm barrels of production will be lost in the Permian this month, but that it will be returned next month, which will restore US output to its previous trajectory (Chart 2). Chart of the WeekOil Forecasts Steady, Despite Polar Vortex
Oil Forecasts Steady, Despite Polar Vortex
Oil Forecasts Steady, Despite Polar Vortex
Chart 2Lost US Oil Ouput Will Return In March
Lost US Oil Ouput Will Return In March
Lost US Oil Ouput Will Return In March
Operations at refineries and pipelines are ramping down as a precaution, which will force product inventories to draw as temperatures return to normal.1 This will reduce exports until refining assets and pipelines are brought back up to speed as refiners prepare for the summer driving season. With vaccine distribution in the US picking up steam, we expect product demand to rise, and, given the lost oil and refining output from the current weather-induced disruptions, we expect refining margins in 2Q21 and 3Q21 to be stout. Global Oil Markets Remain Steady Our global oil balances are largely unchanged versus last month, save for a few marginal adjustments, leaving our price forecasts largely unchanged. The weather-induced push to prices that lifted Brent to our $63/bbl forecast from last month ahead of schedule – mostly as lost US production opened short-term sales opportunities for Brent-related crudes – will recede, producing a shallow correction as markets return to normal. Thereafter, in 2Q21, we expect global supply-demand fundamentals to resume the pre-winter evolution we have been modeling for months. WTI prices, which were pushed above $60/bbl this week, also will recede in the short term as weather returns to normal. On the demand side, we continue to expect a stout recovery in DM and EM markets, with consumption gaining 6.6mm b/d this year and 2.8mm b/d in 2022 on the back of massive fiscal and monetary stimulus globally (Chart 3). We expect supply to continue reflecting the production management of OPEC 2.0 (Chart 4), which has been remarkably successful in keeping the level of supply below demand (Chart 5), which is driving the drawdown in global inventory levels (Chart 6). OPEC 2.0’s strategy likely will be maintained into 2022, however, as we discuss below, this is not a given (Table 1). Chart 3Stout EM, DM Demand Expected
Stout EM, DM Demand Expected
Stout EM, DM Demand Expected
Chart 4OPEC 2.0 Production Will Respond Quickly To Demand Changes
OPEC 2.0 Production Will Respond Quickly To Demand Changes
OPEC 2.0 Production Will Respond Quickly To Demand Changes
Chart 5OPEC 2.0 Policy Continues To Keep Supply Below Demand...
OPEC 2.0 Policy Continues To Keep Supply Below Demand...
OPEC 2.0 Policy Continues To Keep Supply Below Demand...
Chart 6...Allowing Inventories To Draw
...Allowing Inventories To Draw
...Allowing Inventories To Draw
Table 1BCA Global Oil Supply - Demand Balances (MMb/d, Base Case Balances)
Oil Markets Steady, Despite Weather; Brent Forecast Back At $65/bbl For 2021
Oil Markets Steady, Despite Weather; Brent Forecast Back At $65/bbl For 2021
US Real Rates Keep USD Bid US nominal rates are increasing while inflation has yet to show up in the data, which means implied real rates are rising. This has been supporting the USD and keeping it well bid in the new year (Chart 7). We continue to expect a weaker USD – given the massive fiscal stimulus and support measures deployed globally, particularly in the US. The Fed continues to signal it will continue to accommodate as much debt as the government takes on to support America’s recovery from COVID-19 and reduce unemployment. Global Economic Policy Uncertainty continues to fall as pandemic uncertainty falls. This will bring the USD down with it, as demand for safe havens diminishes along with lower uncertainty.2 However, markets still remain highly sensitive to any news suggesting the struggle to contain the COVID-19 pandemic is tipping in favor of the virus. Chart 7US Real Rates Keep USD Well Bid
US Real Rates Keep USD Well Bid
US Real Rates Keep USD Well Bid
OPEC 2.0 Tensions Will Follow Prices OPEC 2.0 has been remarkably consistent in its adherence to a policy of calibrating production to demand, so much so that even as demand was collapsing during the worst of the COVID-19 pandemic global inventories fell. This is the result of a deliberate effort by OPEC 2.0 to keep the level of supply below demand. In so doing, markets tightened, prices rose, and forward curves backwardated as inventories drew down, as we have been expecting for months (Chart 8). Going forward, as prices continue to strengthen – we expect Brent to average $65/bbl and $70/bbl this year and next – the cohesion of the OPEC 2.0 coalition again will be tested by differing domestic policy goals in the Kingdom of Saudi Arabia (KSA) and Russia. Chart 8Forward Curves Backwardate In Line With OPEC 2.0 Policy
Forward Curves Backwardate In Line With OPEC 2.0 Policy
Forward Curves Backwardate In Line With OPEC 2.0 Policy
Our maintained hypothesis in assessing oil-market supply-demand fundamentals is KSA and Russia are trying to strike a balance between their disparate goals: KSA needs higher prices to support its diversification efforts away from oil exports as the principal driver of its economy, and Russia desires lower prices so as to discourage another surge in US shale-oil output. In our estimation, for the near term – i.e., the next 2-3 years – KSA prefers Brent prices in a range of $70-$75/bbl, while Russia prefers prices in a range of $50-$55/bbl.3 In the best of all possible worlds, maintaining OPEC 2.0 cohesion likely represents a compromise that keeps Brent prices somewhere between $60-$70/bbl, perhaps a touch lower. Our modeling assumption is $65/bbl is a policy variable KSA and Russia can accept, and can agree to manage their production around that level. Brief excursions below and above the $65/bbl level are acceptable to both sides, but neither expects an excursion favoring their desired price level to endure indefinitely. Nor, we believe, do they expect the other side to countenance supporting their target at the expense of their domestic goals. At present, with Brent prices gravitating toward that ideal midpoint (at least in our estimation) of $65/bbl, markets will begin looking for signs the OPEC 2.0 alliance once again will start to fray, as it did in March 2020, when KSA and Russia could not agree on the level of production cuts at the start of the COVID-19 pandemic. At that time, Russia effectively declared a market-share war, which was readily engaged by KSA. Our prior – every month when we re-estimate supply-demand balances, and price forecasts – is both sides are sufficiently sensitive now to the damage they can inflict on the other, which, of course, also damages their economic interests. To borrow a well-turned phrase from the Bard, “Things should start to get interesting right about now.”4 Robert P. Ryan Chief Commodity & Energy Strategist rryan@bcaresearch.com Ashwin Shyam Research Associate Commodity & Energy Strategy ashwin.shyam@bcaresearch.com Commodities Round-Up Energy: Bullish Words fail to describe the price surges seen in US natural gas markets, which, on at least one pipeline system squarely situated along the cold front engulfing the midcontinent, surged to $500/MMBtu in spot trading going into this past weekend. The Polar Vortex powering through the midcontinent brought sub-zero temperatures and snow as far south as Galveston, TX.5 In futures trading, March-delivery futures in Henry Hub, LA, traded above $3.20/MMBtu earlier this week and settled above $3.10/MMBtu as we went to press (Chart 9). Base Metals: Bullish At ~ $3.85/lb, copper prices are trading at levels not seen since the beginning of 2012 on the CME’s COMEX exchange. Falling on-exchange inventories globally are contributing to bullish sentiment, as we discussed last week.6 Key markets – e.g., iron ore, which is holding ~ $160/MT, and nickel at ~ $18,800/MT – remain well bid during the Lunar New Year in China, when liquidity typically falls (Chart 10). We are getting tactically long spot London nickel at tonight’s close, with a price target of $29,000/MT by July. Precious Metals: Bullish Silver is holding up better than gold, which moved sharply lower as US real rates rose on the back of higher 10-year bond yields, which went from 1.2% on Friday to 1.3% on Tuesday, a one-year high. We remain long gold, and are getting tactically long silver at tonight’s close. We expect COMEX silver to reach $30/oz by July, as supply tightens, and demand increases on the back of a recovery in DM and EM economies. Ags/Softs: Neutral Wheat moved higher this week in the wake of the Polar Vortex sweeping through the US midcontinent, which raised fears of a winter crop kill-off as temperatures dropped well below zero (F) in key crop regions. Corn prices also moved higher, reversing WASDE-induced selling last week. Chart 9Prices Surge In US Natgas Markets
Prices Surge In US Natgas Markets
Prices Surge In US Natgas Markets
Chart 10Nickel Remains Well-Bid During The Lunar New Year
Nickel Remains Well-Bid During The Lunar New Year
Nickel Remains Well-Bid During The Lunar New Year
Footnotes 1 Please see U.S. oil wells, refineries shut as winter storm hits energy sector, posted by reuters.com for a summary of refinery and pipeline outages in oil and gas markets in the US midcontinent and Gulf regions. 2 Please see Pandemic Uncertainty Will Fall, Weakening USD, Boosting Metals, which we published 28 January 2021, for additional discussion on the interplay of these factors. 3 In our estimation, Russia’s budget is geared toward a Urals price of $42/bbl, while KSA’s likely assumes a price closer to $65/bbl. Please see Saudi Arabia's 'realistic' 2020 budget assumes lower oil price than 2019: economists published by S&P Global Platts 19 Dec 2019, and “Falling oil prices threaten to derail Putin’s spending promises,” published by ft.com 2 March 2020. 4 This is a line from a song titled Mississippi, which is found on Bob Dylan’s “Love And Theft” album. Investment Views and Themes Recommendations Strategic Recommendations Tactical Trades Commodity Prices and Plays Reference Table Summary of Closed Trades
Higher Inflation On The Way
Higher Inflation On The Way
Stick With Financials
Stick With Financials
Overweight In an Insight in mid-October we referred to the 10-year US Treasury yield as a sleeping giant and reiterated that this asset class was the last one that had yet to respond to the Fed’s QE as we had first highlighted on March 23, 2020. Now, there is tentative evidence that the giant has awaken – it even surpassed its last March peak. Encouragingly, it is also lifting the S&P financials index out of its misery (Chart 1, top panel). We boosted the financials sector to overweight in mid-November and as long as bonds sell off, investors will continue to bid financials higher. Importantly, the shape of the yield curve further underpins financials especially given the Fed’s resolve to keep short rates pinned near zero and continue to engineer a steeping of the yield curve. (Chart 1, bottom panel). The implication is that relative profitability will pick up steam, a message that our macro-driven relative EPS models also corroborate (Chart 2 on the next page). Tack on pent up financials sector buyback demand and a 40bps dividend yield carry versus the SPX and the outlook remains rosy for this early-cyclical sector. Bottom Line: Remain overweight the S&P financials sector.
Stick With Financials
Stick With Financials
Highlights Health care remains a top priority of the Democratic Party even though it is flying under the radar at the moment. Health care embodies the shift from small government to big government. While the 2021 budget reconciliation will hit Big Pharma and expand Medicaid, the 2022 reconciliation will seek a public health insurance option and Medicare role in price negotiations. If forced to choose between health care and climate change priorities, Democrats will choose health care. It is a bigger vote-winner. Stay short managed health care relative to the S&P 500. Go long health care facilities and equipment relative to the rest of the health sector. Feature The US Senate acquitted former President Donald Trump on a vote of 57-43 on February 13. No one was hanged.1 The trial was not economically or financially significant except insofar as it underscored peak US political polarization, US distraction from the global stage, and the extent of divisions within the Republican Party. Equity market volatility melted away as stocks surged higher on the generally positive backdrop of COVID vaccines and stimulus. Seven Republicans joined Democrats in voting to convict the former president of “incitement to insurrection.” Trump’s performance was worse than Bill Clinton’s but better than Andrew Johnson’s, though neither Clinton nor Johnson saw defections from their own party (Chart 1). The Republicans’ internal differences are serious enough to hobble them in the 2022 or 2024 elections but it is too soon to draw any hard conclusions. The Democratic agenda is also capable of bringing Republicans back together. Meanwhile the maximum of seven Republican defectors shows that it will be extremely difficult for Democrats to get 10 Republicans to join them in passing any controversial legislation in the Senate (Table 1). Hence the filibuster will remain in jeopardy over the long run if not in the short run. Also, in 2022, the Democrats have a chance to pick up seats in Pennsylvania and North Carolina. Chart 1Trump’s Acquittal And Historic Impeachment Results
Don't Forget Biden's Health Care Policy
Don't Forget Biden's Health Care Policy
Table 1The Seven Senate Republicans Who Defected From Trump
Don't Forget Biden's Health Care Policy
Don't Forget Biden's Health Care Policy
Biden’s Agenda After The American Rescue Plan Democrats are plowing forward with the first of two budget reconciliation bills, which enables them to pass legislation with a simple majority in the Senate. They hope to pass President Biden’s $1.9 trillion American Rescue Plan by mid-March, when unemployment benefits expire under the Consolidated Appropriations Act of 2020. The final sum might be a bit less than this headline number. The second budget reconciliation bill, for fiscal year 2022, will be passed in the autumn or next spring and will contain anywhere from $4 trillion to $8 trillion worth of additional spending on health care, child care, infrastructure, and green projects over a ten-year period (Chart 2). This number will be watered down in negotiation as the pandemic subsides and the aura of crisis dies down, reducing the willingness of moderate Democrats to vote for anything controversial. But investors should not doubt Biden’s agenda at this stage. If there is anything we know about the reconciliation process it is that the ruling party will get what it wants. Investors should plan accordingly: the output gap will be closed sooner than expected and inflationary pressures will build faster than expected, even though it will take a while for the labor market to heal. Chart 2Biden’s Agenda AFTER The American Rescue Plan
Don't Forget Biden's Health Care Policy
Don't Forget Biden's Health Care Policy
This policy combination of “loose fiscal, loose monetary” policy continues to drive stocks higher (and the dollar lower) despite the misgivings we noted about underrated geopolitical risks (Chart 3). A critical question is when the Fed will normalize monetary policy. This is not an apolitical question. Fed chair Jerome Powell’s term ends in February of 2022. He may contemplate tapering asset purchases prior to that date, causing troubles in the equity market, but actual tapering is more likely to occur in 2022, in the view of our US Bond Strategist Ryan Swift. Powell would only taper in 2022 if he is forced to do so by an ironclad policy consensus precipitated by robust inflation and possibly financial instability concerns. This timing gives President Biden an opportunity to nominate an ultra-dovish Fed chair. Rate hikes are entirely possible in 2022 but our political bias implies they are unlikely before 2023 (unless an ironclad consensus develops that they are necessary). Even in 2023, an ultra-dove will be reluctant to hike, depending on the context. And rate hikes are virtually off limits in 2024, at least until after the November election. This political timeline reinforces the view that the Fed will not be hiking anytime soon and investors should prepare for inflation risks to surprise to the upside over the coming years. Chart 3"Easy Fiscal, Easy Monetary" Policy Combination
"Easy Fiscal, Easy Monetary" Policy Combination
"Easy Fiscal, Easy Monetary" Policy Combination
The Senate parliamentarian has not yet ruled whether a federal minimum wage hike to $15 per hour can be included in the bill. Biden has accepted it may be cut but his party will push it through if possible. Last week we found that a higher minimum wage would not have a dramatic macroeconomic impact. Still, wages will rise in the coming years due to the cumulative effect of the Democratic Party’s policies. Higher wages, taxes, and regulatory hurdles will cut into corporate profits. But the passage of a higher minimum wage today would not in itself be a negative catalyst for equities. Rather, we would expect the rally to take a breather once the first reconciliation bill is finished (next week or in the coming weeks), since it will bring wage hikes, rate hikes, and tax hikes more clearly into view on the investment horizon. Unlike minimum wages, there is little controversy over whether budget reconciliation can be used to change the health care system. This was done in 2010 as the second critical part to President Barack Obama’s Affordable Care Act (Obamacare). Hence Biden is highly likely to get his health agenda passed, which is largely an agenda of entrenching and expanding Obamacare. That is, as long as he prioritizes health care above other structural reforms like climate change. We think he will. In the rest of this report we look at Biden’s health care policy and the implications for US financial markets. Biden’s Health Care Policy Health care has been a top priority of the Democrats since 1992 yet they have repeatedly lost control of the agenda due to surprise Republican victories in 2000 and 2016. Republicans expanded Medicare under Bush but then failed to repeal and replace Obamacare under Trump. Now Democrats have only the narrowest of majorities in the House and Senate and will push hard to solidify and build on Obamacare. There is a low chance that they will leave this issue unsettled under the Biden administration. If new obstacles arise, more political capital will be spent to secure health care reform at the expense of other policies on the agenda. COVID-19 reinforces the Democrats’ focus on health care. The US has seen around 1,500 deaths per million people, making it one of the worst performers amid the crisis, comparable to the UK and Italy (Chart 4). Yet COVID is only the latest in a line of US public health failings and it is important to put COVID into perspective. For example, among US adults aged 25-44 years old, all-cause excess mortality from March to July last year was about 11,899 more than expected. By contrast, during the same period in 2018, there were 10,347 unintentional deaths due to opioids (Chart 5).2 In other words, the COVID crisis last year was comparable to the opioid crisis in magnitude, at least for middle-aged people. Obviously COVID has taken a terrible toll and is a more deadly disease for the old and the sick. The point is that the public’s wrath over poor public health and the US government’s ineffectiveness is well established. A pandemic was foreseeable, and foreseen, yet not prepared for, and it came on top of the opioid crisis and the debate about 30 million Americans who lack health insurance. The Biden administration has the intention and the capability to address these issues. Chart 4US Handling Of COVID-19 Left Much To Be Desired
Don't Forget Biden's Health Care Policy
Don't Forget Biden's Health Care Policy
Chart 5Opioid Crisis Versus COVID Crisis
Don't Forget Biden's Health Care Policy
Don't Forget Biden's Health Care Policy
The structural problem is well-known: The US spends more than other countries on health care but achieves worse results (Charts 6A & 6B). When workers get fired they lose health care, as insurance is tied to employment. Those whose employers do not provide health care or who are unemployed count among the ranks of the roughly 30 million uninsured. This number has fallen from its peak at 47 million in 2010 when Obamacare was enacted but has crept upward again since Trump’s attempt to dismantle that law and the lockdowns of 2020 (Chart 7). This is a driver of popular discontent that has proven again and again to generate votes, including in key swing states. Chart 6AThe US Spends More On Health Care …
Don't Forget Biden's Health Care Policy
Don't Forget Biden's Health Care Policy
Chart 6B… But Sees Worse Avoidable Mortality
Don't Forget Biden's Health Care Policy
Don't Forget Biden's Health Care Policy
Chart 7Rising Number Of Uninsured Even Pre-COVID
Don't Forget Biden's Health Care Policy
Don't Forget Biden's Health Care Policy
A range of public opinion polling over many years shows that health care is a close second or third to the economy and jobs in voter priorities. Voters care more about COVID and health care than they do about climate change and the environment (Chart 8, first panel). Chart 8Public Opinion On Biden’s Priorities: Jobs, Health, Then Climate
Don't Forget Biden's Health Care Policy
Don't Forget Biden's Health Care Policy
Another important takeaway from this opinion polling is that voters could not care less about budget deficits. Big spending solutions are all the rage (Chart 8, second panel). The Biden administration is prioritizing economic recovery and the pandemic response but will also pursue its health care reforms. If this policy requires a tradeoff with infrastructure and renewables, we would expect health care to get the greater attention. Over the long run Obamacare can be replaced but not repealed. The law is getting more popular over time and entitlements get harder to repeal over time. Slightly more than half of voters have a favorable view of the law and only 34% have an unfavorable view. Only 29%of voters want to repeal or scale back the law while about 62% want to build on it or keep it as it is (Chart 9). Underscoring this polling is the fact that the law was modeled on a Republican plan and even Trump adopted several of the most popular provisions: requiring insurance coverage for patients with preexisting conditions and slapping caps on pharmaceutical prices through import and pricing schemes. The Supreme Court has ruled Obamacare constitutional and is not expected to change that ruling this spring. It could object to the individual mandate – the most controversial part of Obamacare that required each person to pay a tax penalty if they did not purchase health insurance. But if parts of the law are stricken, Democrats have the votes to patch it up or provide an alternative. Chart 9Obamacare Has Grown On American Public
Don't Forget Biden's Health Care Policy
Don't Forget Biden's Health Care Policy
Biden simultaneously shows that Democrats rejected the most popular alternative to Obamacare – “Medicare for All,” or single-payer government-provided health care – at least for the current presidential cycle. Medicare for All was co-sponsored by Vice President Kamala Harris and is still a long-term goal of the progressive wing of the Democratic Party. However, voters do not like the proposal when asked about its practical consequences (Chart 10). In the Democratic primary, only Senators Bernie Sanders and Elizabeth Warren argued for wholesale revolution in US health care that would see private insurance cease to exist and 176 million voters moved onto a public health system. Sanders’s plan would have cost an estimated $31 trillion, increasing the budget deficit by $13 trillion over 10 years, and would have encouraged the overuse of medical services due to the absence of a co-pay or fixed cost. This idea will not vanish but the Biden administration’s likely success in expanding Obamacare will lead the party to focus on other things (e.g. climate change). Chart 10Insufficient Public Demand For Government-Provided Health Care (For Now)
Don't Forget Biden's Health Care Policy
Don't Forget Biden's Health Care Policy
Biden’s big proposal is to add a public insurance option that would exist alongside current private insurance options. This idea was originally part of Obamacare but was removed during negotiations – precisely because the Democrats eschewed the use of budget reconciliation (again, not a constraint this time).3 The Biden plan is estimated to cost $2.25 trillion over 10 years and includes larger subsidies, the ability of workers to choose whether they want their employer-provided plan or the public option, automatic enrollment, a lower age of eligibility for Medicare (from 65 to 60), drug price caps, and various other provisions (Table 2). Table 2Biden’s Health Care Plan
Don't Forget Biden's Health Care Policy
Don't Forget Biden's Health Care Policy
Medicare, a giant consumer, would be able to negotiate drug prices directly with companies to drive down the price. Tax hikes on high-income earners and capital gains would pay for Biden’s policy. With public backing and full Democratic control of Congress, there is little that can stop Biden from achieving this health care policy, other than a change in direction from his party, which we do not expect. The first budget reconciliation only contains small parts of the Biden agenda, such as incentives for states to expand Medicaid under Obamacare and a reduction in Medicaid rebates for drug manufacturers.4 The second budget reconciliation process will have to cover health care and tax hikes. But the consensus view is that the second reconciliation will focus on infrastructure and green energy. This is a conflict of priorities that will have to be resolved. The research above suggests it will be resolved in favor of health care. This would leave the regular budget process as the means to advance infrastructure and green projects. Macro Impact Of Biden’s Health Care Policy The great health care debate over the past decade reflected the broad post-Cold War debate in the US over the role of government in the economy. It centered on whether government involvement should increase to expand health insurance coverage. Although private US health care spending accounts for 31% of total health care spending, and is thus larger than either Medicare (21%) or Medicaid (16%), the government has control of 44% of spending when all of its functions are added together. This share is set to increase now that the debate has been decided in favor of Big Government (at least for now). Future administrations might carve out more space for private choice and competition in health care but a permanent step-up in government involvement and regulation has occurred given the above points about Obamacare’s irrevocability. What are the macro consequences of such a change? The imposition of Obamacare may have contributed to the sluggish economic recovery in the wake of the Great Recession but the case is hard to examine objectively because the tax penalties only took effect in 2015-16 and then a new administration ceased implementation in 2017. In 2015 the Congressional Budget Office estimated that repealing Obamacare would increase the budget deficit by $353 billion over a ten year period but that it would also increase GDP by an average of 0.7% per year during the latter end of full implementation, thus boosting revenues and producing a net $137 billion increase in the budget deficit over ten years.5 In other words, Obamacare marginally tightened fiscal policy and encouraged some workers to cut their hours or stop working due to expanded subsidies, tax credits, and Medicaid eligibility.6 Repealing it would have reduced the tax burden on corporations and reduced the subsidy benefits to households but possibly with a slight boost to growth (Chart 11). Going forward, Biden’s policies are adjustments rather than a total overhaul but they would ostensibly add $2.25 trillion in spending and $1.4 trillion in revenue, resulting in a negative impact on the budget deficit (fiscal loosening) of $850 billion. The implication is that Biden’s plan would increase rather than decrease aggregate demand, albeit marginally in an era of already gigantic deficits. It would also remove some labor supply and eventually drag on GDP growth. Yet the impact of these effects is still uncertain given the general context of loose fiscal and loose monetary policy, the reduction in the number of uninsured people, and the potentially positive second-order effects of this increase in the social safety net for low-income families with high marginal propensities to consume. The bottom line is that the macro effects of Biden’s health plan will not be known for many years but the headline effect in the short run is an incremental addition to an already extremely loose fiscal policy setting. Chart 11Macro Effects Of Obamacare Repeal
Don't Forget Biden's Health Care Policy
Don't Forget Biden's Health Care Policy
The negative effects will largely fall on high-income earners, capital gains earners, and corporations who will provide the revenue to pay for the plan. The private health insurance industry faced an existential threat from the Sanders plan but it still faces a loss of customers and earnings from the Biden plan. The major difference between Obamacare and Bidencare is that Obamacare forced insurance companies to provide a basic insurance option to the public but did not offer a public option to compete with them. Therefore their customer base increased albeit at a lower profit. Whereas Biden’s plan will create a public competitor that will siphon off customers from private insurance. Biden proposed giving workers this choice anytime but in the presidential debates suggested there would be limits. Either way private insurers stand to lose customers over time. This is not a major political constraint given that Big Insurance gets little sympathy from the public but it will have a negative impact on innovation and productivity in the health sector. Meanwhile Medicare would reimburse hospitals, clinics, and drug providers less for their services and goods. This would weigh on the profitability of small and private medical outfits and favor large and public providers that receive government subsidies and can stomach higher costs. It would also take a toll on Big Pharma and biotech sectors which have operated in a lucrative environment of low taxes, low regulation, and sizable pricing power. The US government has enormous negotiating power in the market, especially over home care, hospitals, nursing homes, and prescription drugs. Private and public investment are roughly evenly split, with public money dominating health care research and private money dominating structures and equipment. The government accounts for about 40% of total drug spending and both political parties believe this influence should be used to keep costs down, as public opinion is increasingly dissatisfied with high drug costs.7 There is a lot more to be said about the US health care system. A risk of Biden’s health reform is that it will increase the demand for health services without arranging for consummate increases in supply. In this sense it is inflationary. Investment Takeaways Health care stocks and each of the health care sub-sectors – pharmaceuticals, biotech, managed health care, facilities, and equipment – underperformed the S&P500 index amid the passage of Obamacare from March 23 to November 20, 2010. Within the sector, managed health care (health insurance) and biotech suffered most when the legislation first hit while facilities and equipment suffered most over the whole legislative episode. Once the law took full effect in 2014-15, equipment and managed health care outperformed, facilities were flat, and pharma and biotech underperformed. A look at the performance of the health care sector relative to the S&P 500 over the past 13 years shows that the sector rallied on President Obama’s victories in 2008, fell during the passage of Obamacare, staged a recovery that continued through the Supreme Court’s decision to uphold the new law in June of 2012, and then dropped off (Chart 12 A). Health stocks benefited from the global macro backdrop from 2011-15. After 2015, when Obamacare took full effect, the business cycle entered its later stage, and populism emerged (with Sanders threatening a government takeover and Trump firing up the cyclical economy), health care stocks underperformed the market. Chart 12AHealth Sector's Response To Obamacare Saga
Health Sector's Response To Obamacare Saga
Health Sector's Response To Obamacare Saga
Subsequent rallies have occurred, notably on the outbreak of COVID-19, but have not been sustainable. When Republicans failed to repeal Obamacare, when various crises gave defensive plays a tailwind, when Biden won the Democratic nomination over Sanders or Warren, and when the pandemic arose, the sector surged, often due to risk aversion in financial markets. In the end the negative trend reasserted itself as the combination of rising risk sentiment and policy headwinds outweighed the underlying demographic tailwind for earnings as society aged. Since the Democratic sweep of government in the 2020 elections the sector is testing new lows in relative performance. Pharmaceuticals charted a similar course to the overall health sector but never regained their pre-Obamacare peak in relative performance. They have underperformed again and again since the rise of Bernie Sanders and are today touching new lows (Chart 12B). Chart 12BBig Pharma's Response To Obamacare Saga
Big Pharma's Response To Obamacare Saga
Big Pharma's Response To Obamacare Saga
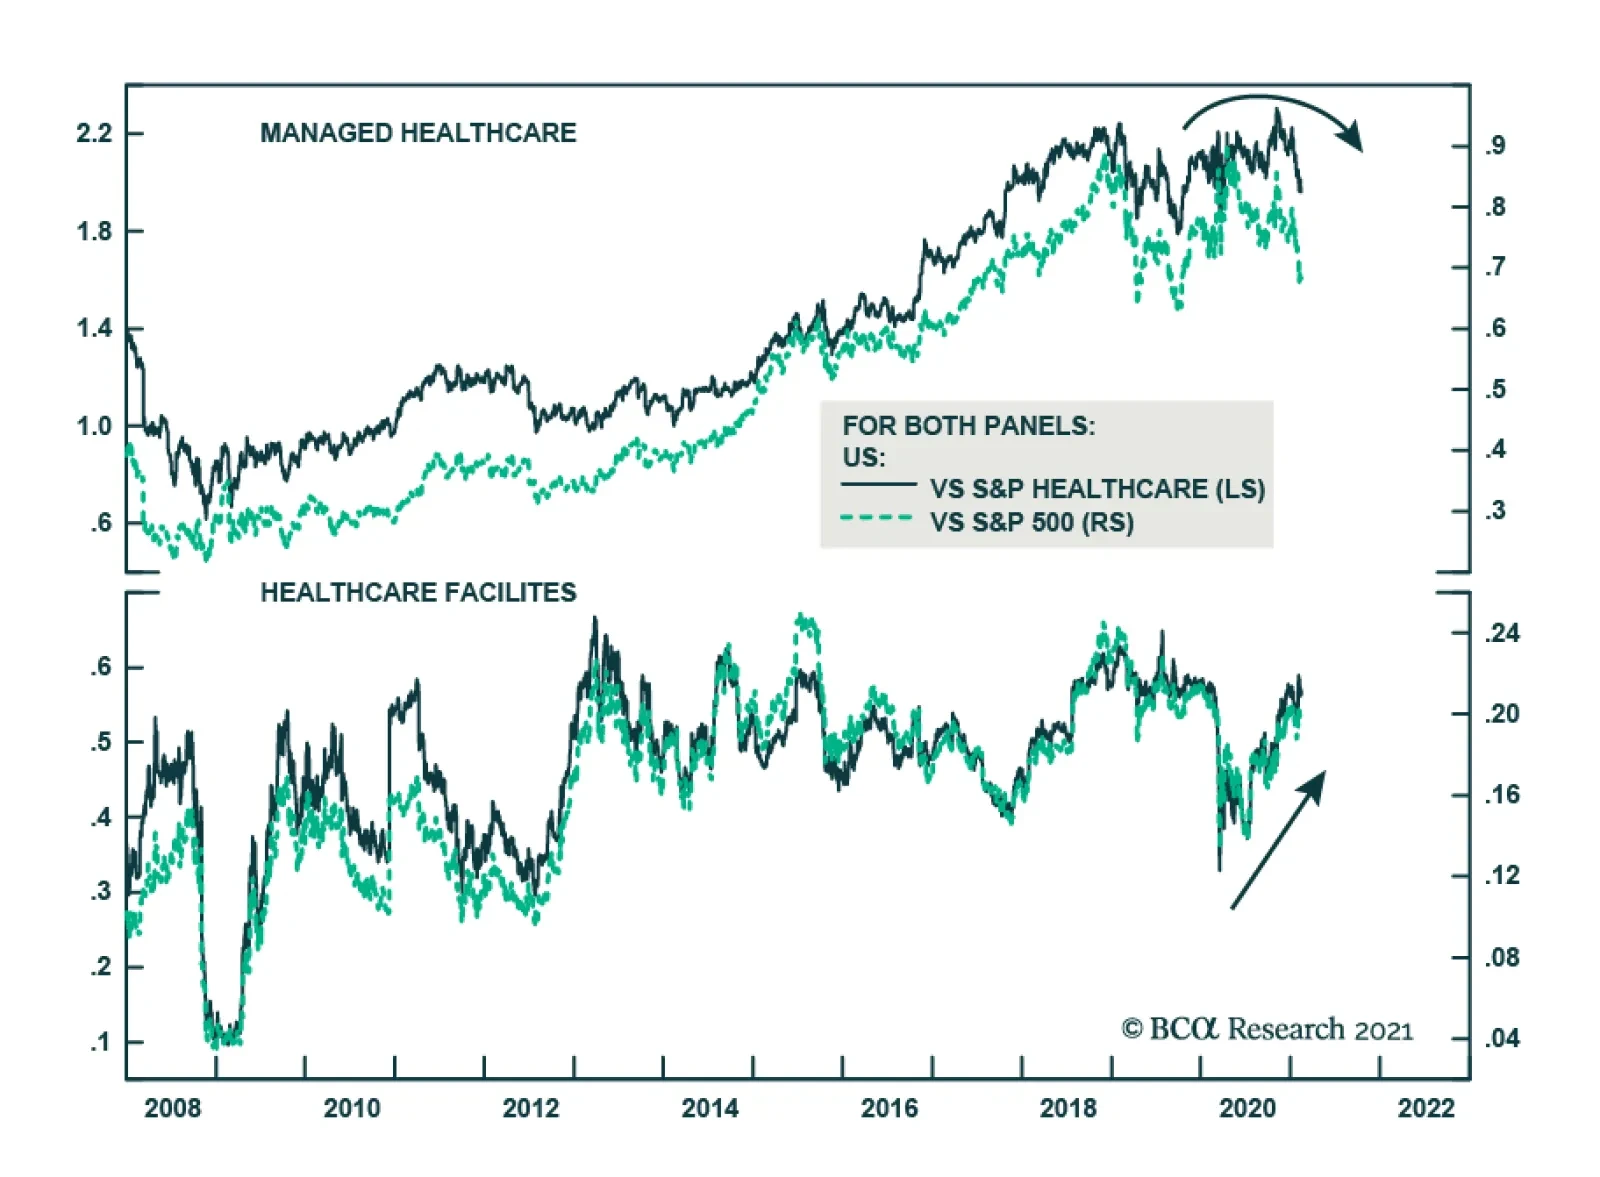
A closer look at the sector since the 2020 election and especially the Democratic victory in the Senate shows that it continues to underperform the broad market. Facilities are the most resilient, pharma and biotech are trying to find a bottom, and equipment and managed health care have sold off. Relative to the health care sector, equipment and facilities are the outperformers but, again, pharma and biotech are trying to bottom (Chart 13). These results make sense as Biden’s biggest policy impact will be to stimulate demand for health care facilities and equipment while constraining profits for Big Insurance and Big Pharma via the public insurance option and allowing Medicare to negotiate drug prices. Thus equipment and facilities benefit from the political environment, pharma and biotech should be monitored to see if they break down to new lows on the passage of legislation, and managed health care gets the short end of the stick. Our US Equity Strategy service is neutral on the sector as a whole, overweight equipment, and underweight pharma. Chart 13Health Care Sector Response To Biden's Democratic Sweep
Health Care Sector Response To Biden's Democratic Sweep
Health Care Sector Response To Biden's Democratic Sweep
Putting it all together, health care stocks are good candidates for a short-term, tactical bounce when the exuberant stock rally suffers a correction but they are not yet candidates for strategic investments. They are not likely to find a bottom until Biden’s policies are passed, or the pro-cyclical macro backdrop has changed. Biden’s policies are high priority for his party and face low legislative and political hurdles to passage, yet will have a huge impact on the relevant industries – undercutting the private health insurance customer base and capping the profits of America’s drug makers. These changes will have long-term ramifications so they are not likely to be fully discounted yet. Previously health care firms had huge pricing power – they could charge whatever they wanted while they did not face the full might of the government in setting prices – but going forward that will change. Biotech and pharma have large profit margins that are exposed to this policy shift so they are exposed to further downside – we would not be bottom-feeders. Moreover pharmaceuticals make up 28% of the health sector while biotech makes up 13%, so that these sectors will weigh down the whole sector. One would think that health care would outperform during a global pandemic – and most sectors did see a big bounce during the height of the COVID-19 outbreak. But the pandemic has created the impetus for a stimulus splurge that has fired up the cyclical parts of the economy. It has also underscored the industry’s public role and undercut its profit-making capabilities, not least by producing a Democratic sweep bent on improving US health outcomes – at the expense of US health industry profits. In sum, from a tactical point of view, health care stocks are well-positioned for a near-term rally in relative performance but from a strategic point of view they continue to face policy headwinds and should be underweighted relative to the broad S&P 500. Tactically, stay short the managed health care sub-sector relative to the S&P 500 (Chart 14). Strategically, go long health care facilities and equipment relative to the health care sector. Chart 14Health Stocks Outlook Under Biden Administration
Health Stocks Outlook Under Biden Administration
Health Stocks Outlook Under Biden Administration
Matt Gertken Vice President Geopolitical Strategy mattg@bcaresearch.com Jesse Anak Kuri Associate Editor jesse.Kuri@bcaresearch.com Appendix Table A1APolitical Capital: White House And Congress
Don't Forget Biden's Health Care Policy
Don't Forget Biden's Health Care Policy
Table A1BPolitical Capital: Household And Business Sentiment
Don't Forget Biden's Health Care Policy
Don't Forget Biden's Health Care Policy
Table A1CPolitical Capital: The Economy And Markets
Don't Forget Biden's Health Care Policy
Don't Forget Biden's Health Care Policy
Table A2Political Risk Matrix
Don't Forget Biden's Health Care Policy
Don't Forget Biden's Health Care Policy
Table A3Biden’s Cabinet Position Appointments
Don't Forget Biden's Health Care Policy
Don't Forget Biden's Health Care Policy
Footnotes 1 During the election crisis [of 1876], Kentucky Democrat Henry Watterson urged that “a hundred thousand petitioners” and “ten thousand unarmed Kentuckians” go to Washington to see that justice was done. Years later, when he was sitting next to [Ulysses S.] Grant at a dinner party, Watterson told him, “I have a bone to pick with you.” “Well, what is it?” asked Grant. “You remember in 1876,” said Watterson, “when it was said I was coming to Washington at the head of a regiment, and you said you would hang me if I came.” “Oh, no,” cried Grant, “I never said that.” “I am glad to hear it,” smiled Watterson. “I like you better than ever.” “But,” added Grant drily, “I would, if you had come.” See Paul F. Boller, Jr, Presidential Campaigns: From George Washington To George W. Bush (Oxford: Oxford University Press, 2004 [1984]), p. 141. 2 See Jeremy Samuel Faust, Harlan M. Krumholz, and Chengan Du, “All-Cause Excess Mortality and COVID-19-Related Mortality Among US Adults Aged 25-44 Years, March-July 2020,” Journal of the American Medical Association, December 16, 2020, jamanetwork.com. 3 The death of Senator Edward Kennedy forced the Democrats to use reconciliation for the second part of President Obama’s health care reform, the Healthcare and Education Reconciliation Act of 2010. 4 Currently the Medicaid rebate cap is set at 100% of the cost of making a drug. Other provisions would include a boost for rural health care services (a partial reallocation of headline COVID relief funds) and an expansion of Obamacare tax credits and subsidies for unemployed workers to keep their former employer-provided insurance. These are mainly COVID relief measures rather than aspects of Biden’s long-term health agenda. See Julie Rovner, “KHN’s ‘What the Health?’: All About Budget Reconciliation,” Kaiser Family Foundation, February 11, 2021, khn.org; see also Nick Hut, “A look at some of the healthcare-specific provisions in the pending COVID-19 relief legislation,” Healthcare Financial Management Association, February 10, 2021, hfma.org. 5 For the CBO’s original report on repeal, see “Budgetary and Economic Effects of Repealing the Affordable Care Act,” Congressional Budget Office, June 19, 2015, cbo.gov. More recently see Paul N. Van de Water, “Affordable Care Act Still Reduces Deficits, Despite Tax Repeals,” Center for Budget and Policy Priorities, January 9, 2020, cbpp.org. 6 See BCA Global Investment Strategy, “The Fed’s Dilemma,” May 12, 2017 and “Four Key Questions On The 2018 Global Growth Outlook,” January 5, 2018, bcaresearch.com. Regarding the debate around Obamacare, promoters highlight the recovery in US growth and jobs – including full-time jobs and small-business jobs – by 2015. Critics say the recovery would have been stronger if not for the law. See e.g. Casey B. Mulligan, “Has Obamacare Been Good for the Economy?” Manhattan Institute, Issues Brief, June 27, 2016, manhattan-institute.org; Cathy Schoen, “The Affordable Care Act and the U.S. Economy: A Five-Year Perspective,” Commonwealth Fund, February 2016, commonwealthfund.org. 7 Republican Senator Chuck Grassley co-sponsored a bill with his Democratic counterpart Ron Wyden of Oregon that would penalize drug companies that raised drug prices faster than inflation. In a separate bill with Senator Amy Klobuchar of Minnesota, he also proposed to prevent big name drug companies from paying generic drug-makers to delay the introduction of generics to the market. These bills were not debated on the main floor because then-Senate Majority Leader Mitch McConnell was unenthused about them but they exemplify the bipartisan consensus on government intervention to push down drug prices.
According to BCA Research’s US Political Strategy service, health care remains a top priority of the Democratic Party, which will hurt health care stocks. The health care debate over the past decade reflected the broad post-Cold War debate in the US over…
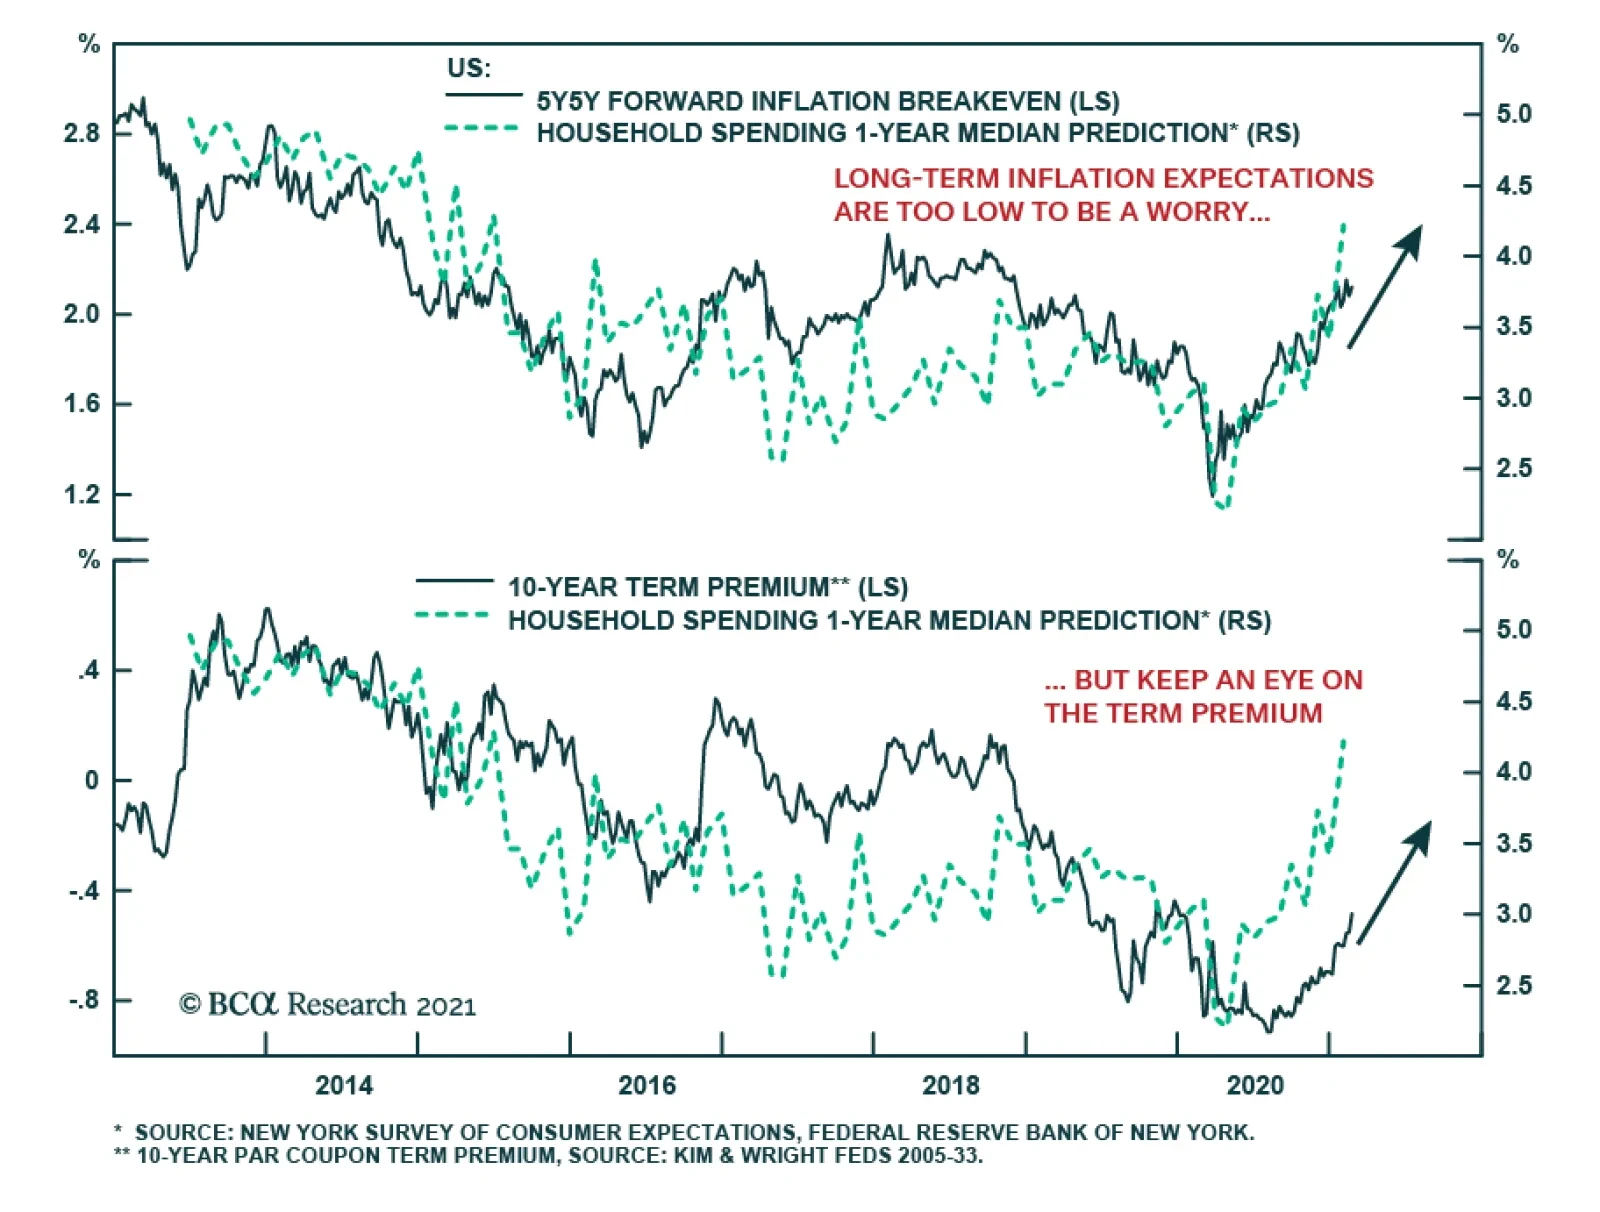
The rise in bond yields is likely to continue, independent of the Fed’s messaging. The positive stance on yields rests on the strength of the US economy. The cyclical sectors of the economy are roaring and deflationary risks are ebbing, which historically…
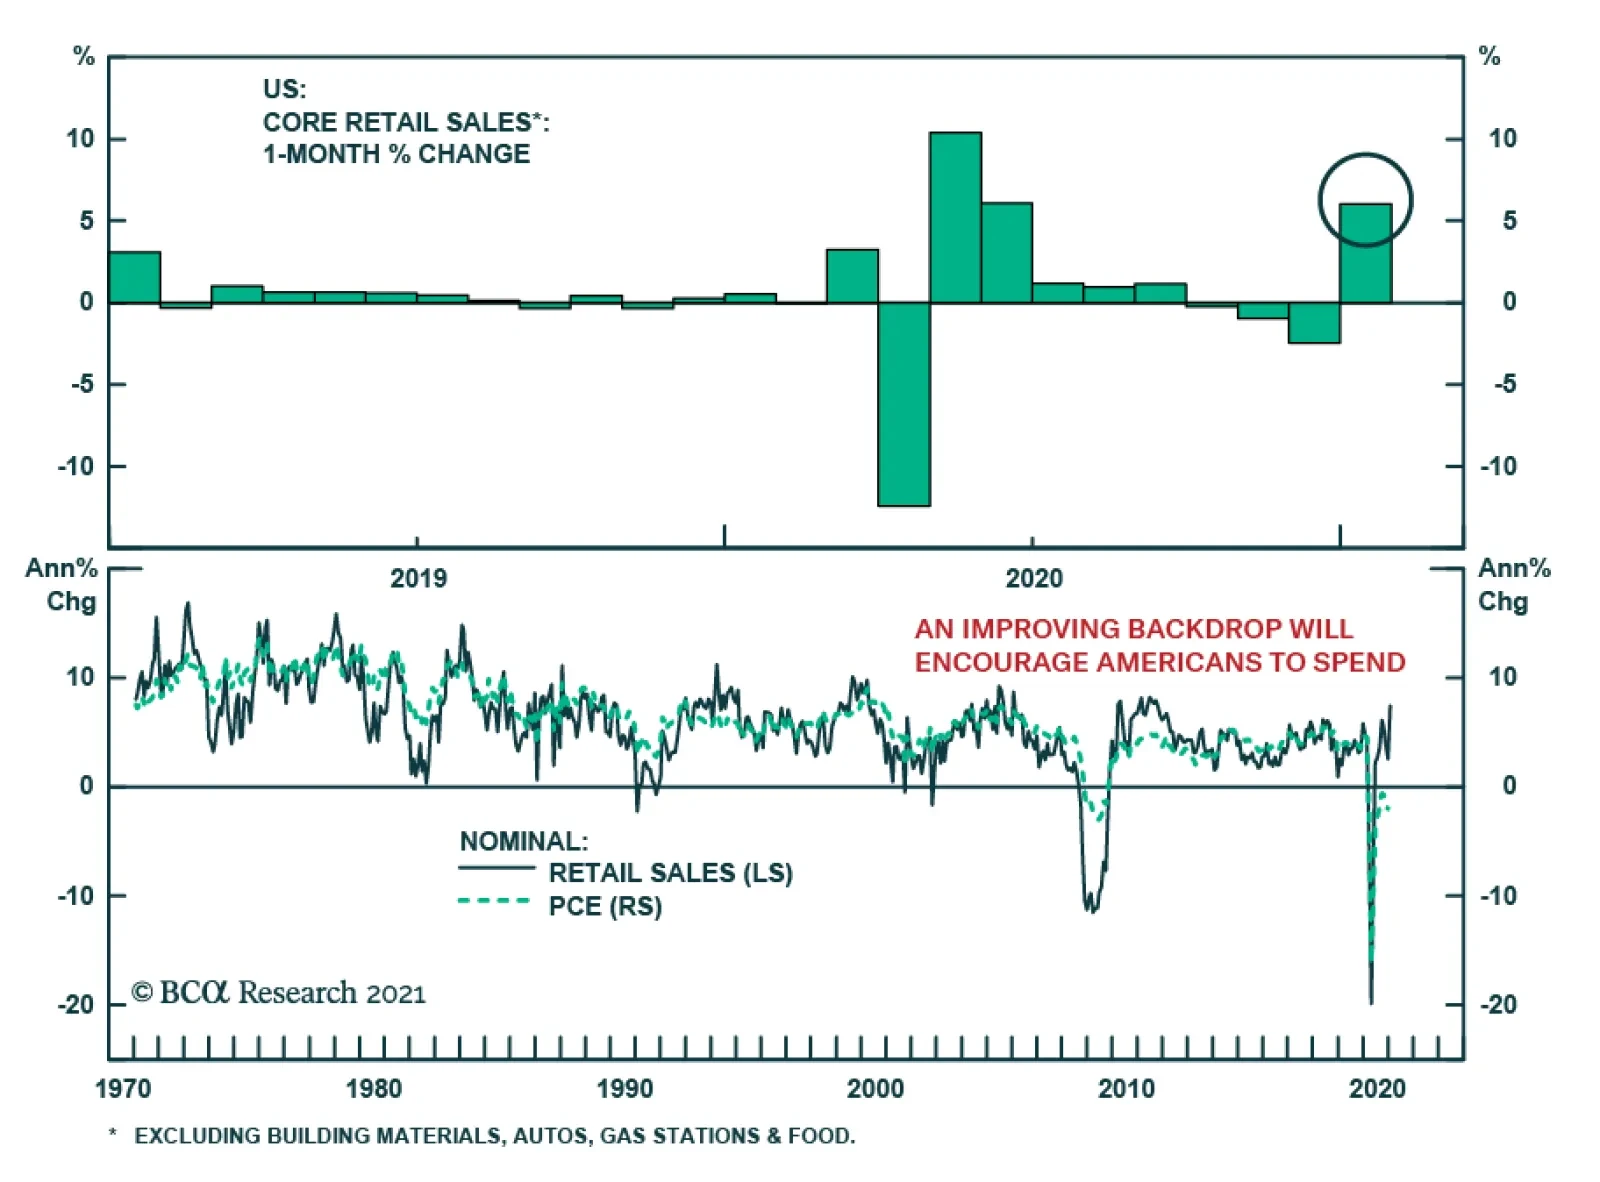
US retail sales came in at a blockbuster 5.3% m/m in January, eclipsing consensus expectations of a 1.1% m/m increase following a dismal 1.0% m/m decline in December. Similarly, the control group, which excludes autos, gas, building materials and food…
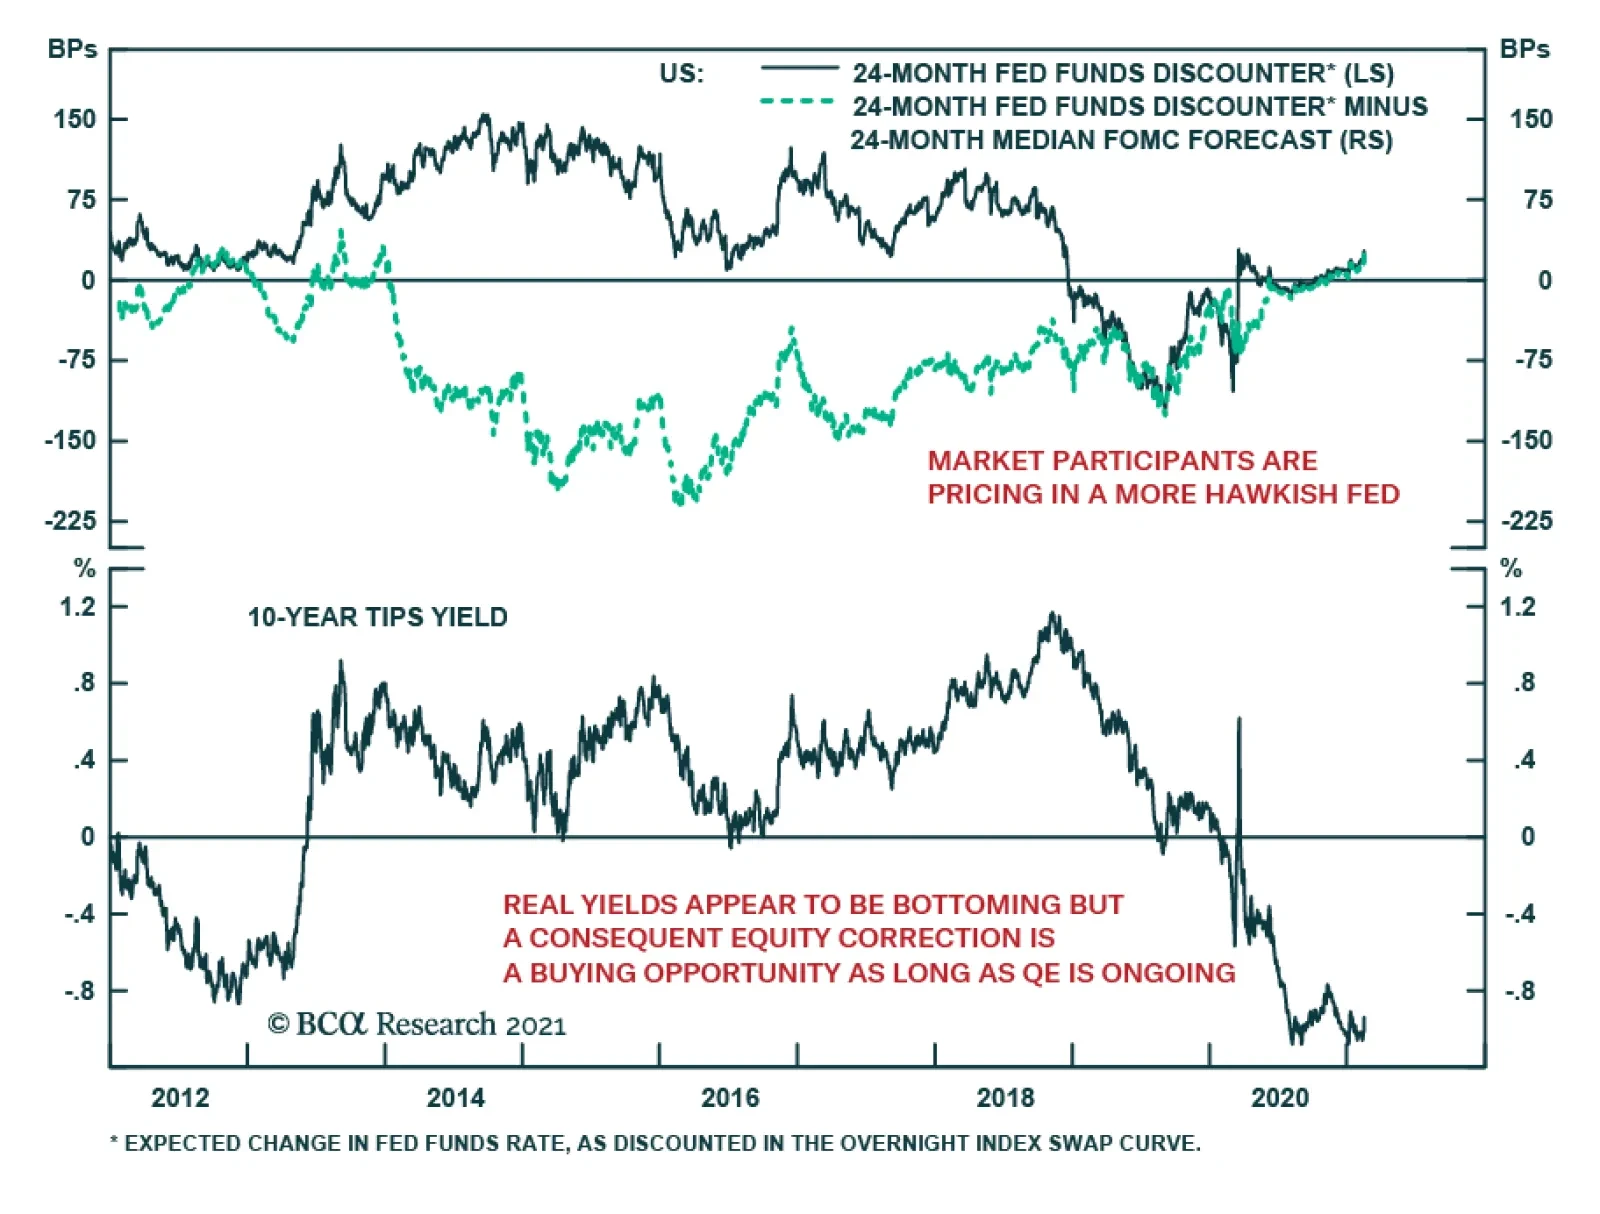
The acceleration in US 10-year Treasury yields to pre-pandemic levels is generating concerns about the risks to equities. This is especially relevant given that real yields appear to be bottoming. While the Fed remains consistent in communicating its…