United States
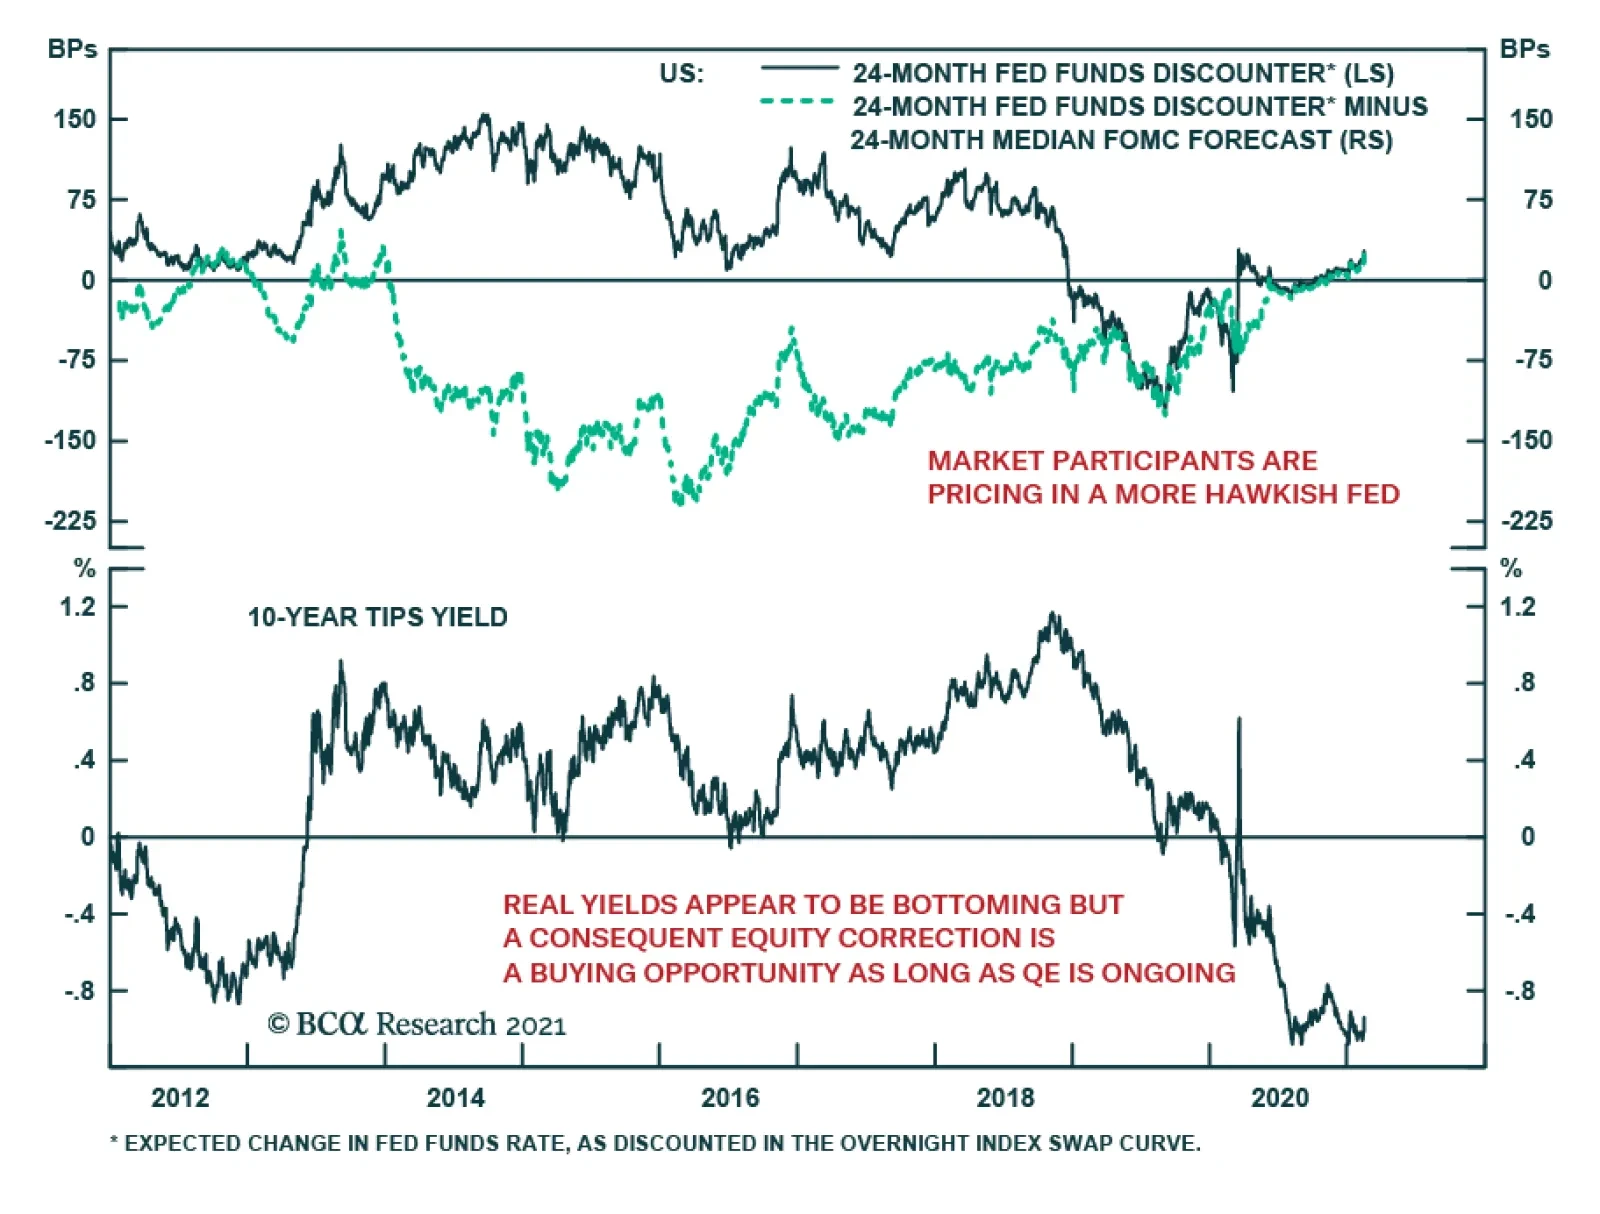
The acceleration in US 10-year Treasury yields to pre-pandemic levels is generating concerns about the risks to equities. This is especially relevant given that real yields appear to be bottoming. While the Fed remains consistent in communicating its…

Last year we created two baskets of stocks to capture the economic reopening theme by constructing a long/short pair trade. This year, we crystallized 21.5% in gains from that pair trade and subsequently reopened it. Today, we take a new angle at the economic reopening theme and pit “Back-To-Work” laggards against leaders. First, we filtered for well-behaved cyclical industries among all the sectors and sub-sectors we cover. We define a well-behaved cyclical industry as one that trailed the SPX from February 19, 2020 to March 23, 2020; and then outpaced the broad market from March 23, 2020 to today (all computations are in relative to SPX terms). Chart 1
How To Play The Reopening Trade Now Using US Equity Baskets
How To Play The Reopening Trade Now Using US Equity Baskets
Such filtering excluded all of the defensive & cyclical industries that outperformed the market during the recession, and it also excluded those industries that were too damaged by the pandemic and could not recover above the March 23rd trough level (for example, airlines) always in relative terms. The appendix on page 4 has a stylized depiction of our analysis. In total 27 industries survived the filtering. We then computed what is the minimum percentage increase required in order for each group to recover to its February 19 level, and then calculated the difference between that required increase and the one that actually materialized. A positive value signifies that the sector climbed above its February 19 level, whereas a negative value means that the sector still has not recovered. Chart 1 displays the results. Our rationale is as follows: should the economic recovery and normalization themes continue unabated as we expect, then the risk/reward trade-off of owning the “laggards” is greater than the “overshooters”: the former have ample upside potential left, whereas the latter are already discounting a lot of good news. We deem there is an exploitable opportunity within the reopening theme and today we recommend investors institute a new long reopening industry “laggards”/short “overshooters” pair trade (excluding the GICS1 sectors). Chart 2
How To Play The Reopening Trade Now Using US Equity Baskets
How To Play The Reopening Trade Now Using US Equity Baskets
Chart 2 plots the ratio of the two baskets against the ISM manufacturing prices paid sub-component and the 10-year US Treasury yield and supports our rationale that the “laggards” have a long runway ahead versus the “overshooters”. Finally, as a proxy for this trade we also include tickers for the largest stock in each sub-sector (excluding GICS1). Laggards: V, BLK, HCA, MCD, HON, AXP, JPM, COP, PSX, MAR, SLB. Overshooters: EMR, BLL, LIN, NUE, UNP, HD, DHI, CAT, MS, J, TSLA, AMAT. We are aware of some minor conflicts between the “Overshooters” and the “Back-To-Work” basket and also versus our current recommendations table, but we still recommend investors put on this trade pair trade. Bottom Line: Institute a new long USES “Laggards” basket/short USES “Overshooters” basket pair trade. Appendix
How To Play The Reopening Trade Now Using US Equity Baskets
How To Play The Reopening Trade Now Using US Equity Baskets
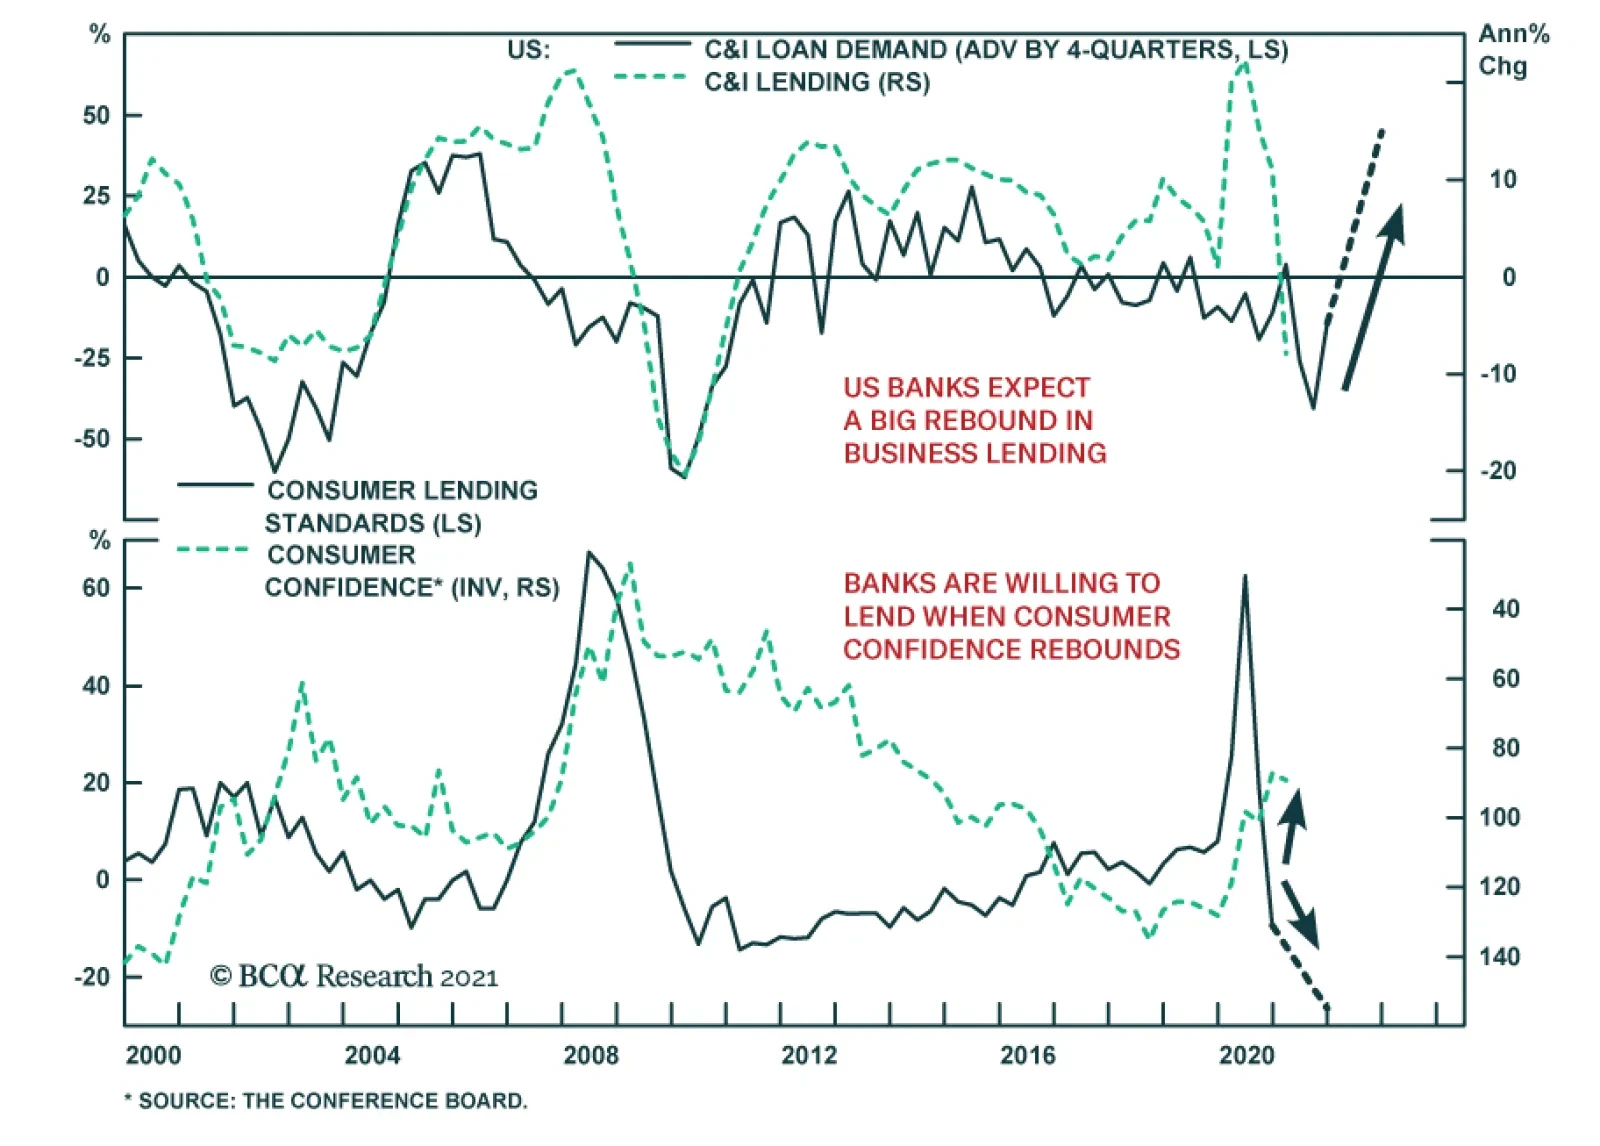
BCA Research’s Global Fixed Income Strategy service delved into the recent Fed’s Senior Loan Officer Survey (SLOS). The net percent of domestic respondents to the SLOS that tightened standards for commercial and industrial (C&I) loans (measured as an…
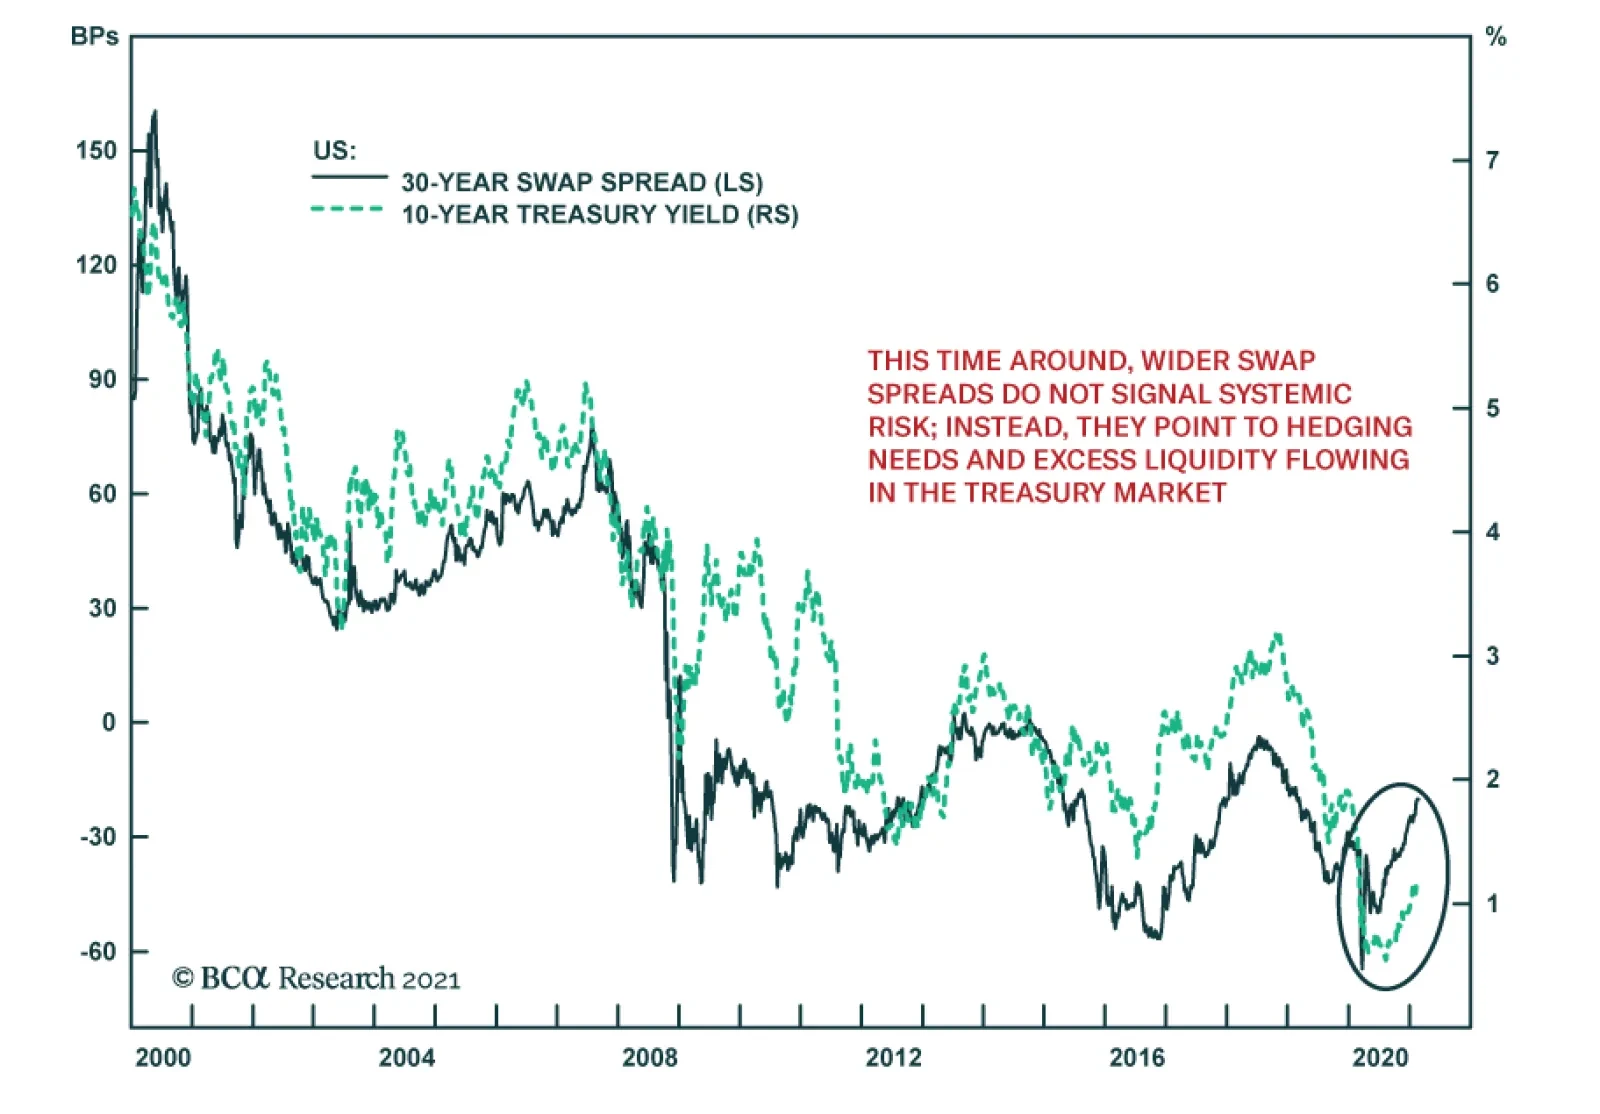
The widening in US swap spreads has garnered attention among many market commentators. The fear is that like in 2008 or in March 2020, wider swap spreads foretell major market troubles in the near future. While a correction remains likely in an…
Dear Client, This week, the US Bond Strategy service is hosting its Quarterly Webcast (today at 10:00 AM EST, 3:00 PM GMT, 4:00 PM CET, 11:00 PM HKT). In addition, we are sending this Quarterly Chartpack that provides a recap of our key recommendations and some charts related to those recommendations and other areas of interest for US bond investors. Please tune in to the Webcast and browse the Chartpack at your leisure, and do let us know if you have any questions or other feedback. To view the Quarterly Chartpack PDF please click here. Best regards, Ryan Swift, US Bond Strategist
A Positive For The Rally
A Positive For The Rally
In the last week’s Strategy Report we highlighted how the often-heavy-lifting tech sector’s profit growth contribution to calendar 2021 SPX earnings is giving way to other GICS1 industries. Historically, the tech sector commanded the lion’s share of profit explanation for the SPX, but not in 2021. In fact, the S&P IT sector is ranked 4th in terms of contribution to overall SPX profits, behind industrials, financials and consumer discretionary (see chart). Additionally, the tech sector no longer sports an earnings weight similar to its market cap weight as it has run ahead of itself. This is also the case because the rest of the sectors are playing catch up this year as the US economy is slated to reopen on the back of the herculean inoculation efforts (profit weight and mkt cap weight columns, Table 1). In fact, the metric of market cap weight minus the sector’s earnings weight is a rough valuation measure highlighting that tech stocks are 5x to 10x more expensive than their deep cyclical peers (industrials, materials and energy, last column, Table 1). Bottom Line: A broader-based participation in the equity rally is a healthy backdrop for the cyclical return prospects of the SPX. Table 1
A Positive For The Rally
A Positive For The Rally
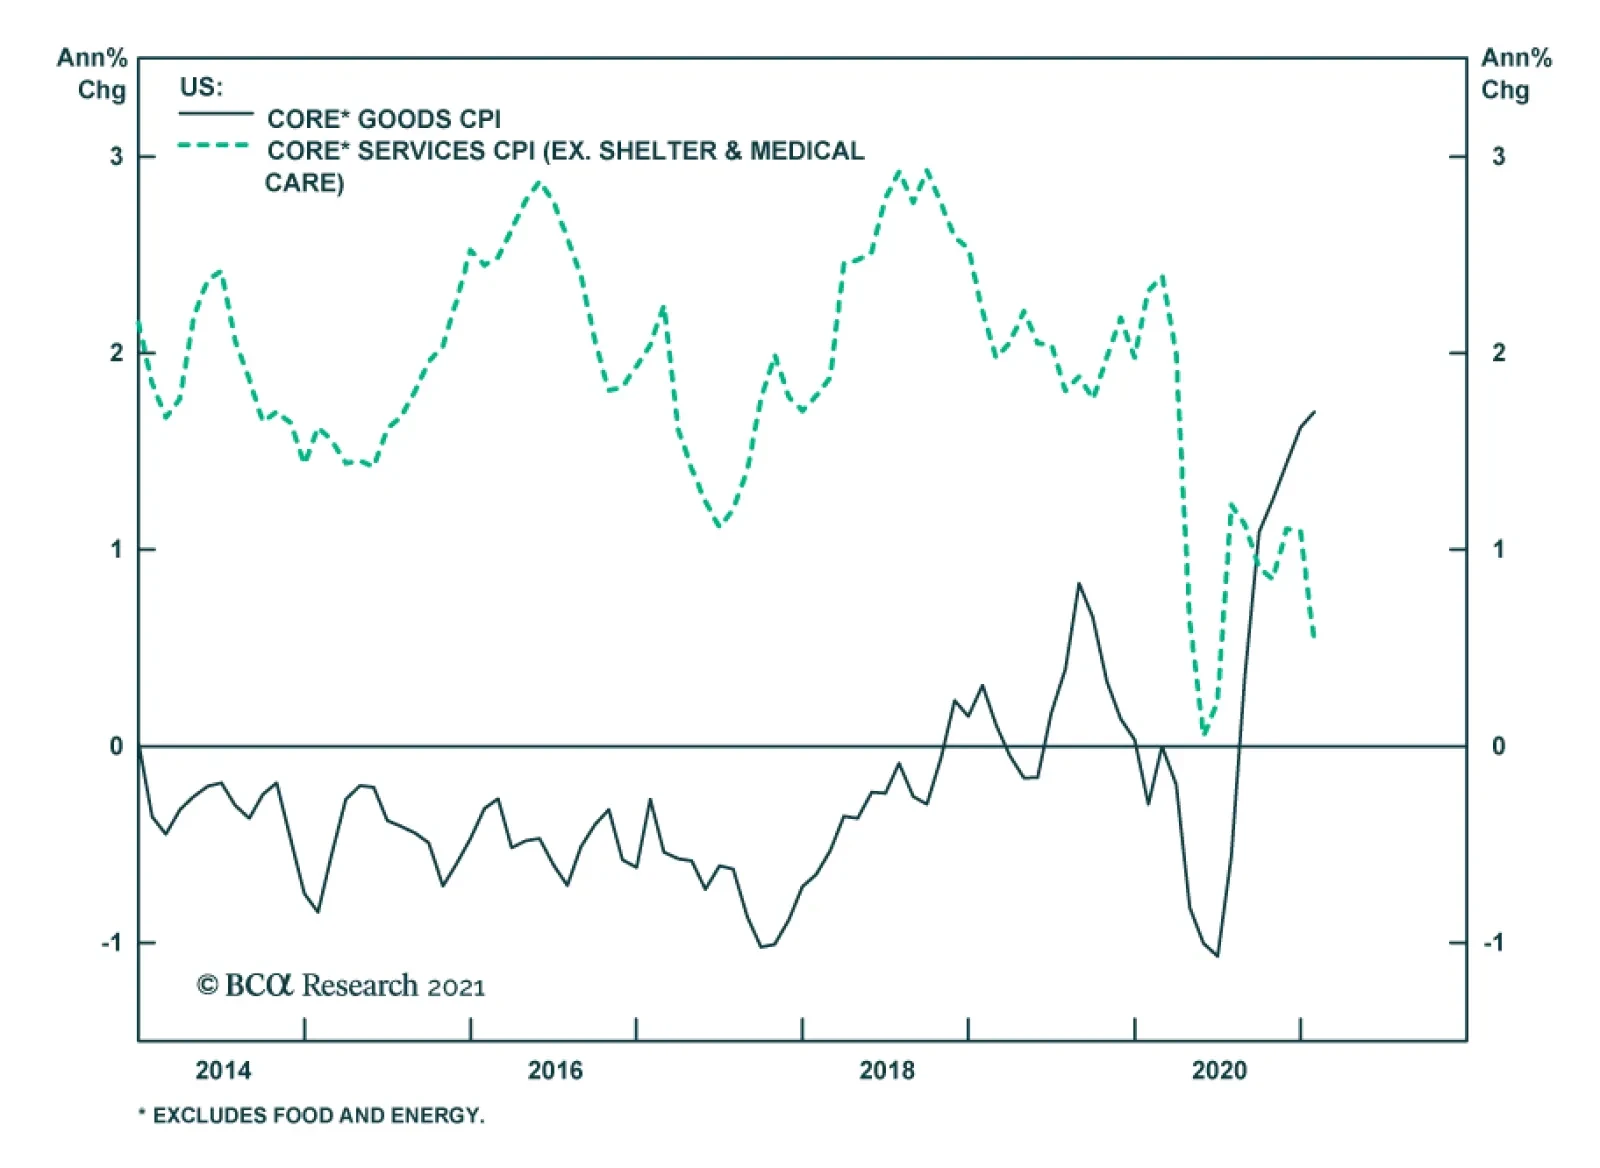
BCA Research’s US Investment Strategy service concludes that fiscal stimulus may give rise to upward inflation pressures, but not in the near term. Slack in the market for service employees cannot be absorbed before the end of the year and goods disinflation…
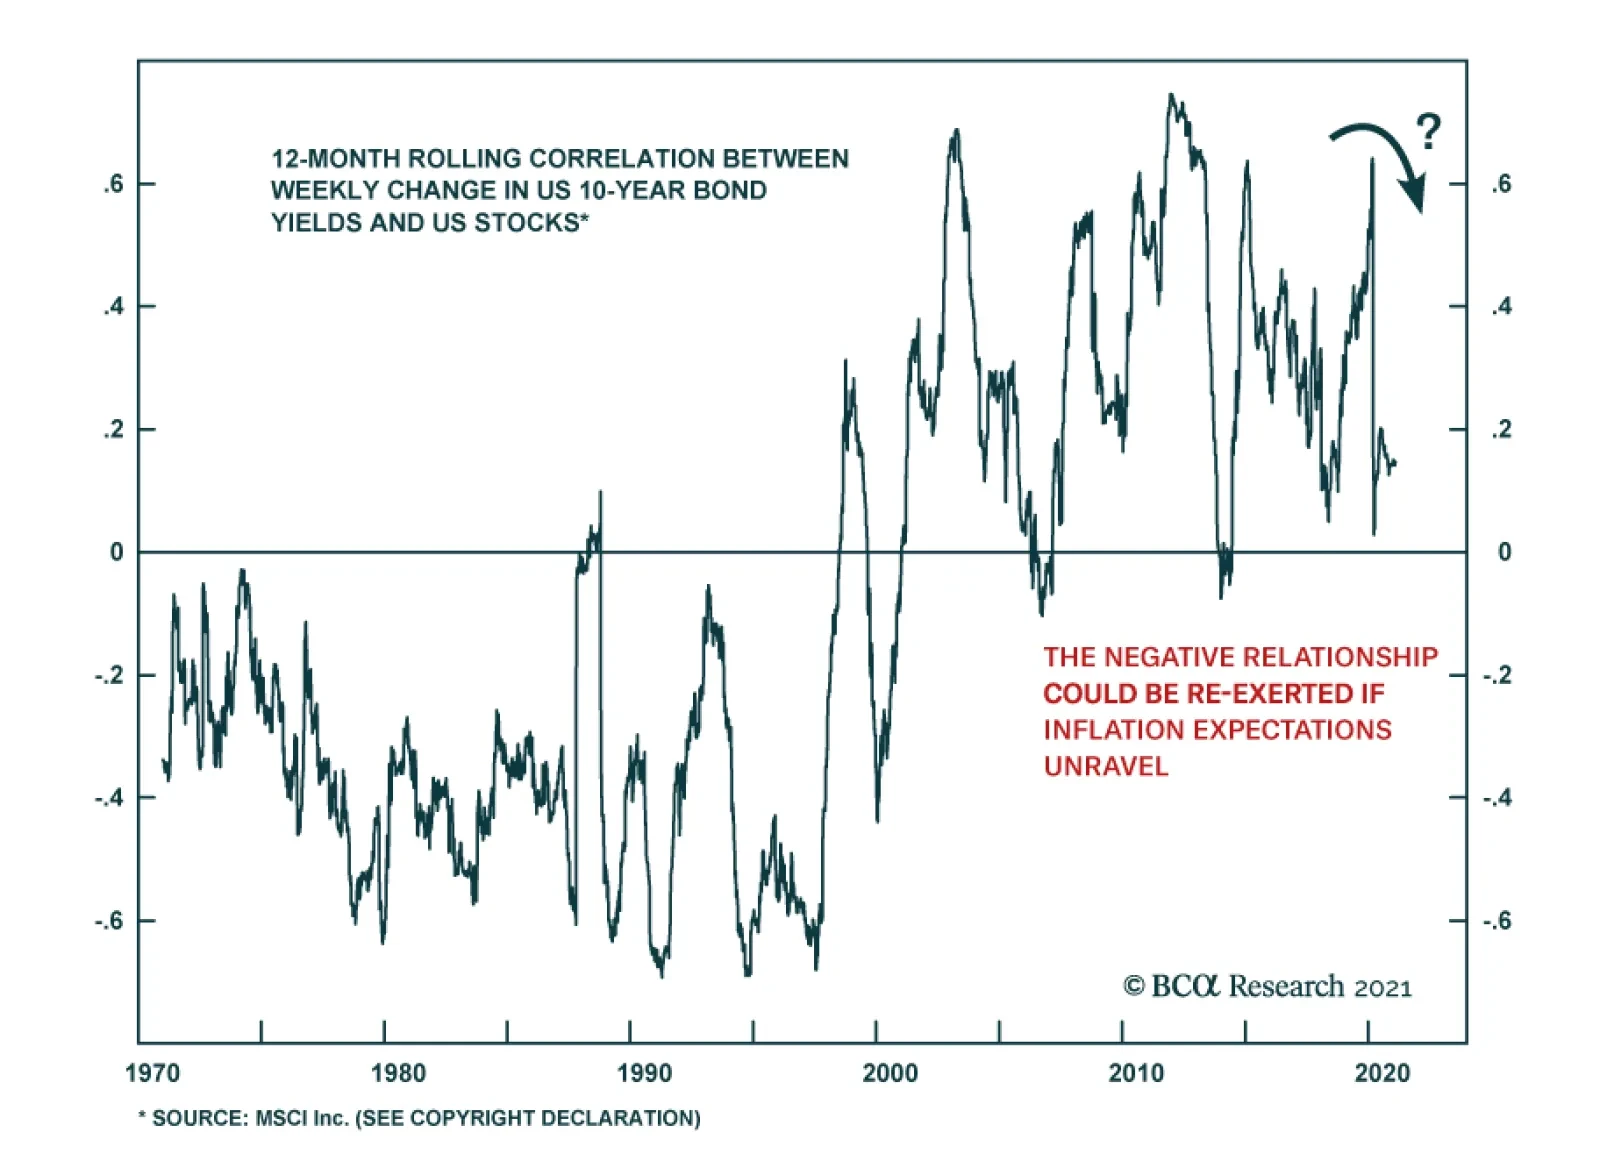
Last week, we observed that evidence from the past decade suggests that higher yields are not always a risk to stock prices, as long as the yield increase reflects favorable economic conditions, which also push up the dividend growth rate. Evidence from a…
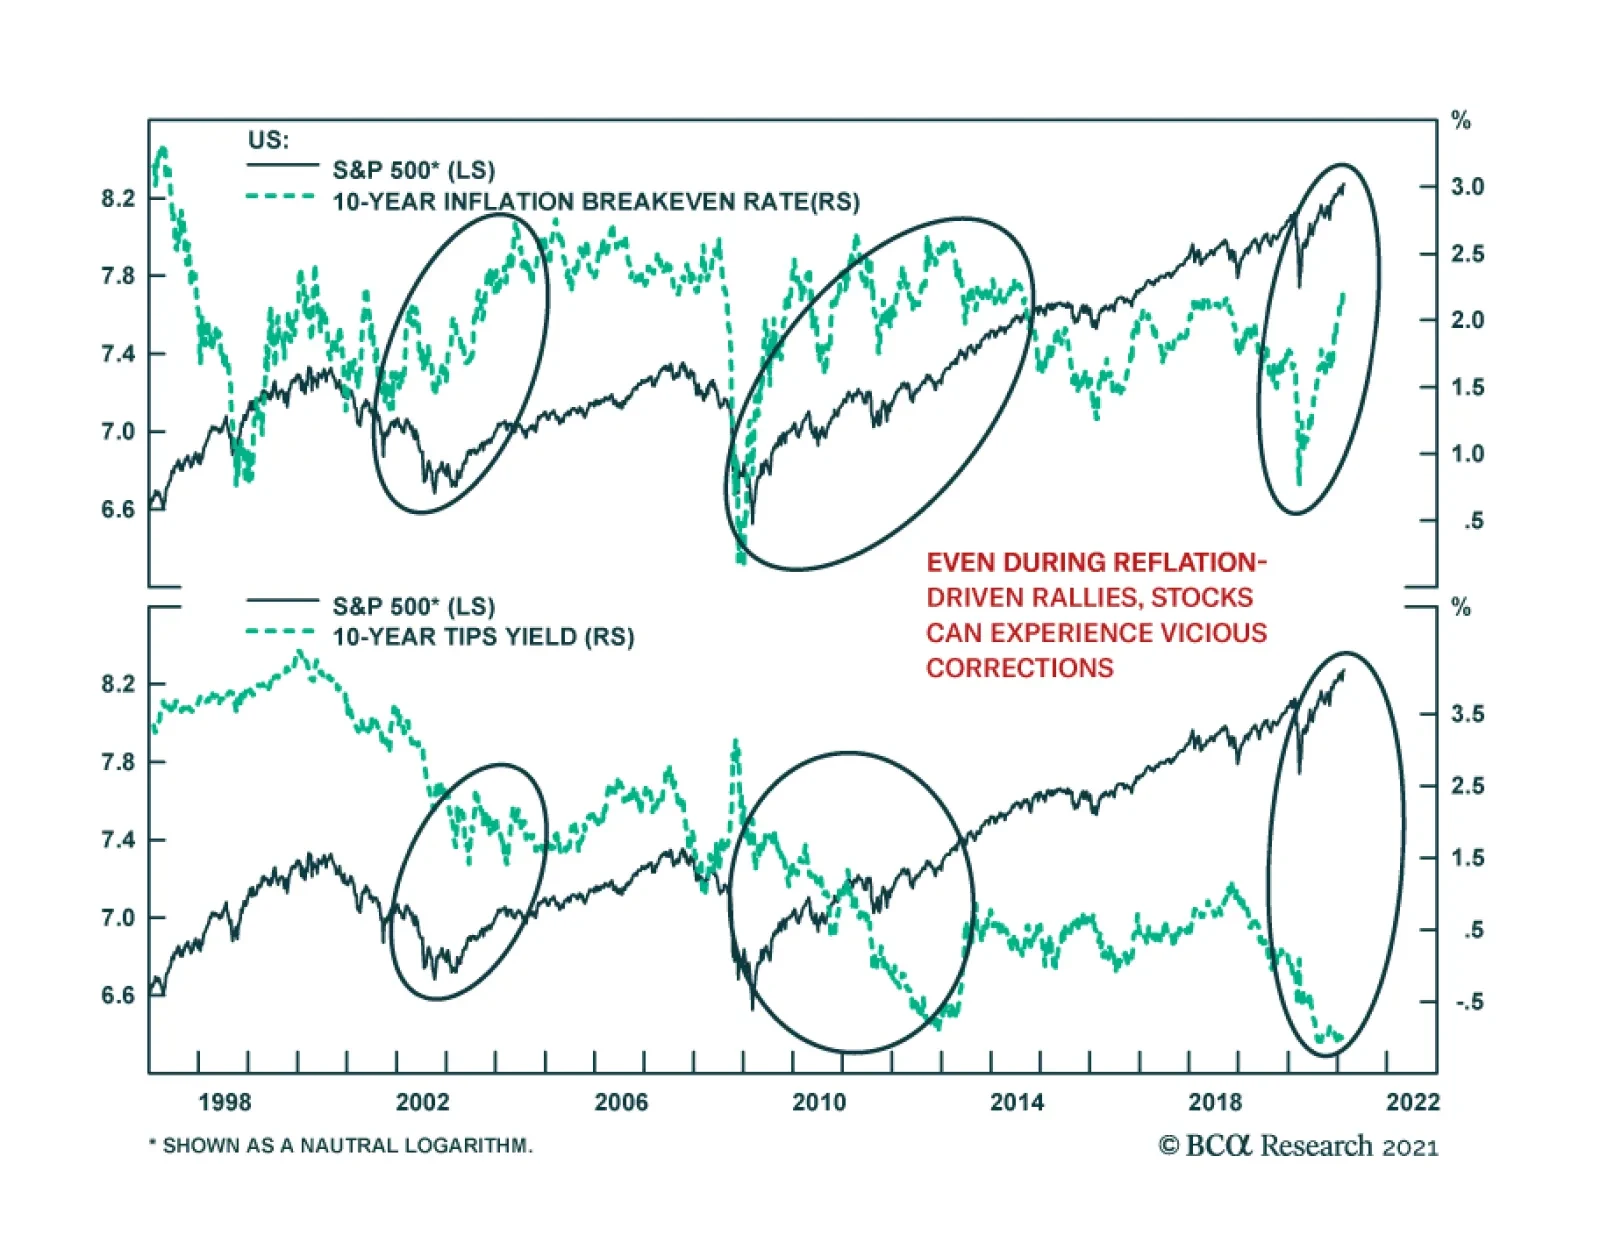
Despite a decline in economic surprises since July, global and US equities continue to power ahead, lifted by record flows. Reflation remains the driving force behind this rally; however, investors should not ignore the many lurking dangers. Reflation is…
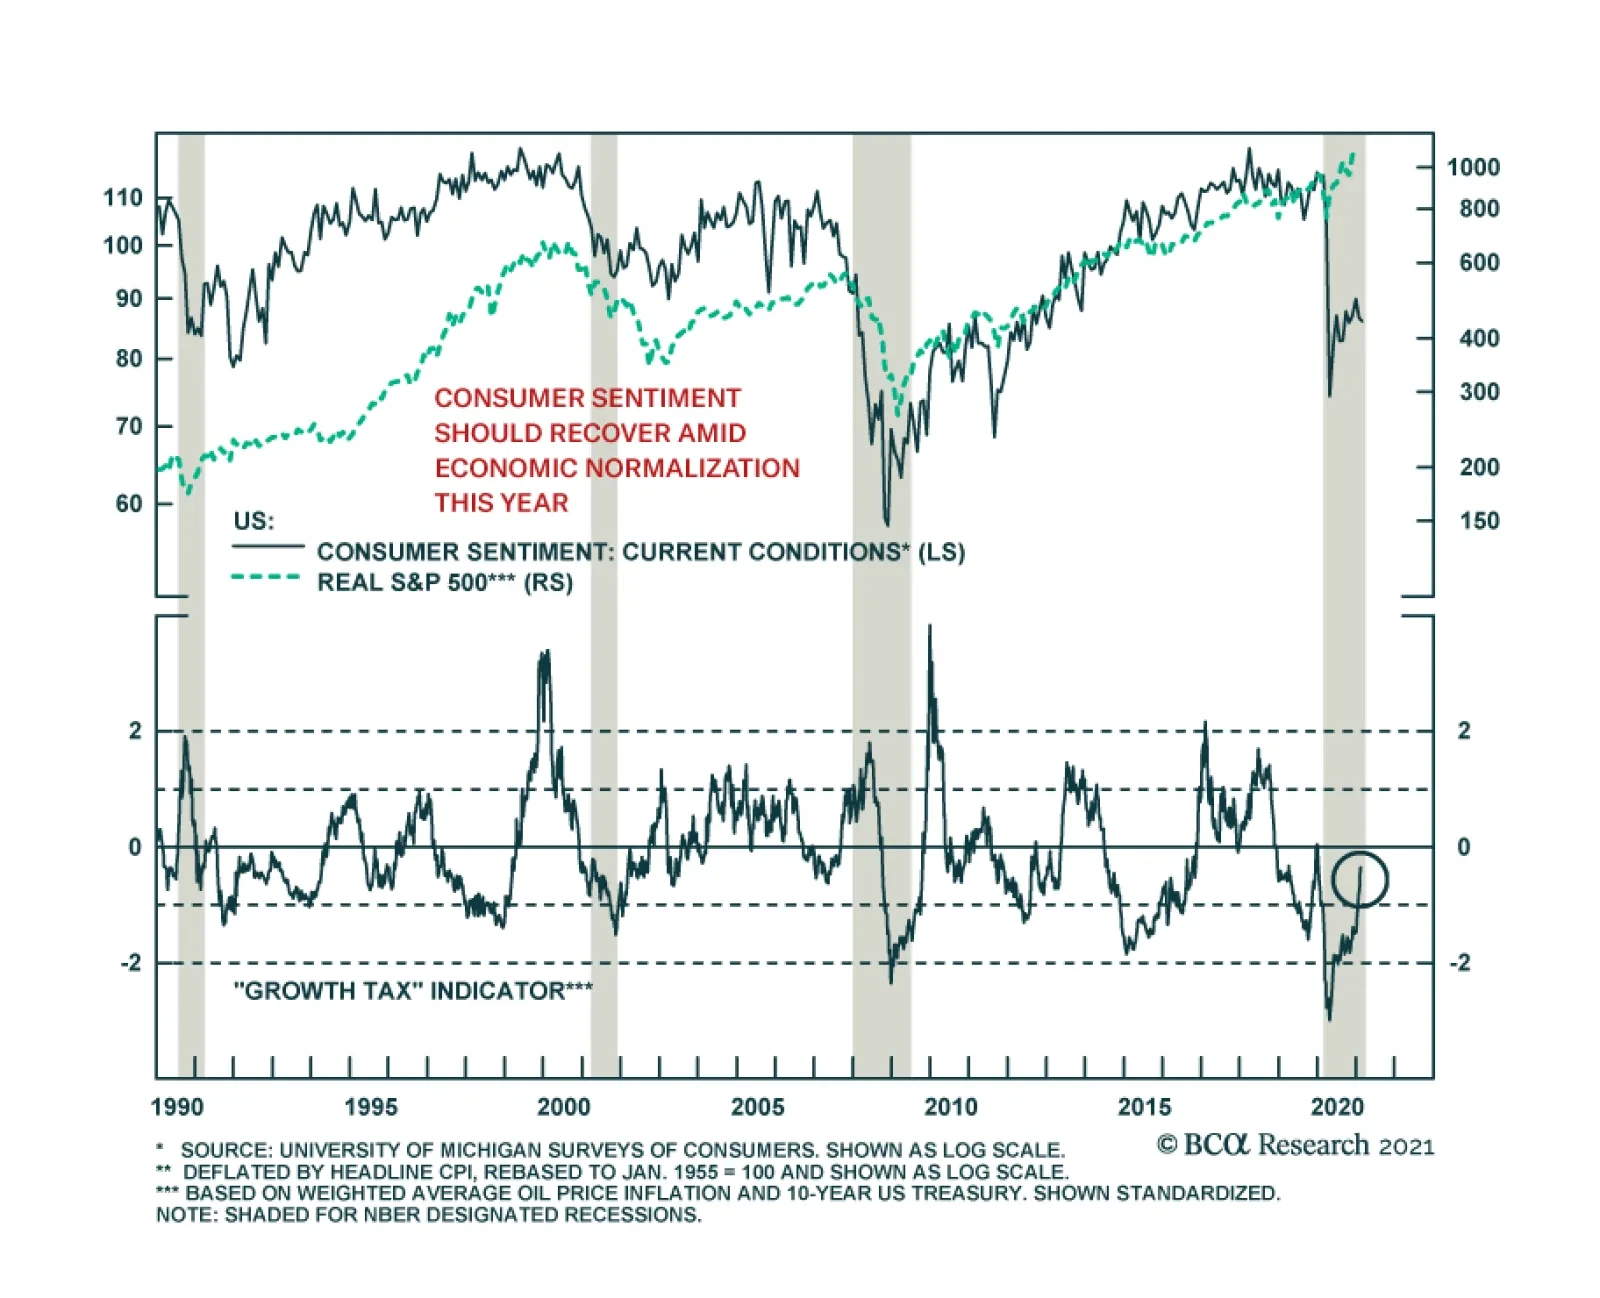
The preliminary release from the University of Michigan’s Survey of Consumers was a significant disappointment, revealing a large decline in sentiment in February. The headline index fell 2.8 points to 76.2, the lowest since August and significantly below…