United States

Overweight Last April following the massacre in oil prices and the consequent slam in the S&P oil & gas exploration & production (O&G E&P) group, we created the USES Crash Indicator to try to forecast a likely recovery path in this index; today we update our analysis. After a hiccup in late-2020, the relative share price ratio is back on track and will likely continue its ascent, especially given crude oil supply/demand dynamics. Odds are high that oil prices will remain upward-sloping as the EIA forecasts demand outpacing supply growth over the course of 2021 and 2022 (not shown). Oil oversupply has been a major drag on oil prices to the point that E&P companies had to put artificial breaks on production. Should these breaks remain in place at the same time as the global economy reopens as we continue to expect, oil prices have further to run. The implication is that rising crude oil prices will pave the way for sustained gains in the S&P O&G E&P relative share price ratio. Bottom Line: Stay overweight the S&P O&G E&P index. The ticker symbols for the stocks in the index are: BLBG: S5OILP – COP, EOG, HES, COG, MRO, APA, PXD, DVN, FANG. Chart 1How It Started...
Back On Track
Back On Track
Chart 2...How It Is Going
Back On Track
Back On Track
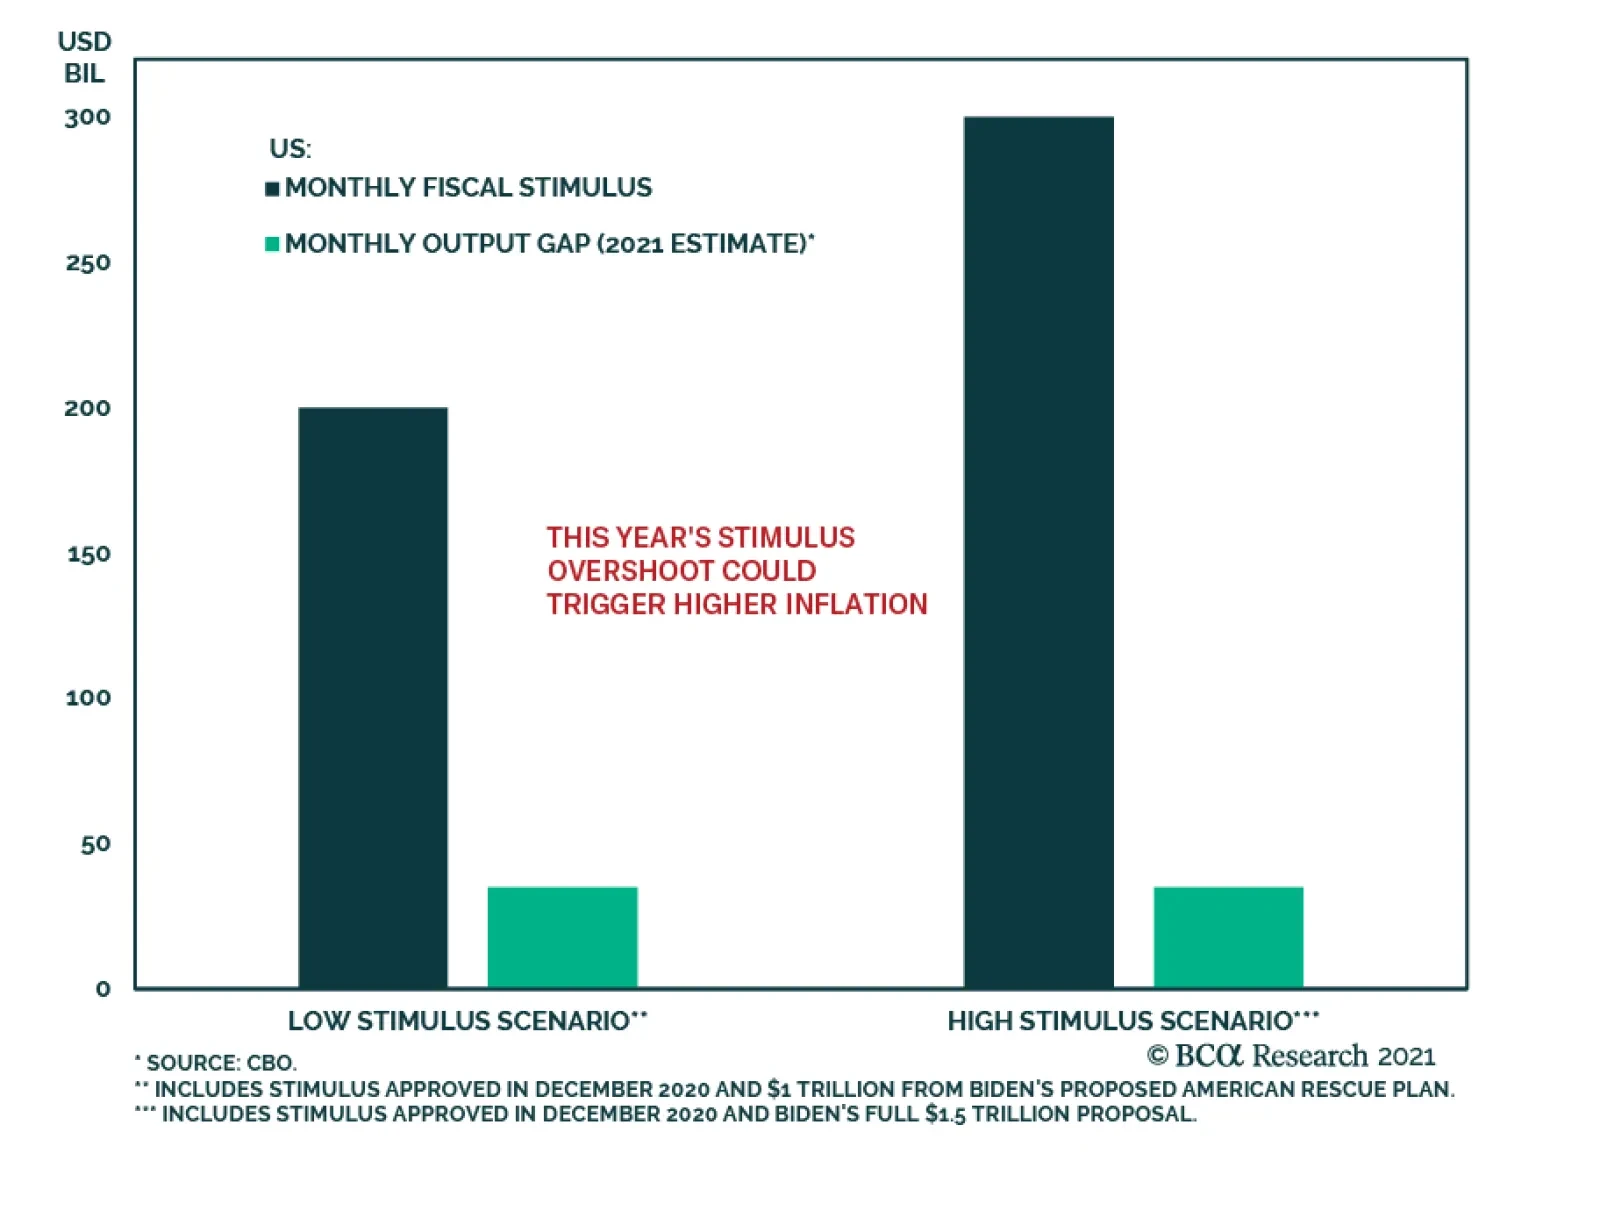
Earlier this month, the US Congressional Budget Office updated its 10-year economic projections in which it revised up the 2021 GDP estimate, and to a lesser extent potential output. As a result, the implied monthly output gap estimate – calculated as the…

Expecting higher US yields is now a consensus call among investors, yet, it is a view that remains valid on a cyclical basis. The Fed’s reflationary efforts, as well as the fiscal stimulus coming out of Washington, will facilitate a steepening of the yield…
Goldilocks And The Three Bears
Goldilocks And The Three Bears
The S&P 500 is clawing back its losses after it hiccupped last week correcting approximately 5% from peak-to-trough as the dust from the GME/WSB saga is settling down. As we showed in this Monday’s Strategy Report, there is a natural monetary tightening occurring via the financial markets that is likely to test the Fed’s resolve. Namely, whenever all three assets, the US dollar, the 10-year US Treasury, and crude oil rise together, the SPX suffers a pullback (see chart). Year-to-date, two out of these three variables are firing warning shots, and given rising odds of a US dollar reversal, the tightening trio is signaling at least some equity market indigestion. Bottom Line: The simultaneous rise in the US dollar, the 10-year US Treasury yield, and crude oil all signal that equity investors should stay vigilant.
Highlights We are hesitant to call a top to the volatility spike just yet. The US dollar is experiencing a counter-trend bounce. We also see political and geopolitical risks flashing yellow. House Democrats are drafting a reconciliation bill that will remind financial markets of looming tax hikes. President Biden faces imminent tests on China/Taiwan and Iran. The tech sector has bounced amid the setback to the reflation trade. Over the long run the Biden administration’s reflationary agenda suggests tech will no longer outperform. Biden’s regulatory risk to the tech sector is not immediate but still a downside risk. No major piece of bipartisan legislation is forthcoming but the Department of Justice, FCC, and FTC can bring negative surprises. We are hitting pause on our S&P trades until Biden passes some early hurdles. Feature Volatility has room to run, judging by past post-crisis periods (Chart 1), and this time we are especially concerned with brewing geopolitical risks, namely the US-China tensions over the Taiwan Strait. This geopolitical risk comes on top of the short squeezes and battles that retail investors are having against hedge funds all over the market. China is reminding the world of its red line against Taiwanese independence while testing the newly seated Joe Biden administration over whether it will seek a technological blockade against the mainland. Economic and trade policy uncertainty have collapsed but they would surge in the event of a crisis incident (Chart 2). While war is not likely, it is possible, so we need to see the Biden administration defuse the situation and pass this first test before we are willing to take on more risk on a tactical three-to-six-month time frame. Chart 1Volatility Can Go Higher Still
Volatility Can Go Higher Still
Volatility Can Go Higher Still
Chart 2Uncertainty Down But Beijing Testing Biden
Uncertainty Down But Beijing Testing Biden
Uncertainty Down But Beijing Testing Biden
Chart 3Biden's Approval Starts At 55%
Big Tech Regulation Is A Slow Boil – But A Boil Just The Same
Big Tech Regulation Is A Slow Boil – But A Boil Just The Same
President Biden’s average approval rating in his first two weeks in office is 55%, right where former President Trump’s disapproval rating would have suggested (Chart 3). This is a significant but not extravagant improvement in political capital for the White House. Our Political Capital Index shows Biden’s position as moderate-to-strong (Table 1). Table 1Biden’s Political Capital Moderate-To-Strong
Big Tech Regulation Is A Slow Boil – But A Boil Just The Same
Big Tech Regulation Is A Slow Boil – But A Boil Just The Same
The implication is that he still has a chance of passing his $1.9 trillion American Rescue Plan as a bipartisan bill with 10 Republican senators, a feat that would likely lower the topline value to around $1.3 trillion (Republicans proposed $618 billion) and exclude an increase in the federal minimum wage to $15 per hour. There is also a strong swing of independents in favor of Democrats in the opinion polling, in the wake of the incident on Capitol Hill on January 6, despite the fact that Republican and Democratic party identification are both stuck at around 30% — meaning that the Biden administration does have something to gain by appearing bipartisan (Chart 4).1 Republicans might cooperate to staunch the bleeding of their own support. Even Republicans approve of stimulus amid the pandemic and they would later be able to oppose Biden’s more controversial proposals with better optics having demonstrated bipartisan intent at the outset. However, House Democrats are already proceeding with a budget resolution, the first step in the budget reconciliation process that enables them to bypass Republicans entirely and get almost everything they want (Diagram 1). Chart 4Will Independents Keep Breaking Toward Democrats?
Will Independents Keep Breaking Toward Democrats?
Will Independents Keep Breaking Toward Democrats?
Diagram 1Timeline Of Impeachment, Budget Reconciliation, And Regular Legislation
Big Tech Regulation Is A Slow Boil – But A Boil Just The Same
Big Tech Regulation Is A Slow Boil – But A Boil Just The Same
Biden’s political capital should strengthen over the next year as the vaccine rollout improves and the economy comes roaring back. Official economic projections suggest that growth will glide solidly above potential until 2026 and that the output gap will close by 2024 (Chart 5). These estimates will be disappointed in various ways, of course, but in the near-term the risk is to the upside as they do not include Biden’s proposed $1.9 trillion rescue plan or his remaining, post-COVID agenda afterwards, which could cost anywhere from $3.7-$6.4 trillion over a ten-year period.2 The economy will be at less risk of relapsing than of overheating. This is especially true given the Federal Reserve’s new average inflation targeting strategy, which will discourage rate hikes till next year at the very earliest (and, from a political point of view, we would think 2023). Looking at the chart, Biden’s economic backdrop is far more propitious than that of his former boss Barack Obama’s back in 2009. Biden’s political momentum is therefore sustainable when it comes to the two budget reconciliation bills he wants to pass this year and next year. Republican internal divisions will help him. These were highlighted this week by Republican National Committee Chair Ronna McDaniel’s criticism of former New York Mayor Rudy Giuliani’s claims of voter fraud after the election and Senate Minority Leader Mitch McConnell’s recent scathing criticism of controversial pro-Trump freshman House member Marjorie Taylor Greene of Georgia. Republicans are only beginning their internal struggle and it is not certain that it will be resolved in time for the 2022 midterm elections. This is another reason to think that Biden’s political capital will be sustained and that moderate Republicans might assist with some Democratic legislation. The risks to Biden’s momentum stem from foreign policy (China, Iran, Russia), rapidly emerging financial instability, his party’s attempts at social control, and any major (not minor) negative developments involving the still-running pandemic and vaccine rollout. Chart 5US Economic Outlook Over Biden’s Term
Big Tech Regulation Is A Slow Boil – But A Boil Just The Same
Big Tech Regulation Is A Slow Boil – But A Boil Just The Same
Macro Reflation Says Stay Underweight Tech The tech sector experienced a manic phase last year when COVID-19 struck and lockdowns kept consumers at home with nothing to do but work, shop, and stare at their phones. The big five companies – Apple, Microsoft, Google, Amazon, and Facebook – together witnessed an extraordinary run up relative to the other 495 companies in the S&P index that has since peaked and dropped off (Chart 6). Chart 6Fade The Big Tech Bounce Over Long Run
Fade The Big Tech Bounce Over Long Run
Fade The Big Tech Bounce Over Long Run
Tech stock market capitalization accounts for 34% of American economic output – an extreme sign of over-concentration at a time when the market is generally inflated, according to the Buffett Index of stock market cap relative to GDP (Chart 7). Tech outperformance rests on strong earnings growth – supercharged due to the COVID crisis – as well as the secular fall in bond yields as a result of the global backdrop of excessive savings, low inflation, and scarce growth. Tech stocks are especially sensitive to bond yields because markets are projecting their earnings far into the future, as our colleague Mathieu Savary explained back in August. Ultra-dovish monetary policy with zero interest rates for longer and longer time frames is a perennial gift to these companies (Chart 8). Chart 7Buffett Indicator Says Big Tech Too Big
Buffet Indicator Says Big Tech Too Big
Buffet Indicator Says Big Tech Too Big
Chart 8Big Tech Maxing Out As Bond Yields Rise?
Big Tech Maxing Out As Bond Yields Rise?
Big Tech Maxing Out As Bond Yields Rise?
The catch is when and if growth and inflation expectations pick up. Even during the Dotcom bubble in the 1990s, the tech sector could not withstand rising interest rates (Chart 9). Eventually higher inflation will translate into central bank hikes and rising real interest rates – which should be very bad for tech as future cash flows lose value. Rising rates increase the cost of capital, while cyclical industries perform better in high growth environments with rising commodity prices. A recovery of inflation is becoming a more visible risk to investors over the coming few years. Even though unemployment is still elevated, and the output gap negative, the sea change in fiscal policy is likely to close this gap quickly and put upward pressure on expectations and prices. It will still take time to close the gap but each new dose of government spending on top of what is needed to plug the gap in demand due to the pandemic-stricken service sector will accelerate the time frame in which the labor market will tighten and price pressure will return. Investors are increasingly wary of this inflation risk as it is the logical consequence of the new combination of extreme monetary and fiscal accommodation. Earnings in the tech sector relative to the rest of the market have also peaked – and did not exceed their previous high point in 2010 despite the uniquely favorable backdrop (Chart 10). The big five have nearly saturated a lot of markets which raises the possibility that if the policy backdrop darkens, then they will see earnings disappointments. The Biden administration’s plan to raise the corporate tax rate to 28% and impose a 15% minimum tax on company book income would come as a double whammy for tech earnings, as they are relatively more exposed to increases in effective tax rates than other sectors. Chart 9Big Tech Wants Deflation, Big Government Wants Reflation
Big Tech Wants Deflation, Big Government Wants Reflation
Big Tech Wants Deflation, Big Government Wants Reflation
Chart 10Big Tech Earnings Outperformance Hit Ceiling Amid Pandemic
Big Tech Earnings Outperformance Hit Ceiling Amid Pandemic
Big Tech Earnings Outperformance Hit Ceiling Amid Pandemic
Finally, there is the long building problem of regulatory risk, as Americans have clearly become more concerned about Big Tech’s power and influence over their daily lives and politics. Here we do not think the Biden administration poses an immediate threat of frontal legislative assault, but we do think the end game is greater regulation, including tougher enforcement from antitrust agencies. Combined with geopolitical risk from Europe and other countries also seeking to tax and regulate these companies, the recent global semiconductor shortage, and the potential for a Taiwanese tech blockade, the political risk is clearly to the downside. Bottom Line: The macro backdrop has darkened for the tech sector. With governments turning more reflationary via a sea change in fiscal policy on top of ultra-easy monetary policy, inflation expectations should recover and inflation-sensitive sectors like tech should underperform. This risk is clear despite the fact that inflation requires the labor market to heal first. Any political, geopolitical, or regulatory risks would only further undermine the case for tech sector outperformance. Tech, Polarization, And Disinflation A critical question for investors is the relationship between US political polarization, the tech sector, and the disinflationary macroeconomic context that has proven so beneficial for Big Tech’s stock market performance. If polarization leads to gridlock, austerity, and disinflation, then tech can continue to enjoy the policy environment. But if polarization subsides, or if it coexists with a reflationary backdrop – as is the case today – then tech faces a new risk. It is fair to hypothesize that the rise of Silicon Valley and especially of social media has something to do with the explosion in US polarization over the past three decades. A simple chart of the S&P 500 alongside our polarization proxy – which measures the difference in presidential approval based on party – suggests that polarization could have some connection with tech sector outperformance (Chart 11). This is not a coincidence but the causality may work differently than some assume. The first period of tech sector outperformance, which rested on the “peace dividend” period of hyper-globalization, strong growth, strong dollar, low inflation, and technical innovation, occurred during the explosion of US polarization in the wake of the Cold War, when the US’s common enemy fell and the country’s political parties turned to do battle with each other for global supremacy. The structural changes of Reaganomics and NAFTA coincided with the political battles of the Republican revolution of 1994 and Bill Clinton’s sex scandal and impeachment. This heady period came to a peak in 2000 when the dotcom bubble burst and the US suffered its first contested election since 1876. Essentially globalization led to a deflationary backdrop that favored tech but also triggered the political struggle within the US for the spoils of victory in the Cold War. Chart 11Big Tech Likes Polarization And Gridlock
Big Tech Likes Polarization And Gridlock
Big Tech Likes Polarization And Gridlock
The second period of tech sector outperformance emerged from the Great Recession, still higher wealth inequality, and the slow-burn economic recovery of the 2010s. The disinflationary environment and dollar bull market proved beneficial to the tech companies. In this case globalization’s deflationary effects continued but were compounded with US household deleveraging, which was far more malicious for the American middle class. Crucially, polarization created gridlock in Congress from 2010, preventing the US from pursuing a robust fiscal policy in the wake of the crisis that might have led to a more rapid recovery. Instead an extended disinflationary environment fed into social unrest and populism. While public animus naturally turned against Wall Street and the Big Banks in the wake of the financial crisis, the Dodd-Frank financial reform helped to pacify the public’s anger (though not entirely – and financial regulation is gradually reemerging as a relevant political risk). As the financial crisis faded from memory, but the low-growth, disinflationary environment continued to take a toll on households, an angry electorate began to freely express itself in the digital realm. Tech companies were happy to ride this wave and outperformed other sectors. As the backlash continued mounting, tech companies failed to rein in the angry userbase they had cultivated, and now they are staring at massive regulatory and legal risks from policymakers. Both Barack Obama and Donald Trump used Twitter and social media as a tool to establish direct engagement with their political base, much as Franklin Delano Roosevelt had used the radio and the fireside chat. This rising political heft ultimately made the companies conspicuous as conservatives blamed them for supporting the Obama administration (and Clinton campaign) while liberals especially blamed them for getting Trump elected. The Trump saga in particular gave rise to the so-called “tech-lash,” or backlash, as the companies’ core base of young, urbanized, cosmopolitan, and international users called on the tech companies to stop the spread of Russian propaganda, or other propaganda they disagreed with, and undertake socially progressive causes. Meanwhile the older, conservative, and rural population doubted that Russian interference caused the 2016 election result and sensed that the tech companies’ content moderators might not be all that scrupulous regarding the difference between conservative views and Russian information warfare (Chart 12, top panel). In combination with the heated election year campaigning, the pandemic and the backlash against lockdown, tension in the virtual world came to a peak last year and spilled out into the real world. This all came to a head with Twitter and Facebook first censoring and then banning President Trump from their platforms amid his claims of voter fraud and the riot on Capitol Hill. Chart 12Big Tech Not The Chief Driver Of Polarization
Big Tech Regulation Is A Slow Boil – But A Boil Just The Same
Big Tech Regulation Is A Slow Boil – But A Boil Just The Same
Two major policy changes have occurred that threaten to reverse this macro backdrop. First, as a result of the 2020 crisis the Democrats won control of the White House and Congress and can now pass their mammoth spending agenda, which goes beyond pandemic relief to expanding the role of government in American economy and society – including by reflating the economy and imposing higher taxes on corporations, both of which threaten to undermine the tech sector’s outperformance. Second, China’s secular slowdown, reduction of trade dependency, and divorce from the US economy have undermined hyper-globalization. The Biden administration is pursuing on-shoring and China restrictions albeit to a lesser extent than its predecessor. If technological advance and social media cause political polarization, then these policy shifts may not last long or have a durable macro effect. But technology and communication tools have advanced throughout history regardless of whether polarization in any given country was rising or falling. Older people are the most partisan in the US yet they are the least enthusiastic users of social media (Chart 12, bottom panel). Tech and social media have proliferated across the world and yet polarization has fallen in Germany, Australia, Sweden, and other economies even as it has risen in the United States and arguably the United Kingdom (Chart 13). If social media enabled populist outcomes like Trump and Brexit, then why did populism fall short in France, Spain, Italy, and Germany? Social media participation thrived on the rise of polarization through the 2000s and 2010s but it exacerbated the problem – and once polarization erupted in the form of an anti-establishment presidency, Russian interference, the Cambridge Analytica scandal, and real world riots and social unrest, the tech platforms found themselves in the crosshairs of both of the political factions and the various politicians trying to appease their anger. Silicon Valley and the FAANGs operate in a power struggle – not merely a politicized environment – that is here to stay and will direct their attention away from their primary business and toward paying for lobbyists in Washington, Brussels, and elsewhere. This in itself is a danger to their business models even if it were not the case that the macro and policy backdrop is less supportive. Bottom Line: The reflationary fiscal and policy backdrop will continue in the coming years, a macro headwind for tech outperformance, while political risks to the tech sector have grown substantially. Chart 13Polarization Falls In Many Countries Despite Social Media
Big Tech Regulation Is A Slow Boil – But A Boil Just The Same
Big Tech Regulation Is A Slow Boil – But A Boil Just The Same
Congress In Check But Regulatory Risk Persists Democrats and Republicans have a different and opposed set of grievances against Big Tech, which is likely to prevent comprehensive legislation from developing anytime soon. But legislation is still possible, and in the meantime risks will come from emboldened regulators. Based on the House judiciary hearing in July 2020, Democrats are concerned with content moderation and market concentration. They want to fortify their recent gains in preventing social media companies from aiding what they regard as the spread of seditious and libelous material or propaganda that favors the anti-establishment Trumpist right wing. Judging by the Senate Republicans’ hearings in October and November 2020, Republicans are primarily concerned with content moderation– i.e. preventing conservatives from being de-platformed, and conservative views from being censored. Republicans are less concerned about market concentration, i.e. accusations of monopolistic and anti-competitive behavior.3 Now that the social media companies have more or less thrown in with the Democrats on content moderation, Democratic priorities are likely to shift to antitrust and anti-competitive behavior. But serious changes would require either abolishing the filibuster in the Senate (which is not happening for the time being due to last month’s bipartisan power-sharing arrangement) or winning over 10 Republicans. This will be difficult, especially when it comes to the Democratic belief that a generational shift in antitrust doctrine and practice is necessary. A frontal assault on the sector would require passing a law that resolves a number of jurisprudential issues so that the courts could be instructed to interpret antitrust issues with a greater focus on rooting out anti-competitive or collusive behavior (as opposed to lowering prices and preventing consumer harm). This is possible but Republican agreement would require major compromises that the Democrats are not inclined to make. A bipartisan bill is still possible because last year’s hearings revealed that there is common ground between the two parties. Both have agreed that anti-trust agencies should be strengthened and empowered to examine Big Tech; that data should be portable and platforms should be interoperable (rather than favoring their own services or imposing penalties for users who would switch services); that mergers and acquisitions should be examined with the presumption that consumers will be harmed, so that the merging parties must show that they cannot otherwise achieve the desired consumer benefits and that their actions will serve some public good; and that regulators need not trouble themselves excessively about the problem of accurately defining the market, which is always a sticking point for such fast evolving services.4 Moreover there is overlap between the populist sides of both parties, comparable to the bipartisan populist demands to give larger household rebates amid the COVID crisis. For example, Democrats want to revise Section 230 of the Communications Decency Act, which protects the tech companies from being held liable for the actions and comments of third parties on their platforms. The Democratic proposal is to break down the distinction between neutral tools and content creation, arguing that tech platforms can be “negligent” and that in order to benefit from the liability protections they should have to demonstrate that they have taken reasonable steps to prevent unlawful misuse of their platforms that cause harm to others. This idea of “reasonable moderation” would leave a very vague standard for judges that would lead to a complex operating environment across different jurisdictions, but it is attractive to Trumpists and right-wing populists who support greater ability to sue the platforms for alleged bias.5 Thus revising Section 230 could create a bridge between the two parties, albeit isolating the free-market contingent in either party. It would foist huge new liabilities not only on the tech giants but also on startups and market entrants with far fewer lawyers. The mechanism will be a decisive feature of any future legislative proposal, however. Republicans are staunchly opposed to creating an Internet oversight committee, similar to the Consumer Financial Protection Bureau, or anything that smacks of Big Brother and would risk too cozy of a relationship between the regulatory state and the immense capabilities of the tech companies. But they could be amenable to law that strengthens the antitrust agencies and alters the parameters of judicial scrutiny if they believed it would make consumer choice and innovation more likely. If popular opinion suggested great urgency on this issue then perhaps the parties’ differences could be resolved more quickly in the form of a major bill. But polls suggest the populace is also divided on tech regulation – in part because the pandemic left consumers largely thankful for the Internet services that they relied on so heavily while under lockdown. A bare majority of conservative Republicans and liberal Democrats now favor tech regulation, the average voter is lukewarm, and moderates of both parties show little enthusiasm (Chart 14). By contrast, at the height of Democratic anxiety over Trump’s election and Russian interference, a clear majority of Democrats and Democrat-leaning independents favored tougher regulation. Chart 14Public Split On Government Regulation Of Big Tech Companies
Big Tech Regulation Is A Slow Boil – But A Boil Just The Same
Big Tech Regulation Is A Slow Boil – But A Boil Just The Same
In short, the public is split, the parties are split, and the various 2020 crises have temporarily subsided, so tech regulatory risk will emanate from regulatory authorities but not from major new legislation anytime soon. Regulatory agencies thus threaten to give tech stocks negative surprises – even if the process takes time. Biden will replace one commissioner on the Federal Trade Commission (FTC) immediately but may only be able to replace two Republican commissioners toward the end of his term, in September 2023 and 2024, meaning that the commission will be divided (Table 2). Any major crackdown on market concentration will have to proceed upon bipartisan grounds unless Democrats gain control of this commission sooner. Meanwhile Biden will be able to replace outgoing Republican Ajit Pai on the Federal Communications Commission (FCC) right away, giving a Democratic tilt to this body, which is capable of pursuing the administration’s goals on content regulation (Table 3). Here the Supreme Court may eventually weigh in to defend free speech and press rights, which Section 230 ultimately reinforces, but the tech companies will be in the firing line until then. Table 2Federal Trade Commission Balance Of Power
Big Tech Regulation Is A Slow Boil – But A Boil Just The Same
Big Tech Regulation Is A Slow Boil – But A Boil Just The Same
Table 3Federal Communications Commission Balance Of Power
Big Tech Regulation Is A Slow Boil – But A Boil Just The Same
Big Tech Regulation Is A Slow Boil – But A Boil Just The Same
Finally, Biden’s nominee for the US Assistant Attorney General for the antitrust division will be a critical post to watch for the Department of Justice’s involvement in tech regulation and antitrust, though this position requires Senate confirmation, which will rule out any populist candidate. If Biden picks a former Facebook lawyer as rumored then he clearly will not be prioritizing a tough antitrust stance.6 Bottom Line: With the Senate filibuster intact for the time being, Democrats need 10 Republican senators to join them to pass any significant legislation that would amount to a frontal assault on the tech sector. This is possible but not probable in the short run, as Congress prioritizes the fight against the pandemic, Republicans and Democrats remain divided and the public is lukewarm about regulation. Much more likely is a regulatory slow boil at the hands of the DOJ, FCC, FTC, and the states. Biden Maintains Obama Alliance With Silicon Valley Public opinion is wishy washy about Big Tech, as mentioned above. Compare attitudes toward Wall Street and the major pharmaceutical corporations. Opinion shifted against the banks drastically during the financial crisis and has since recovered to about 24% net approval, although there are also polls showing that consumers of all stripes believe the banking sector got off easy and could use more regulation (Chart 15). The health care industry also took a hit during the Great Recession, when laid off workers also lost their health insurance, and has also largely recovered due to its conduct during the pandemic. The exception is Big Pharma, which is widely blamed for excessive drug prices, got bashed under President Trump, and is about to get bashed by President Biden in the form of price caps and Medicare negotiations. By contrast with these sectors, the computer and Internet industry has seen a hit to its popular support since Trump’s election but never dipped into net negative territory and may be recovering due to its helpful role during the COVID lockdowns. When net popular approval turns negative then it will be a flashing red light for the tech sector that sweeping regulation is imminent. While some of the opinion polling is lagging, the crisis over the election is unlikely to produce this effect because the public views break down along partisan lines. Chart 15Big Tech More Popular Than Big Banks, Big Pharma
Big Tech Regulation Is A Slow Boil – But A Boil Just The Same
Big Tech Regulation Is A Slow Boil – But A Boil Just The Same
Thus unlike the Trumpists, or the populists in the Democratic Party, the Biden administration is only inclined gradually to dial up the pressure on Big Tech. Biden would bite off more than any president could chew if he tackled tech aggressively along with other big corporations. His campaign platform and early executive orders show that he is already tackling Big Health Insurance and Big Oil, sectors that make up 7.5% and 1.4% of GDP respectively. There is at least some focus on re-regulating the financial industry as well (7.7% of value add), albeit with lower priority. To attempt a major overhaul of Big Tech (at least 5.3% of GDP) on top of all this would be impracticable even if Biden were inclined to listen to the anti-monopoly crusaders in his party. Information services are obviously important to the economies of solid blue states like California, New York, and Washington but they are increasingly important to critical swing states like Georgia and Pennsylvania – places where voters will be skeptical of Biden’s policies on energy and immigration. The information sector is growing fastest in blue states and in battlegrounds like Arizona. It employs more people in blue states and in battlegrounds like Georgia. And it is rapidly employing more people in the grand prize of Democratic designs, Texas, where an exodus of Californians fleeing poor governance and high costs holds out the possibility of creating a decisive Democratic ascendancy in the Electoral College. Silicon Valley and other tech clusters will maintain their unique strengths and network effects for a long time but the dispersion of the tech sector to cheaper heartland regions has electoral consequences that mainline Democrats will not want to suppress. Not only did the tech firms help Biden get elected through votes and media controls but also through campaign contributions. The financial and health care industries punished the Democrats for passing the Affordable Care Act (Obamacare) and Dodd-Frank reforms in 2009-12 (Chart 16). By contrast the tech heavily favors Democrats over Republicans (with donations at $170 million versus $20 million in the 2020 election). Biden’s priorities are two budget reconciliation bills that will partially reverse the Trump tax cuts in order to pay for the entrenchment and expansion of Obamacare and other aspects of his health care and child care agenda. He is also focused on infrastructure, particularly green infrastructure and renewables, to create jobs and galvanize the climate change coalition. Broad re-regulation is coming down the pike, but health, immigration, energy, and labor are higher priorities than tech. The tech sector faces greater scrutiny than before, first from the FCC and later from the DOJ and FTC, but the administration will have more room for maneuver later in its term. Bottom Line: The Obama administration forged an alliance with Silicon Valley that Biden will largely maintain. The purpose of regulatory pressure is to build leverage over the tech giants. Chart 16Big Tech A Big Donor To Democratic Party
Big Tech Regulation Is A Slow Boil – But A Boil Just The Same
Big Tech Regulation Is A Slow Boil – But A Boil Just The Same
Investment Takeaways Not all of the dominoes are lined up to topple Big Tech in a massive display of federal monopoly busting. The public is lukewarm and the political elite are divided. Nevertheless the long-term trajectory points to greater government scrutiny – and the tech sector has no margin of safety for political risk as the macro backdrop has started to shift in a more inflationary direction. Our colleague Juan Correa Ossa has shown that antitrust action to curb corporate power has tended to occur at times in US history where stock market earnings are elevated or rising rapidly relative to average wages, when inflation is running hot, and yet the economy has entered a bust phase where politicians are looking for a scapegoat to deflect public anger (Table 4). Table 4Stock Performance In Selected Judicial Events
Big Tech Regulation Is A Slow Boil – But A Boil Just The Same
Big Tech Regulation Is A Slow Boil – But A Boil Just The Same
While inflation is not an immediate problem (at least not yet), it was not a problem when the FTC and DOJ went after Microsoft starting in 1998. The distressed economy and tech bubble are good enough reason for investors to expect the government to increase antitrust pressure (Chart 17). If inflation recovers in the coming years around the time the Biden administration gains room to maneuver on this issue then it is doubly bad for the tech sector. Chart 17Anti-Trust Usually Follows Economic Bust
Anti-Trust Usually Follows Economic Bust
Anti-Trust Usually Follows Economic Bust
In Microsoft’s case, the stock fell when the government first brought charges but rallied throughout the twists and turns of the courtroom – especially after 2002 when the case was settled, and ever since (Chart 18). Fortunately for the company the DOJ backed away from breakup and instead ordered it to open up its application programming to others. But even firms that are broken up usually create buying opportunities. Note that Microsoft cleared its image and has not become the subject of government or popular scrutiny again today. Today’s regulators are likely to place a greater burden of proof on tech companies attempting mergers and acquisitions. The alternative for startups is to hold an initial public offering – and IPOs have exploded amid the current context of low rates, easy money, investor exuberance, a chilling effect on M&A, and a lingering pandemic. The markets are frothy, buyer beware (Chart 19). Chart 18Microsoft's Anti-Trust Warning
Microsoft's Anti-Trust Warning
Microsoft's Anti-Trust Warning
Chart 19Regulators Will Crack Down On M&A
Regulators Will Crack Down On M&A
Regulators Will Crack Down On M&A
Strategically we remain favorable toward value stocks over growth stocks given the changing macro and policy backdrop outlined above (Chart 20). However, in the very near term we would not encourage investors to take on any additional risk. The latest bout of volatility is not necessarily over, political and geopolitical risks are now underrated after a period in which they subsided from peak levels, and exuberant markets are subject to very sharp corrections. Matt Gertken Vice President Geopolitical Strategy mattg@bcaresearch.com Jesse Anak Kuri Associate Editor jesse.Kuri@bcaresearch.com Chart 20Take A Pause Amid Value Vs Growth Setback
Take A Pause Amid Value Vs Growth Setback
Take A Pause Amid Value Vs Growth Setback
Appendix Table A1Political Risk Matrix
Big Tech Regulation Is A Slow Boil – But A Boil Just The Same
Big Tech Regulation Is A Slow Boil – But A Boil Just The Same
Table A2Biden’s Cabinet Position Appointments
Big Tech Regulation Is A Slow Boil – But A Boil Just The Same
Big Tech Regulation Is A Slow Boil – But A Boil Just The Same
Footnotes 1 Congressional Budget Office, “Overview of the Economic Outlook: 2021-2031,” February 2021, cbo.gov. 2 Committee for a Responsible Federal Budget, “The Cost of the Trump and Biden Campaign Plans” October 7, 2020, and “The Cost of the Trump and Biden COVID Response Plans,” October 29, 2020, October 7, 2020, crfb.org. 3 The huge gap between the two parties can be illustrated by the recent case of Parler, the microblog that sought to rival Twitter by maintaining laissez faire content moderation standards. When Parler came under fire for attracting conservatives in the wake of the Twitter ban against Trump, Apple and Amazon teamed up to block it from their app purchasing and cloud services, thus effectively banning the app for 99% of users. There is no doubt that any private platform can regulate content according to its own standards on its own sites. In the words of Section 230, this extends not only to “obscene” or “excessively violent” material but to anything “otherwise objectionable.” But once tech companies prevent the emergence of competitors and alternatives, and cooperate in doing so, they enter much more dangerous legal territory. And yet the response from the House Democrats on the oversight committee was to ask the FBI to investigate Parler for hosting far-right extremists. Conservatives are therefore up in arms. The courts have not yet weighed in but the case represents a larger risk to the tech firms than the usual challenges under Section 230. 4 Representative Ken Buck, “The Third Way,” House Judiciary Committee, Subcommittee on Antitrust, Commercial, and Administrative Law 5 See Will Duffield, “Circumventing Section 230: Product Liability Lawsuits Threaten Internet Speech,” Cato Institute, January 26, 2021, cato.org. 6 See Ryan Grim and David Dayen, “Merrick Garland Wants Former Facebook Lawyer To Top Antitrust Division,” The Intercept, January 28, 2021, theintercept.com.
Reopen The “Back-To-Work” Trade, And Put The Small Cap Size Bias On Upgrade Alert
Reopen The “Back-To-Work” Trade, And Put The Small Cap Size Bias On Upgrade Alert
We are reopening our long “Back-To-Work”/short “COVID-19 Winners” pair trade that we first instituted in the September 8th, 2020 Strategy Report, and subsequently closed earlier this year for a gain of 21.5%, since inception as our risk management rolling stop was hit. Yesterday we highlighted that the recent market tumult is likely an equity-only event and the underlying cyclical drivers in the stock market remain intact. As equity vol settles down and the sudden fall in the 10-year Treasury yield reverses course (it remains one of the key risks to our economic reopening theme), there are high odds that the long “Back-To-Work”/short “COVID-19 Winners” share price ratio will resume its ascend. At the same time, the bullish theme for the economic reopening trade got another boost from the most recent ISM release that posted upbeat numbers especially on the prices paid subcomponent of the survey (bottom two panels). Thus, we are compelled to re-initiate this trade. With regard to the small cap bias that we recently monetized handsome gains for our portfolio – which is driven by similar macro catalysts – we are on the lookout to re-establish a small cap size bias, but at a better entry point (top two panels). Bottom Line: Reopen the long “Back-To-Work” / short “COVID-19 Winners” pair trade and put the small size bias on upgrade alert. The ticker symbols in the “Back-To-Work” and “COVID-19 Winners” baskets are: LUV, DAL, MAR, HLT, CVX, EOG, SBUX, MCD, CAT, HON, AXP, COF, NUE, GM; and TDOC, FCN, ZM, CTXS, JNJ, AMGN, REGN, CLX, RBGLY, WMT, COST, KR, NFLX, AMZN, respectively.
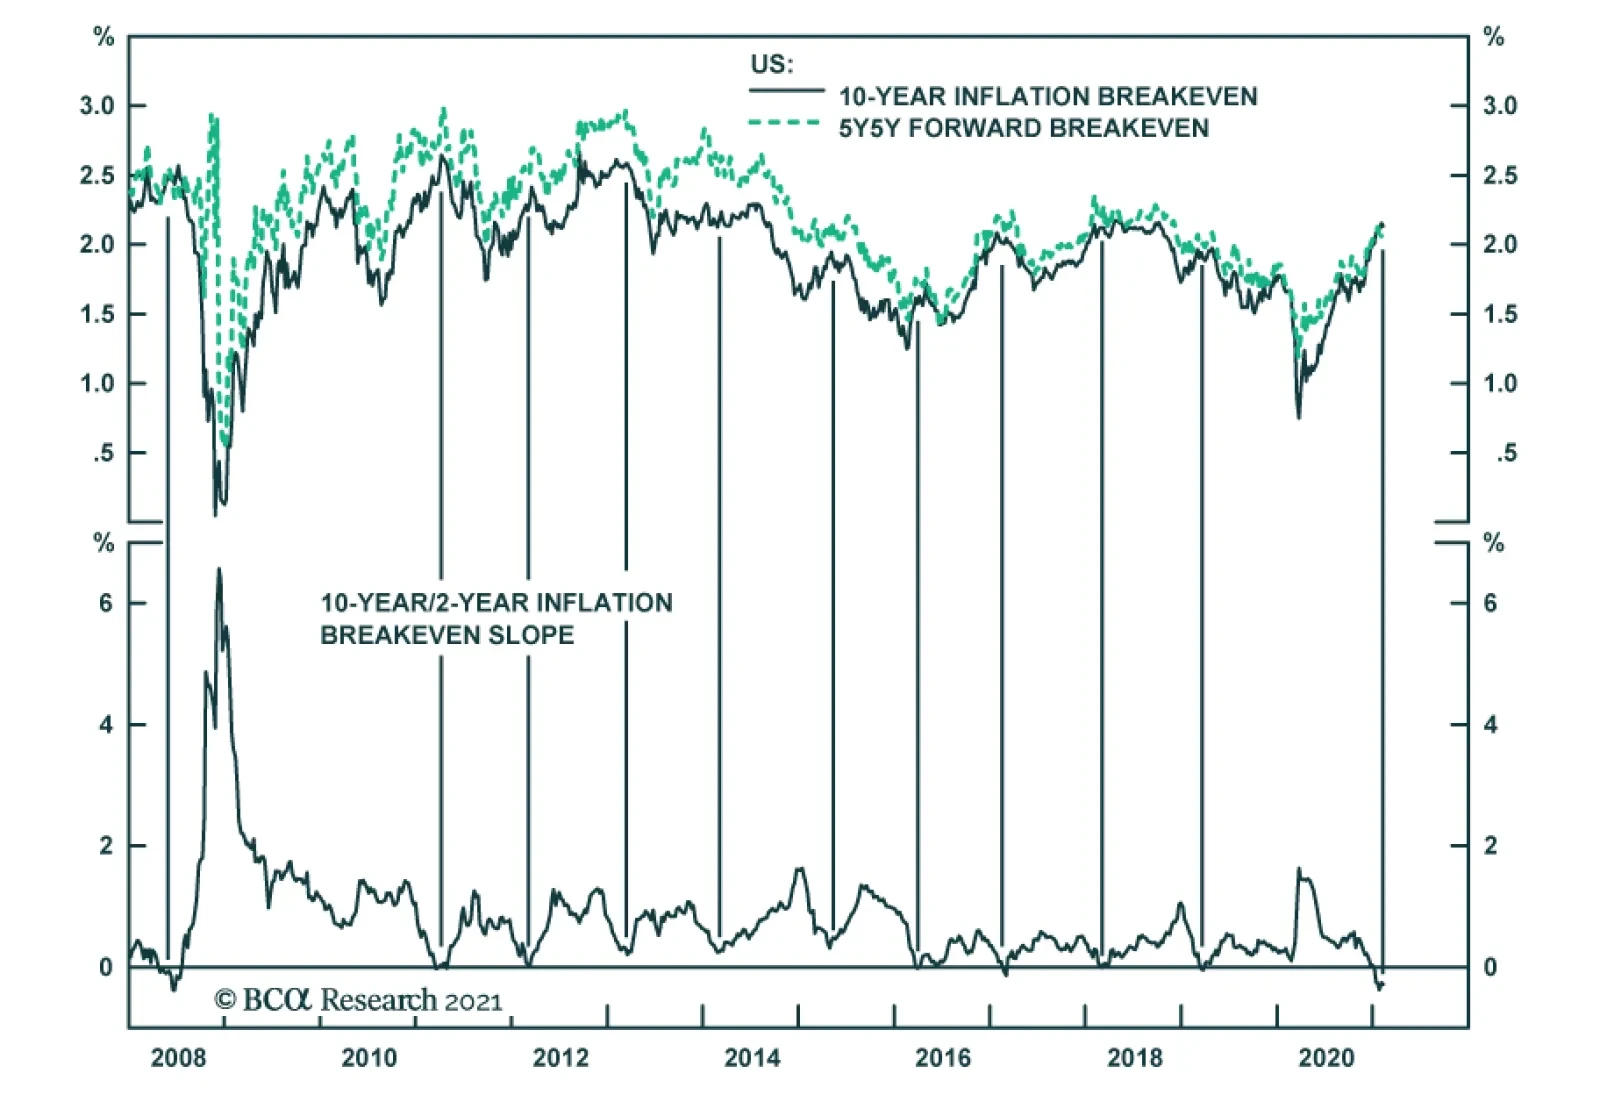
One of BCA Research’s core views is to bet on higher inflation breakeven rates. This trade has richly rewarded investors since last year’s market crash and it will likely continue to do so in 2021. After all, the Fed single-mindedly focuses on lifting…
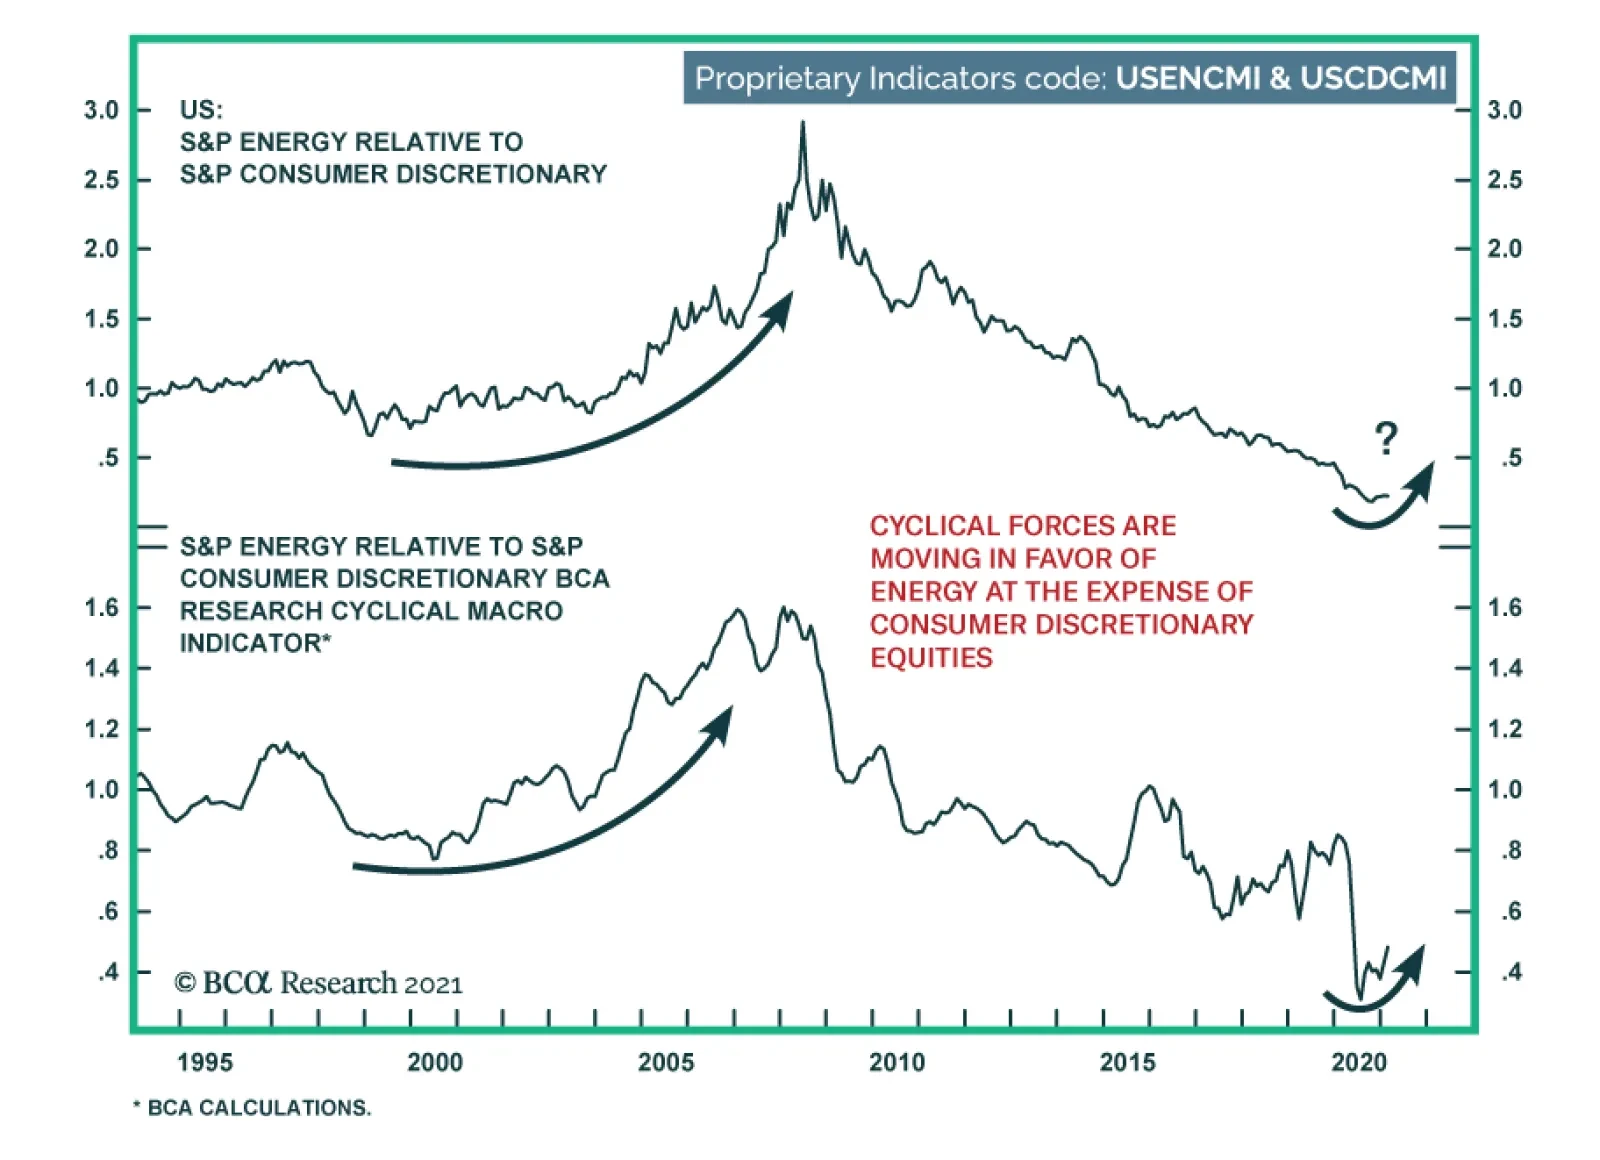
A high-octane bet on the energy sector is to overweight it at the expense of consumer discretionary equities. During the pandemic-induced global recession, consumer discretionary (mainly Amazon) thrived while energy stocks suffered. These trends have begun to…
We recommend investors monetize gains in the hedge we first recommended on December 7, 2020 in the form of VIX June futures, for a gain of 19% since inception, assuming conservatively that no leverage was used in executing this hedge. While the GME/Wallstreetbets saga has yet to fully play out, three reasons underpin our decision. First, this appears to be an equity only event as both USDJPY and USDCHF foreign exchange pairs went up last Wednesday and Friday. In a traditional “risk off” phase, the yen and the franc would spike versus the greenback not selloff. Second, during periods of active Fed QE the broad equity market has never fallen more than 10% from respective peaks. Using the Sunday night low for ES futures results in a 5.3% peak to trough fall for the broad market, well in the range of previous active Fed QE pullbacks. Finally, the spot VIX has jumped from 21 to a recent peak of 38, likely reflecting a lot of negative news. Spot VIX with a current (as we went to press) 33 handle implies that in the next 30 days the S&P 500 will either fall or rise by roughly 10% and vault to all-time highs or sink back to 3400. While the jury is still out on how this short squeeze phase will play out, a steeply inverted vol curve last week also signaled that the worst is likely behind us (see chart). Bottom Line: Crystalize 19% gains since inception in the VIX futures hedge, but stay vigilant.
Book Gains In VIX Futures
Book Gains In VIX Futures
Highlights Chart 1Inflation Indicators Hook Up
Inflation Indicators Hook Up
Inflation Indicators Hook Up
There’s no doubt that inflationary pressures are building in the US economy. The latest piece of evidence is January’s ISM Manufacturing PMI which saw the Prices Paid component jump above 80 for the first time since 2011 (Chart 1). Large fiscal stimulus is clearly leading to bottlenecks in certain industries that were not negatively impacted by the pandemic, and this could cause consumer price inflation to rise during the next few months. However, the Fed will not view a spike in inflation as sustainable unless it is accompanied by a labor market that is close to maximum employment. The Fed estimates that “maximum employment” corresponds to an unemployment rate of 3.5% to 4.5%, and we calculate that average monthly payroll growth of about +500k is required to reach that target by the end of the year. The bottom line is that rising inflation will not lead to Fed tightening this year. We continue to expect liftoff in late-2022 or the first half of 2023. Feature Investment Grade: Neutral Chart 2Investment Grade Market Overview
Investment Grade Market Overview
Investment Grade Market Overview
Investment grade corporate bonds outperformed the duration-equivalent Treasury index by 3 basis points in January. The index option-adjusted spread widened 1 bp on the month, leaving it 4 bps above its pre-COVID low. As discussed in last week’s report, the combination of above-trend economic growth and accommodative monetary policy means that the runway for spread product outperformance remains long.1 However, given that investment grade corporate bond spreads are extremely tight, investors should look to other spread products when possible. One valuation measure, the investment grade corporate index’s 12-month breakeven spread – with the index re-weighted to maintain a constant credit rating distribution over time – is down to its 4th percentile (Chart 2). This means that the breakeven spread has only been tighter 4% of the time since 1995. The same measure shows that Baa-rated bonds have also only been more expensive 4% of the time (panel 3). While we don’t anticipate material underperformance versus Treasuries, we see better value outside of the investment grade corporate space. Specifically, we advise investors to favor tax-exempt municipal bonds over investment grade corporates with the same credit rating and duration (see page 9). We also prefer USD-denominated Emerging Market Sovereign bonds over investment grade corporates with the same credit rating and duration (see page 8). Finally, the supportive macro environment means that we are comfortable adding credit risk to a portfolio. With that in mind, we encourage investors pick up the additional spread offered by high-yield corporates, particularly the Ba credit tier where spreads remain wide compared to average historical levels (see page 6). Table 3ACorporate Sector Relative Valuation And Recommended Allocation*
No Tightening In 2021
No Tightening In 2021
Table 3BCorporate Sector Risk Vs. Reward*
No Tightening In 2021
No Tightening In 2021
High-Yield: Overweight Chart 3High-Yield Market Overview
High-Yield Market Overview
High-Yield Market Overview
High-Yield outperformed the duration-equivalent Treasury index by 62 basis points in January. The average index option-adjusted spread widened 2 bps on the month, leaving it 47 bps above its pre-COVID low. Ba-rated credits outperformed duration-matched Treasuries by 50 bps on the month, besting B-rated bonds which outperformed by only 33 bps. The Caa-rated credit tier delivered 157 bps of outperformance versus duration-matched Treasuries. We view Ba-rated junk bonds as the sweet spot within the corporate credit space. The sector is relatively insulated from default risk and yet still offers a sizeable spread pick-up over investment grade corporates (Chart 3). We noted in our 2021 Key Views Special Report that the additional spread earned from moving down in quality below Ba is merely in line with historical averages.2 Assuming a 25% recovery rate on defaulted debt and a minimum required risk premium of 150 bps, we calculate that the junk index is priced for a default rate of 2.8% for the next 12 months (panel 3). This represents a steep drop from the 8.4% default rate observed during the most recent 12-month period. However, only six defaults occurred in December, down from a peak of 22 in July. Job cut announcements, an excellent indicator of the default rate, have also fallen dramatically (bottom panel). Overall, we see room for spread compression across all junk credit tiers in 2021 but believe that Ba-rated bonds offer the best opportunity in risk-adjusted terms. MBS: Underweight Chart 4MBS Market Overview
MBS Market Overview
MBS Market Overview
Mortgage-Backed Securities outperformed the duration-equivalent Treasury index by 24 basis points in January. The nominal spread between conventional 30-year MBS and equivalent-duration Treasuries tightened sharply in January, despite a continued rapid pace of refinancing activity (Chart 4). The option-adjusted spread adjusted downward in January and it now sits at 25 bps (panel 3). This is considerably below the 61 bps offered by Aa-rated corporate bonds and the 45 bps offered by Agency CMBS. It is only slightly above the 20 bps offered by Aaa-rated consumer ABS. The primary mortgage spread has tightened dramatically during the past few months (bottom panel), a key reason why refinancing activity has been so strong despite the back-up in Treasury yields. With the mortgage spread now closer to typical levels, it stands to reason that further increases in Treasury yields will be matched by higher mortgage rates. As such, mortgage refinancing activity could be close to its peak. While a drop in refinancing activity would be a reason to get more bullish on MBS, we aren’t yet ready to pull that trigger. The gap between the nominal MBS spread and the MBA Refinance Index remains wide (panel 2), and we could still see spreads adjust higher. Last year’s spike in the mortgage delinquency rate is alarming (panel 4), but it will have little impact on MBS returns. The increase was driven by household take-up of forbearance granted by the federal government. Our US Investment Strategy service recently showed that a considerable majority of households will remain current on their loans once the forbearance period expires, causing the delinquency rate to fall back down.3 Government-Related: Neutral Chart 5Government-Related Market Overview
Government-Related Market Overview
Government-Related Market Overview
The Government-Related index outperformed the duration-equivalent Treasury index by 24 basis points in January (Chart 5). Sovereign debt and Foreign Agencies underperformed duration-equivalent Treasuries by 21 bps and 7 bps, respectively, in January. Local Authority bonds outperformed the Treasury benchmark by 140 bps while Domestic Agency bonds and Supranationals outperformed by 15 bps and 7 bps, respectively. Last week’s report contains a detailed look at valuation for USD-denominated EM Sovereigns.4 We found that, on an equivalent-duration basis, EM Sovereigns offer a spread advantage versus US corporates for all credit tiers except Ba. We recommend that investors take advantage of this spread pick-up by favoring investment grade EM Sovereigns over investment grade US corporates. Attractive countries include: Qatar, UAE, Saudi Arabia, Mexico, Russia and Colombia. We prefer US corporates over EM Sovereigns in the high-yield space. Ba-rated high-yield US corporates offer a spread advantage over EM Sovereigns and the extra spread available in B-rated and lower EMs comes from distressed credits in Turkey and Argentina. Municipal Bonds: Overweight Chart 6Municipal Market Overview
Municipal Market Overview
Municipal Market Overview
Municipal bonds outperformed the duration-equivalent Treasury index by 108 basis points in January (before adjusting for the tax advantage). Municipal bond spreads have tightened dramatically during the past couple of months and Aaa-rated Munis no longer look cheap compared to Treasuries (Chart 6). That said, if we match the duration and credit rating between the Bloomberg Barclays Municipal bond indexes and the US Credit index, we find that both General Obligation (GO) and Revenue Munis appear attractive compared to US investment grade Credit. Both GO and Revenue Munis offer a before-tax spread pick-up relative to US Credit for maturities above 12 years (bottom panel). Revenue bonds in the 8-12 year and 6-8 year maturity buckets offer an after-tax yield pick-up versus Credit for investors with effective tax rates above 3% and 16%, respectively. GO bonds in the 8-12 year and 6-8 year maturity buckets offer breakeven effective tax rates of 21% and 33%, respectively. All in all, municipal bond value has deteriorated markedly in recent months and we downgraded our recommended allocation from “maximum overweight” to “overweight” in last week’s report. However, investors should still prefer municipal bonds over investment grade corporate bonds with the same credit rating and duration. Treasury Curve: Buy 5-Year Bullet Versus 2/10 Barbell Chart 7Treasury Yield Curve Overview
Treasury Yield Curve Overview
Treasury Yield Curve Overview
The Treasury curve bear-steepened in January. The 2/10 Treasury slope steepened 20 bps to 100 bps. The 5/30 Treasury slope steepened 13 bps to 142 bps. Our expectation is that continued economic recovery will cause investors to price-in eventual monetary tightening at the long-end of the Treasury curve. With the Fed maintaining a firm grip on the front end, this will lead to Treasury curve bear steepening. A timely vaccine roll-out and stimulative fiscal policy will serve to speed this process along. We recommend positioning for a steeper curve by owning the 5-year Treasury note and shorting a duration-matched barbell consisting of the 2-year and 10-year notes. This position is designed to profit from 2/10 curve steepening. Valuation is a concern with our recommended steepener, as the 5-year yield is below the yield on a duration-matched 2/10 barbell (Chart 7). However, the 5-year looked much more expensive during the last zero-lower-bound period between 2010 and 2013 (bottom 2 panels). We anticipate a return to similar valuation levels. TIPS: Overweight Chart 8TIPS Market Overview
TIPS Market Overview
TIPS Market Overview
TIPS outperformed the duration-equivalent nominal Treasury index by 143 basis points in January. The 10-year and 5-year/5-year forward TIPS breakeven inflation rates rose 14 bps and 1 bp on the month. They currently sit at 2.15% and 2.06%, respectively. Core CPI rose 0.09% in December, causing the year-over-year rate to dip from 1.65% to 1.61%. Meanwhile, 12-month trimmed mean CPI ticked up from 2.09% to 2.10%, widening the gap between trimmed mean and core (Chart 8). We expect 12-month core inflation to jump during the next few months, narrowing the gap between core and trimmed mean. As such, we remain overweight TIPS versus nominal Treasuries, even though the 10-year TIPS breakeven inflation rate looks expensive on our Adaptive Expectations Model (panel 2).5 We also recommend holding real yield curve steepeners and inflation curve flatteners. With the Fed now officially targeting an overshoot of its 2% inflation goal, we expect the cost of 2-year inflation protection to rise above the cost of 10-year inflation protection (panel 4). With the Fed also exerting more control over short-dated nominal yields than over long-term ones, we expect short-maturity real yields to come under downward pressure relative to the long end (bottom panel). ABS: Overweight Chart 9ABS Market Overview
ABS Market Overview
ABS Market Overview
Asset-Backed Securities outperformed the duration-equivalent Treasury index by 17 basis points in January. Aaa-rated ABS outperformed the Treasury benchmark by 11 bps in January, while non-Aaa issues outperformed by 48 bps (Chart 9). The stimulus from the CARES act led to a significant increase in household income when individual checks were mailed out last April. Since then, households have used this stimulus to build up a considerable buffer of excess savings (panel 4). The large stock of household savings means that the collateral quality of consumer ABS is very high, and this situation won’t change any time soon with even more fiscal stimulus on the way. Investors should remain overweight consumer ABS and take advantage of strong collateral performance by moving down in credit quality. The Treasury department’s decision to let the Term Asset-Backed Loan Facility (TALF) expire at the end of 2020 does not alter our recommendation. Spreads are already well below the borrowing cost that was offered by TALF, and these tight spread levels are justified by strong household balance sheets. Non-Agency CMBS: Neutral Chart 10CMBS Market Overview
CMBS Market Overview
CMBS Market Overview
Non-Agency Commercial Mortgage-Backed Securities outperformed the duration-equivalent Treasury index by 75 basis points in January. Aaa Non-Agency CMBS outperformed Treasuries by 42 bps in January, while non-Aaa issues outperformed by 185 bps (Chart 10). We continue to recommend an overweight allocation to Aaa-rated Non-Agency CMBS and an underweight allocation to non-Aaa CMBS. Even with the expiry of TALF, Aaa CMBS spreads are already well below the cost of borrowing through TALF and thus will not be negatively impacted. Meanwhile, the structurally challenging environment for commercial real estate could lead to problems for lower-rated CMBS (panels 3 & 4). Agency CMBS: Overweight Agency CMBS outperformed the duration-equivalent Treasury index by 28 basis points in January. The average index spread tightened 4 bps on the month to reach 45 bps (bottom panel). Though Agency CMBS spreads have completely recovered back to their pre-COVID lows, they still look attractive compared to other similarly risky spread products. This is especially true when you consider the Fed’s continued pledge to purchase as much Agency CMBS as “needed to sustain smooth market functioning”. Appendix A: Butterfly Strategy Valuations The following tables present the current read-outs from our butterfly spread models. We use these models to identify opportunities to take duration-neutral positions across the Treasury curve. The following two Special Reports explain the models in more detail: US Bond Strategy Special Report, “Bullets, Barbells And Butterflies”, dated July 25, 2017, available at usbs.bcaresearch.com US Bond Strategy Special Report, “More Bullets, Barbells And Butterflies”, dated May 15, 2018, available at usbs.bcaresearch.com Table 4 shows the raw residuals from each model. A positive value indicates that the bullet is cheap relative to the duration-matched barbell. A negative value indicates that the barbell is cheap relative to the bullet. Table 4Butterfly Strategy Valuation: Raw Residuals In Basis Points (As Of January 29TH, 2021)
No Tightening In 2021
No Tightening In 2021
Table 5 scales the raw residuals in Table 4 by their historical means and standard deviations. This facilitates comparison between the different butterfly spreads. Table 5Butterfly Strategy Valuation: Standardized Residuals (As Of January 29TH, 2021)
No Tightening In 2021
No Tightening In 2021
Table 6 flips the models on their heads. It shows the change in the slope between the two barbell maturities that must be realized during the next six months to make returns between the bullet and barbell equal. For example, a reading of 86 bps in the 5 over 2/10 cell means that we would only expect the 5-year to outperform the 2/10 if the 2/10 slope steepens by more than 86 bps during the next six months. Otherwise, we would expect the 2/10 barbell to outperform the 5-year bullet. Table 6Discounted Slope Change During Next 6 Months (BPs)
No Tightening In 2021
No Tightening In 2021
Appendix B: Excess Return Bond Map The Excess Return Bond Map is used to assess the relative risk/reward trade-off between different sectors of the US bond market. It is a purely computational exercise and does not impose any macroeconomic view. The Map’s vertical axis shows 12-month expected excess returns. These are proxied by each sector’s option-adjusted spread. Sectors plotting further toward the top of the Map have higher expected returns and vice-versa. Our novel risk measure called the “Risk Of Losing 100 bps” is shown on the Map’s horizontal axis. To calculate it, we first compute the spread widening required on a 12-month horizon for each sector to lose 100 bps or more relative to a duration-matched position in Treasury securities. Then, we divide that amount of spread widening by each sector’s historical spread volatility. The end result is the number of standard deviations of 12-month spread widening required for each sector to lose 100 bps or more versus a position in Treasuries. Lower risk sectors plot further to the right of the Map, and higher risk sectors plot further to the left. Chart 11Excess Return Bond Map (As Of January 29th, 2021)
No Tightening In 2021
No Tightening In 2021
Ryan Swift US Bond Strategist rswift@bcaresearch.com Footnotes 1 Please see US Bond Strategy Weekly Report, “Searching For Value In Spread Product”, dated January 26, 2021, available at usbs.bcaresearch.com 2 Please see US Bond Strategy Special Report, “2021 Key Views: US Fixed Income”, dated December 15, 2020, available at usbs.bcaresearch.com 3 Please see US Investment Strategy Weekly Report, “The Big Bank Beige Book, January 2021”, dated January 25, 2021, available at usis.bcaresearch.com 4 Please see US Bond Strategy Weekly Report, “Searching For Value In Spread Product”, dated January 26, 2021, available at usbs.bcaresearch.com 5 For more details on our model please see US Bond Strategy Weekly Report, “How Are Inflation Expectations Adapting?”, dated February 11, 2020, available at usbs.bcaresearch.com Fixed Income Sector Performance Recommended Portfolio Specification Corporate Sector Relative Valuation And Recommended Allocation