United States

Highlights GameStop & Bond Yields: The reflationary conditions that helped create a backdrop highly conducive to the wild stock market speculation on display last week – namely, aggressive monetary and fiscal policy stimulus to fight the pandemic – remain bearish for global government bonds and bullish for risk assets like global corporate credit. Remain overweight the latter versus the former. Italy: The latest bout of political uncertainty in Italy has only paused the medium-term spread compression story for BTPs versus core European government bonds, for two reasons: a) this political battle has, to date, had far less of the fiscal populism and anti-Europe flavor of past conflicts; and b) the ECB has shown that it will aggressively use its balance sheet to prevent a spike in Italian bond yields. Maintain an overweight stance on Italy in global bond portfolios, even with early elections likely later this year. Feature Dear Client, The next Global Fixed Income Strategy publication will be a Special Report on Canada, jointly published with our colleagues at Foreign Exchange Strategy on Friday, February 12. We will return to our regular publishing schedule on Tuesday, February 16. Rob Robis, Chief Global Fixed Income Strategist Chart of the WeekExpect More Bubbles & GameStop-Like Silliness
Expect More Bubbles & GameStop-Like Silliness
Expect More Bubbles & GameStop-Like Silliness
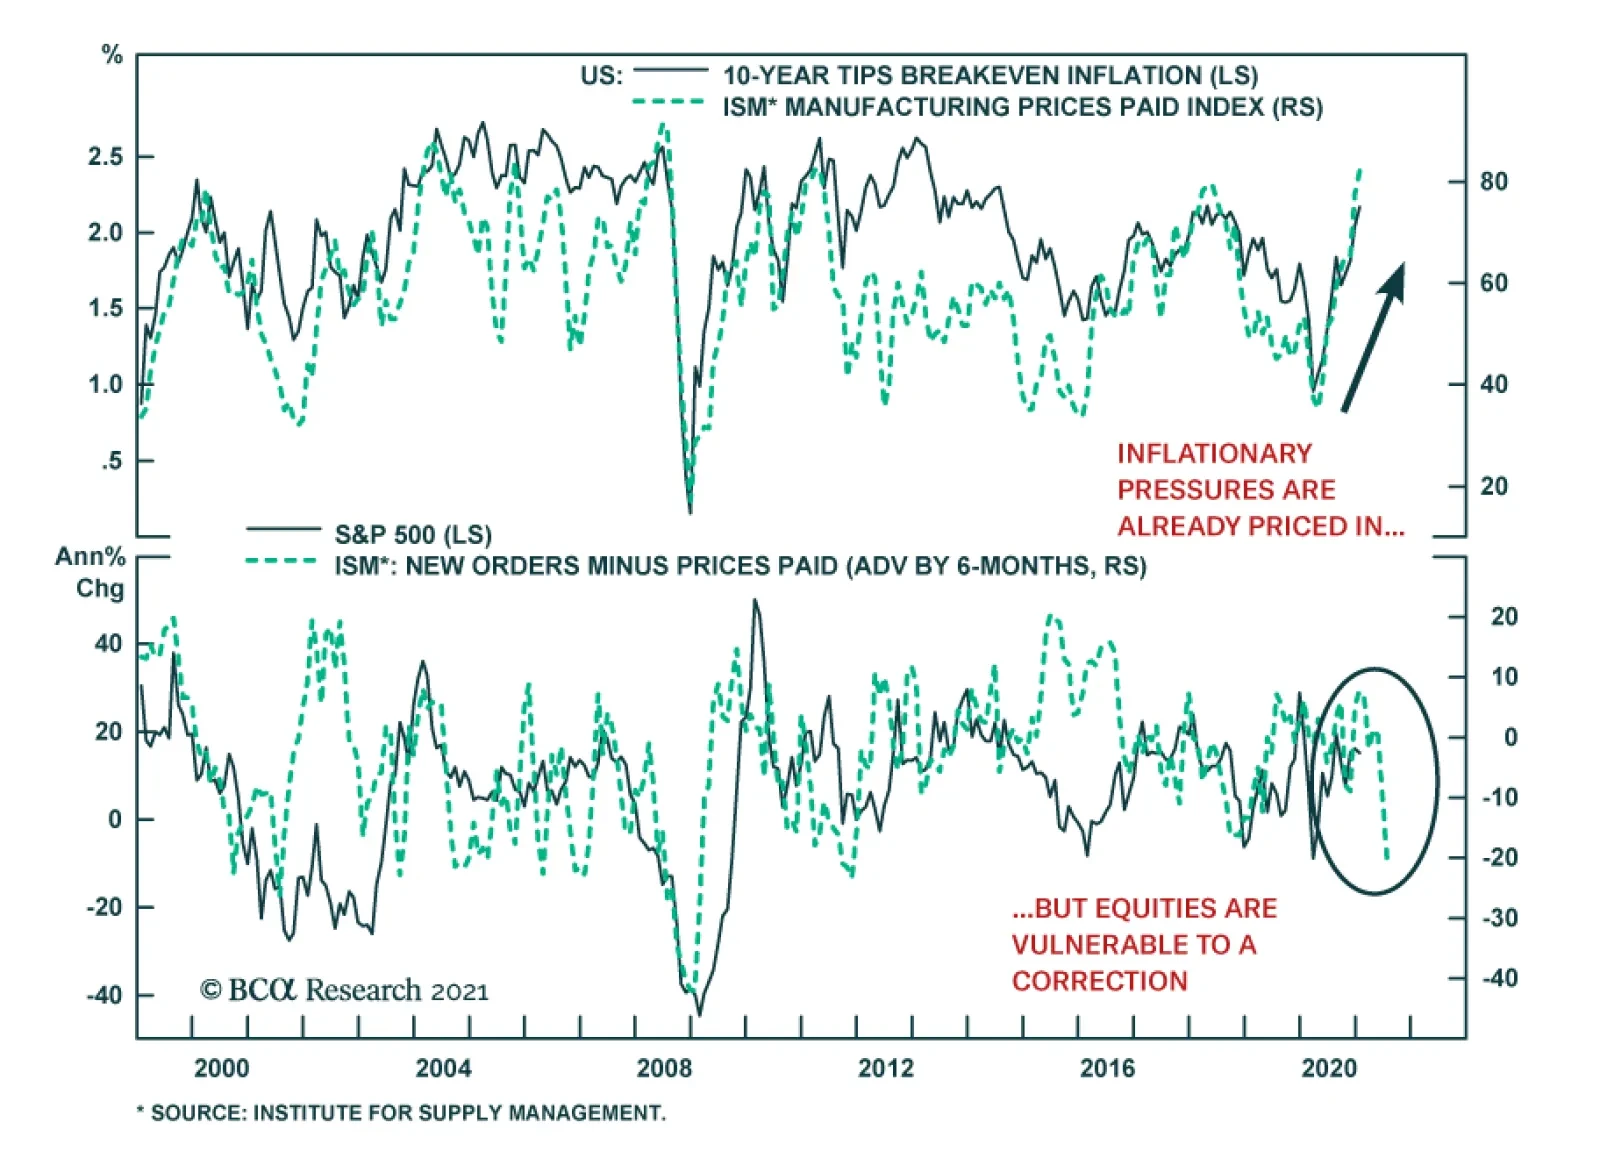
The “Reddit Retail Revolution” has exposed the dangers of staying too long in crowded short positions for equities like GameStop, but bond markets were unfazed by the wild moves in stocks last week. US Treasury yields actually crept upwards as the mother of all short squeezes became the top news story in America. Corporate credit spreads worldwide were essentially unchanged, despite the pickup in US equity volatility measures like the VIX. Bond investors recognize that, while the sideshow of rebel traders taking on mighty hedge funds makes for great theater, the underlying reflationary global policy backdrop remains the main driver of global bond yields and credit risk premia (Chart of the Week). Global fiscal policy risks are increasingly tilted towards more stimulus than currently projected, even as the pace of new COVID-19 cases is starting to slow in the US and much of Europe. Vaccine rollouts in many countries are going far slower than expected, which has forced global central banks to commit to maintaining highly accommodative policies - zero interest rates, quantitative easing (QE) and cheap bank funding – for longer. As Fed Chair Jerome Powell noted in his press conference following last week’s FOMC meeting, “There’s nothing more important to the economy now than people getting vaccinated.” Chart 2Vaccine Rollout Critical For Fed/ECB/BoE Policy
The Revolution Will Be Monetized
The Revolution Will Be Monetized
On that front, the largest economies on both sides of the Atlantic continue to perform poorly. According to data from the Duke Global Health Innovation Center, vaccination coverage (defined as actual vaccination doses acquired on a per person basis) in the US, UK and European Union remains low relative to the intensity of COVID-19 cases within the population (Chart 2) – especially compared to the experience of other major Western countries.1 As we discussed in last week’s report, it is far too soon for investors to fear a hawkish move by global central banks towards tapering asset purchases and signaling future interest rate hikes.2 The GameStop episode may cause some policymakers to worry about the financial stability risks resulting from cheap money policies, but not before the greater risks to global growth from the COVID-19 pandemic are contained. Until vaccination rates rise to levels where there is the potential for herd immunity to be reached, central banks will have little choice by to maintain 0% (or lower) policy rates for longer with continued expansion of their balance sheets (Chart 3). Policy makers will even likely respond with more QE in the event of broad financial market turmoil occurring before inflation expectations return to central bank targets (Chart 4). Chart 3Expect More Global QE ...
The Revolution Will Be Monetized
The Revolution Will Be Monetized
Chart 4...To Moderate Reflationary Pressure On Bond Yields
...To Moderate Reflationary Pressure On Bond Yields
...To Moderate Reflationary Pressure On Bond Yields
We continue to recommend the following medium-term positioning for reflation-based themes in global fixed income markets: below-benchmark overall duration exposure, favoring lower-quality corporate bonds versus government debt, and underweighting US Treasuries within global government bond portfolios. Bottom Line: The reflationary conditions that have helped create a backdrop highly conducive to the wild stock market speculation on display last week – namely, aggressive monetary and fiscal policy stimulus to fight the pandemic – remain bearish for global government bonds and bullish for risk assets like global corporate credit. Italy: ECB Policy Trumps Political Uncertainty One of our highest conviction fixed income investment recommendations over the past year has been to overweight Italian government bonds (BTPs). We have maintained that bullish stance with an expectation that Italian bond yields (and spreads over German debt) would converge to the levels of Spain, restoring a relationship last seen sustainably in 2016 (Chart 5). Chart 5A Small Response To Italian Political Uncertainty
A Small Response To Italian Political Uncertainty
A Small Response To Italian Political Uncertainty
The recent collapse of the coalition government of Prime Minister Giuseppe Conte would, in a more “normal” time, represent a serious threat to the stability of the Italian bond market and our bullish view. Yet the response so far has been muted, with the spread between 10-year BTPs and German Bunds up only 11bps from the mid-January lows. The current political drama stemmed from a disagreement within the ruling coalition over how the government was planning to use Italy’s share of the €750bn EU Recovery Fund. As we go to press, the survival of the current government hangs in the balance, with President Sergio Mattarella testing whether the political parties can form a government with a majority. The initial announcement of that Recovery Fund was considered to be a major reason for a reduced risk premium on Italian government bonds, as it represented a potential step towards greater fiscal integration within Europe. Unfortunately, it took the COVID-19 crisis to get the rest of Europe to offer help to the more economically fragile countries like Italy. The country suffered one of the world’s worst initial waves of the virus and the late-2020 surge has also hit hard – although, more recently, Italy has fared far better than Southern European neighbors Spain and Portugal with a slower pace of new cases and hospitalizations (Chart 6). Italy’s economy has struggled under the weight of some of the most stringent restrictions on activity within Europe to stop the spread of the virus, according to the Oxford COVID-19 database (Chart 7). Domestic spending on retail and recreation activities is estimated to be down nearly 50% from the start of the pandemic, a hit to the economy made worse by the collapse of tourism revenue that will take years to fully recover. In other words, Italy desperately needs the money from the EU Recovery Fund. Chart 6Italy's COVID-19 Situation Is Slowly Improving
Italy's COVID-19 Situation Is Slowly Improving
Italy's COVID-19 Situation Is Slowly Improving
Chart 7A Big Economic Hit To Italy From COVID-19
A Big Economic Hit To Italy From COVID-19
A Big Economic Hit To Italy From COVID-19
Former Prime Minister Matteo Renzi and his Italia Viva party precipitated the crisis by withdrawing their support from Conte’s coalition, but are in a weak position electorally. They claim that the funds should be handled by parliament, rather than a technocratic council overseen by Conte, and devoted to long-term structural reform rather than short-term fixes. Renzi’s withdrawal from the ruling coalition, however, is not grounded in substantial disagreements over fiscal spending: First, the EU recovery fund requires all member states to use 30% of the funds on climate change initiatives and 25% on digitizing the economy, and none of the major parties oppose this use of the €209 billion coming their way. Second, Prime Minister Conte adjusted his spending plans, nearly doubling the allocations for health, education, and culture, in response to Renzi’s criticisms that not enough spending focused on structural needs. Third, Renzi wants to tap €36 billion from the European Stability Mechanism in addition to taking recovery funds, but this would come with austerity measures attached (which is self-defeating) and would be opposed by the left-wing populist Five Star Movement, a linchpin in the ruling coalition. Even if the immediate political turmoil passes, there will still be an elevated risk of an early election as the various parties jockey for power in the wake of the cataclysmic pandemic, and as they eye control of the presidency, which is up for grabs in 2022. The only real change on the fiscal front would come if the populist League and Brothers of Italy ended up winning a majority and control of government in the eventual elections, as they favor much greater fiscal largesse. It is possible that Conte will survive as his personal support has increased throughout the crisis. Otherwise, former ECB President Mario Draghi could replace him, although he is now less popular than Conte. President Mattarella is not eager to dissolve parliament given that the combined strength of right-wing anti-establishment parties is greater than that of the centrist and left-wing parties in the ruling coalition judging by public opinion polls (Chart 8). Yet sooner rather than later, a new election looms. The country already completed an electoral reform via a referendum in September 2020 that cleared the way for a new election to be held. Chart 8Unstable Coalition Wants To Delay Election As Populist Right Slightly Ahead
Unstable Coalition Wants To Delay Election As Populist Right Slightly Ahead
Unstable Coalition Wants To Delay Election As Populist Right Slightly Ahead
Chart 9Waning Immigration Undercuts Italian Populists (For Now)
The Revolution Will Be Monetized
The Revolution Will Be Monetized
The current crisis is different than past bouts of Italian political uncertainty as there is less of a question over Italy’s commitment to the euro - which in the past has resulted in higher Italian bond yields and wider BTP-Bund spreads as markets had to price in euro breakup risk. The current coalition, and any new coalition cobbled out of the current morass to prevent a snap election, are united in their opposition to the populist League and the Brothers of Italy. They will strive to remain in power to distribute the EU recovery funds and secure the Italian presidency for an establishment political elite – one, like Mattarella, who will act as a check on the power of any future populist government and its cabinet choices, just as Mattarella himself hobbled the League’s most radical proposals from 2018-19. Chart 10Italian Support For EU & The Euro Sufficient But Not Ironclad
The Revolution Will Be Monetized
The Revolution Will Be Monetized
While the right-wing “sovereigntist” parties lead in the opinion polls, the League has lost support since its leader Matteo Salvini’s failed bid to trigger an election in August 2019 and especially since the COVID-19 outbreak has boosted the establishment parties and coalition members. Anti-immigration sentiment, a key support of this faction, has subsided as the EU has cut down the influx of immigrants (Chart 9). Salvini and his supporters have also compromised their euroskepticism to appeal to a broader audience as 60% of the populace still approves of the euro – although this support is falling again and bears monitoring (Chart 10). Another economic shock or a new wave of immigration could put the right-wing populists into power. Moreover, an unstable ruling coalition will lose support over time in what will be a difficult post-pandemic environment. Thus, the risk of euroskepticism and fiscal populism will persist over the coming two years, even though they are most likely contained at the moment. Has The ECB Removed The Tail Risk Of BTPs? The ECB has shown they are willing to use their balance sheet via QE and cheap bank funding tools like TLTROs to support the euro area’s weakest link – Italy. Thus, any upward pressure on Italian bond yields/spreads from the current political fracas will almost certainly be met by a more aggressive ECB response (more QE for longer, new TLTROs), limiting the damage to the Italian bond market. Chart 11What Would Italian Loan Growth Be WITHOUT ECB Support?
What Would Italian Loan Growth Be WITHOUT ECB Support?
What Would Italian Loan Growth Be WITHOUT ECB Support?
The ECB’s TLTROs appear to have been helpful for Italy, whose LTRO allotments represent 14.7% of total bank lending (Chart 11). Yet Spanish banks have relied on cheap ECB funding to a similar degree, while the growth of bank lending in Italy has substantially lagged that of Spain since the start of the pandemic in 2020 – even with Italy having less restrictive lending standards according to the ECB’s Bank Lending Survey. The ECB has also helped Italy by being more flexible with its purchases of Italian government bonds within both the Public Sector Purchase Program (PSPP) and the Pandemic Emergency Purchase Program (PEPP) that began in response to COVID-19. ECB data show that, after the worst days of the COVID-19 market rout last spring when the 10-year Italian bond yield soared from 1% to 2.4% over just three weeks, the ECB increased the Italy share of its bond buying to levels well above the Capital Key weighting scheme that “officially” governs the bond purchases. This was true within both the PSPP (Chart 12) and the PSPP (Chart 13). Chart 12ECB Paying Less Attention To The Capital Key In The PSPP ...
The Revolution Will Be Monetized
The Revolution Will Be Monetized
Chart 13… And The PEPP
The Revolution Will Be Monetized
The Revolution Will Be Monetized
Chart 14Stay Overweight Italian Government Bonds
Stay Overweight Italian Government Bonds
Stay Overweight Italian Government Bonds
The ECB’s actions helped stabilize Italian bond yields, sowing the seeds of the major decline in yields that took place between April and September. Once Italian bond yields fell back to pre-pandemic levels, the ECB slowed the pace of its purchases of Italian bonds to levels at or below the Capital Key weights. Thus, the ECB was willing to deviate from its own self-imposed rules for its bond purchase schemes in order to ease financial conditions in Italy during a pandemic. There is no reason to believe that would not occur again if yields rise because of a growing political risk premium while the pandemic was still raging. A prolonged period of political uncertainty in Italy, especially one that ends with fresh elections, could even force the ECB to maintain or extend its full current mix of policies and not just QE. For example, a new TLTRO could be initiated later this year, or the subsidized cost of banks borrowing from existing TLTROs could be reduced further, all in an effort to help boost Italian lending activity. More likely, the PEPP could be expanded in size or extended beyond the current March 2022 expiration, or the PSPP could be upsized to allow for more purchases of Italian debt (Chart 14). From an investment strategy perspective, there is still a strong case for overweighting Italian government bonds in global fixed income portfolios, even with the current political uncertainty. The weight of ECB policy actions removes much of the usual upside risk to BTP yields. However, investors will likely be more reluctant to drive Italian yields (and spreads versus Germany) to fresh lows if there is a risk of early elections, as we expect. Italian bonds are now more of a pure carry with yields trapped between politics and QE, but that still justifies an overweight stance - especially given the puny levels of alternative sovereign bond yields available elsewhere in the euro area. Bottom Line: The latest bout of political uncertainty in Italy has only paused the medium-term spread compression story for BTPs versus core European government bonds, for two reasons: a) this political battle has, to date, had far less of the fiscal populism and anti-Europe flavor of past conflicts; and b) the ECB has shown that it will aggressively use its balance sheet to prevent a spike in Italian bond yields. Maintain an overweight stance on Italy in global bond portfolios, even with early elections likely later this year. Robert Robis, CFA Chief Fixed Income Strategist rrobis@bcaresearch.com Matt Gertken Vice President Geopolitical Strategy mattg@bcaresearch.com Footnotes 1 The Duke Global Health Innovation Center data on COVID-19 can be found here: https://launchandscalefaster.org/COVID-19. 2 Please see BCA Research Global Fixed Income Strategy Report, "A Pause, Not A Peak, In Global Bond Yields", dated January 26, 2021, available at gfis.bcaresearch.com. Recommendations The GFIS Recommended Portfolio Vs. The Custom Benchmark Index
The Revolution Will Be Monetized
The Revolution Will Be Monetized
Duration Regional Allocation Spread Product Tactical Trades Yields & Returns Global Bond Yields Historical Returns
The January ISM survey shows manufacturing activity in the US growing at a slower pace than expected, with the headline index falling to 58.7 from 60.5, versus expectations of a milder deceleration to 60.0. The index was weighed down by declines in the New…
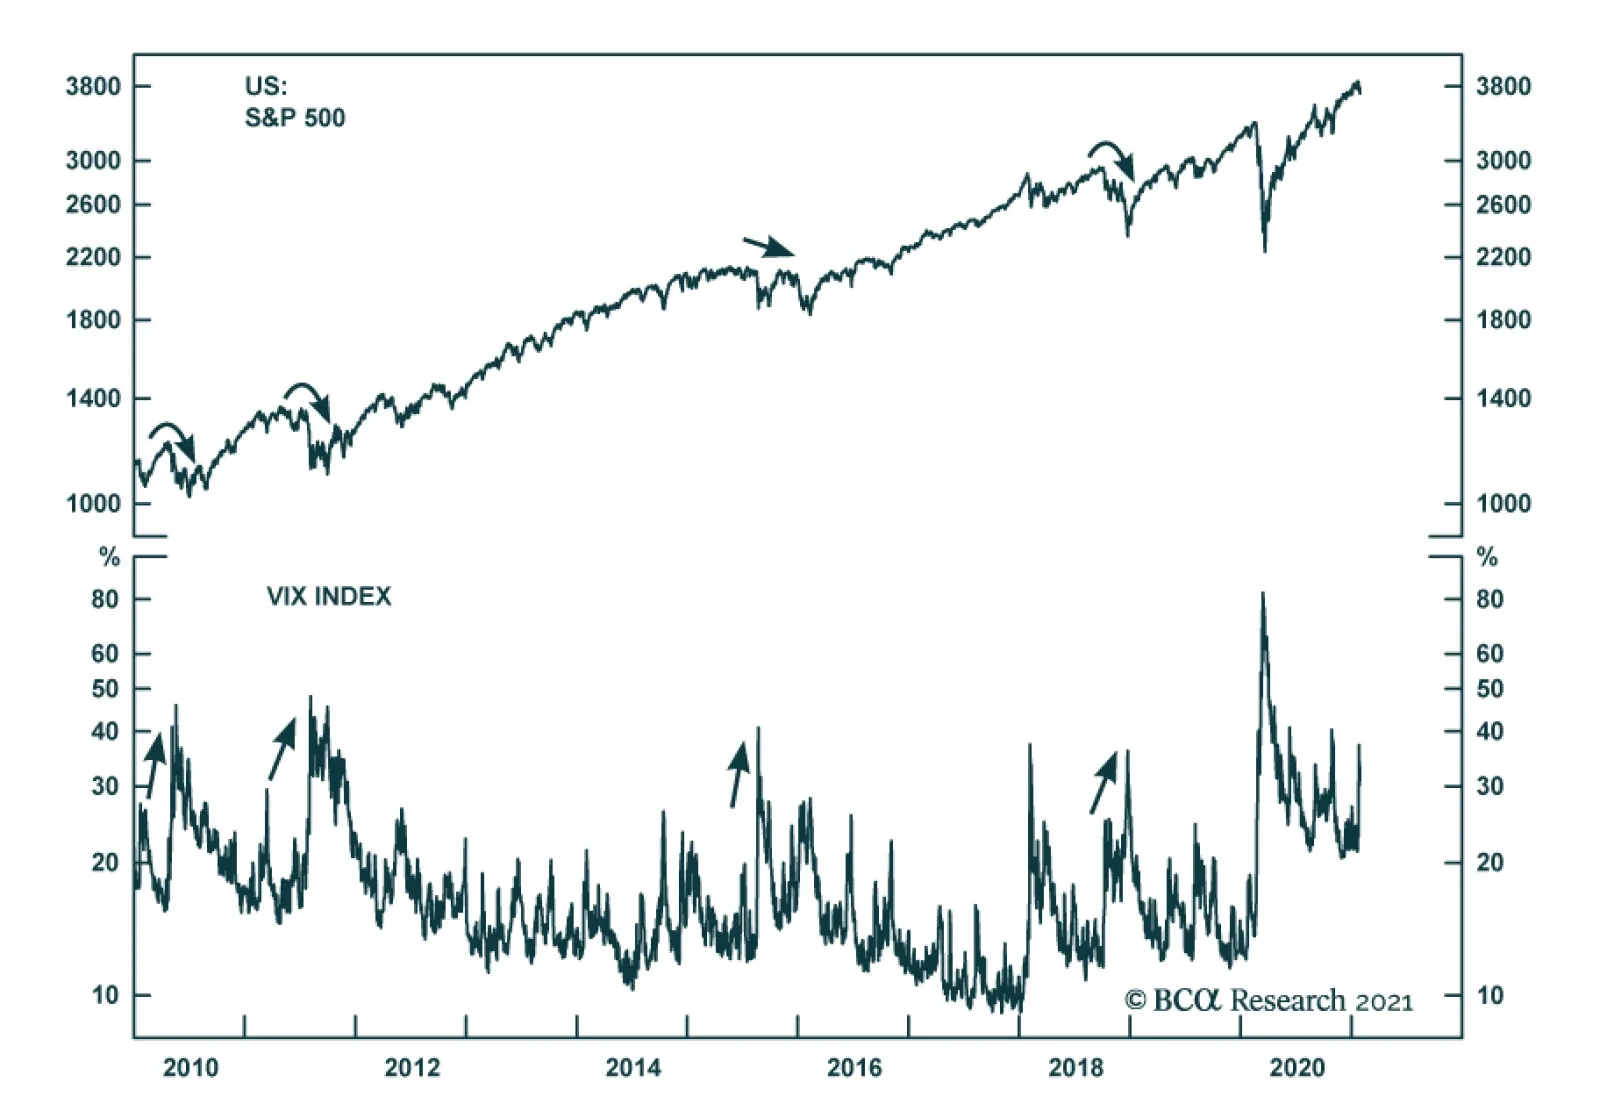
BCA Research’s US Equity Strategy service recommends that investors hold VIX June futures as a hedge to long equity exposure. Since December 2008, when the Fed first hit the zero lower bound and had commenced an unorthodox monetary policy experiment…
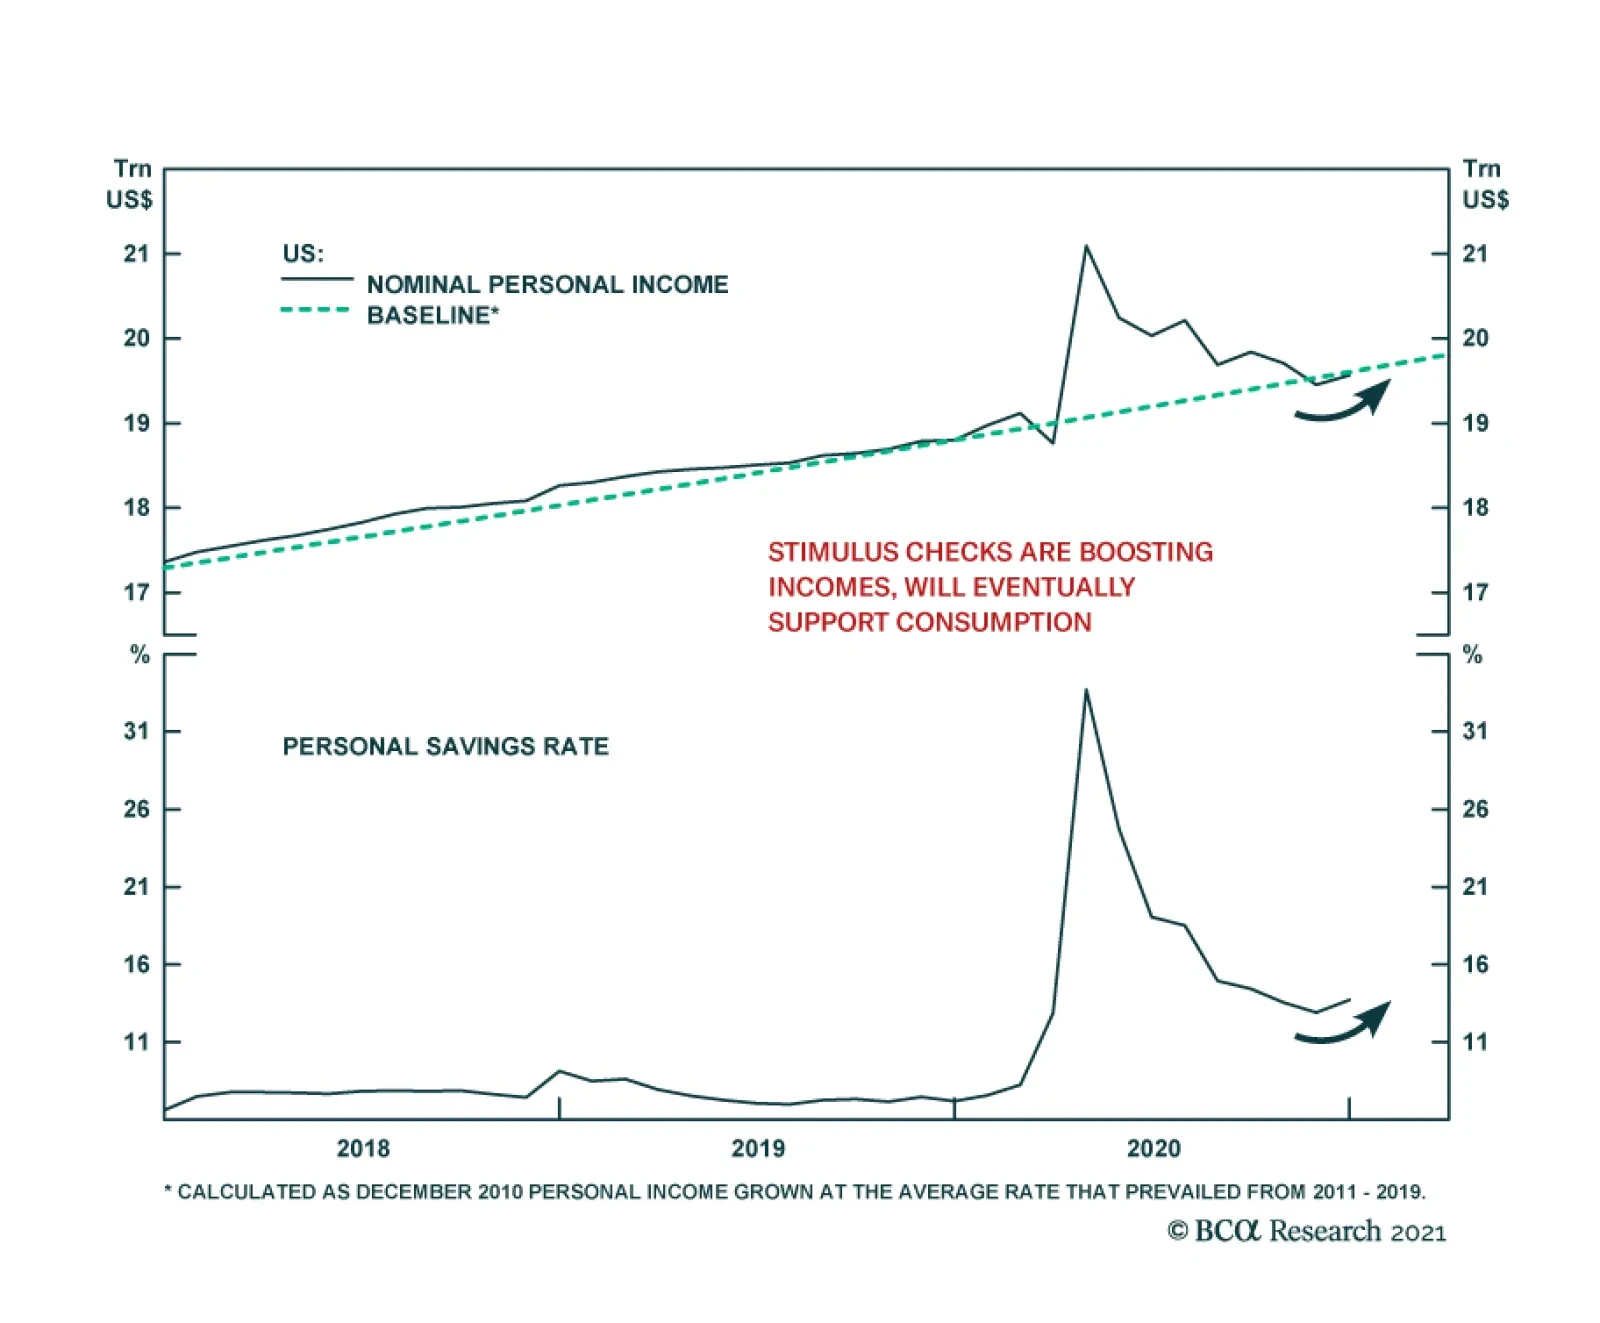
The latest US fiscal relief package is doing the trick. Personal income surprised to the upside in December, rising 0.6% m/m following two consecutive months of decline. The 2.3% m/m boost in government transfer payments, reversing a 7-month decline, drove…
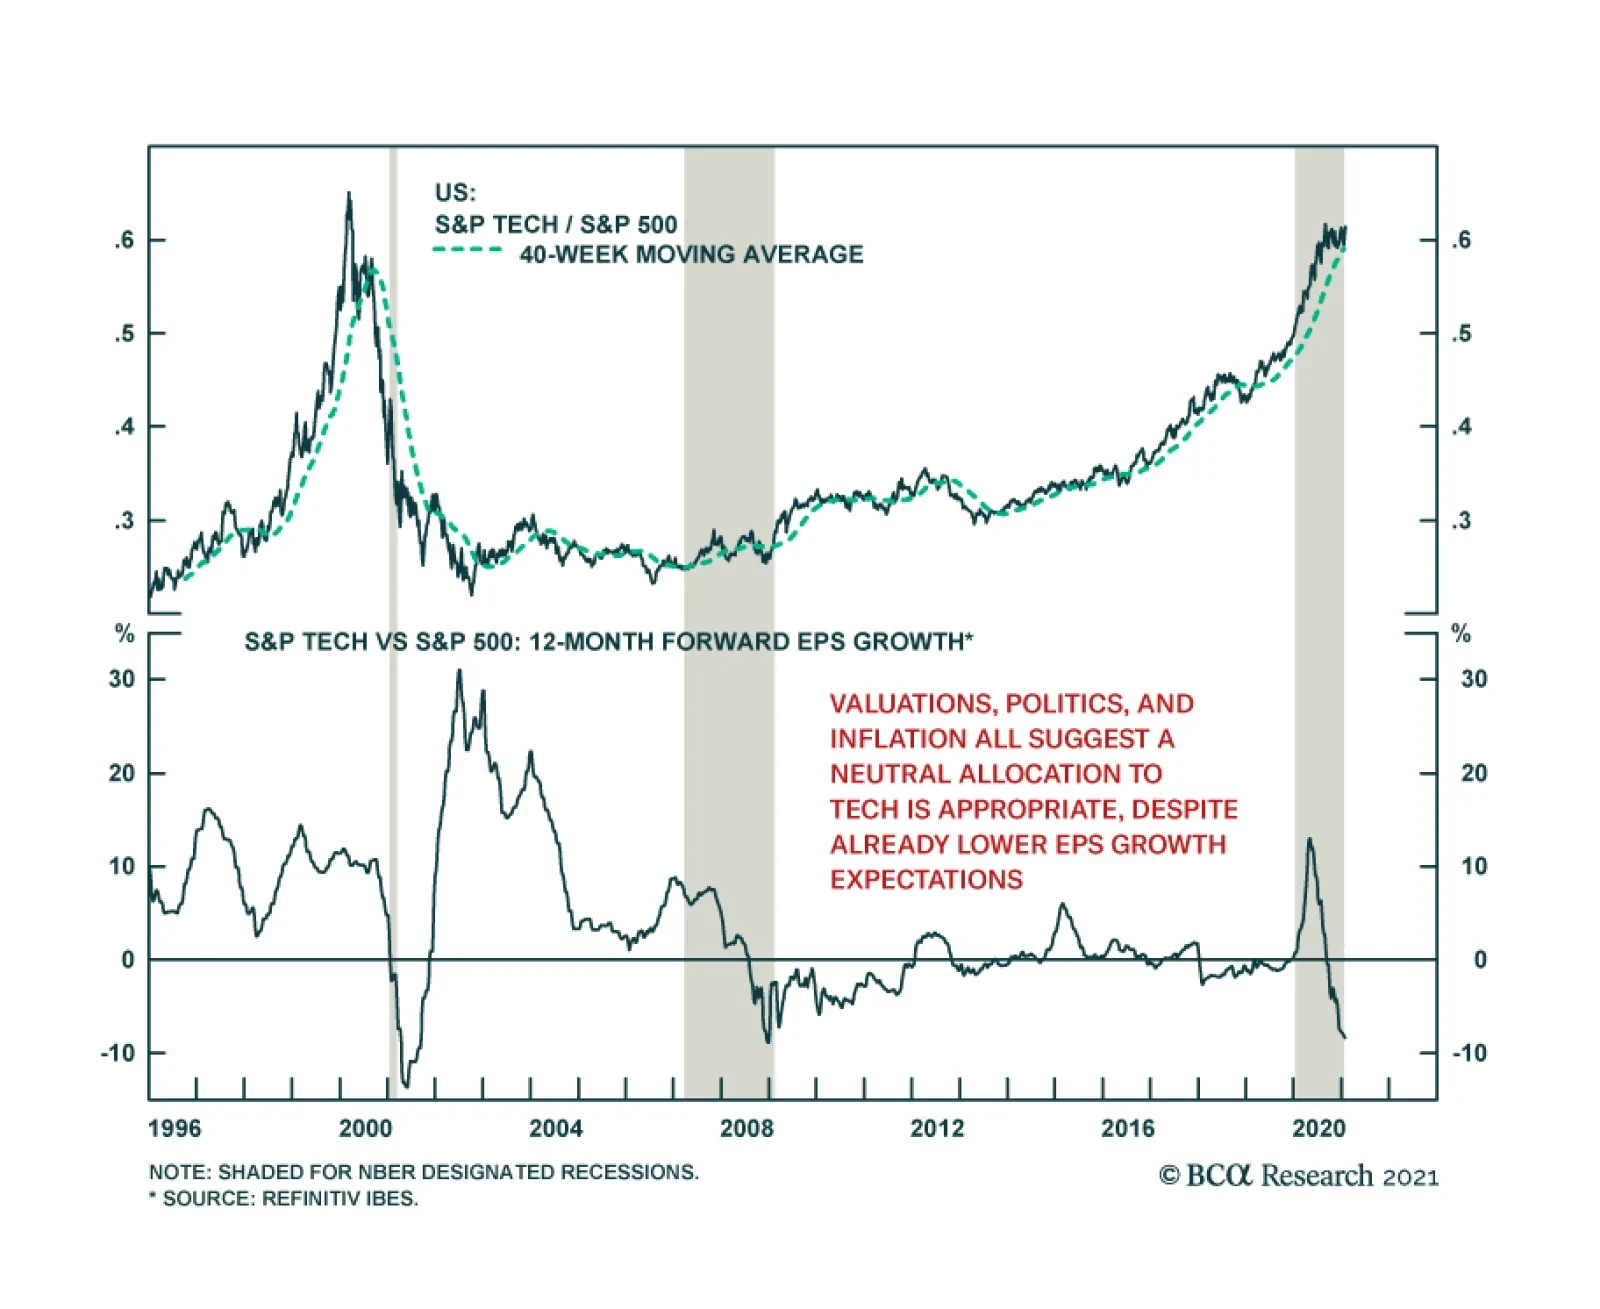
Major tech firms reported a series of excellent results last week, with top constituents Apple, Microsoft, Visa and Mastercard surpassing expectations. This begs whether the tech sector is set to resume its outperformance versus the S&P 500. We think not.…
Highlights The dollar bounce has further to run. The DXY index could touch 94 before working off oversold conditions. In this environment, yen long positions also provide an attractive hedge. Meanwhile, Japan has stepped back into deflation, with the resurgence in Covid-19 cases constraining activity and consumption spending. A modest rise in real rates will lead to a self-reinforcing upward spiral for the yen. Remain strategically short USD/JPY. Tactical investors can also short EUR/JPY as a trade. Eventually, when global growth picks up, the yen will weaken at the crosses. However, this is less likely in an environment where global yields remain anchored at low levels. We were stopped out of our long silver/short gold position last week. Reinstate. Feature The powerful bounce in global markets from the March lows is morphing into a speculative frenzy. The highlight this week centered on a few stocks, such as GameStop, Blackberry, and AMC Entertainment holdings, that have entered a manic phase. While liquidity conditions remain extremely favorable for risk assets, only a small shift in market sentiment may be required to trigger a reversal. The big risk from a technical perspective is that this reversal might be deeper and longer than most expect, given extremely overbought conditions. The dollar has tended to strengthen as market volatility rises. 2020 saw the rapid accumulation of dollar shorts, as low interest rates squeezed investors into more speculative assets, such as cryptocurrencies (Chart I-1). With these assets now having jumped high into the stratosphere, and dollar-short positioning at a bearish nadir, the nascent bounce in the USD could morph into something bigger. In our report a fortnight ago,1 we argued for a 2%-4% rise, putting 94 on the DXY index within striking distance. Chart I-1Some Signs Of Speculative Froth
Some Signs Of Speculative Froth
Some Signs Of Speculative Froth
Chart I-2The Yen Benefits From A Rise In Volatility
The Yen Benefits From A Rise In Volatility
The Yen Benefits From A Rise In Volatility
The yen also generally benefits from rising volatility (Chart I-2). Should a market correction develop, it will provide the necessary catalyst for established long yen positions. Meanwhile, as we argue below, the backdrop in Japan is becoming more deflationary, which is also yen bullish. We are already short USD/JPY in our portfolio and recommend going short EUR/JPY for a trade. The Yen And Global Markets The AUD/JPY rate is extremely sensitive to equity market conditions (Chart I-3). Therefore, one of the ways to play a potential reversal in equity markets and a rise in volatility is to short the AUD/JPY cross. While we certainly recommend this trade tactically, we prefer to express this view via a short EUR/JPY position. There are three main reasons for this. First, despite a significant rally in AUD/JPY, speculators are still very short the cross, as we showed two weeks ago. This is because short USD positions have been expressed in a concentrated number of currencies, including the euro. In a nutshell, speculators are very long EUR/USD and just neutral EUR/JPY (Chart I-4). This favors EUR short positions from a contrarian perspective, compared to AUD. Chart I-3The Yen And Equity Markets
The Yen And Equity Markets
The Yen And Equity Markets
Chart I-4Go Short EUR/JPY For A Trade
Go Short EUR/JPY For A Trade
Go Short EUR/JPY For A Trade
Second, Australia is doing much better in terms of containing the spread of Covid-19, compared to Europe as we argued last week.2 Australian export volumes and prices continue to recover smartly, and the basic balance remains in a healthy surplus. Meanwhile, there is a rising risk that the Covid-19 crisis will hit Europe particularly hard in Q1 this year. Interest rate markets are already beginning to discount this view. Real interest rates in the euro area are collapsing relative to Japan (Chart I-5). This will limit any fixed-income flows into the euro area from Japanese investors. At the margin, this is negative EUR/JPY. Third, given the most recent stimulus out of Europe, the European Central Bank’s (ECB) balance sheet is expanding faster than that of the Bank of Japan (BoJ). This has historically been negative for the EUR/JPY (Chart I-6). Chart I-5EUR/JPY And Real Interest Rates
EUR/JPY And Real Interest Rates
EUR/JPY And Real Interest Rates
Chart I-6EUR/JPY And Relative Balance Sheets
EUR/JPY And Relative Balance Sheets
EUR/JPY And Relative Balance Sheets
In a nutshell, equity markets are due for a healthy reset. In a similar fashion, a washing out of stale euro long positions will ensure the bull market for 2021 unfolds with higher conviction. Tactical investors can also short EUR/JPY as a trade. Outright short EUR/USD positions also make sense in the near term. The Yen And Japanese Growth Japan has re-entered a debt-deflation spiral, and it is unclear how it will exit this predicament, other than via a rebound in external demand. While it remains our base case that external demand will recover, the yen will be held hostage in the interim to short-term safe-haven inflows, as real rates remain well bid. Like most other economies, Japan is seeing the worst private-sector contraction in decades. For an economy that has held interest rates near zero since the better part of the 90s, this is not good news. Whenever the structural growth rate of the Japanese economy has fallen below interest rates, the trade-weighted yen has staged a powerful rally (Chart I-7). A strong yen, on the back of deficient domestic demand, then leads to a self-fulfilling deflationary spiral. Chart I-7The Story Of Japan In One Chart
The Story Of Japan In One Chart
The Story Of Japan In One Chart
The latest Bank of Japan (BoJ) meeting was a clear indication that the central bank was out of policy bullets (the central bank left policy largely unchanged). The BoJ began to acknowledge this problem with the end of the Heisei era3 two years ago. A policy review is due in March of this year, but with aggressive stimulus in place since governor Haruhiko Kuroda took helm almost a decade ago, it is difficult to see how any changes could steer Japan out of deflation and towards a 2% inflation target anytime soon. For example, with the BoJ owning 47% of outstanding JGBs, about 80% of ETFs and almost 5% of JREITs, the supply side puts a serious limitation on how much more stimulus the BoJ can provide. As a result, the impulse of the BoJ’s balance sheet could soon begin to fade, especially relative to that of other central banks (Chart I-8). Chart I-8The BoJ's Balance Sheet Could Peak Soon
The BoJ's Balance Sheet Could Peak Soon
The BoJ's Balance Sheet Could Peak Soon
2% Inflation = Mission Impossible? Most developed economies have not been able to meet their inflation targets over the last decade. While this might change going forward with unprecedented monetary and fiscal stimulus, it will not happen anytime soon. For example, the US is a much more closed economy than Japan and has not been able to maintain a 2% inflation rate since the Global Financial Crisis. This makes the BoJ’s target of 2% a pipe dream in the near future. Strictly looking at the data, the situation is even worse, with Japan having categorically stepped back into deflation (Chart I-9). The three key variables the authorities pay attention to for inflation – Core CPI, the GDP deflator, and the output gap – are all negative or rolling over. In fact, since the financial crisis, prices in Japan have only been able to really rise after a tax hike. Always forgotten is that the overarching theme for prices in Japan is a rapidly falling (and aging) population, leading to deficient demand (Chart I-10). Chart I-9Japan Is Back In Deflation
Japan Is Back In Deflation
Japan Is Back In Deflation
Chart I-10Japan Prices And Demographics
Japan Prices And Demographics
Japan Prices And Demographics
This view is corroborated in the inflation swap market. 5, 10, and 20-year inflation swaps in Japan are all depressed (Chart I-11). More importantly, with almost 50% of the Japanese consumption basket in tradeable goods, domestic inflation is as much driven by the influence of the BoJ or demographics, as it is by globalization. Chart I-11Is 2 Percent Inflation Mission Impossible?
Is 2% Inflation Mission Impossible?
Is 2% Inflation Mission Impossible?
Fiscal Policy To The Rescue? Chart I-12Falling Consumer Confidence In Japan
Falling Consumer Confidence In Japan
Falling Consumer Confidence In Japan
Most governments have carte blanche on fiscal stimulus. While it is certainly the case that the Japanese government could boost spending via transfer payments, much of this income is more likely to be saved than spent by the private sector. In other words, the savings ratio for workers continues to surge. If consumers were not willing to spend prior to COVID-19,4 they are unlikely to do so under much more uncertain future conditions (Chart I-12). Some of the government’s outlays will certainly go a long way to boosting aggregate demand, since the fiscal multiplier tends to be much larger in a liquidity trap. This will especially be the case for increased social security spending such as child education, construction activity, or the move towards promoting cashless transactions (with a tax rebate). However, there are important near-term offsets. The first is a potential postponement of the Olympics once again for 2021. This will continue to be a drag on Japanese construction activity. Second, the Covid-19 pandemic has severely curtailed tourism in Japan, especially as Niseko and Hakuba, important ski destinations for foreigners, lose inbound momentum. Tourism makes up a non-negligible component of Japanese income. Finally, the labor (and income) dividend from immigration has practically vanished. The Yen Beyond The Near Term Eventually, when global growth picks up, the yen will weaken at the crosses. However, this is less likely in an environment where global yields remain anchored at low levels. Real interest rates are already higher in Japan, and the above factors could meaningfully generate a deflationary impulse. As such, the starting point for yen long positions is already favorable (Chart I-13). Chart I-13The Yen And Relative Interest Rates
The Yen And Relative Interest Rates
The Yen And Relative Interest Rates
Chart I-14DXY And USD/JPY Usually Move Together
DXY And USD/JPY Usually Move Together
DXY And USD/JPY Usually Move Together
A continued rise in global equity markets is a key risk to our scenario. This will especially favor short dollar positions. However, as a low-beta currency, our contention is that the yen will surely weaken at its crosses, but could strengthen versus the dollar. The yen rises versus the dollar not only during recessions, but during most episodes of broad dollar weakness (Chart I-14). While short EUR/JPY positions will suffer, short USD/JPY bets should still fare well. As such, we remain strategically short USD/JPY. It is rare to find such a “heads I win, tails I do not lose too much” proposition. Housekeeping We were stopped out of our long silver/short gold position for a modest profit of 6%. We have profitably traded silver for almost two years now, and could see a speculative breakout in the metal over the next few months. We recommend reinstating this trade today with the ratio at 71, while maintaining our target at 65 and setting the stop loss at 72.5. We were also stopped out of our long petrocurrency basket versus the euro. With heightened volatility in oil prices, we will be looking to re-establish this trade from lower levels. Chester Ntonifor Foreign Exchange Strategist chestern@bcaresearch.com Footnotes 1 Please see our Foreign Exchange Strategy report, "Sizing A Potential Dollar Bounce," dated January 15, 2021. 2 Please see our Foreign Exchange and Global Fixed Income Strategy report, "Australia: Regime Change For Bond Yields And Currency," dated January 20, 2021. 3 The Heisei era refers to the period of Japanese history corresponding to the reign of Emperor Akihito, from January 8, 1989 until his abdication on April 30, 2019. 4 Ricardian equivalence suggests in simple terms that public-sector dissaving will encourage private-sector savings. Currencies U.S. Dollar Chart II-1USD Technicals 1
USD Technicals 1
USD Technicals 1
Chart I-2USD Technicals 2
USD Technicals 2
USD Technicals 2
Recent data in the US have been resilient: US manufacturing activity continues to outperform its peers, with a solid 59.1 print on the Markit PMI for January. The S&P CoreLogic house price index grew by 9.5% year-on-year in November. Consumer confidence remains resilient, with the expectations component surging for the month of January. 4Q GDP came in at an annualized 4% quarter-on-quarter, in line with expectations. The DXY index was flat this week. The latest FOMC meeting reinforced the view that there will be no rush to tighten US monetary policy. Two preconditions for tightening is inflation well above 2% and tight labor market conditions. This suggests the path for least resistance for the US dollar is down, albeit with some near-term consolidation. Report Links: The Dollar In A Blue Wave - January 8, 2021 The Dollar Conundrum And Protection - November 6, 2020 The Dollar In A Market Reset - October 30, 2020 The Euro Chart I-3EUR Technicals 1
EUR Technicals 1
EUR Technicals 1
Chart I-4EUR Technicals 2
EUR Technicals 2
EUR Technicals 2
Recent data from the euro area are softening: Manufacturing PMIs are rolling over, with the aggregate index down to 54.7 in January from 55.2. The German IFO Business climate index also softened from 92.1 to 90.1 in January. GfK consumer confidence slipped from -7.3 to -15.6 in February. The euro fell by 0.3% against the US dollar this week. As the broad dollar continues to work off oversold conditions, the euro remains a potent valve to allow for this reset. We are shorting EUR/JPY this week to profit from any setback in risk assets. Report Links: The Dollar Conundrum And Protection - November 6, 2020 Addressing Client Questions - September 4, 2020 On The DXY Breakout, Euro, And Swiss Franc - February 21, 2020 The Japanese Yen Chart I-5JPY Technicals 1
JPY Technicals 1
JPY Technicals 1
Chart I-6JPY Technicals 2
JPY Technicals 2
JPY Technicals 2
Recent data from Japan has been disappointing: Departmental store sales fell by 13.7% year-on-year in December. Retail sales are softening overall in Japan. Tokyo CPI will be released overnight and is expected to stay weak. The Japanese yen fell by 0.7% against the US dollar this week. Our highest conviction call over the next one to three months is to be long the yen both versus the dollar and versus the euro. As we discuss in the front section of this report, short USD/JPY is an attractive “heads I win, tails I do not lose too much” bet. Report Links: The Dollar Conundrum And Protection - November 6, 2020 The Near-Term Bull Case For The Dollar - February 28, 2020 Building A Protector Currency Portfolio - February 7, 2020 British Pound Chart I-7GBP Technicals 1
GBP Technicals 1
GBP Technicals 1
Chart I-8GBP Technicals 2
GBP Technicals 2
GBP Technicals 2
Recent data out of the UK have been softening: The Markit manufacturing PMI fell from 57.5 to 52.9 in January. 88K jobs were lost in the three months ending November. This pushed up the ILO unemployment rate to 5%. Average weekly earnings rose by 3.6% year-on-year in November. The British pound was flat against the US dollar this week. Post-Brexit relations and Covid-19 vaccinations continue to dominate the news flow in Britain. The latter is progressing, but a difficult adjustment remains for Britain’s exporters. This will add volatility to the pound. We remain short EUR/GBP on valuation grounds. Report Links: The Dollar Conundrum And Protection - November 6, 2020 Revisiting Our High-Conviction Trades - September 11, 2020 Updating Our Balance Of Payments Monitor - November 29, 2019 Australian Dollar Chart I-9AUD Technicals 1
AUD Technicals 1
AUD Technicals 1
Chart I-10AUD Technicals 2
AUD Technicals 2
AUD Technicals 2
Recent data from Australia have been improving: CPI went up a notch in the fourth quarter, to 0.9% from 0.7%. The weighted median number was more encouraging at 1.4% NAB Business conditions improved from 9 to 14 in December. However, the expectations component deteriorated from 12 to 4. 4Q export prices rose by 5.5% quarter-on-quarter. The Australian dollar fell by 0.9% against the US dollar this week. The Aussie has been consolidating gains for most of January. The dominant feature driving the Aussie in the near term will continue to be terms of trade. We expect the AUD to resume its uptrend after a brief consolidation phase. We shied from implementing a short AUD/JPY trade today, preferring to express this view via short EUR/JPY. Report Links: An Update On The Australian Dollar - September 18, 2020 On AUD And CNY - January 17, 2020 Updating Our Balance Of Payments Monitor - November 29, 2019 New Zealand Dollar Chart I-11NZD Technicals 1
NZD Technicals 1
NZD Technicals 1
Chart I-12NZD Technicals 2
NZD Technicals 2
NZD Technicals 2
There was scant data out of New Zealand this week: The trade surplus in 2020 was NZ$2.9bn, compared to a deficit of NZ$4.5bn in 2019. The New Zealand dollar fell by 0.4% against the US dollar this week. Agricultural prices are consolidating after a rebounding from the lows of last year. Poor weather continues to be a worry on the supply side, but this is already reflected in very long Ag positioning. More should continue to deflate air off the high-flying kiwi. Report Links: Currencies And The Value-Versus-Growth Debate - July 10, 2020 Updating Our Balance Of Payments Monitor - November 29, 2019 Place A Limit Sell On DXY At 100 - November 15, 2019 Canadian Dollar Chart I-13CAD Technicals 1
CAD Technicals 1
CAD Technicals 1
Chart I-14CAD Technicals 2
CAD Technicals 2
CAD Technicals 2
Recent data from Canada continues to disappoint: Building permits fell by 4.1% month-on-month in December. The Canadian dollar plunged by 1.3% against the US dollar this week. Oil prices are consolidating this year’s gains, which has weighed on the loonie. There is also the issue of the cancelled keystone XL pipeline, which is adding a risk premium for Canadian crude. We are short CAD/NOK as a trade, to capitalize on the latter headwind. Report Links: Currencies And The Value-Versus-Growth Debate - July 10, 2020 More On Competitive Devaluations, The CAD And The SEK - May 1, 2020 A New Paradigm For Petrocurrencies - April 10, 2020 Swiss Franc Chart I-15CHF Technicals 1
CHF Technicals 1
CHF Technicals 1
Chart I-16CHF Technicals 2
CHF Technicals 2
CHF Technicals 2
There was scant data out of Switzerland this week: The Swiss franc fell by 0.3% against the US dollar this week. The Swiss national bank (SNB) has two headaches to contend with in the coming weeks: a potential correction in the euro, which encourages safe-haven flows into the franc, and the lagged effects on a strong currency on domestic prices. This will force the hand of the SNB to continue being foreign exchange reserves at an aggressive pace. Report Links: The Dollar Conundrum And Protection - November 6, 2020 On The DXY Breakout, Euro, And Swiss Franc - February 21, 2020 Currency Market Signals From Gold, Equities And Flows - January 31, 2020 Norwegian Krone Chart I-17NOK Technicals 1
NOK Technicals 1
NOK Technicals 1
Chart I-18NOK Technicals 2
NOK Technicals 2
NOK Technicals 2
The data out of Norway has been robust: The unemployment rate came down in November to 5% from 5.2%. The Norwegian krone fell by 2% this week on oil-related losses. Despite this, good management of the COVID-19 situation remains a positive catalyst relative to US or European peers. We expect the krone to keep outperforming for the rest of the year. Report Links: Revisiting Our High-Conviction Trades - September 11, 2020 A New Paradigm For Petrocurrencies - April 10, 2020 Building A Protector Currency Portfolio - February 7, 2020 Swedish Krona Chart I-19SEK Technicals 1
SEK Technicals 1
SEK Technicals 1
Chart I-20SEK Technicals 2
SEK Technicals 2
SEK Technicals 2
Recent data from Sweden has been mixed: The unemployment rate ticked up in December from 8.3% to 8.7%. Retail sales fell by 0.6% year-on-year in December, after rising by 5.7% the previous month. The trade balance improved from SEK1.4bn to SEK2.7bn in December. The Swedish krona fell by 0.8% against the US dollar this week. As a high beta currency, the Swedish krona typically bears the brunt of a US dollar rally. However, this time around, valuations provide a sufficient margin of safety for investors that are long. Report Links: Revisiting Our High-Conviction Trades - September 11, 2020 Updating Our Balance Of Payments Monitor - November 29, 2019 Where To Next For The US Dollar? - June 7, 2019 Trades & Forecasts Forecast Summary Core Portfolio Tactical Trades Limit Orders Closed Trades
In last week’s US Sector Insight we showed how TSLA’s inclusion in the S&P 500 pushed consumer discretionary 5-year forward EPS growth into the stratosphere. We then dove deeper into this GICS1 sectors in this Monday’s Strategy Report and downgraded the S&P automobiles & components index to underweight. On the profit front, a wide gap has opened between relative share prices and relative forward EPS, which suggests that high-flying auto stocks will soon stop defying gravity (Chart 1). At the same time, technicals are also waving a red flag: the S&P autos & components relative annualized 13-week rate of change clocked in at over 250%/annum, steeply diverging from relative net EPS revisions (Chart 2). Chart 1Shy Away From Cult Stocks
Shy Away From Cult Stocks
Shy Away From Cult Stocks
Chart 2Shy Away From Cult Stocks
Shy Away From Cult Stocks
Shy Away From Cult Stocks
Given that auto manufacturing is a cutthroat business with razor thin margins and that other Japanese, German and Chinese BEV manufacturers are entering the scene (for example VW Group outsold TSLA last year by a factor of over 3-to-1 in Norway, which is the most advanced BEV market), we doubt that prices will sustain their divergence from profits for much longer. Bottom Line: We trimmed the S&P automobiles & components index to underweight. The ticker symbols for the stocks in this index are: BLBG: S5AUCO – TSLA, GM, F, APTV, BWA.
Highlights US-China tensions are escalating over the Taiwan Strait as Beijing tests the new Biden administration, yet financial markets are flying high and unprepared for a resumption of structurally elevated geopolitical risk. US restrictions on Chinese tech and arms sales, US internal political divisions, Taiwanese independence activists, China’s power grab in Hong Kong, and aggressive foreign policy from Xi Jinping create what could become a perfect storm. The rattling of sabers can escalate further as a “fourth Taiwan Strait crisis” has been a long time coming – though “gun to head” we do not think China’s civilian leadership is ready to initiate a war over Taiwan. Biden’s shift to a more defensive US strategy on tech offers Beijing the far less risky alternative of continuing its current (very successful) long game. We are closing most of our risk-on, cyclical trades and shifting to a neutral position until we can get a better read on how far the crisis will escalate. Maintain hedges and safe-haven trades: gold, yen, health stocks, an Indian overweight in EM, and defense stocks relative to others. Feature President Joe Biden faces his first crisis as the US and China rattle sabers over the Taiwan Strait. The crisis does not come at a surprise to watchers of geopolitics but it could produce further negative surprises for financial markets that are just starting to take note of it. This premier geopolitical risk combined with vaccine rollout problems, weak economic data releases, and signs of froth sent global equities down 2% over the past five days. The US 10-year Treasury yield fell to 1%, the USD-CNY rose by 0.03%, gold fell by 0.6%, and copper fell by 2%. As things stand today, we are prepared to buy on the dip but we are closing most of our long bets and positioning for a big dip now that our premier geopolitical risk in the Taiwan Strait shows signs of materializing. A series of Chinese air force drills have cut across the far southwestern corner of Taiwan’s Air Defense Identification Zone (ADIZ) over the past week, giving alarm to the Taiwanese military (Map 1). Beijing is sending a clear warning to the Biden administration that Taiwan is its “red line” – namely Taiwanese independence but also Beijing’s access to Taiwanese-made semiconductors. There is not yet a clear signal that China is about to attack or invade Taiwan but an attack is possible. Investors should not underrate the significance of a show of force over Taiwan at this juncture. Map 1Flight Paths Of People’s Liberation Army Aircraft, January 24, 2021
Is The Taiwan Strait Crisis Here? – A GeoRisk Update
Is The Taiwan Strait Crisis Here? – A GeoRisk Update
Chart 1Global Trade Troubles
Global Trade Troubles
Global Trade Troubles
We are also taking this opportunity to book a 37% gain on our long US energy trade. Global politics are fundamentally anarchic in the context of the US’s relative geopolitical decline, and internal divisions and distractions, and the simultaneous economic shocks that have knocked global trade off course (Chart 1), jeopardizing the newfound success and stability of the ambitious emerging market challengers to the United States. Geopolitical Risk Is Back (Already) Chart 2US And China Lead Global Growth Recovery
US And China Lead Global Growth Recovery
US And China Lead Global Growth Recovery
The US and China have snapped back more rapidly than other economies from the COVID-19 pandemic despite their entirely different experiences (Chart 2). The virus erupted in China but its draconian lockdowns halted the outbreak while it unleashed a wave of monetary and fiscal stimulus to reboot the economy. The US showed itself unwilling and unable to maintain strict lockdowns, leaving its economy freer to operate, and yet also unleashed a wave of stimulus. The US stimulus is the biggest in the world yet China’s is underrated in Chart 3 due to its reliance on quasi-fiscal credit expansion, which amounted to 8.5% of GDP. That goes on top of the 5.6% of GDP fiscal expansion shown here. For most of the past year financial markets have priced the positive side of this stimulus – the fact that it prevented larger layoffs, bankruptcies, and defaults and launched a new economic cycle. Going forward they will face the negative side, which includes financial instability and foreign policy assertiveness. Countries that are domestically unstable yet fueled by government spending can take risks that they would not otherwise take if their economy depended on private or foreign sentiment. The checks and balances that prevent conflict during normal times have been reduced. Chart 3US Leads Stimulus Blowout This Time, Though China Stimulus Larger Than Appears
Is The Taiwan Strait Crisis Here? – A GeoRisk Update
Is The Taiwan Strait Crisis Here? – A GeoRisk Update
Global economic policy uncertainty has fallen from recent peaks around the world but it remains elevated in the US, China, and Russia, which are engaged in a great power struggle that will continue in the coming years (Chart 4). This struggle has escalated with each new crisis point, from 2001 to 2008 to 2015 to 2020, and shows no sign of abating in 2021. Chart 4APolicy Uncertainty Still Rising Here ...
Policy Uncertainty Still Rising Here ...
Policy Uncertainty Still Rising Here ...
Chart 4B... And Can Easily Revive Here
... And Can Easily Revive Here
... And Can Easily Revive Here
Chart 5Terrorism Falling In World Ex-US (For Now)
Terrorism Falling In World Ex-US (For Now)
Terrorism Falling In World Ex-US (For Now)
Europe, the UK, Australia, and various emerging markets will suffer spillover effects from this geopolitical struggle as well as from their own domestic turmoil in the wake of the global recession. Immigration and terrorism have dropped off in recent years but will revive in the Middle East and elsewhere when the aftershocks of the global crisis lead to new state failures, weakened governments, and militant extremism (Chart 5). In many countries, domestic political risks appear contained today but the reality is that social unrest and political opposition will mount over time if unemployment is not dealt with and inflation starts to climb. These two factors combine form the “Misery Index,” a useful indicator of socio-political discontent. India, Russia, Brazil, Turkey, South Africa, Mexico, and Indonesia are just a few of the major emerging markets that face high or rising misery indexes and hence persistent forces for political change (Chart 6). Chart 6AMore Social And Political Unrest To Come
More Social And Political Unrest To Come
More Social And Political Unrest To Come
Chart 6BMore Social And Political Unrest To Come
More Social And Political Unrest To Come
More Social And Political Unrest To Come
So far there have not been many changes in government – the US is the major exception. But change will accelerate from here. It is not hard to see that weakening popular support for national leaders and their ruling coalitions will result in more snap elections, election upsets, and surprise events in the coming months and years (Chart 7). Chart 7Changing Of The Guard Under Way In Global Politics
Is The Taiwan Strait Crisis Here? – A GeoRisk Update
Is The Taiwan Strait Crisis Here? – A GeoRisk Update
Chart 8Italian Elections Heighten Sovereign Spread
Italian Elections Heighten Sovereign Spread
Italian Elections Heighten Sovereign Spread
For example, Italian voters likely face an early election even though Prime Minister Giuseppe Conte saw some of the best opinion polling of any first-world leader since COVID emerged. Last year we identified Italy as a leading candidate for an early snap election and we still maintain that an election is the likeliest outcome of the crumbling ruling coalition. The pandemic has created havoc in the country and now the ruling parties want to take advantage of the situation to strengthen their hand in distributing the $254 billion in European recovery funds destined for Italy. A new electoral law was passed in the fall, enabling an election to go forward, and the leading parties all hope to have control of parliament when the next presidential election occurs in early 2022, since the president is a key player in government and cabinet formation. Political risk is therefore set to increase and boost the risk premium in Italian bonds, producing a counter-trend spread widening for the coming 12 months or so (Chart 8). Anti-establishment right-wing parties, which taken together lead in public opinion, threaten to blow out the Italian budget. It is not a foregone conclusion that they will prevail – and these parties have moderated their rhetoric on the euro and monetary union – but it is an understated risk at present and has some staying power, even if moderate by the standards of geopolitical risks in other regions. Russia also faces rising political and geopolitical risk in the aftermath of the pandemic, which has had an outsized effect on a population that is disproportionately old and unhealthy (Chart 9). Moscow is now witnessing the most serious outpouring of government opposition since 2011 despite the fact that its cyclical economic conditions are not the worst among the emerging markets. The economic recovery is likely to be stunted by the new US administration’s efforts to extend and expand sanctions and any geopolitical conflicts that ensue. We remain negative on Russian equities as we have for the past two years and look at other emerging market oil plays as offering the same value without the geopolitical risk (Chart 10). Chart 9Russian Social Unrest Aggravated By Pandemic
Is The Taiwan Strait Crisis Here? – A GeoRisk Update
Is The Taiwan Strait Crisis Here? – A GeoRisk Update
Chart 10Russian Equities Face Persistent Geopolitical Risk
Russian Equities Face Persistent Geopolitical Risk
Russian Equities Face Persistent Geopolitical Risk
Investors do not need to care about social unrest in itself but do need to pay attention when it leads to a change in government or the overall policy setting. This is what we will monitor for the countries highlighted in these charts as being especially at risk. Italy and Spain are the most likely to see government change in the developed world, though we should note that however stable Germany’s ruling Christian Democrats appear as Chancellor Angela Merkel steps down, there could still be an upset this fall (Chart 11). France’s Emmanuel Macron is still positioned for re-election next year but his legislative control is clearly in jeopardy – and it is at least worth noting that the right-wing anti-establishment leader Marine Le Pen has started to move up in the polls for the first time since 2017, even though she has a very low chance of actually taking power (Chart 12). Chart 11German Election Not A Foregone Conclusion
German Election Not A Foregone Conclusion
German Election Not A Foregone Conclusion
Chart 12Signs Of Life For Marine Le Pen?
Signs Of Life For Marine Le Pen?
Signs Of Life For Marine Le Pen?
Chart 13UK Now Turns To Keeping Scotland
UK Now Turns To Keeping Scotland
UK Now Turns To Keeping Scotland
Even the UK, which has found the “middle way” solution to the Brexit imbroglio, in true British form, faces a significant increase in political risk beginning with local elections in May. If these produce a resounding victory for the Scottish National Party then it will interpret the vote as a mandate to pursue a second independence referendum, which will be a narrow affair even if Prime Minister Boris Johnson is tentatively favored to head it off (Chart 13). Bottom Line: Financial markets have been preoccupied with the pandemic and global stimulus. But now political and geopolitical risks are underrated once again. They are starting to rear their heads, not only in the US-China-Russia power struggle but also in the domestic politics of countries that face high policy uncertainty and high or rising misery indexes. Biden And Xi Bound To Collide It is too soon to identify the “Biden Doctrine” in American foreign policy, as the new president has not yet taken significant action, but the all-too-predictable showdown in the Taiwan Strait could provide the occasion. Since the fall of 2019 we have warned that US-China great power competition would intensify despite any “phase one” trade deal. President Trump undertook a flurry of significant punitive measures on China during his lame duck months in office and now Beijing is pressuring the Biden administration to reverse these measures or at least call a halt to them. The fundamental premise of Biden’s campaign against President Trump was that he would restore America’s active role in international affairs against the supposed isolationism of Trump. Of course, the fact that the Democrats gained full control of Congress means that Biden will not be restricted to foreign policy over his four-year term but will be consumed with trying to cut deals on Capitol Hill to pass his domestic agenda. Nevertheless Biden’s foreign policy schedule is already packed as he is rattling sabers with China, issuing warnings to Russian President Vladimir Putin, and cutting off arms sales to Saudi Arabia and the UAE to signal that he intends to reformulate the Iranian nuclear deal. Americans broadly favor an active role in the world, which is clear from opinion polling in the wake of Trump’s challenge to the status quo – they are weary of wars in the Middle East but are not showing appetite for a broader withdrawal from global affairs (Chart 14). Similarly polling on global trade shows that Trump, if anything, roused the public’s support for trade despite French or Japanese levels of skepticism about it. Chart 14Americans Still Favor Global Engagement
Americans Still Favor Global Engagement
Americans Still Favor Global Engagement
The implication is that the US budget deficit will remain larger for longer and that the US trade deficit will balloon amidst a surge in domestic demand. Trump’s attempt to shrink trade deficits without shrinking the budget deficit (or overall demand) proved economically impossible. Chart 15Biden And The US Role In The World
Biden And The US Role In The World
Biden And The US Role In The World
The Biden administration is opting for expanding the twin deficits albeit at a much greater risk to the dollar’s value. Markets have already discounted this shift to the point that the dollar is experiencing a bounce from having reached oversold levels. The bounce will continue but it is against the grain, the fall will resume later, as indicated by these policies. Another implication is that defense spending will not fall much due to the geopolitical pressures facing the Biden administration. Non-defense spending will go up but defense spending will remain at least flat as a share of overall output (Chart 15). With this policy setting in the US, policy developments in China made it inevitable that US-China strategic tensions would resume where Trump left off despite Biden’s campaign platform of de-emphasizing the China threat. In the long run, Biden’s push for renewed engagement with China runs up against the fact that Beijing’s overarching political and economic strategy is focused on import substitution and technological acquisition, as outlined in the fourteenth five-year plan. China’s share of global exports has grown even larger despite the pandemic and yet China is weaning itself off of global imports in pursuit of strategic self-sufficiency. The US will be left with less global export share, less market access in China, and ongoing dependency on trade surplus nations to buy its debt (Chart 16). Unless, that is, the Biden administration engages in very robust diplomacy and is willing to take geopolitical risks not unlike those that Trump took. Chart 16China's Role In The World Motivates Opposition
China's Role In The World Motivates Opposition
China's Role In The World Motivates Opposition
Chart 17China Plays Are Getting Stretched
China Plays Are Getting Stretched
China Plays Are Getting Stretched
One of the clear takeaways from the above is that industrial metals and China plays, like the Australian dollar and Swedish equities, are facing a pullback. Though Chinese policymakers will ultimately accommodate the economy, the combination of a domestic policy tug-of-war and a renewal of US-China tensions will take the air out of these recent outperformers (Chart 17). Bottom Line: The Biden administration faces a resumption in strategic tensions with China. First, the immediate crisis over the Taiwan Strait can escalate from here (see below). Second, the US-China economic conflict is set to escalate over the long run with the US pursuing an unsustainable policy of maximum reflation while China turns away from the liberal “reform and opening” agenda that enabled positive US-China ties since 1979. This combination points to a large increase in the US trade dependency on China even as China grows more independent of the US and technologically capable. This result ensures that tensions will persist over the long run. Is The Fourth Taiwan Strait Crisis Already Here? Biden may be forced into significant foreign policy action right away in the Taiwan Strait, where General Secretary Xi Jinping has put his fledgling administration to the test. Over the past week Beijing has sent a large squadron of nuclear-capable bombers and fighter jets to cut across the far southwest corner of Taiwan’s Air Defense Identification Zone (Map 2). This activity is a continuation of an upgraded tempo of military drills around the island, including a flight across the median line last year, and follows an alleged army build-up across from the island last year.1 The US for its part has upgraded its freedom of navigation operations over the past several years, including in the Taiwan Strait (though not yet putting an aircraft carrier group into the strait as in the 1990s). Map 2Flight Paths Of People’s Liberation Army Aircraft, January 25-28, 2021
Is The Taiwan Strait Crisis Here? – A GeoRisk Update
Is The Taiwan Strait Crisis Here? – A GeoRisk Update
In response to China’s sorties on January 23, the US State Department urged the People’s Republic to stop “attempts to intimidate its neighbors, including Taiwan,” called for mainland dialogue with Taiwan’s “elected representatives” (albeit not naming anyone), declared that the US would deepen ties with Taiwan, and pledged a “rock-solid” commitment to the island. Not coincidentally the USS Roosevelt aircraft carrier arrived in the South China Sea on the same day as China’s largest sortie, January 24. Meanwhile a Chinese government spokesman said the military drills should be seen as a “solemn warning” to the Biden administration that China will reunify the island by force if necessary. China is not only concerned about Taiwanese secession and US-Taiwan defense relations, as always, but is specifically concerned that the Biden administration will persist with the technological “blockade” that the Trump administration imposed on Huawei, Semiconductor Manufacturing International Corporation (SMIC), their suppliers, and a range of other Chinese state-owned enterprises and tech firms. Neither the US nor Chinese statements have yet made a definitive break with the longstanding policy framework on Taiwan that first enabled US-China détente and engagement. The US State Department reiterated its commitment to the diplomatic documents that frame the relationship with the People’s Republic and the Republic of China, namely the Three Communiques, the Taiwan Relations Act, and the Six Assurances. It did not make explicit mention of the One China Policy although the US version of that policy is incorporated in the first of the three communiques (the 1972 Shanghai Communique). However, China may not be appeased by this statement. Xi Jinping has gradually shifted the language in major Communist Party policy statements over the past several years to indicate a greater willingness to use force against Taiwan, even suggesting that he envisions the reunification of China by 2035.2 The Trump administration’s offensives have accelerated this security dilemma. In addition to export controls on high tech, Trump signed several significant bills on Taiwan into law over the course of his term that aim to upgrade the relationship. These include the Taiwan Assurance Act of 2020 at the end of last year, which calls for deeper US-Taiwan relations, greater Taiwanese involvement in international institutions, larger US arms sales to support Taiwan’s defense strategy, and more diplomatic exchanges.3 Separately, the US and Taiwan also signed a science-and-technology cooperation agreement on December 15 and the Biden administration is interested in negotiating a free trade agreement.4 A few additional points: The struggle over access to Taiwan’s state-of-the-art semiconductor production continues to escalate. The Trump administration concluded its tenure by cutting off American exports of chips, parts, designs, and knowhow to Chinese telecom giant Huawei, thus putting Taiwan Semiconductor Manufacturing Company (TSMC) into the position of having to halt sales of certain goods to the mainland. TSMC accounts for one-fifth of global semiconductor capacity and produces the smallest, fastest, and most efficient chips. China’s SMIC has been hamstrung by these controls as well as Huawei and other Chinese tech champions. This issue remains unresolved and is the primary immediate driver of conflict between the US and China since both economies would suffer if semiconductor supplies were severed. The US’s capability of imposing a tech blockade on China threatens its long-term productivity and hence potentially regime survival, while China’s capability of attacking Taiwan threatens the critical supply lines of the US and its northeast Asian allies, including essential computer chips for US military needs (the main reason the US has tried to strong-arm TSMC into building a fabrication plant in Arizona).5 US arms sales en route to Taiwan. While there are rumors that the Biden administration will delay these sales, the Taiwanese government claims they have been assured that the transfers will go forward. This arms package does not include the most provocative weapons systems, such as F-35 fighter jets, but it does contain advanced weapons systems and weapons that can be seen as offensive rather than defensive. These include truck-mounted rocket launchers, precision strike missiles, 66 F-16 fighter jets, Harpoon anti-ship missiles, subsea mines, and advanced drones. So it is possible that Beijing will put its foot down to prevent the transfer, just as it tried to halt the less-sensitive transfer of THAAD missiles to South Korea during the last US presidential transition. If this should be the case then it will cause a major escalation in tensions until the US either halts the arms transfer or completes it – and completing the transfer, if China issues an ultimatum, will lead to conflict. Growth of “secessionist forces” in Taiwan. Chinese media have specifically cited a political “alliance” that formed on January 24 and aims to revise the island’s democratic constitution. The Taiwanese public no longer sees itself primarily as Chinese but as Taiwanese and is increasingly opposed to eventual reunification. What is the end-game? First, as stated, the current escalation in tensions can go much further in the coming weeks and months. We are not prepared to sound the “all clear” as a confrontation has been building for years and could conceivably amount to Cuban Missile Crisis proportions, which would likely trigger a bear market. Second, we do not yet see China staging a full-scale attack or invasion on Taiwan. China’s goal is to continue expanding its economy and technology, its economic heft in Asia and the world, and thus its global influence and military power. It cannot achieve this goal if it is utterly severed from Taiwan, but it also cannot achieve this goal if it precipitates a war with not only Taiwan but also the US, Japan, other US allies, and a devastation of the very semiconductor foundries upon which Taiwan’s critical importance stands. Playing the long game of growing its economy and taking incremental steps of imposing its political supremacy has paid off so far, including in Hong Kong and the South China Sea. Both Russia’s and China’s gradual slices of regional power have demonstrated that the US does not have the appetite, focus, and resolve to fight small wars at present – whereas Washington is untested on its commitment to major wars such as an invasion of Taiwan would precipitate. At very least China needs to determine whether the Biden administration intends to impose a technological blockade, as the Trump administration looked to do. Biden has so far outlined a “defensive game” of securing US networks, preventing US trade in dual-use technologies that strengthen China’s military, on-shoring semiconductor production, and accelerating US research and development. This leaves open the possibility of issuing waivers for trade in US-made or US-designed items that do not have military purposes, albeit with the US retaining the possibility of removing the waivers if China does not reciprocate. This strategy amounts to what Biden’s “Asia Tsar,” Kurt Campbell, has called “stable competition.” Therefore the earliest indications from the Biden administration suggest that it will seek a lowering of temperature while defending the US’s red lines – and this should prevent a full-scale Taiwan war in the short run, though it does not prevent a major diplomatic crisis at any time. If Biden does in fact pursue this more accommodative approach, and seeks to reengage China, then that Beijing has a much lower-cost strategy that is immediately available, as opposed to an all-or-nothing gambit to stage the largest amphibious assault since D-Day, which is by no means assured to succeed and could in the worst case provoke a nuclear war. This strategy includes negotiating waivers on US tech restrictions, accelerating its high-tech import substitution strategy, and continuing to poach the talent from Taiwan and steal the technology needed to circumvent US restrictions. As long as Washington does not make a dash for a total blockade, Beijing should be expected to pursue this alternate strategy. Investment Takeaways The market is not priced for a serious escalation in US-China-Taiwan tensions. If there is a 17% chance of a 30%-40% drawdown in equities on jitters over a major war, then equities should suffer a full 7%+ correction to discount the possibility. While the prospects of full-scale war are much lower, at say 5%, these odds could escalate rapidly if the two sides fail to mitigate a diplomatic or military crisis through red telephone communications. Chart 18China/Taiwan Policy Uncertainty Will Converge To Upside
China/Taiwan Policy Uncertainty Will Converge To Upside
China/Taiwan Policy Uncertainty Will Converge To Upside
While Chinese policy uncertainty remains elevated, it still has plenty of room to rise. It has diverged unsustainably from Taiwanese uncertainty, which only recently showed signs of ticking up in response to manifest strategic dangers. This gap will converge to the upside as US-China tensions persist and the global news media gradually turns its spotlight away from Donald Trump, alerting financial markets to the persistence of the world’s single most important geopolitical risk right under their nose (Chart 18). Inverting our market-based Geopolitical Risk Indicators, so that falling risk is shown as a rising green line, it becomes apparent that Chinese equities and Taiwanese equities have gone vertical, have only started to correct, and are highly exposed to exogenous events stemming from their fundamentally unstable political relationship. Hong Kong stocks, by contrast, have performed in line with the market’s perception of their political risk, so that there is less discrepancy between market sentiment and reality – even though they will also sell off in the event that this week’s events escalate into a larger confrontation (Chart 19). Chart 19Geopolitical Risks Lurking In Asian Equities
Geopolitical Risks Lurking In Asian Equities
Geopolitical Risks Lurking In Asian Equities
Chart 20Stay Long Korea / Short Taiwan Due To Geopolitical Risk
Stay Long Korea / Short Taiwan Due To Geopolitical Risk
Stay Long Korea / Short Taiwan Due To Geopolitical Risk
South Korean stocks were also overstretched and due for correction. We have long advocated a pair trade favoring Korean over Taiwanese stocks to capture the relative geopolitical risk as well as more favorable valuations in Korea (Chart 20). The ingredients for a fourth Taiwan Strait crisis are all present. This week’s showdown could escalate further. Global and East Asian equities are overbought and vulnerable to a larger correction, especially Taiwanese stocks. US equities are also sky-high and vulnerable to a larger correction, although they would be favored relative to the rest of the world in the event of a full-fledged crisis. Chart 21Geopolitical Flare-Up Would Upset This Trend
Geopolitical Flare-Up Would Upset This Trend
Geopolitical Flare-Up Would Upset This Trend
We maintain our various geopolitical longs and hedges, including gold, Japanese yen, an Indian overweight within EM, and health stocks. We remain long global defense stocks as well. Because our base case is that the current crisis will not result in war, but rather high diplomatic tensions, we are inclined to buy on the dips. But we expect a big dip even in the event of a merely diplomatic crisis that involves no jets shot down or ships sunk. Therefore for now we are closing long municipal bonds versus Treasuries, long international stocks versus American, long GBP-EUR, long Trans-Pacific Partnership countries, and long value versus growth stocks. These trades should be reinitiated once we have clarity on the magnitude of the US-China crisis, given the extremely accommodative economic and policy backdrop, which will, if anything, become more accommodative if geopolitical risks materialize yet fall short of total war. Oil and copper would suffer relative to gold in the meantime (Chart 21). Our remaining strategic portfolio still favors stocks that would ultimately benefit from instability in Greater China, such as European industrials relative to global, Indian equities relative to Chinese, and South Korean equities relative to Taiwanese. While the spike in tensions reinforces our conclusion in last week’s report that long-dated Chinese government bonds should rally on Taiwan risk, this recommendation was made in the context of discussing domestic Chinese markets and is primarily intended for mainland investors or those with a mandate to invest in Chinese assets. Foreign investors could conceivably be exposed to sanctions or capital controls in the event of a major crisis – as we have long flagged is also a risk with foreign holders of Russian ruble-denominated bonds. We have made a note in our trade table accordingly. Matt Gertken Vice President Geopolitical Strategy mattg@bcaresearch.com Footnotes 1 Brad Lendon, "Almost 40 Chinese warplanes breach Taiwan Strait median line; Taiwan President calls it a 'threat of force,'" CNN, September 21, 2020, cnn.com. 2 Richard C. Bush, "8 key things to notice from Xi Jinping’s New Year speech on Taiwan," Brookings Institute, January 7, 2019, brookings.com. 3 Trump also signed the Taiwan Travel Act on March 16, 2018 and the Taiwan Allies International Protection and Enhancement Initiative Act on March 26, 2019. For the Taiwan Assurance Act, see Kelvin Chen, "Trump Signs Taiwan Assurance Act Into Law," Taiwan News, December 28, 2020, taiwannews.com. 4 Jason Pan, "Alliance formed to draft Taiwanese constitution," Taipei Times, January 24, 2021, taipeitimes.com; Emerson Lim and Matt Yu, "Taiwan, U.S. sign agreement on scientific cooperation," Focus Taiwan, December 18, 2020, focustaiwan.tw; Ryan Hass, "A case for optimism on US-Taiwan relations," Brookings Institute, November 30, 2020, brookings.com. 5 Thomas J. Shattuck, "Stuck in the Middle: Taiwan’s Semiconductor Industry, the U.S.-China Tech Fight, and Cross-Strait Stability," Foreign Policy Research Institute, Orbis (65:1) 2021, pp. 101-17, www.fpri.org. Section II: GeoRisk Indicators China
China: GeoRisk Indicator
China: GeoRisk Indicator
Russia
Russia: GeoRisk Indicator
Russia: GeoRisk Indicator
UK
UK: GeoRisk Indicator
UK: GeoRisk Indicator
Germany
Germany: GeoRisk Indicator
Germany: GeoRisk Indicator
France
France: GeoRisk Indicator
France: GeoRisk Indicator
Italy
Italy: GeoRisk Indicator
Italy: GeoRisk Indicator
Canada
Canada: GeoRisk Indicator
Canada: GeoRisk Indicator
Spain
Spain: GeoRisk Indicator
Spain: GeoRisk Indicator
Taiwan
Taiwan: GeoRisk Indicator
Taiwan: GeoRisk Indicator
Korea
Korea: GeoRisk Indicator
Korea: GeoRisk Indicator
Turkey
Turkey: GeoRisk Indicator
Turkey: GeoRisk Indicator
Brazil
Brazil: GeoRisk Indicator
Brazil: GeoRisk Indicator
Section III: Geopolitical Calendar
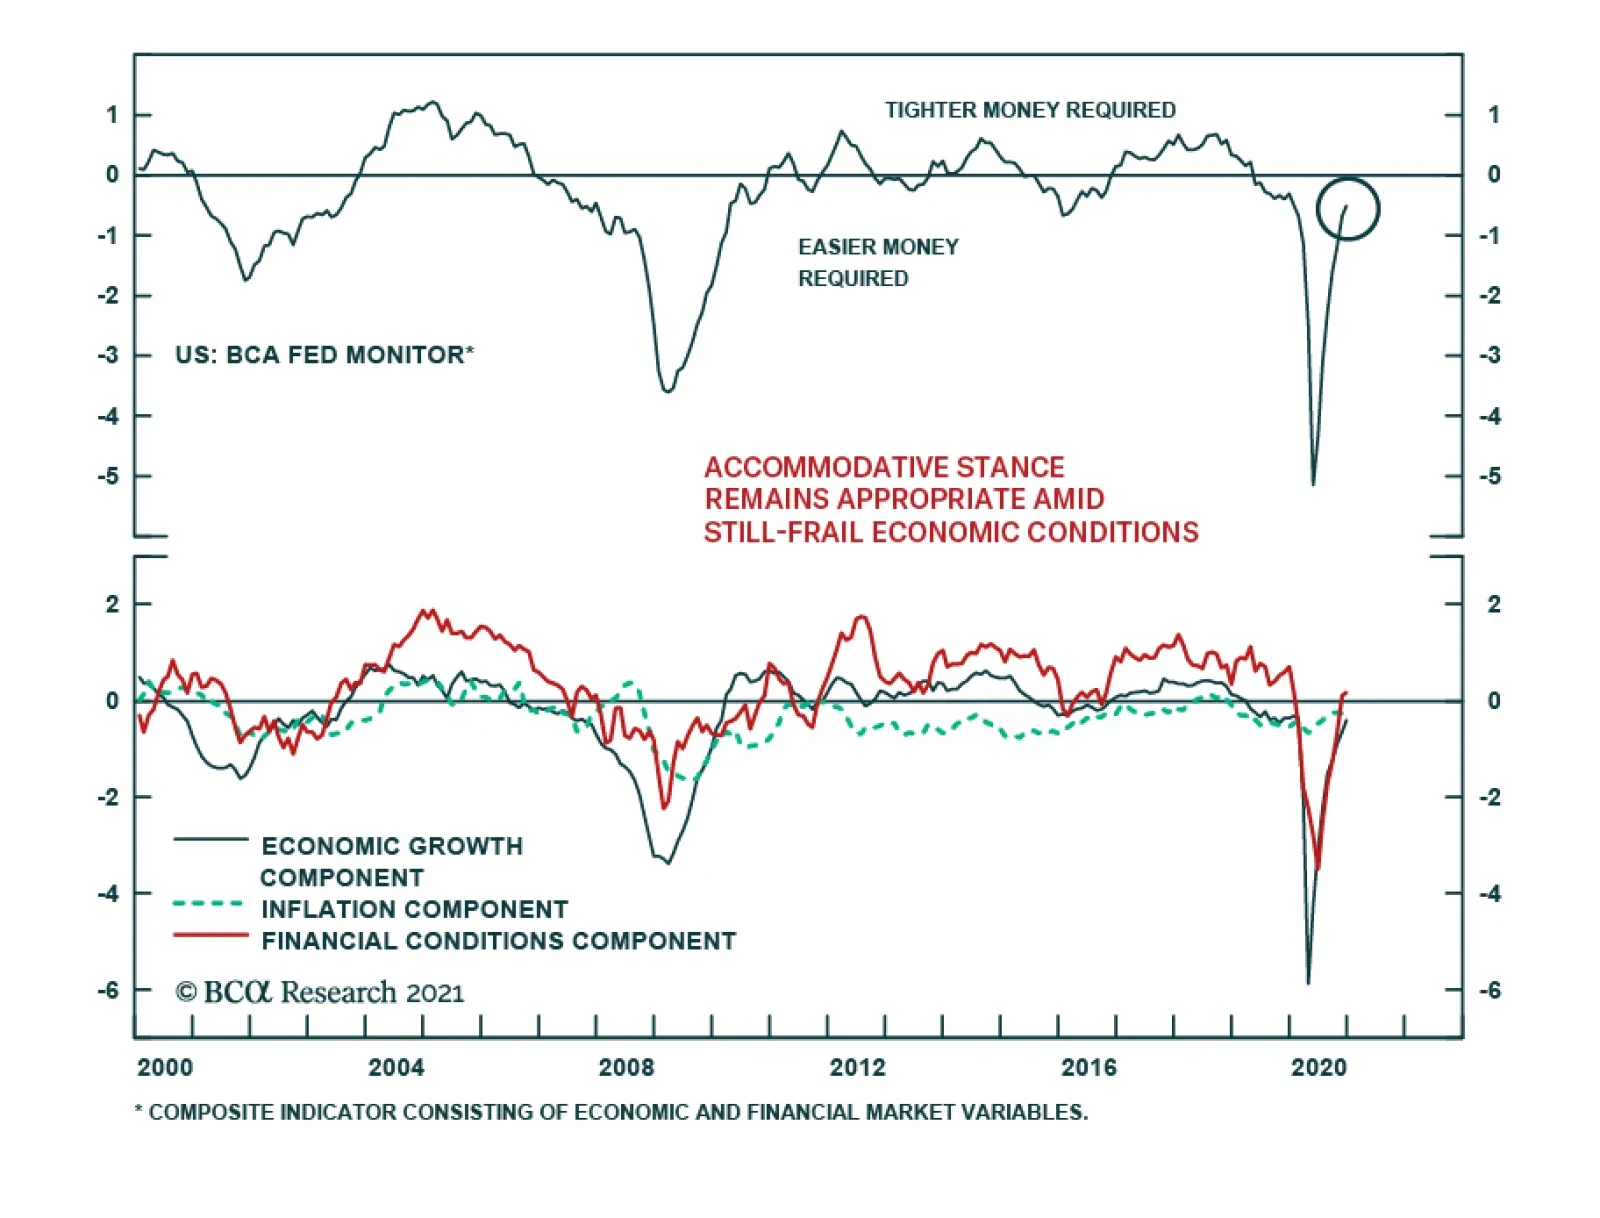
Chairman Jerome Powell maintained the dovish message at the FOMC’s first meeting of the year, emphasizing the dominant need to continue resuscitating the still-frail economy, even in the face of risks from inflationary spikes and financial market instability.…
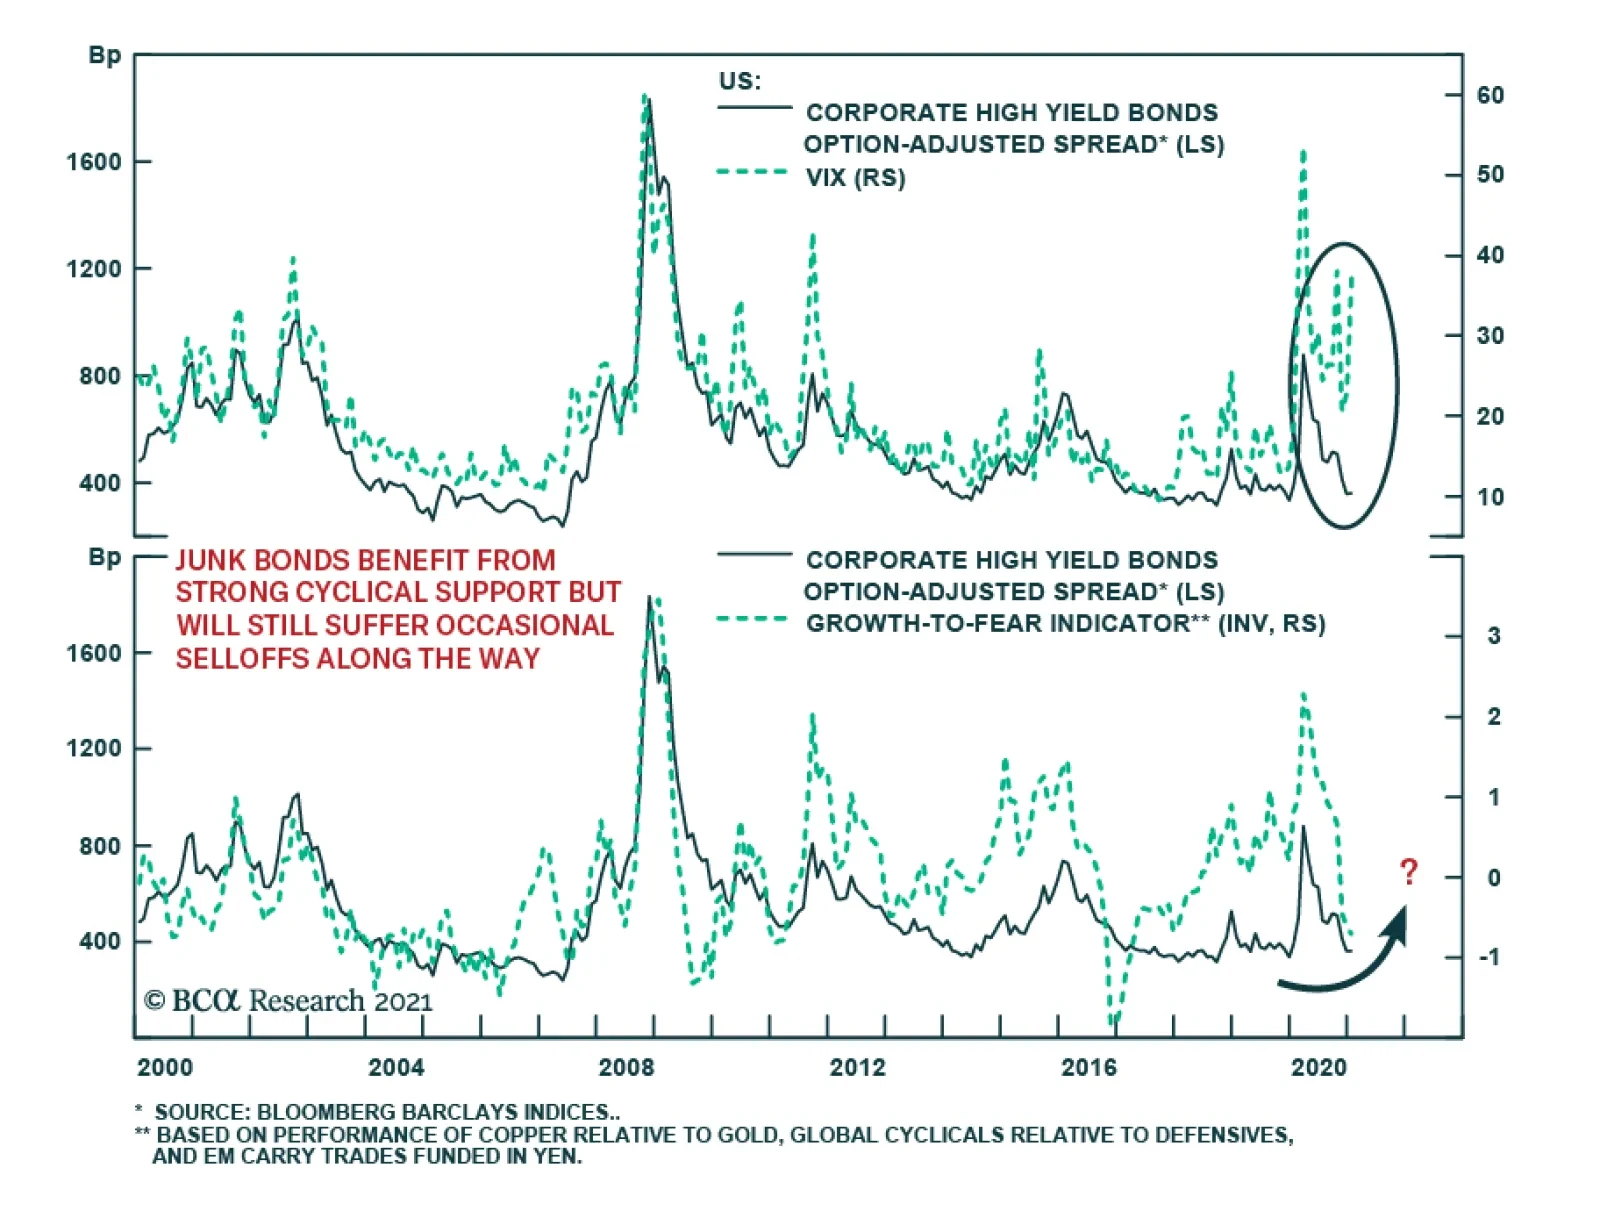
Cyclically, it still makes sense to overweight high-yield bonds within US fixed-income portfolios because the recovery will limit bankruptcies and help recovery rates while the Fed’s presence backstops this market. Nonetheless, credit spreads are still…