United States

The forthcoming third round of enormous US fiscal stimulus will likely mark a structural regime shift in global financial markets. Over the past 25 years, the chief concern of US and, hence, global financial markets, has been economic growth. Share prices typically fluctuated with growth expectations. As a result, the S&P 500 and US bond yields have been positively correlated, as shown in Chart 1 of week. Chart 1AUS Share Prices And Treasury Yields Will Soon Become Negatively Correlated
US Share Prices And Treasury Yields Will Soon Become Negatively Correlated
US Share Prices And Treasury Yields Will Soon Become Negatively Correlated
Going forward, odds are that the correlation between US equity prices and US bond yields will turn negative and stay there for several years, as was the case prior to 1997. In brief, we are moving from a deflationary to an inflationary backdrop. Share prices will likely start negatively reacting to rising inflation and/or inflation expectations and vice versa. We will discuss these issues in depth in forthcoming reports. A rise in EM corporate bond yields is the key threat to EM share prices, as shown in the charts on page 3. EM corporate and sovereign US bond spreads are so tight that they are unlikely to compress further to offset the rise in US Treasury yields. As a result, EM dollar-denominated corporate and sovereign bond yields will also rise as US Treasurys sell off. Chart 2 of week shows that the distinct breakout in a high-beta American industrial stock price – Kennametal – points to higher US government bond yields. Chart 1BA Super-Strong US Industrial Cycle Points To Higher US Treasury Yields
A Super-Strong US Industrial Cycle Points To Higher US Treasury Yields
A Super-Strong US Industrial Cycle Points To Higher US Treasury Yields
The timing of such a shakeout in risk assets is uncertain but it will likely be sharp and will happen in the first half of this year. The reason is that positioning and sentiment on global risk assets in general and EM risk assets in particular are very elevated as we illustrate in this January issue of Charts That Matter. Our major investment themes remain: US equities will continue underperforming global stocks. Rising bond yields and inflation will hurt the expensive US equity market more than overseas ones. Europe and Japan will outperform and EM will likely be a market performer. For now, maintain a neutral allocation to EM in a global equity portfolio. The US dollar is in a structural bear market but it is presently oversold and will bounce sharply sometime in H1 this year. Continue shorting select EM currencies versus an equal-weighted basket of the euro, CHF and JPY. EM currencies will suffer more than DM currencies during a potential US dollar snapback. A setback in EM fixed-income markets should be used as a buying opportunity. Inflation is much less of a problem in EM than in the US. A long-term bear market in the greenback favors EM fixed-income markets, both dollar-denominated and local currency ones. Arthur Budaghyan Chief Emerging Markets Strategist arthurb@bcaresearch.com Rising EM Corporate Bond Yields Is The Key Threat To EM Share Prices A continuous rise in corporate and sovereign US dollar bond yields (shown inverted) has historically been a negative signal for EM share prices. With no downside to global growth due to US fiscal policy, both US and EM bond yields are crucial variables to monitor. Chart 1Rising EM Corporate Bond Yields Will Be The Key Threat To EM Share Prices
Rising EM Corporate Bond Yields Is The Key Threat To EM Share Prices
Rising EM Corporate Bond Yields Is The Key Threat To EM Share Prices
Chart 2Rising EM Corporate Bond Yields Will Be The Key Threat To EM Share Prices
Rising EM Corporate Bond Yields Is The Key Threat To EM Share Prices
Rising EM Corporate Bond Yields Is The Key Threat To EM Share Prices
EM Stocks Will Outperform The S&P 500 Amid Rising Inflation Worries Rising inflation expectations will help EM stocks to outperform the S&P 500. The latter is more expensive and, thereby, more sensitive to rising interest rates. Chart 3EM Stocks Will Outperform The S&P 500 Amid Rising Inflation Worries
EM Stocks Will Outperform The S&P 500 Amid Rising Inflation Worries
EM Stocks Will Outperform The S&P 500 Amid Rising Inflation Worries
Chart 4EM Stocks Will Outperform The S&P 500 Amid Rising Inflation Worries
EM Stocks Will Outperform The S&P 500 Amid Rising Inflation Worries
EM Stocks Will Outperform The S&P 500 Amid Rising Inflation Worries
US Equities Are Overextended; EM Is Set To Outperform The S&P 500 In The Coming Years In real (inflation-adjusted) terms, US stocks in general and US tech stocks in particular are over-extended relative to their long-term trends. Relative to US equities, but not absolute term, EM stocks are cheap. Chart 5US Equities Are Overextended; EM Is Set To Outperform The S&P 500 In The Coming Years
US Equities Are Overextended; EM Is Set To Outperform The S&P 500 In The Coming Years
US Equities Are Overextended; EM Is Set To Outperform The S&P 500 In The Coming Years
Chart 6US Equities Are Overextended; EM Is Set To Outperform The S&P 500 In The Coming Years
US Equities Are Overextended; EM Is Set To Outperform The S&P 500 In The Coming Years
US Equities Are Overextended; EM Is Set To Outperform The S&P 500 In The Coming Years
Chart 7US Equities Are Overextended; EM Is Set To Outperform The S&P 500 In The Coming Years
US Equities Are Overextended; EM Is Set To Outperform The S&P 500 In The Coming Years
US Equities Are Overextended; EM Is Set To Outperform The S&P 500 In The Coming Years
Chart 8US Equities Are Overextended; EM Is Set To Outperform The S&P 500 In The Coming Years
US Equities Are Overextended; EM Is Set To Outperform The S&P 500 In The Coming Years
US Equities Are Overextended; EM Is Set To Outperform The S&P 500 In The Coming Years
Strategy For An Era Of Inflation Global growth stocks will underperform versus value ones. US equities have broken down relative to the global equity index. US bond yields have more upside. A rise in US corporate bond yields is the main danger to American stocks. Chart 9Strategy For An Era Of Inflation
Strategy For An Era Of Inflation
Strategy For An Era Of Inflation
Chart 10Strategy For An Era Of Inflation
Strategy For An Era Of Inflation
Strategy For An Era Of Inflation
Chart 11Strategy For An Era Of Inflation
Strategy For An Era Of Inflation
Strategy For An Era Of Inflation
Chart 12Strategy For An Era Of Inflation
Strategy For An Era Of Inflation
Strategy For An Era Of Inflation
Risk Measures That EM Investors Should Monitor US TIPS yields are very oversold. Any spike will likely trigger a rebound in the US dollar and a correction in EM local currency bonds. Besides, off-shore Chinese property company bond prices have rolled over. This means stress is accumulating in China’s property market and construction activity will slow in H2 this year. Finally, EM HY corporates might begin underperforming EM IG – a sign of poor risk backdrop. Chart 13Risk Measures That EM Investors Should Monitor
Risk Measures That EM Investors Should Monitor
Risk Measures That EM Investors Should Monitor
Chart 14Risk Measures That EM Investors Should Monitor
Risk Measures That EM Investors Should Monitor
Risk Measures That EM Investors Should Monitor
Chart 15Risk Measures That EM Investors Should Monitor
Risk Measures That EM Investors Should Monitor
Risk Measures That EM Investors Should Monitor
The Case For US Inflation US personal disposable income has surged due to fiscal transfers. This is ultimately Modern Monetary Theory (MMT) in action. US consumer spending on goods has been booming, lifting global trade and manufacturing. The vaccination and a reopening of the economy will increase the velocity (turnover) of money supply and lead to higher inflation in H2 2021. Chart 16The Case For US Inflation
The Case For US Inflation
The Case For US Inflation
Chart 17The Case For US Inflation
The Case For US Inflation
The Case For US Inflation
Chart 18The Case For US Inflation
The Case For US Inflation
The Case For US Inflation
Global Trade: The US and China Have Been Epicenters Of Spending China's and the US’ real trade balances (export volume divided by import volume) have been falling, meaning that both economies have been locomotives of global demand. China’s stimulus is tapering off but the US’ fiscal largess continues. Chart 19Global Trade: The US and China Have Been Epicenters Of Spending
Global Trade: The US and China Have Been Epicenters Of Spending
Global Trade: The US and China Have Been Epicenters Of Spending
Chart 20Global Trade: The US and China Have Been Epicenters Of Spending
Global Trade: The US and China Have Been Epicenters Of Spending
Global Trade: The US and China Have Been Epicenters Of Spending
Chart 21Global Trade: The US and China Have Been Epicenters Of Spending
Global Trade: The US and China Have Been Epicenters Of Spending
Global Trade: The US and China Have Been Epicenters Of Spending
US Consumers Could Face High Goods Prices Tradable goods prices are rising in US dollar terms. If export nations’ currencies continue appreciating, US imports prices in US dollar terms will rise much more. This will reinforce inflationary pressures in the US. Chart 22US Consumers Could Face High Goods Prices
US Consumers Could Face High Goods Prices
US Consumers Could Face High Goods Prices
Chart 23US Consumers Could Face High Goods Prices
US Consumers Could Face High Goods Prices
US Consumers Could Face High Goods Prices
Chart 24US Consumers Could Face High Goods Prices
US Consumers Could Face High Goods Prices
US Consumers Could Face High Goods Prices
Chart 25US Consumers Could Face High Goods Prices
US Consumers Could Face High Goods Prices
US Consumers Could Face High Goods Prices
No Inflation In China In China, supply has been overwhelming demand and deflationary tendencies remain broad-based. Policymakers have become concerned with RMB appreciation, or at least the pace of its strengthening. Authorities have allowed more portfolio capital to leave China. The latter has produced the recent surge in HK-traded Chinese stocks (please refer to page 16). Chart 26No Inflation In China
No Inflation In China
No Inflation In China
Chart 27No Inflation In China
No Inflation In China
No Inflation In China
Chart 28No Inflation In China
No Inflation In China
No Inflation In China
Chart 29No Inflation In China
No Inflation In China
No Inflation In China
The Chinese Economy: Strong In H1; Slowing In H2 China’s credit and fiscal stimulus peaked in Q4 2020. This and regulatory tightening for banks and ongoing non-banks as well as the property market restrictions will produce a meaningful slowdown in H2 this year. Chart 30The Chinese Economy: Strong In H1; Slowing In H2
The Chinese Economy: Strong In H1; Slowing In H2
The Chinese Economy: Strong In H1; Slowing In H2
Chart 31The Chinese Economy: Strong In H1; Slowing In H2
The Chinese Economy: Strong In H1; Slowing In H2
The Chinese Economy: Strong In H1; Slowing In H2
Chart 32The Chinese Economy: Strong In H1; Slowing In H2
The Chinese Economy: Strong In H1; Slowing In H2
The Chinese Economy: Strong In H1; Slowing In H2
Chart 33The Chinese Economy: Strong In H1; Slowing In H2
The Chinese Economy: Strong In H1; Slowing In H2
The Chinese Economy: Strong In H1; Slowing In H2
Commodities Inventories In China Are Elevated Slowdowns in China’s construction activity and infrastructure spending amid excessive inventories of commodities pose a downside risk in commodities prices this year. Chart 34Commodities Inventories In China Are Elevated
Commodities Inventories In China Are Elevated
Commodities Inventories In China Are Elevated
Chart 36Commodities Inventories In China Are Elevated
Commodities Inventories In China Are Elevated
Commodities Inventories In China Are Elevated
Chart 35Commodities Inventories In China Are Elevated
Commodities Inventories In China Are Elevated
Commodities Inventories In China Are Elevated
A Mania In Full Force Asia’s growth stocks have been rising exponentially. Such parabolic price moves can last for a while but these stocks will experience a major shakeout this year. The trigger will be rising global bond yields as discussed on pages 1 and 2. Chart 37A Mania In Full Force
A Mania In Full Force
A Mania In Full Force
Chart 38A Mania In Full Force
A Mania In Full Force
A Mania In Full Force
Chart 39A Mania In Full Force
A Mania In Full Force
A Mania In Full Force
Chart 40A Mania In Full Force
A Mania In Full Force
A Mania In Full Force
Local Retail Investors Have Been Buying EM Stocks Aggressively These charts show that a retail mania is taking place not only in the US but has become a common phenomenon in many EM stock markets. Amid retail-driven rallies, fundamentals do not matter and momentum is the key variable to monitor. Chart 41Local Retail Investors Have Been Buying EM Stocks Aggressively
Local Retail Investors Have Been Buying EM Stocks Aggressively
Local Retail Investors Have Been Buying EM Stocks Aggressively
Chart 42Local Retail Investors Have Been Buying EM Stocks Aggressively
Local Retail Investors Have Been Buying EM Stocks Aggressively
Local Retail Investors Have Been Buying EM Stocks Aggressively
Mainland Investors Buying HK-Listed Chinese Stocks To halt yuan appreciation, authorities have recently increased quotas for mainland investors to buy HK-listed equities. Consequently, capital has rushed out of the mainland and Chinese stocks listed in HK have surged. The duration and magnitude of any flow-driven rally is impossible to handicap with any certainty. Chart 43Mainland Investors Buying HK-Listed Chinese Stocks
Mainland Investors Buying HK-Listed Chinese Stocks
Mainland Investors Buying HK-Listed Chinese Stocks
Chart 44Mainland Investors Buying HK-Listed Chinese Stocks
Mainland Investors Buying HK-Listed Chinese Stocks
Mainland Investors Buying HK-Listed Chinese Stocks
Chart 45Mainland Investors Buying HK-Listed Chinese Stocks
Mainland Investors Buying HK-Listed Chinese Stocks
Mainland Investors Buying HK-Listed Chinese Stocks
Global Investors Are Super Bullish These charts illustrate that based on the Sentix1 survey European investors are record bullish on EM equities and European growth. Chart 46Global Investors Are Super Bullish
Global Investors Are Super Bullish
Global Investors Are Super Bullish
Chart 47Global Investors Are Super Bullish
Global Investors Are Super Bullish
Global Investors Are Super Bullish
Investor Sentiment And Positioning Are Very Elevated Investors are bullish on US stocks and copper (a proxy for global growth) and bearish on the US dollar. The ratio of US institutional and retail money market funds’ assets (cash on sidelines) relative to market value of stocks and all US dollar bonds has declined substantially. Chart 48Investor Sentiment And Positioning Are Very Elevated
Investor Sentiment And Positioning Are Very Elevated
Investor Sentiment And Positioning Are Very Elevated
Chart 49Investor Sentiment And Positioning Are Very Elevated
Investor Sentiment And Positioning Are Very Elevated
Investor Sentiment And Positioning Are Very Elevated
Chart 50Investor Sentiment And Positioning Are Very Elevated
Investor Sentiment And Positioning Are Very Elevated
Investor Sentiment And Positioning Are Very Elevated
Several Reflation Gauges Are Facing Resistance Global cyclical versus defensive stocks and several EM reflation plays are facing important technical resistances. Chart 51Several Reflation Gauges Are Facing Resistance
Several Reflation Gauges Are Facing Resistance
Several Reflation Gauges Are Facing Resistance
Chart 52Several Reflation Gauges Are Facing Resistance
Several Reflation Gauges Are Facing Resistance
Several Reflation Gauges Are Facing Resistance
Major Equity Indexes Are Attempting A Breakout The EM, global ex-US, global ex-TMT and euro area equity indexes are at their previous highs and are attempting a breakout. Momentum is on their side but positioning and sentiment are against a sustainable breakout. Chart 53Major Equity Indexes Are Attempting A Breakout
Major Equity Indexes Are Attempting A Breakout
Major Equity Indexes Are Attempting A Breakout
Chart 54Major Equity Indexes Are Attempting A Breakout
Major Equity Indexes Are Attempting A Breakout
Major Equity Indexes Are Attempting A Breakout
Chart 55Major Equity Indexes Are Attempting A Breakout
Major Equity Indexes Are Attempting A Breakout
Major Equity Indexes Are Attempting A Breakout
Chart 56Major Equity Indexes Are Attempting A Breakout
Major Equity Indexes Are Attempting A Breakout
Major Equity Indexes Are Attempting A Breakout
Outside Asian Growth Stocks, EM Equities Have Been Lagging Reflecting not-so-positive fundamentals, EM share prices, outside Asian growth stocks, have not yet entered a bull market. Chart 57Outside Asian Growth Stocks, EM Equities Have Been Lagging
Outside Asian Growth Stocks, EM Equities Have Been Lagging
Outside Asian Growth Stocks, EM Equities Have Been Lagging
Chart 58Outside Asian Growth Stocks, EM Equities Have Been Lagging
Outside Asian Growth Stocks, EM Equities Have Been Lagging
Outside Asian Growth Stocks, EM Equities Have Been Lagging
Chart 59Outside Asian Growth Stocks, EM Equities Have Been Lagging
Outside Asian Growth Stocks, EM Equities Have Been Lagging
Outside Asian Growth Stocks, EM Equities Have Been Lagging
Chart 60Outside Asian Growth Stocks, EM Equities Have Been Lagging
Outside Asian Growth Stocks, EM Equities Have Been Lagging
Outside Asian Growth Stocks, EM Equities Have Been Lagging
The Outlook For EM Stocks The cyclical EM profit outlook is bullish. However, much of this is already priced in. China’s peak stimulus is a risk to EM later this year. We recommend equity investors to favor EM versus the S&P 500 but not against European or Japanese stocks. Chart 61The Outlook For EM Stocks
The Outlook For EM Stocks
The Outlook For EM Stocks
Chart 62The Outlook For EM Stocks
The Outlook For EM Stocks
The Outlook For EM Stocks
New COVID Cases Are Rising In Several Areas Outside North Asia Many developing countries are facing challenges to contain the pandemic as well as to obtain and conduct broad-based vaccination. Chart 63New COVID Cases Are Rising In Several Areas Outside North Asia
New COVID Cases Are Rising In Several Areas Outside North Asia
New COVID Cases Are Rising In Several Areas Outside North Asia
Chart 64New COVID Cases Are Rising In Several Areas Outside North Asia
New COVID Cases Are Rising In Several Areas Outside North Asia
New COVID Cases Are Rising In Several Areas Outside North Asia
Footnotes 1 The Sentix surveys cover several thousand European institutional and individual investors. In the survey, investors are asked about their medium-term expectations. Source: SENTIX.
Buy The Breakout In Movies & Entertainment
Buy The Breakout In Movies & Entertainment
Overweight The S&P movies & entertainment index has been on a tear recently likely due to receding fiscal uncertainty and the normalization process in the economy (third panel). This niche communication services sub-industry is dominated by the two key players DIS and NFLX, and while they are fierce competitors, our view remains that there is plenty demand for the pair of them to remain successful. We first showed the relative P/E/G ratio for this index in mid-December, and highlighted how the ratio was below the historical mean and offered compelling value. True, today it has spiked, but it is nowhere near previous extreme readings (bottom panel). Keep in mind that analysts still remain relatively neutral to slightly pessimistic on the industry’s growth prospects and earnings power (second panel). The fact that relative net earnings revisions are negative, underscores that investors should buy the breakout in relative share prices. Bottom Line: We remain overweight the S&P movies & entertainment index. The ticker symbols for the stocks in this index are: BLBG: S5MOVI – DIS, NFLX, LYV.
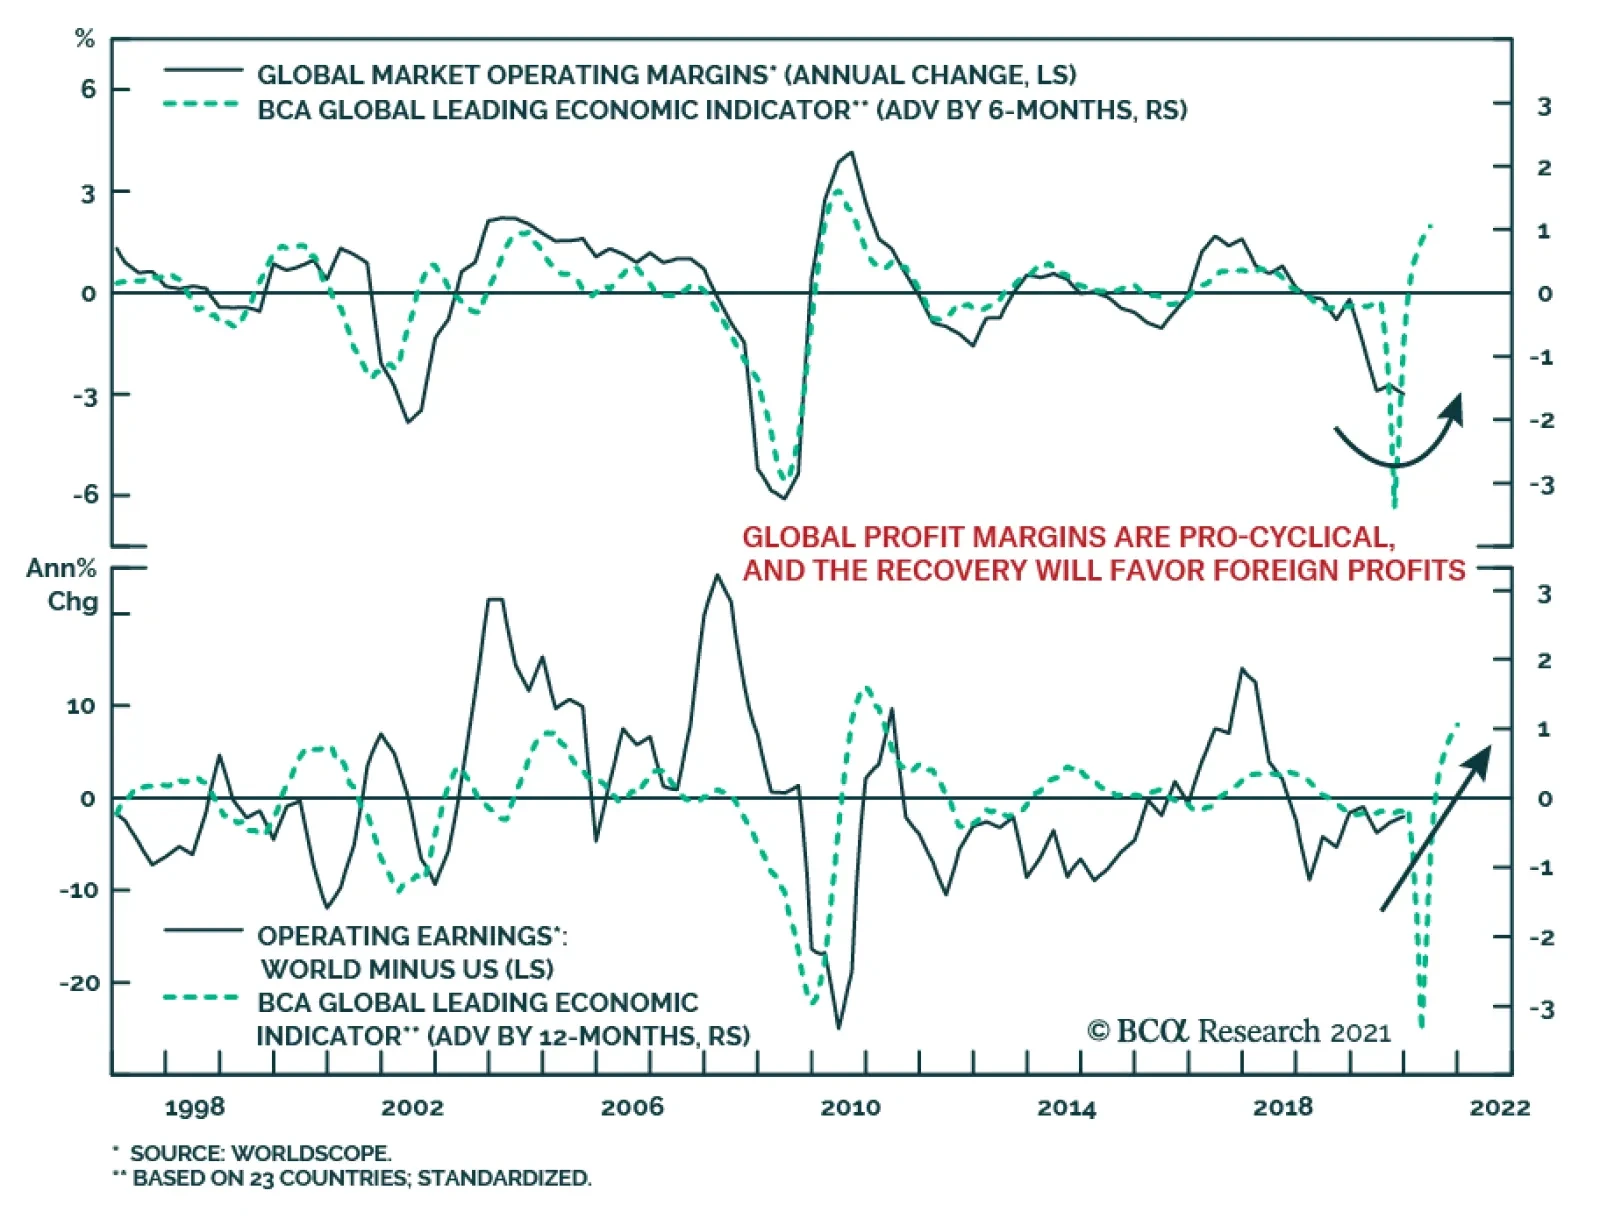
Global profit margins are set to improve meaningfully in 2021 because they are very pro-cyclical and they will track the acceleration in the BCA Global Leading Economic Indicator. Rising profit margins and increasing sales will allow stock prices to grow into…
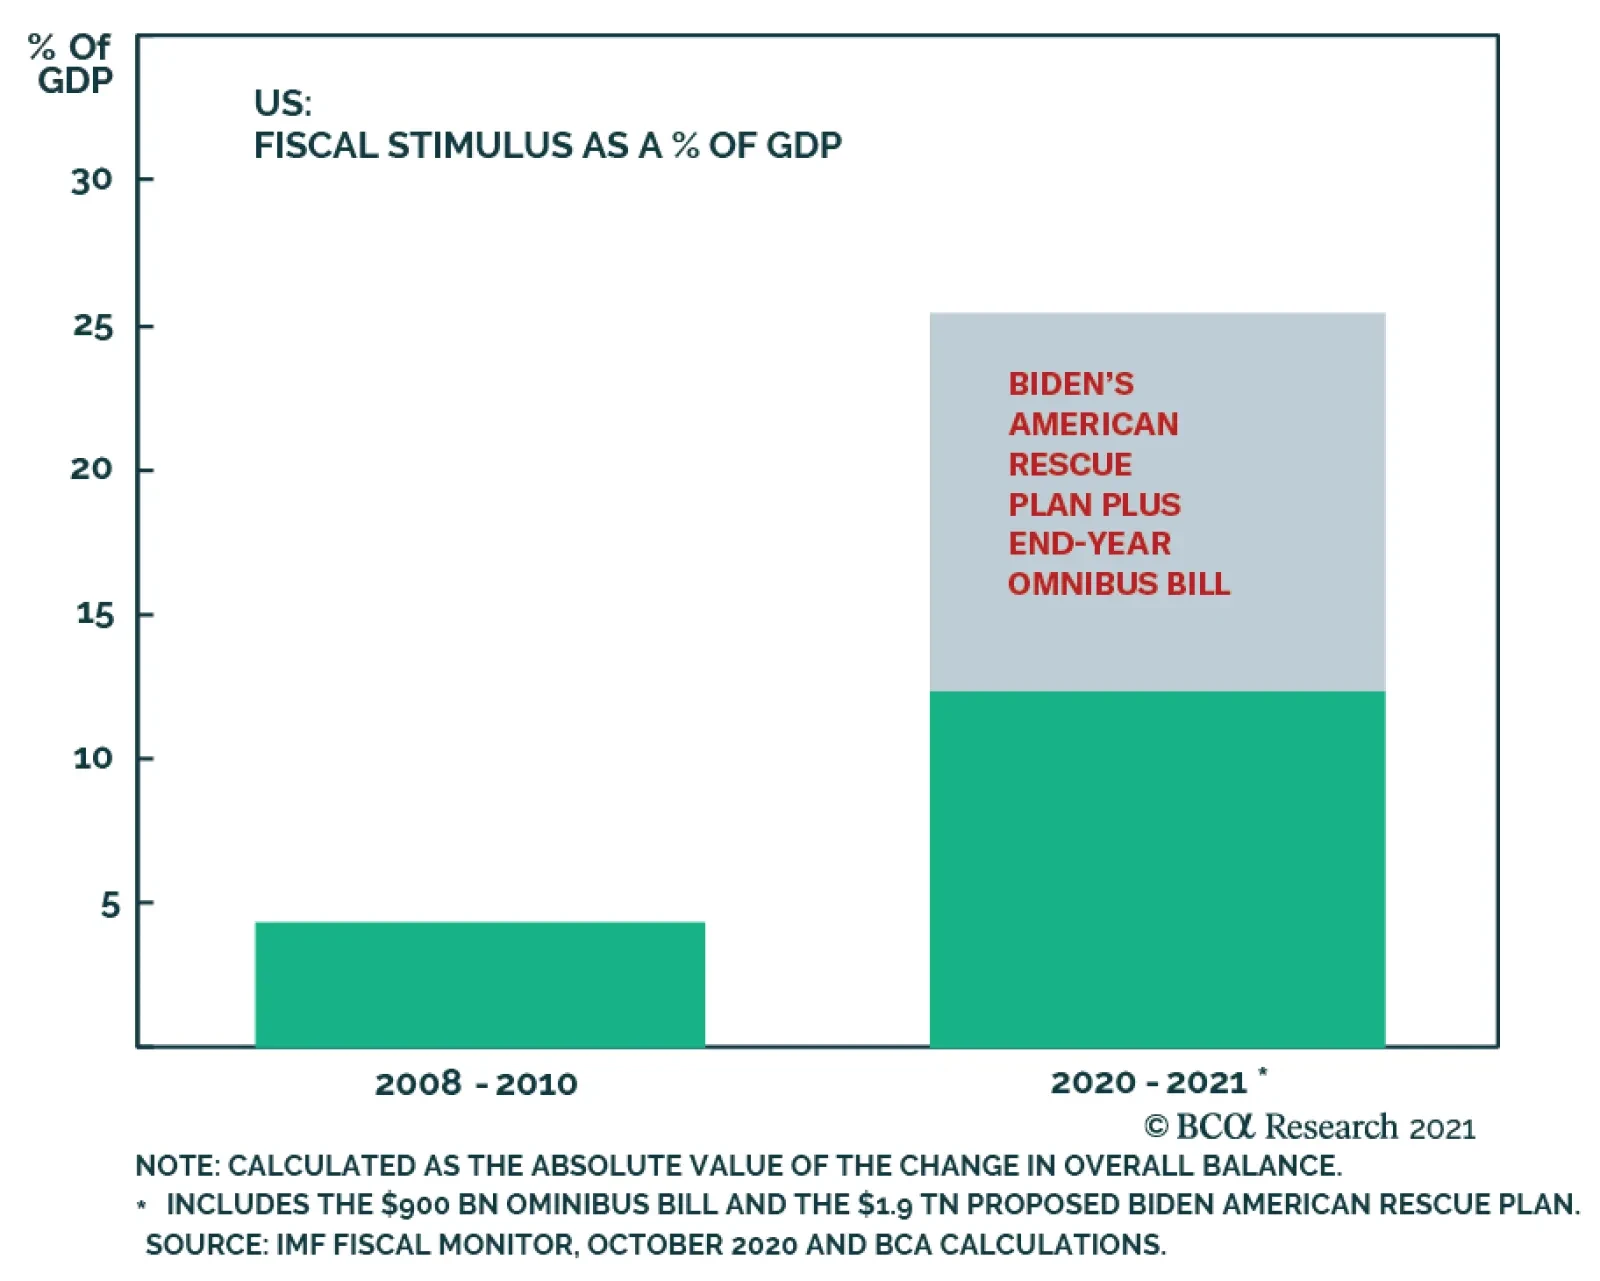
According to BCA Research’s US Political Strategy service, it is not wise to bet against a new president’s major legislative initiatives – especially when his party controls Congress, however narrowly. US fiscal policy has undergone a sea change, with…
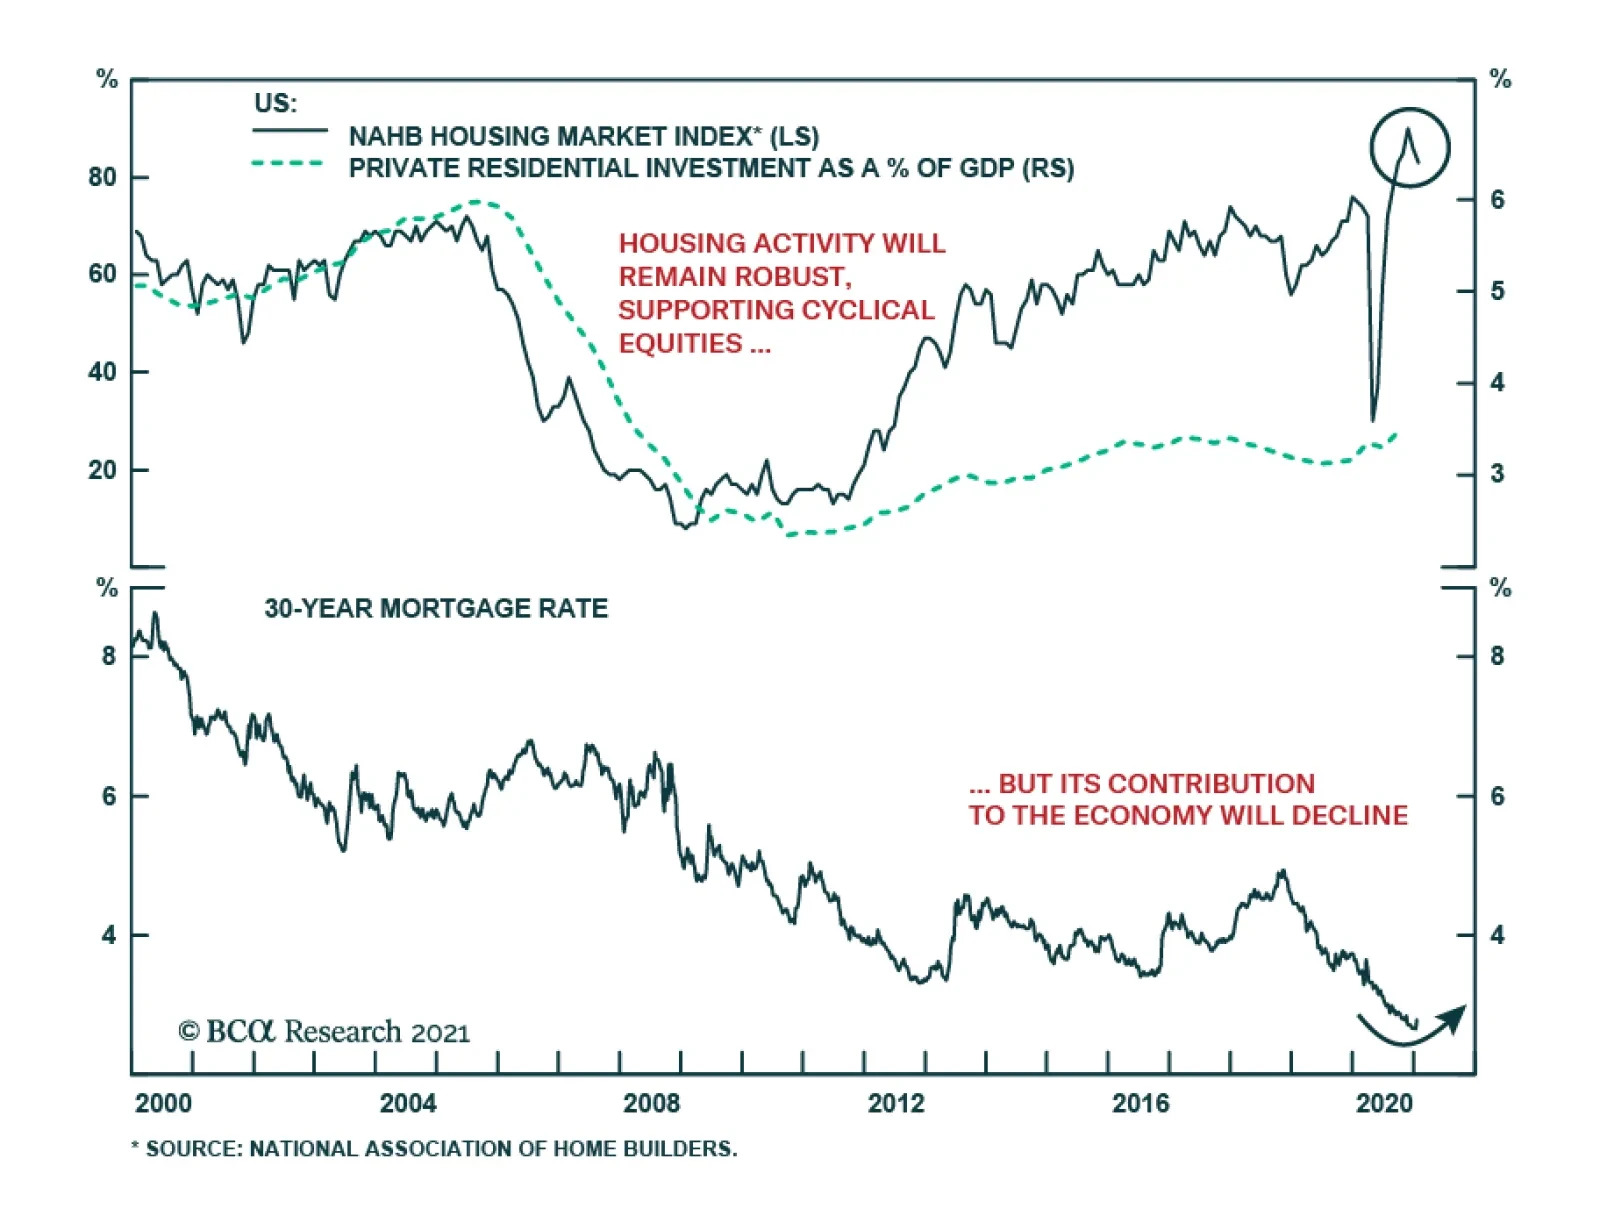
The January NAHB Housing Market Index declined for the second consecutive month, indicating some easing in housing activity. The aggregate index fell to 83, disappointing consensus expectations it would remain flat at 86. As in December, the weakness was…
2021 High-Conviction Underweight Calls: S&P Consumer Staples
2021 High-Conviction Underweight Calls: S&P Consumer Staples
Underweight Countercyclical consumer staples stocks served their purpose and supported our portfolio in the front half of 2020. Now that vaccines are here, we added the S&P consumer staples sector to the high-conviction underweight call list. The current macro backdrop underscores that the path of least resistance is lower for relative share prices. Not only is the ISM manufacturing survey on fire, but also, consumer confidence is forming a trough (ISM manufacturing shown inverted, second panel). One of the factors that will drive relative earnings lower is the weaker US dollar. As a reminder, the S&P consumer staples sector derives approximately 32% of its sales from abroad, which is 10 percentage points lower than the S&P 500. As a consequence, on a relative basis, staples stocks benefit much less than the rest of the market from a falling currency (third panel). Our relative macro earnings model does an excellent job in encapsulating all these moving parts and paints a dark profit picture for this GICS1 sector this year (fourth panel). Bottom Line: The S&P consumer staples sector is a high-conviction underweight.
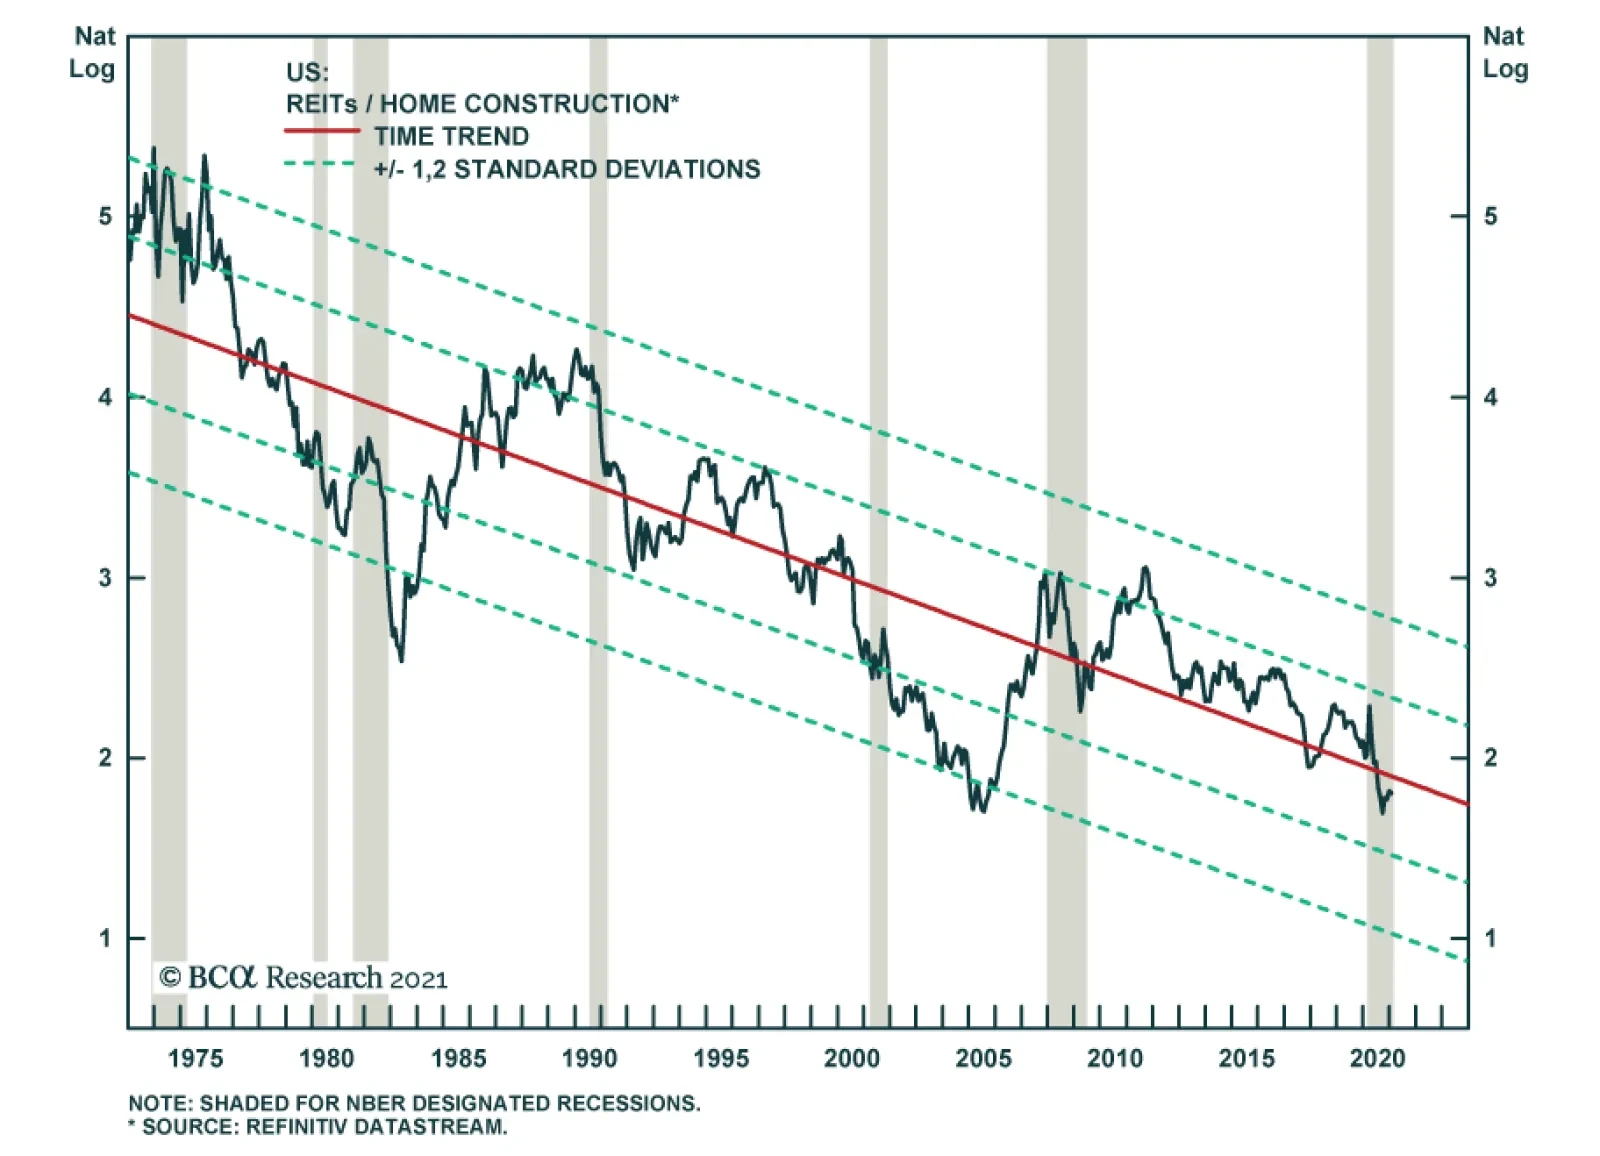
According to BCA Research’s US Equity Strategy service, there is an exploitable opportunity to go long commercial real estate (CRE)/short residential real estate (RRE) via long S&P REITs/short S&P homebuilders. Our target return is 20% and we are…
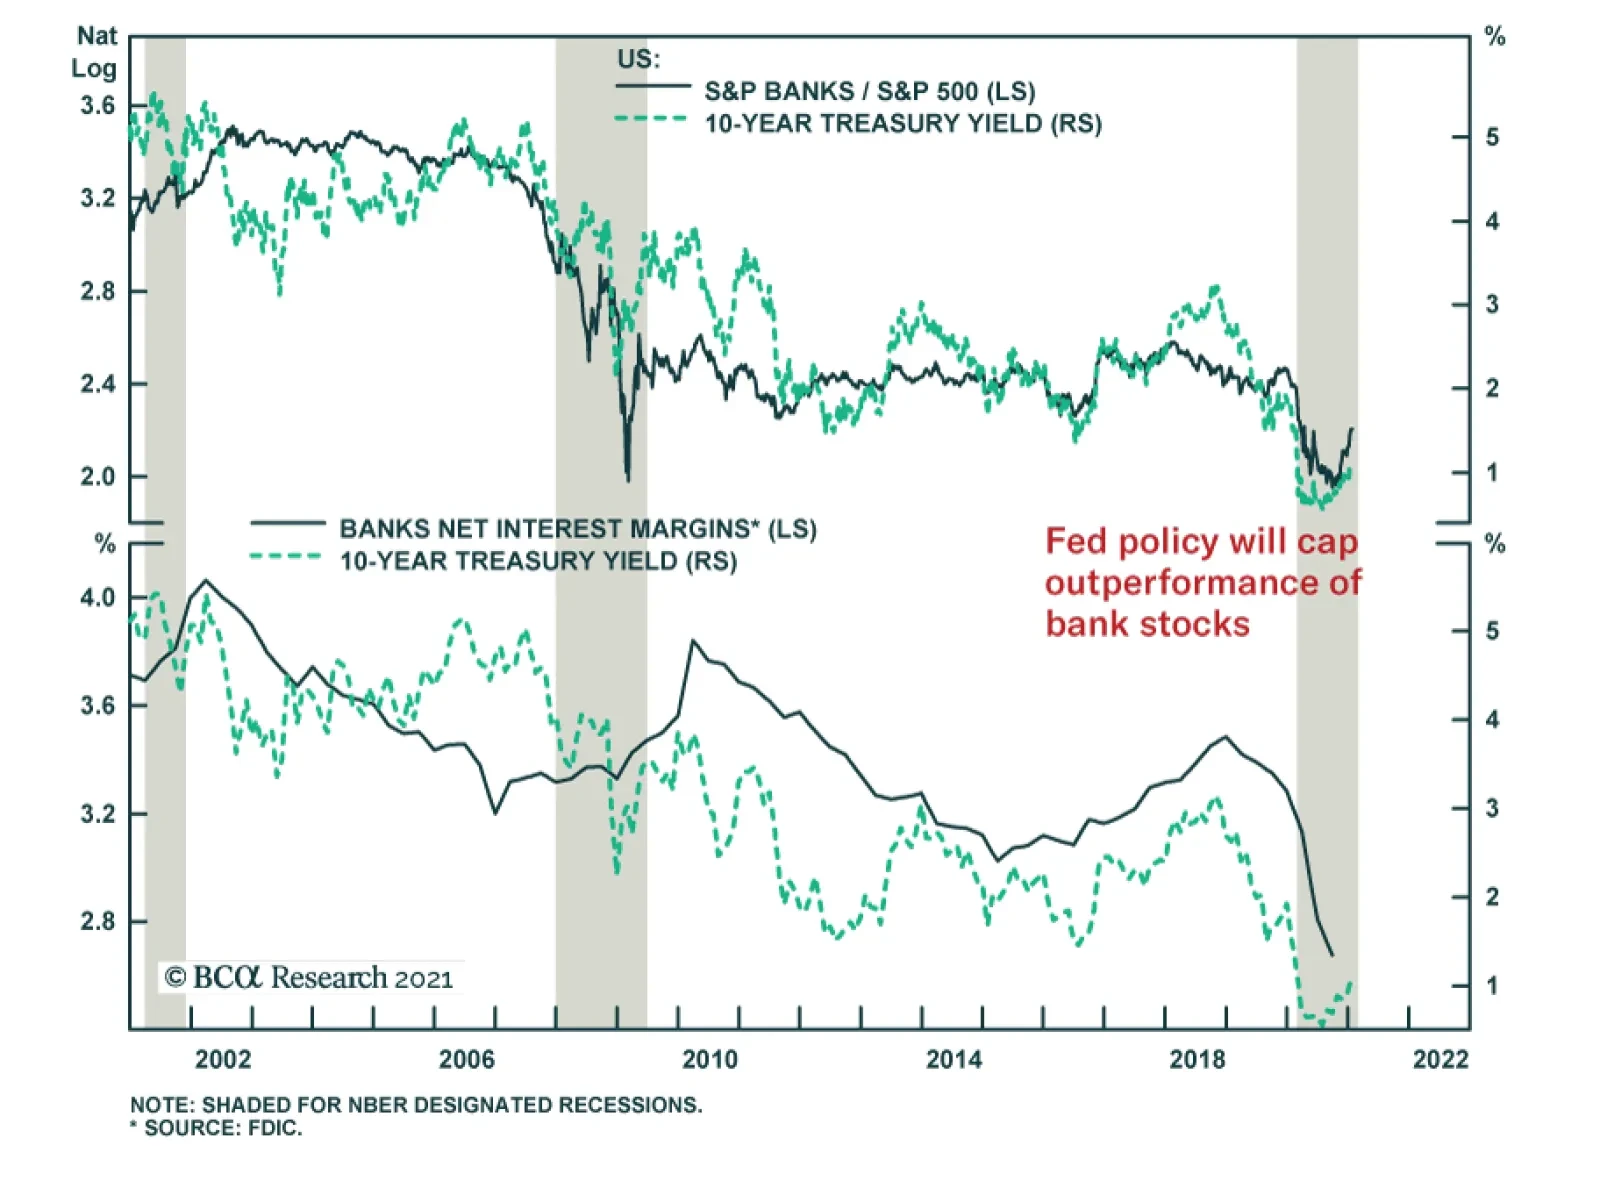
After sharply underperforming the S&P 500 for the first nine months of 2020, US banks started to outperform the broad market in late September. Incoming earnings reports from major US banks offer room for optimism as loss provisions are increasingly being…
Highlights Inflation: Additional fiscal stimulus will lead to higher inflation in the goods sector, where bottlenecks are already forming. But stronger services inflation is required (particularly in shelter) before broad price pressures emerge. Some leading indicators of shelter inflation suggest that a bottom may be near. Fed: The Fed will not lift rates or taper asset purchases until the unemployment rate is close to 4.5% and 12-month PCE inflation is firmly above 2%. This could occur in late-2021 if economic growth is very strong, but 2022 is more likely. Investment Strategy: Maintain below-benchmark portfolio duration and stay overweight TIPS versus nominal Treasuries. Nominal curve steepeners, real curve steepeners and inflation curve flatteners all continue to make sense. Feature Biden Goes Big Joe Biden unveiled his economic plan last week and, as expected, the incoming President is setting his sights high. First on the agenda is the American Rescue Plan, a $1.9 trillion package that contains $410 billion for fighting the coronavirus, $1 trillion of income support for households and $440 billion in direct aid to state & local governments. Biden will seek enough Republican support in the Senate to pass this legislation without using the budget reconciliation process. If that can be achieved, Democrats will still have two opportunities to pass reconciliation bills in 2021. Those bills will focus on other priorities such as infrastructure investment and expanding the Affordable Care Act. With households already flush with cash, an influx of new stimulus risks an earlier return of inflation than was previously anticipated. Biden’s announcement was in line with what our political strategists anticipated, and the federal deficit is on track to fall somewhere between the “Democratic Status Quo” and “Democratic High” scenarios shown in Chart 1. This means that the deficit will peak at between 22% and 25% of GDP in fiscal year 2021 before gradually converging back to the baseline. To put this number in context, the federal deficit peaked at just below 10% of GDP at the height of the Great Financial Crisis in 2009. The US economy is now on the cusp of receiving a much greater fiscal injection at a time when nominal GDP is only 2.7% off its prior peak. Chart 1Massive Fiscal Stimulus Is On The Way
Trust The Fed's Forward Guidance
Trust The Fed's Forward Guidance
As mentioned above, the American Rescue Plan contains $1 trillion of income support for households, delivered in the form of one-time $1400 checks and an expansion of unemployment insurance benefits. This is a lot of stimulus, and it looks like even more when you consider the significant income boost that households have already received. Chart 2 shows nominal personal income relative to a pre-COVID trend. Income has been significantly above trend since last spring’s passage of the CARES act, and with fewer spending opportunities than usual, households have been building up a significant buffer of excess savings. Chart 2A Mountain Of Excess Savings
A Mountain Of Excess Savings
A Mountain Of Excess Savings
The risk here is quite clear. With households already flush with cash, an influx of new stimulus risks an earlier return of inflation than was previously anticipated. The remainder of this report considers the likelihood of this risk materializing and what it might mean for Fed policy and our TIPS and portfolio duration recommendations. Inflation Outlook & TIPS Strategy One complication brought on by the pandemic is the stark divergence between goods and services sectors. The large fiscal response means that households have ample cash to deploy towards consumer goods, but service sectors remain shuttered. This divergence is reflected in the inflation data where price pressures are already emerging in the core goods space but services inflation (excluding shelter and medical care) remains below recent historical levels (Chart 3). Manufacturing indicators, such as the ISM Prices Paid survey and commodity prices, provide further evidence of a bottleneck in manufactured goods (Chart 4). Capacity utilization remains low, but it is rising quickly (Chart 4, bottom panel). Chart 3Goods Vs. Services Inflation
Goods Vs. Services Inflation
Goods Vs. Services Inflation
Chart 4A Bottleneck In Manufacturing
A Bottleneck In Manufacturing
A Bottleneck In Manufacturing
The split between goods and services inflation will persist until vaccination efforts gain enough traction for services to re-open, and it will only be exacerbated as more fiscal stimulus is rolled out. Households will continue to dump cash into goods, but service sector participation is likely needed before broad upward pressure on overall inflation emerges. Specifically, broad upward pressure on overall inflation will not be possible until we see a turnaround in shelter (roughly 40% of core CPI). Shelter inflation plummeted during the past year (Chart 5), but some tentative signals are emerging that suggest a bottom may occur within the next 3-6 months. Shelter inflation tends to fall when the unemployment rate is high and rise as labor slack dissipates. Shelter inflation is highly sensitive to the economic cycle. That is, it tends to fall when the unemployment rate is high and rise as labor slack dissipates. Abstracting from large swings in temporary unemployment, the permanent unemployment rate finally ticked down in December (Chart 6). If this marks an inflection point, then shelter inflation is likely close to its trough. The National Multi Housing Council’s Apartment Market Tightness Index is another excellent indicator of shelter inflation. It remains below 50, consistent with downward pressure on shelter inflation, but the tightly-linked Sales Volume Index recently jumped into “more volume” territory (Chart 6, bottom panel). Sales volume led the Market Tightness Index coming out of the last recession. If that happens again, we could soon see shelter inflation creep up Chart 5Shelter Inflation Near ##br##A Trough?
Shelter Inflation Near A Trough?
Shelter Inflation Near A Trough?
Chart 6Shelter Inflation Is Highly Sensitive To The Economic Cycle
Shelter Inflation Is Highly Sensitive To The Economic Cycle
Shelter Inflation Is Highly Sensitive To The Economic Cycle
It is still too soon to call a bottom in shelter inflation. However, if the permanent unemployment rate continues to fall and the Apartment Market Tightness Index follows sales volume higher, then a bottom in shelter could emerge within the next 3-6 months. TIPS Strategy Chart 7Base Effects Will Push Inflation Higher
Base Effects Will Push Inflation Higher
Base Effects Will Push Inflation Higher
Our strategy has been to position for higher TIPS breakeven inflation rates by going long TIPS versus nominal Treasuries, with a plan to tactically reverse this position for a time once the inflation narrative reaches a fever pitch in Q1 of this year. One reason for the inflation narrative to take hold is that base effects will naturally lead to a jump in year-over-year inflation rates during the next few months as the March and April 2020 datapoints fall out of the rolling 12-month average. Chart 7 shows that both 12-month core PCE and core CPI will soon spike above 2%, even if a modest 0.15% monthly growth rate is achieved. Our expectation is that inflation pressures will wane after April of this year, potentially giving us an opportunity to position for a drop in TIPS breakeven inflation rates. However, if shelter inflation does indeed reverse course, as leading indicators suggest it might, that opportunity may not present itself. Bottom Line: Stay positioned long TIPS / short duration-equivalent nominal Treasuries and watch for further evidence of a bottom in shelter inflation within the next 3-6 months. The Fed Has Already Told Us What It Will Do It is certainly possible (even likely) that large-scale fiscal stimulus will cause inflation pressures to emerge earlier than would have otherwise been the case. However, any meaningful monetary tightening in 2021 still seems like a long shot. The potential for Fed tightening in 2021 became a hot topic last week when Atlanta Fed President Raphael Bostic said he’s open to the possibility of tapering asset purchases in late-2021, assuming economic growth turns out to be stronger than anticipated. Fed Chair Powell downplayed the odds of a 2021 taper in his remarks later in the week, causing bond prices to regain some lost ground. Year-over-year inflation will peak in April. Our advice is to not get caught up in the different tones of Fed speakers. The Fed has already been very explicit about the economic criteria that will cause it to tighten policy. Any evaluation of when tightening will occur should be based on an assessment of the economic data relative to these criteria, not on whether certain Fed officials sound more or less optimistic about the future. Tapering & The Timing Of Liftoff Chart 8No Liftoff Until We Reach Full Employment
No Liftoff Until We Reach Full Employment
No Liftoff Until We Reach Full Employment
Our “Fed In 2021” Special Report laid out the three criteria that must be met before the Fed will consider lifting the funds rate.1 Fed Vice-Chair Richard Clarida reiterated this checklist in a recent speech.2 Before lifting rates: 12-month PCE inflation must be 2% or higher Labor market conditions must have reached levels consistent with the Fed’s assessment of maximum employment PCE inflation must be on track to moderately exceed 2% for some time 12-month core PCE inflation is currently 1.38%. As we already noted, it will likely jump above 2% by April but Fed officials will not view that increase as sustainable. The elevated unemployment rate is a big reason why. At 6.7%, the unemployment rate remains well above the range of 3.5% to 4.5% that Fed officials view as consistent with full employment (Chart 8). In his speech, Vice-Chair Clarida said that when “labor market indicators return to a range that, in the Committee’s judgment, is broadly consistent with its maximum-employment mandate, it will be data on inflation itself that policy will react to.” In other words, liftoff will not occur until the unemployment rate is between 3.5% and 4.5%, no matter what happens with inflation. Then, even when the “full employment” criterion has been met, 12-month PCE inflation must still rise above 2% before a rate hike will be considered. The guidance around the tapering of asset purchases is vaguer than the guidance around liftoff. All we know is that the Fed intends to start tapering asset purchases before it lifts the funds rate. Since Fed officials know that a tapering announcement will send a signal that liftoff is imminent, it is highly likely that tapering will occur only a few months before the Fed expects to raise rates. In all likelihood, the unemployment rate will be close to 4.5% before tapering is considered. This could happen by late-2021 if economic growth is very strong, as President Bostic suggested, but a 2022 tapering seems like a safer bet. The Pace Of Rate Hikes Once liftoff occurs, Vice-Chair Clarida has been very clear that inflation expectations will be the principal factor guiding the pace of policy tightening. Specifically, if long-maturity TIPS breakeven inflation rates are below the 2.3 to 2.5 percent range that has historically been consistent with “well anchored” inflation expectations, policy tightening will proceed more slowly than if breakevens are threatening to break above 2.5% (Chart 9). Other measures of inflation expectations based on surveys and inflation’s long-run trend will also be considered (Chart 10). Chart 9TIPS ##br##Breakevens
TIPS Breakevens
TIPS Breakevens
Chart 10Inflation Expectations: Survey And Trend Measures
Inflation Expectations: Survey And Trend Measures
Inflation Expectations: Survey And Trend Measures
The indicators of inflation expectations shown in Charts 9 & 10 are currently below “well-anchored” levels. However, this may not be the case when the Fed is finally ready to raise rates off the zero bound. In fact, when we look at the amount of policy tightening currently priced into the yield curve, we see a good chance that it will be exceeded. The market is currently priced for liftoff to occur in mid-2023, followed by only two more 25 basis point rate hikes over the subsequent 18 months (Chart 11). Chart 11Market Priced For Mid-2023 Liftoff
Market Priced For Mid-2023 Liftoff
Market Priced For Mid-2023 Liftoff
With all the fiscal stimulus coming down the pipe, we can easily envision liftoff occurring sometime in 2022, followed by a somewhat quicker pace of tightening. With that forecast in mind, investors should maintain below-benchmark portfolio duration. Ryan Swift US Bond Strategist rswift@bcaresearch.com Footnotes 1 Please see US Bond Strategy Special Report, “The Fed In 2021”, dated December 22, 2020, available at usbs.bcaresearch.com 2 https://www.federalreserve.gov/newsevents/speech/clarida20210113a.htm Fixed Income Sector Performance Recommended Portfolio Specification
BCA Research’s US Investment Strategy service does not believe that risk assets, stocks, in particular, are on the verge of imploding. However, instead of buying pricey insurance, investors should keep an eye open as valuations risk is high and any sign that…