United States

Highlights Structural reform is coming to the US in the wake of the riotous 2020 election cycle. Extreme levels of political polarization will subside, albeit remaining relatively elevated. This will smooth the way to a more proactive fiscal policy that secures the economic recovery. The Biden administration has enough political capital to pass large fiscal stimulus, an expansion of Obamacare, and an increase of taxes, regulations, and the minimum wage. The Republican Party will go into the political wilderness – and it may not recover from its internal struggle in time for the 2022-24 elections. Moderate Republicans will assist in passing legislation. Stay cyclically long stocks over bonds, cyclicals over defensives, and value over growth, but introduce tactical hedges. Go long VIX. Feature Structural reform is coming to the United States in the wake of the riotous 2020 election cycle. The incoming administration of President-elect Joe Biden will usher in a stabilization of US politics by means of a substantial increase in fiscal support for the economy. This provides a backstop for the recovery that, combined with the ultra-accommodative Federal Reserve, suggests investors should keep an optimistic attitude toward risk assets over the coming 12 months, despite the inevitable ups and downs (Chart 1). Biden and the establishment politicians of both parties are beset by rising forces of populism on the right and left. They likely recognize that their political survival, as well as the country’s stability, depends on maintaining the recovery. The soon-to-be ruling Democratic Party narrowly obtained the majorities necessary to pass at least a few major laws. Chart 1Biden's First 100 Days Triggers Brief Pullback
2021 Key Views: Structural Reform
2021 Key Views: Structural Reform
The change in political leadership will be beneficial for the middle class household but less so for Big Business and corporate earnings. The US faces a rocky historical transition toward larger government involvement in the economy, more restrictions on private enterprise, and more redistribution of wealth. Labor is taking up a larger share of national income, as opposed to capital – a big shift away from the trend of the past 40 years (Chart 2). That period was extremely friendly to equity investors. The future will be trickier, though for the time being the market is pricing the good news. Chart 2Labor Makes A Comeback Versus Capital
2021 Key Views: Structural Reform
2021 Key Views: Structural Reform
In this report we lay down our three key views for 2021: Peak Polarization – US political polarization is at extreme levels and though it will subside in the wake of the feverish 2020 cycle, it will remain elevated in the coming years. There will be aftershocks from the past year’s crises. Extremism and political violence will continue to flare up with the possibility of domestic terrorist incidents. The market impact of this trend is inherent in the Democratic victory in the White House and Congress, but the Biden administration’s political capital will increase upon any major shocks stemming from extreme polarization. Bipartisan Structural Reform – Investors should expect a flurry of legislation. The Democrats will be anxious to reward their base and consolidate power. Moderate Republicans will assist on some votes. New taxes and spending, a higher federal minimum wage, a larger safety net (e.g. healthcare), and administrative reforms will all ensue. Republicans In The Wilderness – The Republican Party is hereby exiled into the political wilderness to settle its internal struggle over Trumpism. The Party of Lincoln will somehow survive but it may not recover by 2024. Below we explain these views, what would undermine them, and what they mean for investors over the next 12 months and beyond. View #1: Peak Polarization US political polarization hit extreme levels over the past year according to various measures (Chart 3). Polarization will retreat as a result of Biden’s victory over Trump – Biden will have a higher approval rating, both generally and among the opposite party, than Trump did. But it will remain elevated relative to history. Structural drivers of polarization, such as wealth and racial inequality, congressional gerrymandering, and regional disparities, remain unaddressed. It will take time to reduce them. Hence, US social and political instability will continue in 2021. Most of this will be noise but some of it will not. Chart 3Polarization At Extremes
2021 Key Views: Structural Reform
2021 Key Views: Structural Reform
Chart 4Terrorism On The Rise In The US
2021 Key Views: Structural Reform
2021 Key Views: Structural Reform
There will be aftershocks in the wake of the Trump rebellion on January 6 and the House Democrats’ decision to impeach him for a second time. A massive show of force will attend Biden’s inauguration, but extremism and political violence of various kinds have been flaring in recent years and will persist for some time (Chart 4). Both the FBI and the Department of Homeland Security have warned of a rise in domestic extremism and terrorism. Increased political instability creates fertile ground for malign actors of all stripes to operate, including domestic or foreign saboteurs. At a critical juncture in the nation’s politics like today, a major attack could wreak more panic and uncertainty than otherwise would be the case. The past year of unrest shows that the bar is high for markets to respond to passing political events. But a major crisis event that has systemic importance cannot be ruled out in today’s precarious environment. In the event of a major domestic terrorist incident, such as the 1995 Oklahoma City bombing, the vast majority of the public would react with utter revulsion and rally around the flag (Chart 5), while the federal counterterrorism response would be overwhelming, just as it was in the 1990s. Chart 5OKC Bombing Spurred Rally Round The Flag
2021 Key Views: Structural Reform
2021 Key Views: Structural Reform
The market impact of such an attack would be fleeting. Other domestic incidents bear this out, such as the Waco siege (1993), the Olympic Park bombing in Atlanta (1996), the Charleston church massacre (2015), and the shooting of Republican lawmakers in 2017 (Chart 6). This point is intuitive given the extensive rioting and unrest in 2020 yet the fall of market volatility throughout the year. Yet the past year’s social and political instability does have major investment implications. It has led to full Democratic control of Congress and the White House on an agenda of fiscal expansion and wealth redistribution. Chart 6Market Largely Ignores Domestic Terrorism
2021 Key Views: Structural Reform
2021 Key Views: Structural Reform
What About Long-Term Effects? With the government supporting the economy, it is less likely that the US will experience a drastic backslide into even greater social instability in the coming years. On the contrary, a more proactive fiscal policy, with more robust social safety nets in terms of health, unemployment, child care, and old age, means that social stability should improve (Chart 7). If the material wellbeing of the country fails to improve, or if exogenous events further destabilize the US, then the social and political environment will deteriorate further. But we would expect that 2021 will see the US secure the recovery and begin to restore order, at least temporarily. Longer term stabilization will require a succession of improvements that span administrations. Chart 7Better Social Safety Net Could Reduce Deaths Of Despair
2021 Key Views: Structural Reform
2021 Key Views: Structural Reform
Bottom Line: The Biden administration’s political support will increase if there are any major attacks and that support will be used to restore order. The market ramifications of any such response are already known: expansive, proactive fiscal policy to stabilize the economy and society and thus reduce the odds of greater division and radicalization. This kind of stabilization is positive for risk assets over a 12-month horizon. View #2: Bipartisan Structural Reform Investors should bet on a flurry of legislation from the Democrats (Table 1). They will be anxious to reward their base, consolidate power, and restore the political establishment to a position of primacy. They will be determined to act quickly, remembering how the 2010 midterms stymied their agenda after winning a blue sweep in the wake of the last major national crisis. Table 1Biden’s Priority? Stimulus … And More Stimulus
2021 Key Views: Structural Reform
2021 Key Views: Structural Reform
Not only do Democrats control Congress but also Republicans are divided – by their loss of the Senate and by Trump’s rebellion. Over the coming year, moderate Republicans will be much more likely to vote with Democrats than the latter will be to defect from their party, especially on popular legislation such as economic stimulus (Chart 8). Chart 8Biden’s Priority? Stimulus … And More Stimulus
2021 Key Views: Structural Reform
2021 Key Views: Structural Reform
If Republicans prove obstructionist then we would not rule out the Democrats mustering the votes to remove the Senate filibuster. But in the current climate, several moderate Republicans, such as Alaska Senator Lisa Murkowski, Pennsylvania Senator Pat Toomey, and Utah Senator Mitt Romney, are looking to distance themselves from Trump and Trumpism. Opposition to government spending has lost a lot of steam in US politics. The populist Republicans are increasingly willing to accept large spending to ease burdens on their voter base. Trump was a big spender, and the Republicans passed large spending bills during his term. Republicans have supported large household rebates as a COVID relief measure, as our Global Investment Strategy points out. These include prominent Senators like Lindsey Graham of South Carolina as well as presidential hopefuls like Marco Rubio of Florida and Josh Hawley of Missouri. Granted, desperate times call for desperate measures – Republican fiscal hawkishness will return now that the party is in the opposition. But there can be little doubt that Republican fiscal discipline has eroded given that both populists and moderates have loosened their standards. Austerity will not have as much support in the 2020s as it did after 2008. There is no chance that Democrats and Republicans will agree on a 2011-style Budget Control Act in the near future. The budget deficit will normalize albeit at a higher level than before the crisis (Chart 9). Chart 9Budget Deficit: Larger For Longer
2021 Key Views: Structural Reform
2021 Key Views: Structural Reform
Democrats are guaranteed to drive a big spending agenda through Congress. They have the votes, the popular support, and the lingering COVID crisis as added impetus. The voting record of the Obama administration reinforces the high likelihood of Democratic unity as well as moderate GOP support (Chart 10). Chart 10Obama Era Shows Democrats Will Pass Legislation
2021 Key Views: Structural Reform
2021 Key Views: Structural Reform
What About Tax Hikes? Congress will also raise taxes sooner or later. The party is united on the need to tackle economic inequality. There is no clear relationship between marginal tax rates and economic growth, capital spending, or productivity, according to our US Investment Strategist Doug Peta. If anything a positive correlation exists between corporate tax rates and economic growth, suggesting the right time to increase taxes is when the economy has recovered from recession or is otherwise in full stride (Chart 11). Nevertheless it is intuitive that a big tax hike could weigh on growth when it is first rolled out. Chart 11A Growing Economy Enables Tax Hikes
2021 Key Views: Structural Reform
2021 Key Views: Structural Reform
So there is a good basis for the Biden administration to delay raising taxes until the recovery is secure. However, taxes will go up sooner or later (Chart 12). Chart 12Corporate Tax Rate Will Rise Sooner Or Later But The Economy Can Power Through It
2021 Key Views: Structural Reform
2021 Key Views: Structural Reform
Taxes must rise to pay for new spending and, in the Democratic Party’s view, redress inequality. The use of the budget reconciliation procedure to pass laws with a simple majority in the Senate will necessarily require revenue offsets over a ten-year window to pay for new spending. The Trump tax cuts were never very popular to begin with, so the political blowback is manageable (Chart 13). Any delay would be temporary and thus its positive effects would be counteracted by the expectations of firms and investors. Passing tax hikes in 2021 enables COVID to serve as a pretext for a larger round of spending increases than would otherwise be possible to offset the new tax burden. Taxes can be passed in 2021 but not take effect until 2022. That might prevent the full impact from hitting ahead of midterm elections that year. Democrats hope to pick up two seats in the Senate, bringing their majority to 52-48 and bringing the more controversial parts of their agenda within reach. Chart 13Trump Tax Cuts Were Never Very Popular
2021 Key Views: Structural Reform
2021 Key Views: Structural Reform
Note also that the Biden administration aims only partially to repeal the Trump tax cuts. The new corporate tax rate will rise to no more than 28%, which is still seven percentage points lower than Trump found it in 2016. Nor is Biden projecting a higher top marginal individual rate than the 39.6% that prevailed before Trump. The minimum corporate tax rate of 15% will bring a bigger negative impact for firms but it will be politically popular. There could also be a financial transactions tax, which Biden has said he supports. All of this is achievable with Senate control (Table 2). Table 2Biden’s Fiscal Agenda
2021 Key Views: Structural Reform
2021 Key Views: Structural Reform
Investors should expect an early hit to earnings expectations. There will be an earnings hit from the simultaneous increase in taxes, regulations, and the doubling of the minimum wage to $15 per hour. Moreover investors need to price in more than Biden’s agenda. They need to price in a broader shift in US policy to redistribute wealth from capital to labor. Firms will face a new paradigm that is less corporate-friendly and laissez faire, at least until the Republican Party recovers and offers a viable alternative. And as discussed below, that could take a while. Bottom Line: The Biden administration will pass big new increases in spending and taxation as well as minimum wages and a slew of new regulations on labor and the environment. The shift to a fiscally proactive US government, at a time when the Fed is ultra-dovish, will ensure that the positive market reaction continues for the most part of the coming 12 months. But sooner or later markets will have to discount a generally more intrusive government that will reduce profit margins. View #3: Republicans In The Wilderness The Republican Party will go into the political wilderness in 2021, where it faces an internal struggle over how to deal with Trump and Trumpism. In the short run this means Republicans will not be well organized to oppose the Biden administration. In the long run, the outcome of this internal struggle will have a historic impact on the overall US policy outlook. Trump has become the first president to be impeached twice. There are eight days until Biden’s inauguration at noon on January 20. The Senate, still led by Republicans, has scheduled the trial to take place after that time, but it may still be relevant. If Trump is tried and convicted, which requires a two-thirds vote, then he could be disqualified from holding any future office on a simple majority vote. Otherwise, Congress could censure him, which would be merely symbolic. The Democrats hope to force Republicans to go on the record after Trump’s interference with the peaceful transfer of power to force them either to break with their party or wear the Trump albatross forevermore. Republican senators are not as reliable for Trump in any new impeachment as in the first one. A vote to remove, disqualify, or censure him would enable them to wash their hands of his actions. This could be useful for swing state moderates. The problem for the GOP is that it is still beholden to Trump, who generated large voter turnout and won 47% of the national vote, despite a pandemic and recession. Trump has left the party in better condition, in terms of seats, than his predecessor George Bush did (Chart 14). If he leaves the GOP and starts his own party, he could bring anywhere from one-third to half of Republican voters with him and thus hobble the party semi-permanently (Chart 15). It has happened before in US history.1 Chart 14GOP Still Fairly Strong In Congress, State Capitol
2021 Key Views: Structural Reform
2021 Key Views: Structural Reform
Chart 15If Trump Leaves, He Could Take One-Third To Half Of GOP Voters
2021 Key Views: Structural Reform
2021 Key Views: Structural Reform
A high-stakes negotiation will have to be held in a smoke-filled back room. Trump wants the 2024 nomination; the GOP wants his base. A solution would involve the GOP exculpating Trump yet again while he shepherds his base over to a successor within the party. But there is deep distrust. Trump was never a normal Republican and now he is even at odds with Vice President Mike Pence, Senate Leader Mitch McConnell, and his former chief of staff Mick Mulvaney. The party is losing donors over Trump’s actions, as companies withdraw support in the name of democracy. Moderate lawmakers and high-profile Republicans are trying to sever ties with Trump and considering leaving the party. If Republicans convince Trump to put away his 2024 aspirations and support the party, they may recuperate fairly quickly, on a populist basis. If they cannot, then the party may split, whether formally or informally, and hand the Democrats a decade-long ascendancy in US politics. Trump has shown that his base is too small to win against a fully mobilized Democratic-led political establishment. But without his base the Republicans definitely cannot win. The Republican Party will thus experience varying degrees of fracture in 2021. So far, Trump says he will run in 2024 and there is no reason to doubt him. But this is moot if the Senate agrees to impeach. This means the party is almost guaranteed to suffer a lasting split that will undermine its prospects in 2022, which would normally be fairly strong, and set up a bloody primary election in 2024. If this is the path the party embarks on in 2021, then investors should expect the Biden administration to be more effective than its narrow majorities suggest in passing legislation. Bottom Line: The Republican Party will suffer a deep fissure, or split entirely apart, depending on President Trump’s actions in the coming years. The implication is that the GOP opposition will be mostly ineffective in Washington in 2021. Moderate senators will be liable to vote with the Democratic majority on major bills. This is especially true of bills relating to COVID relief, economic stimulus, health care, or administrative reform to prevent 2020 election debacles from happening again. Investment Takeaways US equity markets and risk assets will eventually suffer a correction when the market comes to grips with the Biden administration’s capabilities and the looming rise in taxes, regulations, and wages. A stock market drop around Biden’s inauguration and first 100 days would fit the pattern of new “sweep” governments with single-party control. Timing is always tricky especially because the market is exuberant about the combination of larger fiscal and monetary stimulus. Stock prices are technically extended, expensive, and vulnerable to a negative growth surprise, but we would be buyers amid an equity pullback as the policy and macro fundamentals remain supportive. We are bullish over the 12-month horizon, especially in the first half. We are long stocks, the stock-to-bond ratio, value over growth, infrastructure plays, and reflation plays. Fiscal spending will go up quickly with new legislation, whereas tax hikes could be delayed. The implication is that the deficit will get larger and the yield curve will steepen, which is beneficial for cyclical and value plays. When tax hikes come into focus – which we expect to be soon – the tech sector will be the first casualty. We are long materials relative to Big Tech and would also be constructive toward energy relative to tech. The sectors that face the greatest policy risks under the Biden administration – health care, energy, financials – are also the ones best positioned to capitalize on the fresh burst of policy reflation, especially the latter two. Big Pharma and the health insurers clearly face higher policy and regulatory risks. We recommend going tactically short S&P managed health care relative to the broad market. Consumers stand to benefit from stimulus measures that add to their already formidable pile of savings and provide more robust safety nets. Consumer discretionary stocks will also benefit from the normalization of the economy. Thus we view consumer plays favorably in general and recommend going long consumer staples as a tactical hedge. As another tactical hedge we recommend going long volatility (VIX). Several clients have asked about the drop in Twitter’s share prices upon its announcement that President Trump would be permanently removed from the platform. In general, we expect a drop in polarization to coincide with a drop in tech outperformance (Chart 16). The reason is that a slight increase in bipartisanship will result in fewer fiscal cliffs and policy-induced shocks, thus helping inflation expectations recover. This will benefit value stocks more so than growth. The Biden administration is allied with Big Tech but the threats to this sector are sprouting up in both political parties and from every direction – from anti-trust authorities, state-level governments, privacy advocates, free speech advocates, foreign tax authorities and regulators, and unions. We will discuss the latest controversies regarding Big Tech and free speech/press in future reports but for now suffice it to say that the macro and policy landscape is shifting against Big Tech. The big five tech firms may still see their stock prices rise but they will underperform the other 495 companies on the S&P. Chart 16Polarization And Tech Go Hand-In-Hand
2021 Key Views: Structural Reform
2021 Key Views: Structural Reform
Matt Gertken Vice President US Political Strategy mattg@bcaresearch.com Appendix Table A1Biden’s Cabinet Position Appointments
2021 Key Views: Structural Reform
2021 Key Views: Structural Reform
Footnotes 1 Namely in the 1912 election when Theodore Roosevelt left the Republican Party and started the progressive “Bull Moose” party, costing incumbent President William Howard Taft the election versus Democratic challenger Woodrow Wilson. One could loosely interpret Texan Ross Perot’s presidential runs in 1992 and 1996 in a similar vein, and perhaps that would be more applicable to any future independent run by President Trump.
Are Tech Titans Giving Way?
Are Tech Titans Giving Way?
Overconcentration of returns in a handful of stocks has been an overarching theme in a number of our 2020 publications. For instance, we separated the SPX in the S&P 5 vs. the S&P 495 in late-July, and showed how a handful of tech titan stocks dominated S&P 500 returns, especially since 2015. Roughly a month later these tech stocks peaked, and the normalization process began (top panel). It is remarkable that the S&P 5 are down in absolute terms since their September 2 crest, whereas the S&P 495 are up over 15%. The recent surge in the 10-year Treasury yield exacerbated the nosedive in relative share prices as it deals a blow to the bubbly valuation of the longest duration sector in the SPX: the tech sector. Crudely put, the steeper the selloff in the bond market the greater the fall in relative market capitalization (10-year Treasury yield shown inverted, middle & bottom panels). Bottom Line: Stick with a barbell tech sub-group positioning, preferring software and services to hardware and equipment, but stay tuned.
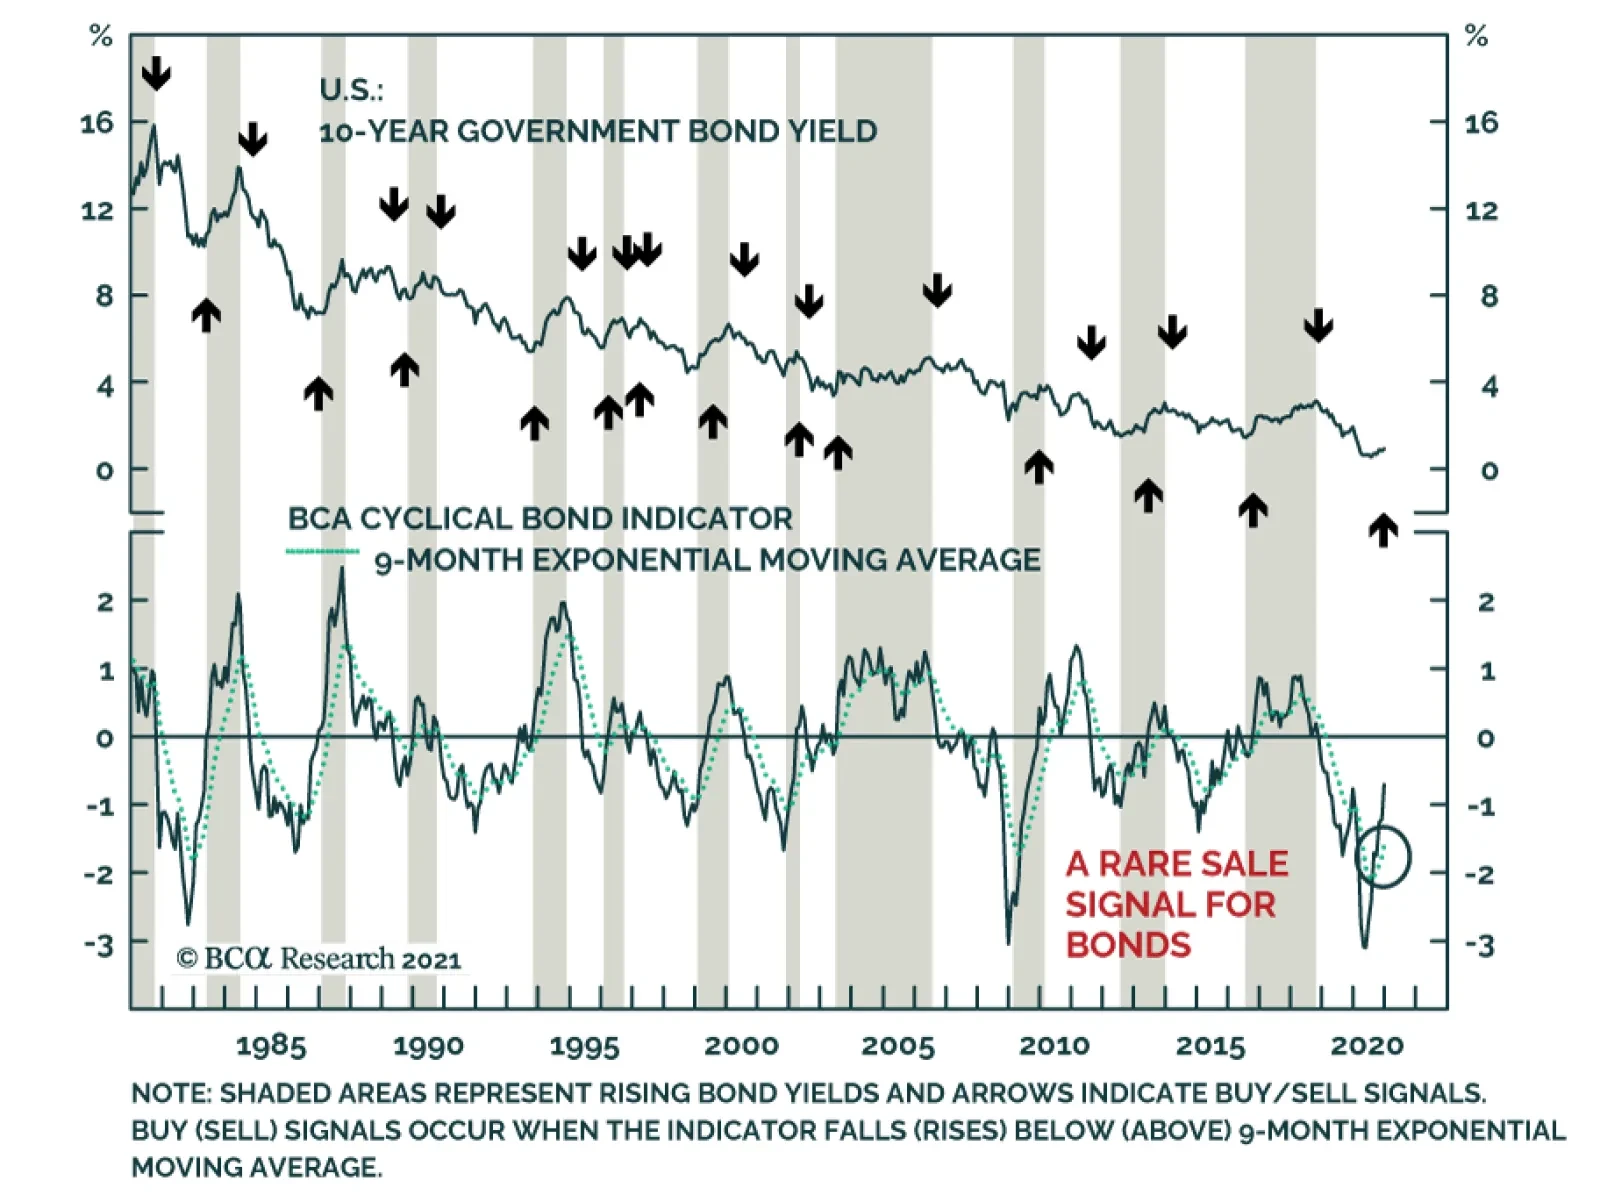
BCA Research’s time-tested indicators are sending bearish warnings for bonds. The BCA Cyclical Bond Indicator is rising quickly and has crossed over the signal line, which indicates that yields have significantly more upside over the coming 9 to 12 months. We…
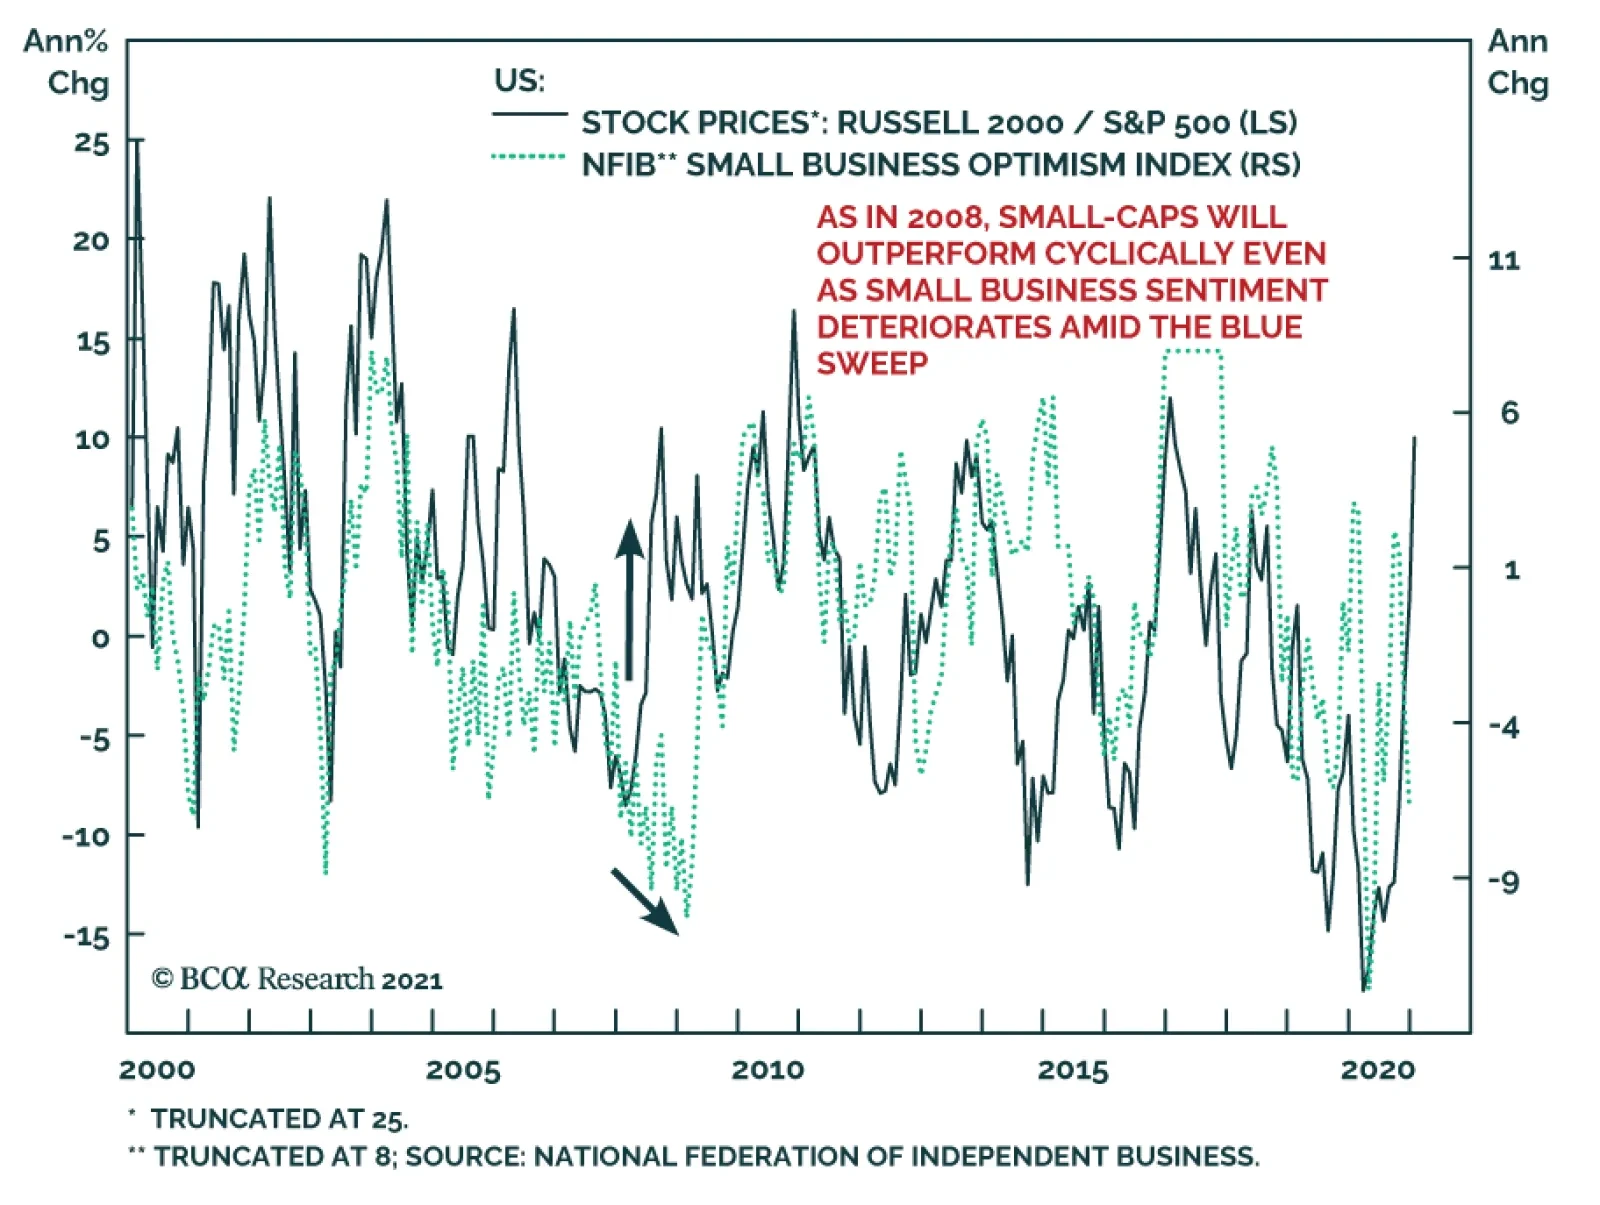
The NFIB Small Business Optimism Index dropped to 95.9 in December from 101.4, disappointing expectations of a smaller decline to 100.2. The deterioration was broad-based with nine out of the ten components falling and only the current inventory index rising.…
According to BCA Research’s Global Fixed Income Strategy service, the odds of a major US fiscal spending boost from the incoming Biden Administration, both in the short-run and over the medium term, are now much higher after the Georgia senate elections. More…
(Part III) Don’t Overstay Your Welcome
(Part III) Don’t Overstay Your Welcome
Consistent with the previous Insight’s cautionary tone, we recommend investors book gains of 16% on the small size bias that we have been exploring since the October 26, 2020 inception (top panel) and 6% since the high-conviction calls report on December 7, 2020. Small caps have gone parabolic since late October and the small/large 13-week rate of change annualized momentum is at the highest print since the dotcom bubble era breaching 100%/annum recently (second panel), and second largest ever in the history of our data set (not shown). The top 10 constituents of small cap indexes are now populated by highly speculative names (see here and here) and in the Russell 2000 specifically the weights of some of the top 10 constituents have jumped to more than 10 fold from the 0.05% median weight to over 0.5% weight. In other words, elements of frothiness are also evident in small cap indexes. At least a pause for breath is likely in the next three months and we opt to move to the sidelines and downgrade the size bias back down to neutral. Finally, we are also shifting the 10% stop in our long “Back-To Work”/short “COVID-19 Winners” pair trade baskets to a 5% rolling stop in order to protect gains of over 25% since the September 8, 2020 inception (bottom panel). Bottom Line: The easy money has been made in the small/large ratio, lock in gains and step aside. Today we also switch our trailing 10% stop to a rolling 5% stop in the long “Back-To Work”/short “COVID-19 Winners” pair trade baskets. Stay tuned.
(Part II) Downgrade Alert On Cyclicals Versus Defensives
(Part II) Downgrade Alert On Cyclicals Versus Defensives
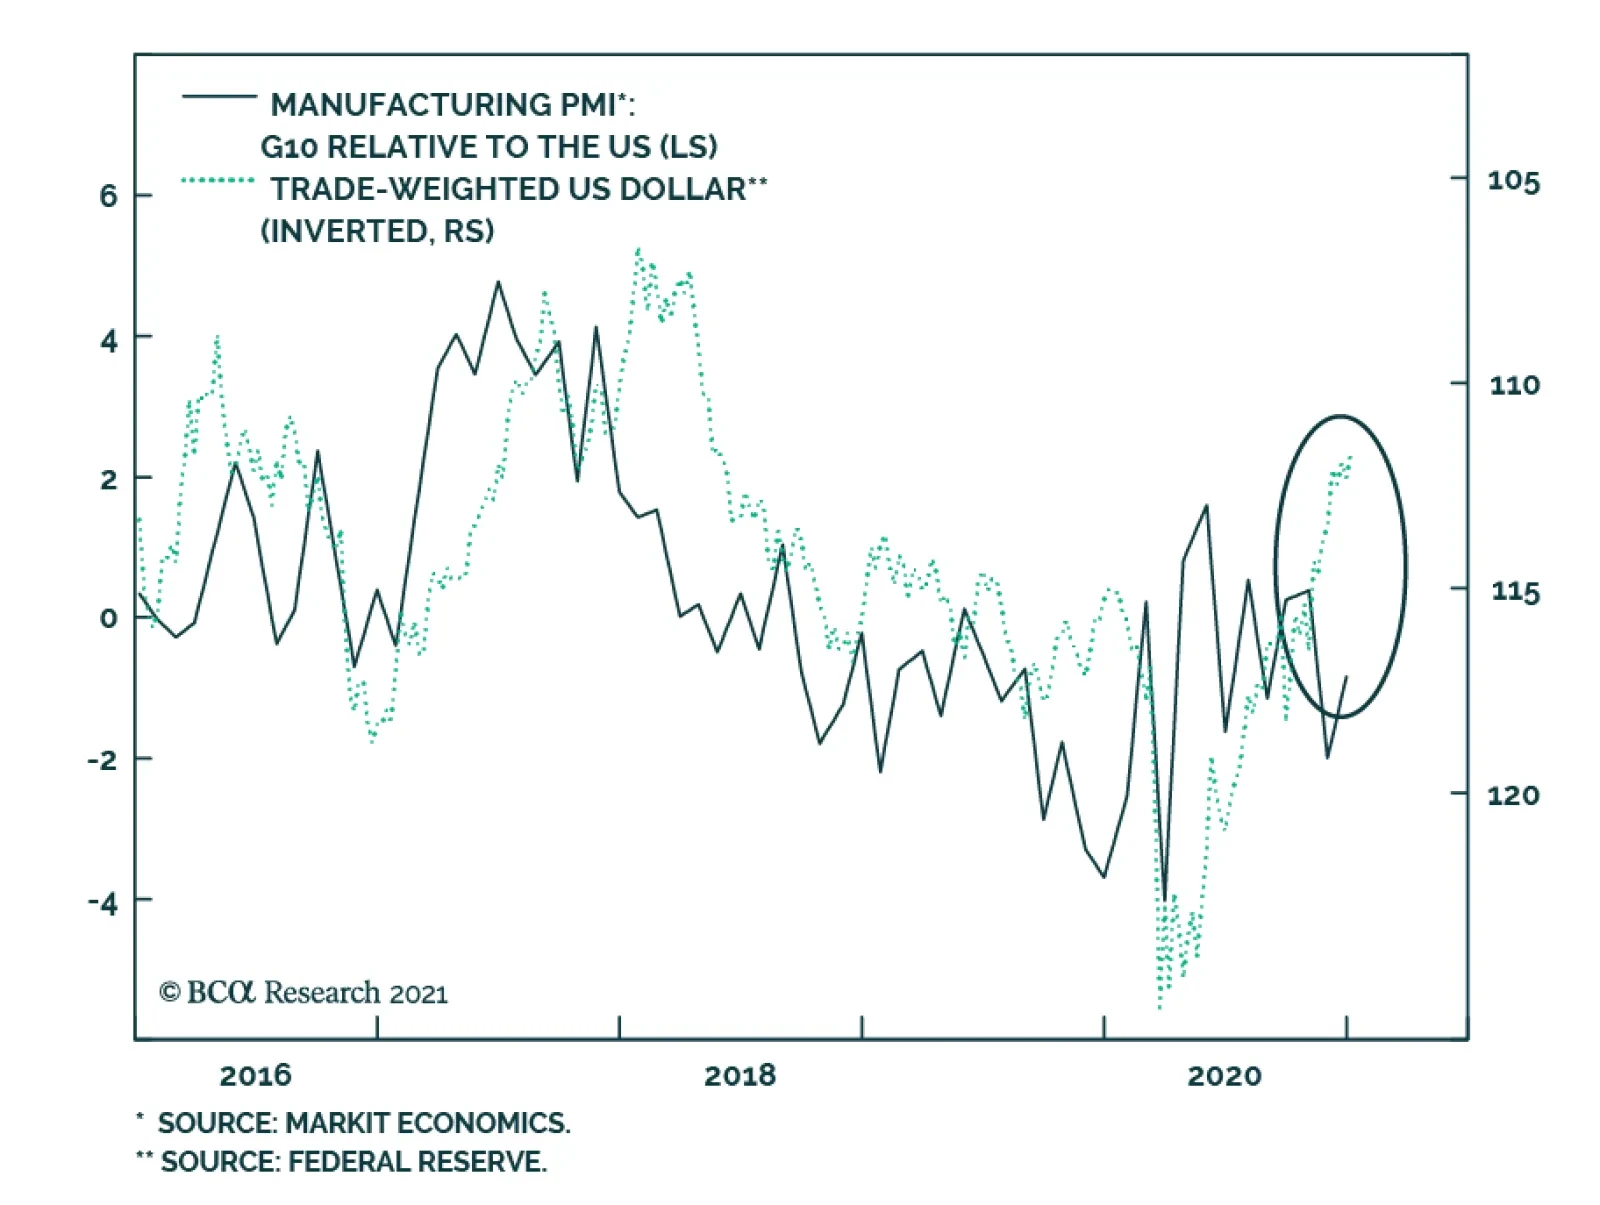
The previous Insight highlighted the similarities between the 2009/10 episode and today, when the SPX troughed in March 2009 similar to the recent recessionary trough in March 2020. Our biggest worry is the reflex rebound in the dollar. Everyone is short dollars and this one-sided bet is at risk of capsizing the ship. Importantly, interest rate differentials will likely start to push the greenback higher. The bottom panel of the chart shows that since the August trough, 10-year US Treasury yields have more than doubled to over 1.1%, whereas the 10-year bund yield has stayed muted at -0.5%. Additional US fiscal easing along with the sustained rebound in the US economy should continue to weigh on bond prices and further push interest rates higher and eventually stock valuations lower. This accumulated interest rate pressure will at the margin start to weigh on EUR / USD. As a result, the near parabolic move in cyclicals versus defensives will at least go on hiatus. We are putting the S&P utilities sector on upgrade alert and the S&P materials sector on downgrade alert and once we execute these moves our portfolio will hopefully monetize double digit gains since the July 27, 2020 inception, and will push our cyclicals/defensives portfolio bent back to even keel. Bottom Line: Prepare to lock in gains in the cyclicals versus defensives portfolio bent (via downgrading materials and upgrading utilities), this ratio is now on our downgrade watch list (please see the next Insight).
(Part I) Turn Cautious On The SPX
(Part I) Turn Cautious On The SPX
Last autumn during the 10% SPX correction, we started to reposition the portfolio to benefit from the reopening trade and initiated our long “Back-To-Work”/short “COVID-19 Winners” trade, implemented a small cap size bias, reiterated our cyclicals / defensives portfolio bent by downgrading the S&P pharma index to underweight (which pushed the S&P health care to neutral) and crystalized handsome gains in our VIX futures trade.
(Part I) Turn Cautious On The SPX
(Part I) Turn Cautious On The SPX
We were arguing that stocks would glide lower into the election and then take off as geopolitical in general and election in particular uncertainty would subside and also seasonality would switch from a headwind to a powerful tailwind for stocks. One week following the election we updated our three EPS scenarios for 2021 and also upped our calendar 2021 EPS estimate to $168, from $162 previously, and lifted our SPX target for end-2021 to 4,000. Since then, the SPX is up nearly 600 points and we are now compelled to turn wary. Keep in mind that the S&P 500 has fully discounted the 24% EPS growth for calendar 2021 and now that we are in early 2021 and the market will soon look into calendar 2022 EPS, we doubt that the sell side’s $196 EPS level which translates into 17% EPS growth rate is attainable, especially given the specter of rising corporate taxes. The higher the SPX will rise in the near-term the more it will eat into future returns and thus push down the expected return. Equity flows are very powerful both from sidelined cash coffers, which are getting replenished from fiscal easing packages and from investors fleeing bonds. The implication is that timing the exact turn is difficult. The chart (on the previous page) shows that 2009/10 is an interesting parallel to draw, which we used recently when we initiated a VIX futures hedge to our high-conviction calls for the June 2021 expiry, as a number of asset classes signal that it is prudent to be cautious especially on the prospects of the broad equity market. Applying the SPX return from the 2009 trough to the 2010 peak, implies that the SPX can rise to 4,010 if history at least rhymes. Given recent bubble talk in the media, using the October 1998 to March 2000 parallel and applying that SPX return would imply an SPX level of 3,687 (see table). Our sense is that the further we rise the bigger the snapback will be and a retest of the October 2020 lows is a high probability event. Thus, from a tactical perspective we are not willing to risk 100-200 points of upside for a potential 800-point drawdown. One enticing synthetic long trade recommendation we are initiating is to buy a $390/$410 call spread on the SPY ETF and sell a $340 put for March 19 expiry for a modest cost of $0.67 per contract. The June expiry is a good alternative for more conservative investors with an actual $2.85 per contract cash inflow. This is not a speculative trade; it is a way to deploy fresh capital (i.e. covered position) at a much lower S&P 500 level given our still sanguine broad equity market view on a cyclical 9-12 month time horizon. This way we can partially participate (as we cap our gains) in the unfolding mania, and if markets turn around, as we expect on a near-term tactical basis, this trade goes long the SPY at a much lower level. Bottom Line: The board equity market risk/reward tradeoff is to the downside for the next three months on a tactical basis (please see the next Insight).
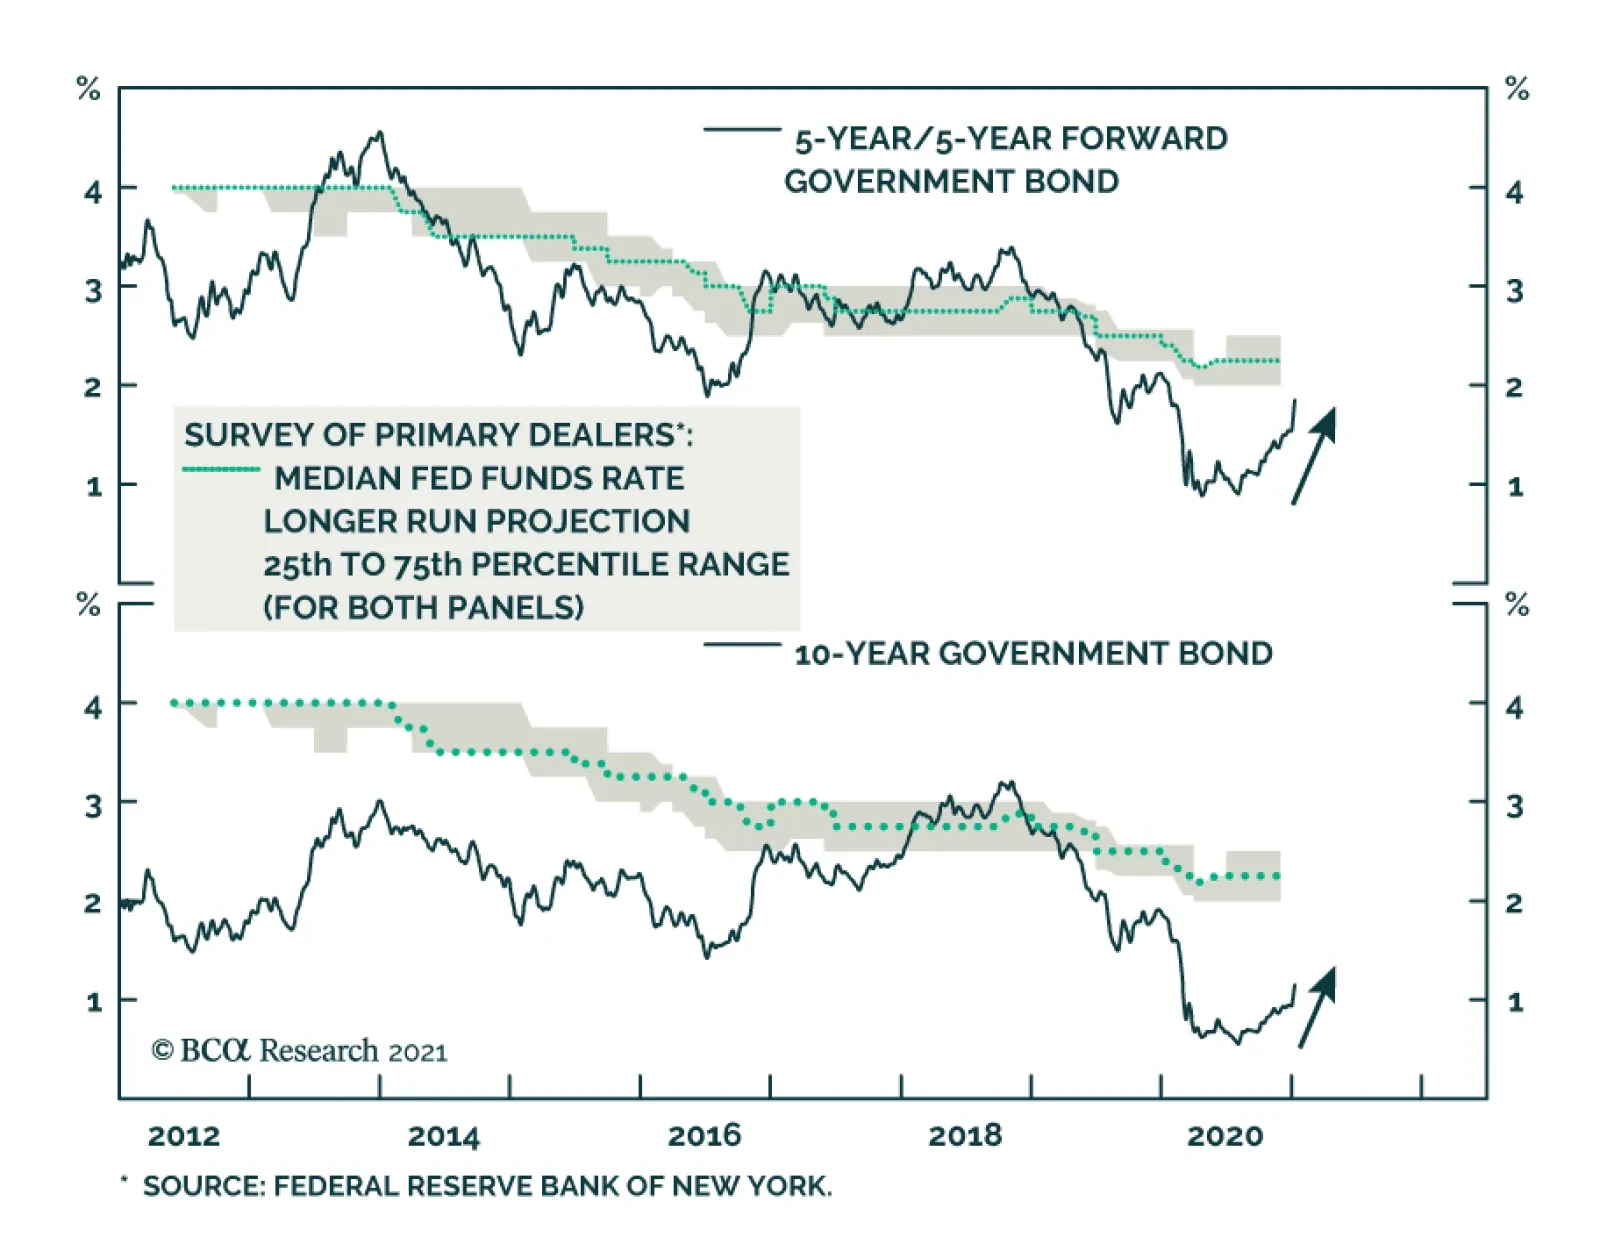
Highlights Rates: The Democratic sweep of the election has caused the uptrend in bond yields to accelerate and has benefited our recommended rates positions (below-benchmark duration, nominal and real curve steepeners, inflation curve flatteners). We aren’t yet ready to exit any of these positions, and our medium-term target of 2% - 2.25% for the 5-year/5-year forward nominal Treasury yield remains unchanged. Municipal Bonds: Though valuation has become more expensive, we continue to recommend a maximum overweight allocation to municipal bonds. In particular, investors should favor municipal bonds over investment grade corporate bonds with equivalent credit rating and duration. Economy: December’s employment report showed the first monthly contraction in nonfarm payrolls since April. However, this negative headline reflects the transitory impact of the latest COVID wave. It does not signal renewed weakness in the pace of economic recovery. Feature A Politically Driven Bond Rout In a Special Report last October, we argued that the bond market was vulnerable in a scenario where the November 3rd election resulted in the Democratic party winning the House, Senate and White House.1 It took some time, but after Democrats won both of Georgia’s Senate seats in last week’s special election, we are finally seeing the impact on the bond market. Nominal Treasury Yields First, the 10-year nominal Treasury yield moved above 1% for the first time since March. It currently sits at 1.13% (Chart 1). Meanwhile, the front-end of the Treasury curve held steady as the Fed continued to signal that liftoff is unlikely to occur within the next two years. The result has been a persistent steepening of the nominal curve (Chart 1, bottom panel). The 10-year nominal Treasury yield moved above 1% for the first time since March. We are positioned for a bear-steepening of the nominal Treasury curve, but the speed of this most recent move raises the question of how much further the bond sell-off can run. As we wrote in our year-end Special Report, we see yields continuing to rise until the 5-year/5-year forward Treasury yield reaches levels consistent with survey estimates of the long-run equilibrium fed funds rate (Chart 2).2 This would be in line with where yields peaked during the prior two global growth recoveries (2013/14 and 2017/18). At present, survey responses put our target for the 5-year/5-year forward Treasury yield at roughly 2% to 2.25%, still 18 to 43 bps above current levels. Chart 1Nominal Curve Bear-Steepening
Nominal Curve Bear-Steepening
Nominal Curve Bear-Steepening
Chart 2How Much Upside For Yields?
How Much Upside For Yields?
How Much Upside For Yields?
The prospect of greater fiscal stimulus under a Democratic government doesn’t necessarily translate into a higher ceiling for Treasury yields, but it does increase the speed with which yields will reach our target. All in all, we remain positioned for a bear-steepening of the nominal Treasury curve but will re-consider this stance if the 5-year/5-year forward yield reaches a range of 2% to 2.25%. Inflation Compensation Chart 3Stay Overweight TIPS For Now
Stay Overweight TIPS For Now
Stay Overweight TIPS For Now
The recent 20 bps jump in the 10-year nominal Treasury yield was driven by a 15 bps increase in the 10-year TIPS yield and a 5 bps increase in the 10-year TIPS breakeven inflation rate. Notably, the 10-year and 5-year/5-year forward TIPS breakeven inflation rates have both pushed above 2% and are sitting at 2.08% and 2.06%, respectively. While these long-maturity TIPS breakevens have recovered nicely, the Fed won’t be tempted to adopt a more hawkish policy stance until they reach a range of 2.3 – 2.5 percent, a range that has been consistent with “well-anchored” inflation expectations in the past (Chart 3).. While TIPS breakeven inflation rates aren’t yet high enough to worry the Fed, they are starting to look elevated compared to actual inflation. At 2.08%, the 10-year TIPS breakeven inflation rate is 27 bps above the fair value reading from our Adaptive Expectations Model (Chart 3, panel 3).3 Given this expensive valuation, we are currently looking for an opportunity to tactically reduce our allocation to TIPS. We expect that opportunity will come when the 12-month core and trimmed mean inflation rates re-converge (Chart 3, bottom panel). The low level of core CPI inflation relative to the trimmed mean suggests that inflation has near-term upside as some downtrodden sectors that are excluded from the trimmed mean recover from the pandemic. But inflation will moderate once that “snapback phase” is over, and we should get an opportunity to reduce our TIPS allocation.4 Along with an overweight allocation to TIPS versus nominal Treasuries, we also recommend owning inflation curve flatteners. The inflation curve tends to flatten when the cost of inflation protection rises, and this has indeed been the case during the past few weeks (Chart 4). It will make sense to exit this flattener when we tactically reduce our TIPS allocation, but this will only be a temporary move. In the long run, the inflation curve will eventually invert and then remain in negative territory for an extended period. This is the result of the Fed’s plan to engineer an overshoot of its 2% inflation target. If the Fed is successful, it means that it will be attacking its inflation target from above for the first time since the 1980s. In such an environment, it makes sense for the inflation curve to be inverted. Chart 4Inflation Curve Flattening
Inflation Curve Flattening
Inflation Curve Flattening
Real Yield Curve Chart 5Real Curve Steepening
Real Curve Steepening
Real Curve Steepening
Our final rates curve recommendation is a real yield curve steepener. This position has also performed well during the recent bond rout, as a 14 bps increase in the 10-year real yield occurred alongside a 13 bps drop in the 2-year real yield (Chart 5). As with our other rates positions, we are inclined to stay the course. A 2/10 real yield curve steepener can be thought of as the combination of a 2/10 nominal curve steepener and a 2/10 inflation curve flattener. During the recent bond sell-off, the 2/10 real curve has steepened by 27 bps, split between 17 bps of nominal curve steepening and 10 bps of inflation curve flattening. We will likely maintain our real yield curve steepener as a core portfolio position even if we eventually close our inflation curve flattener. Gradual progress toward fed funds liftoff and the resulting steepening of the nominal curve should be sufficient to steepen the real yield curve, even if inflation takes a pause. Corporate Credit Chart 6Move Down In Quality
Move Down In Quality
Move Down In Quality
Corporate spreads have reacted well to the news of a Democratic sweep, even though it means that a corporate tax hike is coming in 2021. All else equal, the one-time hit to profits from a tax hike is negative for corporate balance sheets, but this is a minor consideration when the macro back-drop remains so positive for spread product. The combination of above-trend economic growth and highly accommodative monetary policy will encourage investors to keep adding credit risk, and the average investment grade and high-yield index spreads have still not quite recovered to their pre-COVID tights (Chart 6). We continue to view the Ba credit tier as the most attractive from a risk/reward perspective, as the incremental spread pick-up in Ba compared to Baa is elevated compared to what we’ve seen in recent years (Chart 6, panel 3). Bottom Line: The Democratic sweep of the election has caused the uptrend in bond yields to accelerate and has benefited our recommended rates positions (below-benchmark duration, nominal and real curve steepeners, inflation curve flatteners). We aren’t yet ready to exit any of these positions, and our medium-term target of 2% - 2.25% for the 5-year/5-year forward nominal Treasury yield remains unchanged. Fiscal Policy In 2021 Chart 7Organic Household Income Has Recovered
Organic Household Income Has Recovered
Organic Household Income Has Recovered
Our US Political Strategy service debuted last week with a report that considers the outlook for fiscal policy in 2021 given that Democrats now have control of the House, Senate and White House.5 In short, the Democrats now have complete control of the government but their majorities in the House and Senate are thin. This means that the most radical parts of the Democratic agenda, like the Green New Deal, will be hard to pass. However, the Democrats will be able to deliver two reconciliation bills in 2021. The first bill could come soon and will likely focus on additional COVID relief and social support, such as $2000 checks to individuals instead of $600 ones. After that, the Democrats will focus on expanding and entrenching the Affordable Care Act (Obamacare). They will partially repeal the Trump tax cuts to help finance these priorities. On the issue of COVID relief, we are no longer concerned about the US economy receiving enough stimulus to avoid a double-dip recession. We had previously estimated that a further $600 billion to $1 trillion of income support for households would be required to support consumer spending at reasonable levels.6 This estimate now looks too high because non-CARES act household income has recovered much more quickly than we had anticipated. Non-CARES act household income is already back to pre-COVID levels (Chart 7). In our prior research, we assumed this wouldn’t happen until July 2021. In any event, another round of $2000 checks will provide more than enough income support to sustain a recovery in consumer spending. A Democratic sweep suggests big fiscal thrust in 2021 and less contraction in 2022. More generally, our US Political Strategy team has estimated the medium-term path for the US deficit under a “Democratic Status Quo” scenario that assumes another round of $2000 checks and that the remaining $2.5 trillion of the proposed HEROES Act will be enacted. It also considers a “Democratic High” scenario that adds Joe Biden’s $5.6 trillion policy agenda on top of the Democratic Status Quo (Chart 8). Biden will not achieve all of his agenda, so the reality will lie somewhere between the Democratic Status Quo and Democratic High scenarios. In either case, we will see considerably more fiscal thrust compared to the Republican Status Quo and Baseline scenarios. Chart 8Democratic Sweep Suggests Big Fiscal Thrust In FY2021 And Less Contraction FY2022
A Blue Sweep After All
A Blue Sweep After All
Municipal Bonds The prospect of federal government aid for challenged state & local governments is a crucial issue for municipal bond investors. Fortunately, the Democratic party’s HEROES act contains more than $1 trillion of aid to state & local governments and this will likely form the basis of the next COVID relief package. On top of that, further support for household incomes will also help support state & local tax revenues that are already recovering (Chart 9). Chart 9State & Local Austerity Will Continue
State & Local Austerity Will Continue
State & Local Austerity Will Continue
That said, we are likely still in for a considerable period of state & local austerity given the large budget gaps that have opened during the past nine months. However, the expectation of help from the federal government makes us even more confident that state & local governments will muddle through without a spate of muni downgrades or defaults. We maintain our “maximum overweight” recommendation for tax-exempt municipal bonds, though valuation is turning more expensive by the day. Muni yield spreads versus Treasuries are contracting, particularly at the long end of the curve (Chart 10A) and valuations appear more expensive if we look at yield ratios instead of spreads (Chart 10B). In both cases, value looks better at the front end of the curve than at the long end. Chart 10AMuni / Treasury Yield Ratios
Muni / Treasury Yield Ratios
Muni / Treasury Yield Ratios
Chart 10BMuni / Treasury Yield Ratios
Muni / Treasury Yield Ratios
Muni / Treasury Yield Ratios
Bottom Line: The new Democratic government will deliver more than enough income support to sustain the recovery in consumer spending. Aid for state & local governments is also forthcoming and it will help sustain municipal bond outperformance versus both Treasuries and investment grade corporates. Though valuation has become more expensive, we continue to recommend a maximum overweight allocation to municipal bonds. In particular, investors should favor municipal bonds over investment grade corporate bonds with equivalent credit rating and duration. December Payrolls Only A Temporary Setback At first blush, last week’s December employment report looks disastrous. Nonfarm payrolls fell by 140 thousand, the first monthly contraction since April. The contraction looks especially worrying when you consider that payrolls remain almost 10 million below pre-COVID levels and should be rising quickly at this stage of the economic recovery (Chart 11). Chart 11Payrolls Contracted In December
Payrolls Contracted In December
Payrolls Contracted In December
Chart 12Permanent Unemployment Fell In December
Permanent Unemployment Fell In December
Permanent Unemployment Fell In December
The grim headline numbers, however, severely overstate the magnitude of the problem. Rather than implying underlying economic weakness, the drop in payrolls reflects the transitory impact of the pandemic’s latest violent wave. December’s job losses came from the Leisure and Hospitality sector (-498k), the sector most impacted by the virus. Job gains remained solid elsewhere in the economy (+358k). The unemployment rate held flat at 6.7% in December, but encouragingly, this stable number masks both an increase in the number of temporarily unemployed (or furloughed) workers and a drop in the number of permanently unemployed workers (Chart 12). Those furloughed workers will return to work once the virus is better contained. Meanwhile, the drop in the number of permanently unemployed suggests that the economic recovery is taking hold. It will only gain momentum as the COVID vaccine is rolled out and additional fiscal stimulus is delivered in 2021. Ryan Swift US Bond Strategist rswift@bcaresearch.com Footnotes 1 Please see US Bond Strategy / Global Fixed Income Strategy Special Report, “Beware The Bond-Bearish Blue Sweep”, dated October 20, 2020, available at usbs.bcaresearch.com 2 Please see US Bond Strategy Special Report, “2021 Key Views: US Fixed Income”, dated December 15, 2020, available at usbs.bcaresearch.com 3 For more details on our model please see US Bond Strategy Weekly Report, “How Are Inflation Expectations Adapting?”, dated February 11, 2020, available at usbs.bcaresearch.com 4 For more details on inflation’s “snapback phase” please see US Bond Strategy Weekly Report, “More Stimulus Needed”, dated September 15, 2020, available at usbs.bcaresearch.com 5 Please see US Political Strategy Weekly Report, “Buy Reflation Plays On Georgia’s Blue Sweep”, dated January 6, 2021, available at usps.bcaresearch.com 6 Please see US Bond Strategy Weekly Report, “More Stimulus Needed”, dated September 15, 2020, available at usbs.bcaresearch.com Fixed Income Sector Performance Recommended Portfolio Specification
According to BCA Research’s Foreign Exchange Strategy service, a blue wave will likely supercharge the dollar’s downtrend in 2021. The US political landscape is becoming more dollar bearish. This is because a blue wave will likely supercharge fiscal…