United States

Highlights We remain constructive on the economy and financial markets, … : US households have stored up a great deal of dry powder for consumption once the economy fully reopens, last month’s stopgap fiscal measures will help relieve pressure on the most vulnerable households, and the Georgia Senate results ensure that even more fiscal transfers are in store. … but there is a non-negligible risk that investors will get too excited about the positive backdrop: The exceedingly supportive policy backdrop could easily help the S&P 500 push into the low 4,000s, but it’s not clear what investors will have to look forward to for the rest of 2021 if it ascends to that level early in the year. We do not share the bubble-spotters’ alarm, but we are willing to study their arguments: We like to test our convictions by seeking out opposing views and we therefore read Jeremy Grantham’s bubble essay with great interest. We do not share his urgent concern, and our recommended asset allocations are nearly the mirror image of his, but we are taking a deep dive into his view and its implications. Feature As a grad student on the South Side of Chicago, I used to run on the bike path along the lake. On windless days, the three or four miles north from Hyde Park Boulevard felt especially easy, and I would think, “this is what it’s like when there’s no wind.” Then I’d head for home and discover there’d been a breeze behind me all along. A mile or two in, I’d realize it was no breeze and marvel at how I hadn’t noticed it on the way out. The moral of the story, as I told it then, is that if you think it’s not windy in Chicago, just turn around. Now it seems that it has a broader, weightier lesson: it can be easy to miss the wind when it’s behind you. Jeremy Grantham’s carefully reasoned bubble warning, posted online last Tuesday,1 has inspired us to re-examine our outlook and how widely it’s shared. We are not changing our view – we remain vigilantly bullish – but it is worth devoting ample time to consider the risks to it. This week, we highlight the elements of Grantham’s piece that most caught our attention; next week, we will discuss strategies to try to reduce an investor’s vulnerability to them. The Belated Blue Wave Grantham’s essay highlights vulnerabilities that could come to the fore sometime in the near future, but the Democratic sweep of Georgia’s Senate seats has immediate market implications. By virtue of Vice President-elect Harris’s tie-breaking vote, the Democrats will hold a majority in the 50-50 chamber beginning January 20th. The outcome ensures that the Biden administration will have slim majorities in both houses of Congress for its first two years (pending appointments and special elections). Although a five-seat House majority and the slimmest possible Senate majority will not give the incoming administration carte blanche to enact sweeping legislative changes, it will have an easier time pursuing its agenda than it would have had the Republicans held on to just one of the Georgia Senate seats. Item number one on that agenda is likely to be bulked-up fiscal aid for struggling households, states and municipalities. The economic and market significance of the blue wave is that Congress can now become a full partner supporting the monetary policy aim of erring to the side of providing too much accommodation. With the Fed pledging that it won’t take its foot off the gas any time soon, revived fiscal spending will provide the economy with an incremental reflationary boost that should benefit risk assets. Fiscal transfers will be at least partially funded with increased taxes on corporations and high-earning individuals. Profit margins will narrow, but empirical evidence of a relationship between tax rates and economic growth is elusive (Chart 1). Economic growth is largely a function of growth in the size of the working-age population and growth in productivity. Investment leads productivity – workers become more productive when endowed with more and better tools – but history suggests that investment spending is indifferent to corporate tax rates (Chart 2), as is productivity (Chart 3). Chart 1We Don't Like Taxes, Either ...
We Don't Like Taxes, Either ...
We Don't Like Taxes, Either ...
Chart 2... But They Do Not Seem To Impact Investment ...
... But They Do Not Seem To Impact Investment ...
... But They Do Not Seem To Impact Investment ...
Chart 3... Or Productivity Growth
... Or Productivity Growth
... Or Productivity Growth
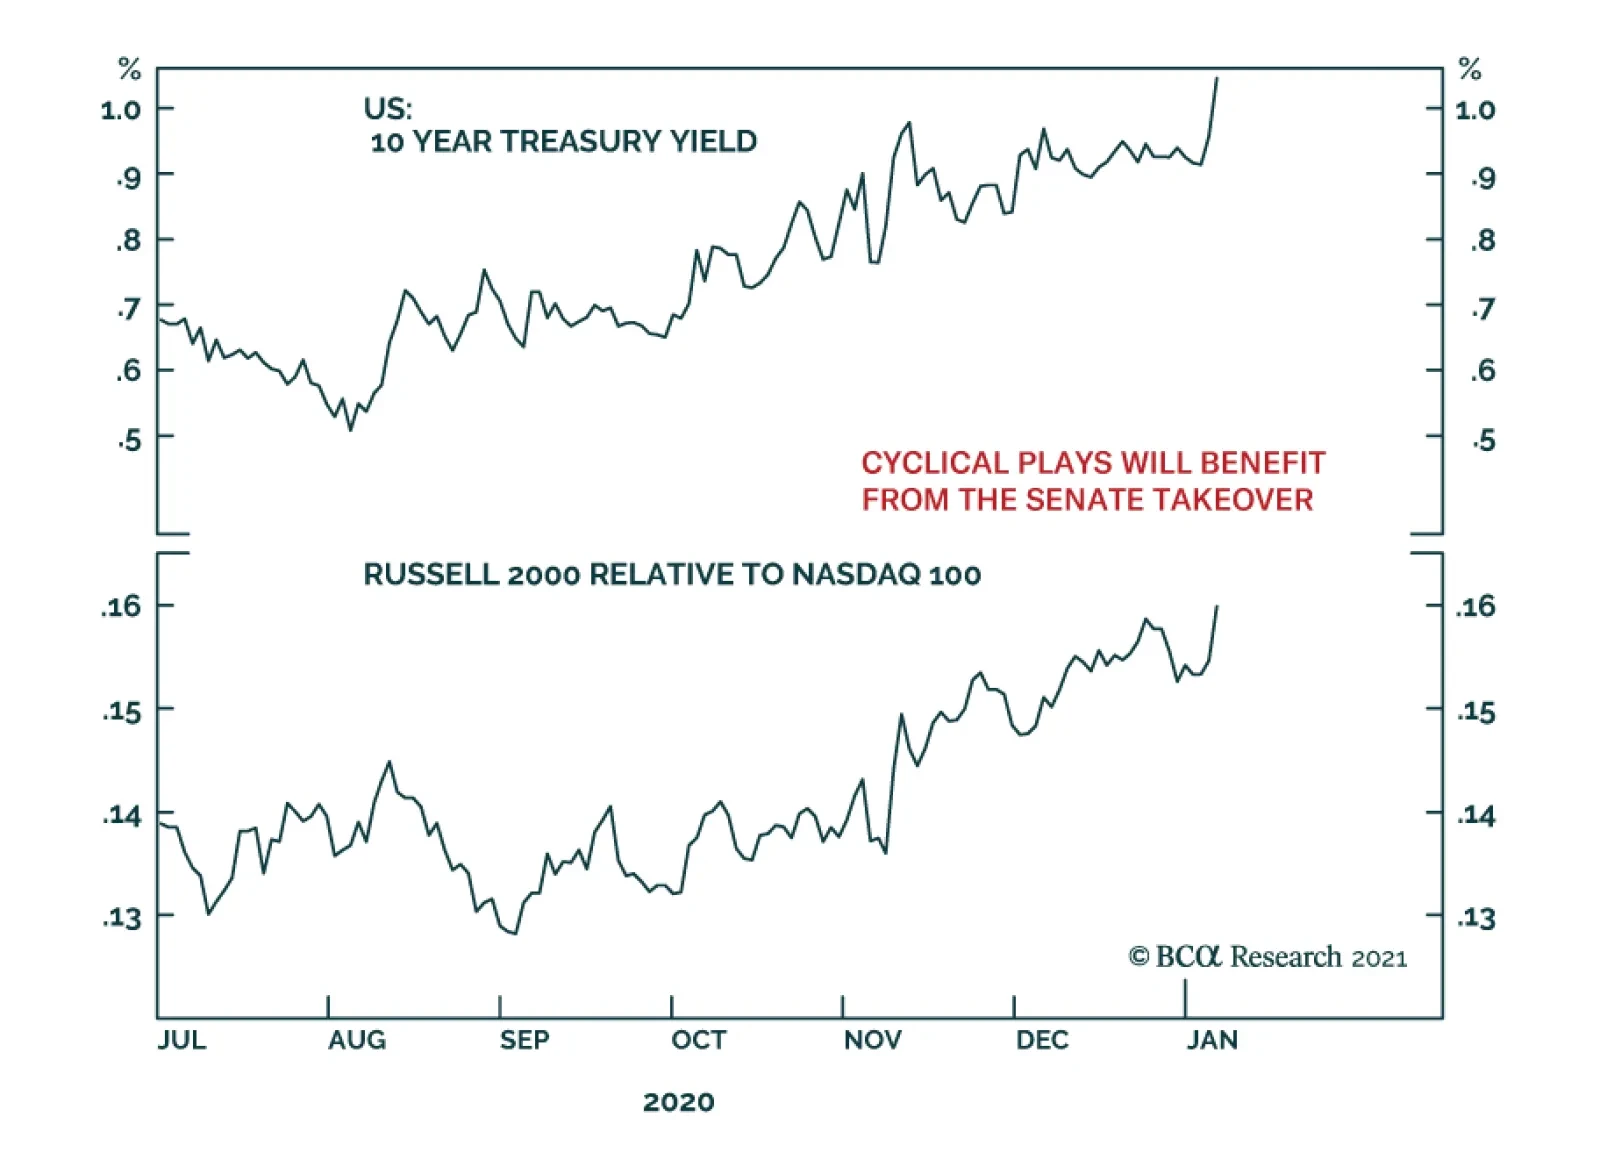
We are disposed to agree with the idea that higher taxes are a drag on growth. Transferring spending power from the private sector to government apparatchiks is not likely to improve efficiency. Business executives are as fallible as any other experts, however, and changes in tax rates have a smaller multiplier effect than the proposed spending measures. Net-net, we expect that the outcome of the Georgia run-offs will lead to slightly higher interest rates, a steeper yield curve, increased consumption and fewer defaults, a welcome mélange for credit performance and the equities that were left behind as investors flocked to COVID winners. A Slippery Slope Chart 4Bull Markets Tend To Go Out With A Bang
Let's Not Get Carried Away
Let's Not Get Carried Away
[G]reat bubbles are where fortunes are made and lost – and where investors truly prove their mettle. For positioning a portfolio to avoid the worst pain of a major bubble breaking is likely the most difficult part. Every career incentive in the industry and every fault of individual human psychology will work toward sucking investors in. [Emphasis added.] As Jeremy Grantham lays it out, the latter stages of a bull market are especially perilous. Given that bull markets run hot before they end (Chart 4), it becomes fiendishly difficult to resist their pull. The recency bias drives an investor to focus on the most recent data points to the exclusion of older ones, pointing to higher expected returns than might be inferred from a more comprehensive sample. The phenomenon encourages equity overexposure at inopportune times if returns are mean-reverting. Professional investors are as susceptible to recency bias and overconfidence (fueled by having had the wind at their back) as non-professionals, and their judgment can be additionally clouded by career pressures. Those who achieve the longest tenures are at least subconsciously attuned to Keynes’ dictum that it is better to fail conventionally than to succeed unconventionally. Staying at the party too long with lots of others may hold far less risk than staking out a solitary position. The bottom line is that asset management incentives encourage groupthink, especially as late-stage bull markets go into overdrive. Dizzying Heights The long, long bull market since 2009 has finally matured into a fully-fledged epic bubble. Featuring extreme overvaluation, explosive price increases, frenzied issuance, and hysterically speculative investor behavior, I believe this event will be recorded as one of the great bubbles of financial history[.] Bubbles are only identifiable in retrospect, but several aspects that financial historian Charles Kindleberger associated with manias are evident. Money is cheap and readily available and valuations are quite high. One could argue that anticipation of short-term capital gains is drowning consideration of future earnings for at least some equity investors or, as Grantham puts it, “stocks [are] rising … simply because they are rising.” Make no mistake: Equity valuations are demanding and de-rating appears more likely than continued re-rating. The main valuation metrics clearly indicate that equities are richly priced. The S&P 500’s forward earnings multiple is hovering around two standard deviations above the mean, at heights previously reached only in the late ‘90s and early ‘00s (Chart 5). Price-to-sales is at an all-time high, three standard deviations above the mean (Chart 6, top panel), while book (Chart 6, middle panel) and cash flow multiples (Chart 6, bottom panel) are elevated but not yet extreme. Price-to-sales should rise if markets believe pandemic-induced margin pressure is temporary and will reverse once the country is vaccinated, but the one-plus-sigma surge above pre-COVID levels would seem to be a bit much. Chart 5Equity Valuations Are Pushing The Envelope
Equity Valuations Are Pushing The Envelope
Equity Valuations Are Pushing The Envelope
Chart 6Making A Run At '99-'00
Making A Run At '99-'00
Making A Run At '99-'00
Equity option and IPO activity is redolent of euphoria and overtrading. Equity call option volume has surged to record levels (Chart 7, top panel), reportedly on the back of an explosion in small retail activity, and the put-call ratio has fallen to dot-com-bubble levels as demand for exposure has swamped demand for protection (Chart 7, bottom panel). New IPOs have been coming fast and furious (Chart 8, top panel) at a relatively tender average age (Chart 8, bottom panel). Sponsors’ shift away from hoarding early- and middle-stage returns to inviting the public to share them may prove to be telling. There are many reasons to sell equity interests, but expecting them to blast higher isn’t typically one of them. Chart 7The Merry Men Of Sherwood Forest Have Discovered Options Are A Gas, Too
The Merry Men Of Sherwood Forest Have Discovered Options Are A Gas, Too
The Merry Men Of Sherwood Forest Have Discovered Options Are A Gas, Too
Chart 8Take The Money And Run
Take The Money And Run
Take The Money And Run
The Legend Who Cried Wolf This isn’t the first time Grantham or one of his colleagues has expressed concern about rising stock prices. It may be unduly harsh to call him a perma-bear, but GMO has consistently underestimated equities and the firm has seen its assets under management (AUM) cut in half over the last five years, to $60 billion, while its flagship asset allocation fund has lost over 60% of AUM. As an RIA firm executive told a Bloomberg reporter, “I can see how clients lose patience with them. They get defensive way before anybody else.2” It’s important to recognize different commentators’ biases/agendas when evaluating their arguments. Grantham calls out the broker-dealers as perpetual market cheerleaders, but he has a stake in convincing GMO clients and prospects that value investing principles are still relevant. BCA’s business model is far more insulated from markets’ direction, but our research services have a bias to fit inherently unruly markets into tidy narratives. Disclosing the risks to our views is an essential part of our process, but the hypotheses we reject will always get less of an airing than the ones we embrace – no investor has time to read weekly 50-page deliberations. Why Now? The canonical BCA question – So What? – is meant to keep researchers focused on the market relevance of their inquiries. But we have long advocated for a second question – Why Now? – to keep our focus on timeliness. Spotting imbalances, which can take a maddeningly long time to reverse, isn’t enough to earn alpha. To translate macro analysis into promising investment ideas, an investor also needs to identify potential catalysts that might unwind the imbalance. Bull markets become exhausted once so much capital is invested in them that there is no one left to keep buying, just as bear markets end when the urgency to sell dissipates. Sentiment can offer clues into remaining buying or selling power, and the day before the Grantham piece appeared, an experienced financial advisor with a stellar portfolio management record emailed that, “This is one of the few times in my career where I feel like the market is simple and the consensus is right. It almost always feels like there is something obviously bad on the horizon but this market feels like there is really good news on the horizon.” I have known him for over 30 years and can attest to his intelligence, diligence and savvy. His clients are in excellent hands and his constructive take may well be spot on. Indeed, we hope so, since it dovetails with ours, but his assurance gave us pause. For now, it doesn't seem to be universal, as it contrasted starkly with this musing from another trusted confidante (a family office CIO) as 2020 was winding down, “What can be said about work other than make certain we don’t mistake this bull market for brilliance.” Valuation is a notoriously lousy timing indicator and sentiment is a squishy concept that is hard to pin down. Both can remain stretched for a long period of time. An investor shouldn't bet against them unless s/he has a good reason for believing they are on the verge of reversing. Perhaps not having to run on the relative performance hamster wheel like most professional investors gives the family office CIO, who also has a great track record, a little broader perspective, but every investor could use a dose of humility. Skepticism is an essential component of successful investing as well, especially as stocks are making new highs. If you think it’s not windy … Investment Implications We respect Jeremy Grantham’s experience and formidable accomplishments and listen closely to any insights he’s willing to share. We acknowledge that there are many signs of froth across financial markets and that the Kindleberger red line of purchasing assets without regard to their intrinsic merit could be crossed in the not-too-distant future. We echo the sentiment that central bankers are not omnipotent and that easy monetary policy is not a magical elixir. We do, however, assert that the combination of extremely easy monetary policy and a new round of fiscal aid offers equities and spread product a supportive backdrop that should be expected to hold throughout the year provided that markets don’t get over their skis by bidding up asset prices too far. The bottom line is that market vulnerabilities are cropping up but we disagree with the view that they are about to bring an end to risk asset outperform-ance. We remain overweight equities and spread product while keeping an eye out for anything untoward. As we have been saying for several weeks, we are bullish, albeit vigilantly so. One of our roles is to worry for our clients, and we are scanning the horizon for signs of trouble even more thoroughly than normal. Until we see those signs, or until risk asset prices rise so much that they sour their risk-reward prospects, we will stick with our call. On the last point, we are in complete agreement with Grantham: The one reality that you can never change is that a higher-priced asset will produce a lower return than a lower-priced asset. You can’t have your cake and eat it. You can enjoy it now, or you can enjoy it steadily in the distant future, but not both – and the price we pay for having this market go higher and higher is a lower 10-year return from the peak. Doug Peta, CFA Chief US Investment Strategist dougp@bcaresearch.com Footnotes 1https://www.gmo.com/americas/research-library/waiting-for-the-last-dance/ Accessed January 5, 2021. Grantham is the octogenarian co-founder of Grantham, Mayo and van Otterloo (GMO), a value-oriented asset manager for institutional investors. 2 McDonald, Michael. "Grantham’s Bear Market Call Tests Patience of GMO Fund Investors," Bloomberg, November 24, 2020.
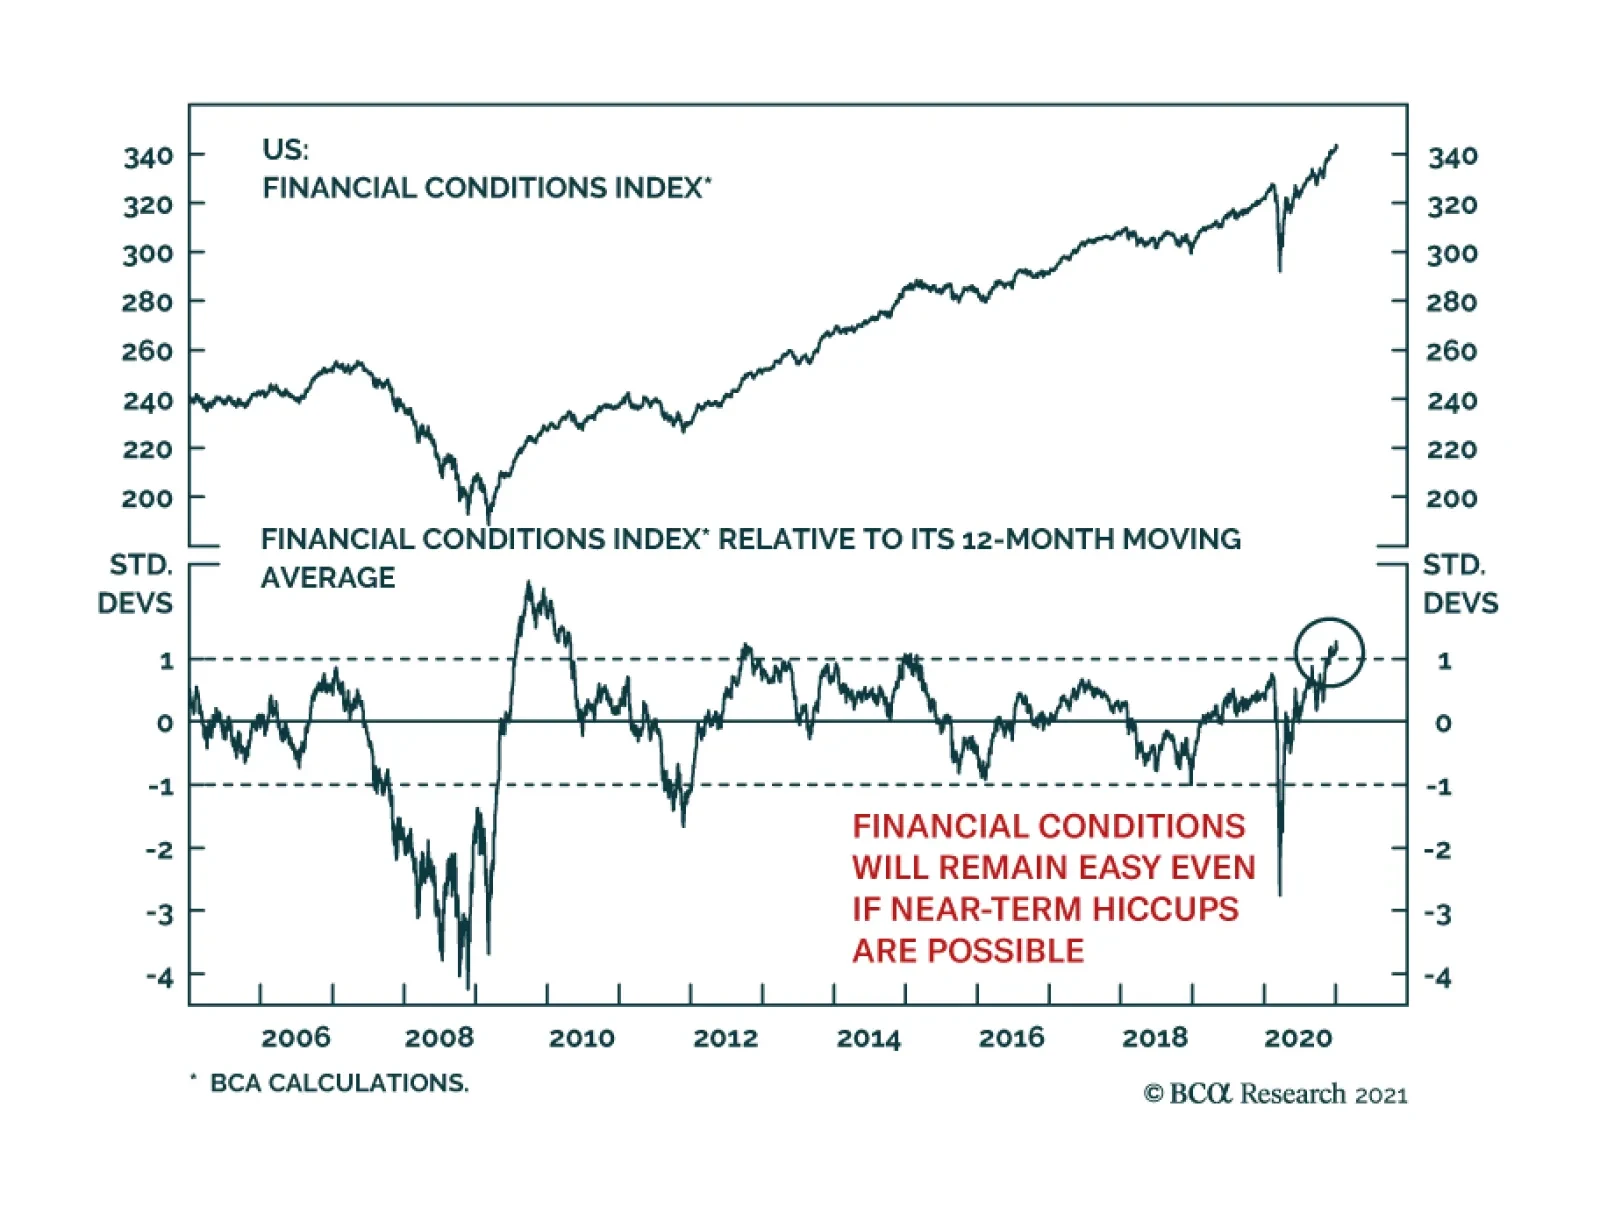
Markets have rallied on the back of easy fiscal and monetary conditions, both of which will boost growth this year, especially now that vaccines will allow for a more permanent softening of rolling lockdowns in the second half of 2021. However, a virtuous…
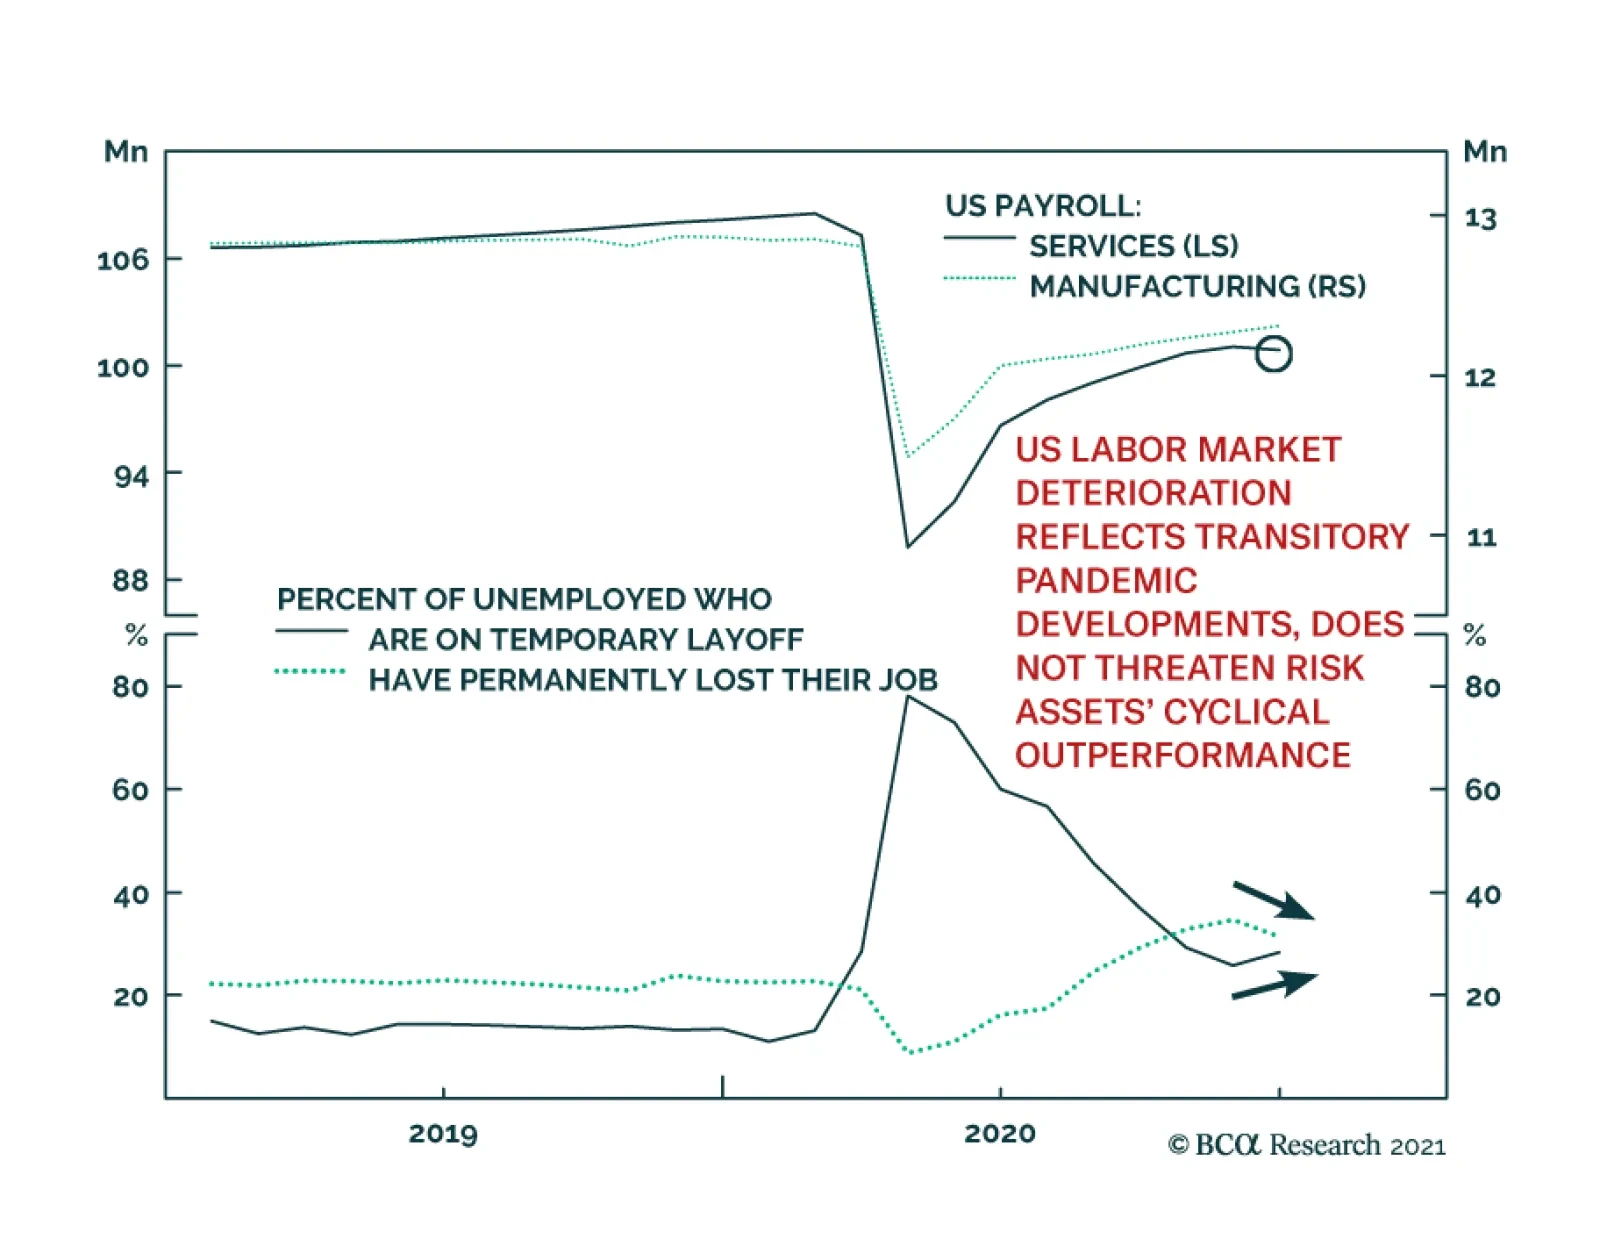
Total US nonfarm payrolls were a major disappointment, falling by 140 thousand in December, after rising in the previous 7 months. But the contents of the report are not nearly as negative for markets as the headline number suggests. Rather than implying…
Highlights A blue wave will likely supercharge the dollar’s downtrend in 2021. The key beneficiaries of this decline will be the much undervalued Scandinavian currencies, as well as those of commodity-producing countries. The initial knee-jerk reaction from the dollar could be positive as inflation lags the improvement in aggregate demand. Our trading model continues to recommend shorting the dollar. This simple three-factor model has outperformed the DXY index by over 300% since 1980. We were stopped out of our short NZD/CAD trade. This is a portfolio hedge. Look to reinstate. Feature The US political landscape is becoming more dollar bearish. This is because a blue wave will likely supercharge fiscal spending and allow for a partial repeal of the Trump tax cuts. Both will boost aggregate demand, without an equivalent offset from higher US interest rates. As we explain below, this is negative for the greenback. As a key reflator for the global economy, a lower US dollar will lead to an outperformance of non-US bourses, lifting animal spirits abroad and in a virtuous cycle, pressuring the dollar even lower. From a technical perspective, the dollar remains very oversold, having declined in almost a straight line since last March. While we continue to expect a dollar bounce, we had initially highlighted in previous reports it will be technical in nature, capped at around 2%-4%. Given this week’s news, chances of a technical bounce remain high, but the amplitude will be much more muted than we initially expected. This dovetails nicely with our trading model, which is politically agnostic, and continues to recommend shorting the dollar for the month of January. Implications Of A Blue Sweep It has been clear since the US election campaign began that Democratic leaders have been more aggressive in their demands for a greater government role in the economy. As such, a blue wave should widen the US budget deficit by much more than was expected under a Republican Senate. All things equal, a wider budget deficit is negative for the greenback. All things equal, a wider budget deficit is negative for the greenback (Chart I-1).1 Higher aggregate demand (via higher government spending) should allow the US output gap to close faster than would have otherwise been the case. This should begin to put upward pressure under domestic inflation. If the Federal Reserve chooses to allow an inflation overshoot, this will depress US real rates further and hurt the dollar in the process. There is a well-established relationship between real interest rate differentials and the greenback (Chart I-2). Chart I-1The Dollar And Budget Deficits
The Dollar And Budget Deficits
The Dollar And Budget Deficits
Chart I-2The Dollar And Real Interest Rates
The Dollar And Real Interest Rates
The Dollar And Real Interest Rates
The US continues to run a large current account deficit, meaning domestic savings have been insufficient to finance investment. A higher budget deficit is likely to widen the current account deficit, assuming private-sector savings do not rise significantly. To finance the shortfall in spending, foreign investors might require a higher risk premium on US assets via higher yields and/or a lower exchange rate. With the Federal Reserve effectively capping nominal yields, a lower exchange rate will be needed to entice foreign investors. A reason behind the dollar’s decline last year has been a stampede out of the Treasury market by foreign investors (Chart I-3). Chart I-3A Dearth Of Foreign Investors
A Dearth Of Foreign Investors
A Dearth Of Foreign Investors
Part of the Biden campaign pledge has also been to raise both corporate and personal income taxes. The US currently enjoys favorable corporate taxes relative to its G10 and BRICS peers (Chart I-4). Higher taxes would lower the return on capital for US investments. Our US Equity Strategists reckon the hit to the technology and health care sectors from a change in the tax rate will be particularly acute, in an order of magnitude of about 13.5% and 13.1% of earnings-per-share, respectively. Inflows into US equities exploded higher last year on the back of low rates and the higher weighting of technology and health care sectors in US bourses (Chart I-5). A reversal of these flows will hurt the dollar. This will occur at a time when expected returns on US equities are particularly low, compared to those in Europe and Japan (Chart I-6). Chart I-4Biden's Tax Plan In Perspective
The Dollar In A Blue Wave
The Dollar In A Blue Wave
Chart I-5US Equity Inflows Have Been Strong
US Equity Inflows Have Been Strong
US Equity Inflows Have Been Strong
Chart I-6ALow Expected Return On US Equities
The Dollar In A Blue Wave
The Dollar In A Blue Wave
Chart I-6BBetter Expected Returns On Eurozone Equities
The Dollar In A Blue Wave
The Dollar In A Blue Wave
Chart I-6CBetter Expected Returns On Japanese Equities
The Dollar In A Blue Wave
The Dollar In A Blue Wave
Is COVID-19 A Red Herring? Chart I-7A Covid-19 Growth Scare?
A Covid-19 Growth Scare?
A Covid-19 Growth Scare?
The analysis above suggests the outlook for the dollar should be bearish. Then why has the greenback been rebounding since the unveiling of a blue sweep? There are two reasons. First, the dollar was already very oversold, suggesting the short-term reward/risk from shorting the currency was not very favorable. Second, inflation is a lagging economic variable, so any impact from fiscal stimulus will first be on real growth, with inflation rising much later. Therefore, fiscal stimulus in the US will likely boost US economic performance relative to its peers in the short term. Meanwhile, as we navigate the winter season in the northern hemisphere, a new wave of infections has taken root. This will likely lead to a widespread deterioration in economic conditions, as economies enter more stringent lockdowns. Around the G10, various measures of lockdowns are being implemented, with particularly restrictive measures in the UK and Canada where new cases are close to record highs. Infection trends remain favorable in Australia and New Zealand, probably due to previous localized lockdowns (Chart I-7). However, with new, more infectious strains being first spotted in the UK and then South Africa, the bar is very low for a worldwide-renewed infection wave. The impact on currency markets is two-fold. First, the dollar is a counter-cyclical currency and so will benefit from safe-haven flows that will erupt with any renewed relapse in growth. With the dollar having traded inversely neck-in-neck with the S&P 500, any equity correction will provide a much healthy catalyst for a dollar bounce (Chart I-8). Any bounce in the USD should be faded as robust global growth in 2021 is expected. More directly, the impact for currency markets will be through relative economic growth. The improvement in the December Purchasing Managers’ Index was more favorable outside the US, particularly in Sweden, Canada, and the UK. That said, the greenback has undershot the trend dictated by the relative economic performance between the US and the rest of the G10 (Chart I-9). Should the US quickly bridge the gap between herd immunity (through vaccinations) and the spread of the virus, US economic growth could gain the upper hand. Chart I-8The Dollar And Markets
The Dollar And Markets
The Dollar And Markets
Chart I-9The Dollar And Relative Growth
The Dollar And Relative Growth
The Dollar And Relative Growth
Ultimately, the near-term potential impact from COVID-19 will be much less than economies endured in the first half of 2020. The main reason is that the vaccine rollout is accelerating, with many other candidates in the pipeline. This will allow for robust global growth in 2021, which will ease safe-haven flows into the US dollar. Thus, any bounce in the USD should be faded rather than leaned into, as we have been arguing since October of last year.2 FX Trading Model Chart I-10BCA FX Trading Model
BCA FX Trading Model
BCA FX Trading Model
How does our trading model feel about a blue sweep? It is agnostic, given that none of the inputs are directly driven by US politics. The one area where US politics could affect the model is through real rates, but as we have argued, this is a slow-moving process. More importantly, the model serves as a rules-based approach in trading foreign exchange. In short, three criteria drive the model:3 A macroeconomic variable that captures the most important relative price between any two currencies: the real interest rate. A valuation measure that captures dislocation in a currency pair relative to its own history. A key assumption is stationarity, meaning the currency cross will mean-revert back to fair value over time. A sentiment indicator. The key assumption here is that the dollar is a momentum currency. This very simplistic approach has outperformed a buy-and-hold DXY portfolio by 325% since 1980 (Chart I-10). Given the encouragement from this initial result, we will be releasing part two of the model in the coming weeks. The FX market is likely to become more volatile and provide more opportunities. For now, the model recommends shorting the DXY for the month of January, driven by long positions in the Swedish krona, Swiss franc, and Japanese yen. Less favorable currencies are the Australian and New Zealand dollars (Chart I-11). Such a barbell strategy of some high-beta currencies, together with some safe havens, might be just what the doctor ordered. In our FX portfolio, we prefer to stick with trades at the crosses. So far, our trading recommendations have benchmarked favorably against the model recommendations (Chart I-12). We will build on this success in future iterations. Chart I-11Long = Greater Than 0; Short = Less Than 0
The Dollar In A Blue Wave
The Dollar In A Blue Wave
Chart I-12Man Versus BCA Machine
The Dollar In A Blue Wave
The Dollar In A Blue Wave
Housekeeping Our portfolio has benefited tremendously from the overall short dollar position we have been recommending since 2019. However, in light of possible volatility in the coming weeks, we are tightening stop-losses on a few of our profitable trades. We hold a basket of Scandinavian currencies against both the dollar and the euro. Tighten the stop loss to a 2% loss from initiation, given recent gains. Stay long silver versus gold but tighten the stop loss to 75 to lock in some profits. Our long yen portfolio hedge has performed quite well. Tighten the stop loss from 110 to 105. We were stopped out of our short NZD/CAD trade for a loss of 1.8%. Stand aside for now, with a view to re-establish later. We are still short NZD versus AUD. Tighten the stop loss to 1.02. In our view, the FX market is likely to uncover many macro opportunities as the year unfolds. Stay tuned. Chester Ntonifor Foreign Exchange Strategist chestern@bcaresearch.com Footnotes 1 Please see Foreign Exchange Strategy Weekly Report, “The Dollar And The Budget Deficit: From Theory To Practice,” dated August 14, 2020. 2 Please see Foreign Exchange Strategy Weekly Report, “Tail Risks In FX Markets,” dated October 2, 2020. 3 Please see Foreign Exchange Strategy Weekly Report, “Building A Protector Currency Portfolio,” dated February 7, 2020. Currencies U.S. Dollar Chart II-1USD Technicals 1
USD Technicals 1
USD Technicals 1
Chart II-2USD Technicals 2
USD Technicals 2
USD Technicals 2
Recent data in the US have been robust: The final read of the Markit Manufacturing PMI was 57.1 in December, compared to a prior reading of 56.5. The ISM manufacturing index came in at a very robust 60.7 for the month of December, well above expectations. The trade balance in the US remained near cycle lows at -$68.1bn for November. The DXY index fell slightly this week. It is becoming quite clear that December was a robust month for economic data, both in the US and abroad. As a result, the US dollar, which is a counter-cyclical currency, depreciated modestly. With the prospect of higher fiscal stimulus in the US, but an accommodative Federal Reserve, lower real rates should keep a cap on the dollar. Report Links: The Dollar Conundrum And Protection - November 6, 2020 The Dollar In A Market Reset - October 30, 2020 A Few Market Observations - October 23, 2020 The Euro Chart II-3EUR Technicals 1
EUR Technicals 1
EUR Technicals 1
Chart II-4EUR Technicals 2
EUR Technicals 2
EUR Technicals 2
Recent data from the euro area have held up: The Markit Manufacturing Index remained at the 55 level for the month of December (from 55.5 to 55.2). Producer prices continue to deflate at 2% per year, but the November decline compares favorably to the 5% year-on-year drop in May last year. Core CPI remained flat at 0.2% in December. The euro appreciated by 0.2% against the US dollar this week. The dominant theme in markets remains a broad-based dollar decline, with the euro being the key liquid beneficiary of this move. Most of Europe has managed to flatten the infection curve for Covid-19, which should allow economic momentum to improve further. Report Links: The Dollar Conundrum And Protection - November 6, 2020 Addressing Client Questions - September 4, 2020 On The DXY Breakout, Euro, And Swiss Franc - February 21, 2020 The Japanese Yen Chart II-5JPY Technicals 1
JPY Technicals 1
JPY Technicals 1
Chart II-6JPY Technicals 2
JPY Technicals 2
JPY Technicals 2
Recent data from Japan has been quite disappointing: Cash earnings fell by 2.2% for the month of November. The key driver was a 10.3% decline in overtime pay and 22.9% decline in bonus payments. The Jibun manufacturing PMI was relatively flat at the 50 boom/bust level in December. On a positive note, vehicle sales improved by 7.4% year-on-year in December. It is becoming more evident that a replacement cycle in Japanese autos in underway. The Japanese yen depreciated by 0.7% against the US dollar this week. The key theme this week was a rise in US bond yields, which made the allure of Japanese fixed income less attractive. With Japanese yields anchored at 0%, rising global yields make Japan fixed income returns attractive, but the currency a short in a global portfolio. We are long the Japanese yen and are tightening stops to protect profits. Report Links: The Dollar Conundrum And Protection - November 6, 2020 The Near-Term Bull Case For The Dollar - February 28, 2020 Building A Protector Currency Portfolio - February 7, 2020 British Pound Chart II-7GBP Technicals 1
GBP Technicals 1
GBP Technicals 1
Chart II-8GBP Technicals 2
GBP Technicals 2
GBP Technicals 2
Recent data in the UK have been mixed: The Markit Manufacturing PMI printed a final 57.5 for December. Mortgage approvals continue to inflect higher, with 105K submissions absorbed in November. UK services remain in recession. The Markit services PMI came in at 49.4 in December, from 49.9 last month. The British pound was flat this week. The Brexit imbroglio is now behind us, and the UK must now contend with the uncomfortable combination of rising Covid-19 cases and a new relationship with the EU. This has prevented the pound from fully celebrating an end to uncertainty. Our roadmap remains valuation, as we see the pound as cheap versus both the dollar and euro, hence our short EUR/GBP position. Report Links: The Dollar Conundrum And Protection - November 6, 2020 Revisiting Our High-Conviction Trades - September 11, 2020 Updating Our Balance Of Payments Monitor - November 29, 2019 Australian Dollar Chart II-9AUD Technicals 1
AUD Technicals 1
AUD Technicals 1
Chart II-10AUD Technicals 2
AUD Technicals 2
AUD Technicals 2
Recent data in Australia have been solid: Building approvals improved 2.6% month-on-month in November. The trade balance remains at a healthy surplus of A$5bn in November. While imports expanded 10% month-on-month, exports remained a healthy 3% over the October print. The Australian dollar appreciated by 1.2% against the US dollar this week. The AUD continues to benefit from favorable terms-of-trade, not only from high iron ore prices, but from the looming shortage of readily available liquefied natural gas (LNG) as Japan and Korea enter unusually cold weather. This is bullish the AUD. Report Links: An Update On The Australian Dollar - September 18, 2020 On AUD And CNY - January 17, 2020 Updating Our Balance Of Payments Monitor - November 29, 2019 New Zealand Dollar Chart II-11NZD Technicals 1
NZD Technicals 1
NZD Technicals 1
Chart II-12NZD Technicals 2
NZD Technicals 2
NZD Technicals 2
There was scant data out of New Zealand this week: CoreLogic house prices expanded by 11.1% year-on-year in December. The New Zealand dollar appreciated by 1.1% against the US dollar this week. The kiwi has been on fire in recent weeks, driven not only by the unwinding of expectations of negative rates by the RBNZ, but also by rising terms of trade as agricultural prices recover. We have been fading the kiwi rally, and were offside on our short NZD/CAD trade for a cumulative loss 1.8% loss this week. We are standing aside for now. Report Links: Currencies And The Value-Versus-Growth Debate - July 10, 2020 Updating Our Balance Of Payments Monitor - November 29, 2019 Place A Limit Sell On DXY At 100 - November 15, 2019 Canadian Dollar Chart II-13CAD Technicals 1
CAD Technicals 1
CAD Technicals 1
Chart II-14CAD Technicals 2
CAD Technicals 2
CAD Technicals 2
Recent data from Canada have held up: The Markit manufacturing PMI came in at 57.9 in December, an increase from the prior read of 55.8. The trade balance remains in a deficit of $C3.34bn for November, in line with the previous month. The Canadian dollar appreciated by 0.8% against the US dollar this week. There was good news on the oil front that boosted the loonie. Saudi Arabia agreed to absorb cuts of 1 million barrels a day, allowing a more fervent rebalancing of the oil market. This boosted petrocurrencies, including the loonie. Report Links: Currencies And The Value-Versus-Growth Debate - July 10, 2020 More On Competitive Devaluations, The CAD And The SEK - May 1, 2020 A New Paradigm For Petrocurrencies - April 10, 2020 Swiss Franc Chart II-15CHF Technicals 1
CHF Technicals 1
CHF Technicals 1
Chart II-16CHF Technicals 2
CHF Technicals 2
CHF Technicals 2
Recent data from Switzerland have been mixed: The manufacturing PMI came in at 58 in December, well above expectations of 54.3 and a prior reading of 55.2. Switzerland remains in deflation. Core CPI came in at -0.4% in December versus expectations of -0.2%. Headline CPI was even more negative at -0.8%. The Swiss franc depreciated by 0.4% against the US dollar this week. There is no doubt that the strong franc is exerting deflationary pressures into the Swiss economy. This is evident not only from tradeable prices, but also from domestic inflation. Encouragingly, the manufacturing sector is picking up, which is providing a valve for less intervention by the SNB. We are long EUR/CHF on grounds that the franc is too strong versus the euro. Report Links: The Dollar Conundrum And Protection - November 6, 2020 On The DXY Breakout, Euro, And Swiss Franc - February 21, 2020 Currency Market Signals From Gold, Equities And Flows - January 31, 2020 Norwegian Krone Chart II-17NOK Technicals 1
NOK Technicals 1
NOK Technicals 1
Chart II-18NOK Technicals 2
NOK Technicals 2
NOK Technicals 2
There was scant data out of Norway this week: The DNB/NIMA manufacturing PMI was flat at 51.9 in December. The Norwegian krone surged by 1.44% against the US dollar this week as the best performing G10 currency. Given the lack of economic data, the key narrative was the oil deal where the Saudis curtailed production. As our top pick for currency outperformance this year, this is much welcomed news. Stay long NOK versus both the USD and EUR. Report Links: Revisiting Our High-Conviction Trades - September 11, 2020 A New Paradigm For Petrocurrencies - April 10, 2020 Building A Protector Currency Portfolio - February 7, 2020 Swedish Krona Chart II-19SEK Technicals 1
SEK Technicals 1
SEK Technicals 1
Chart II-20SEK Technicals 2
SEK Technicals 2
SEK Technicals 2
Recent data from Sweden have been robust: The Swedbank/Silf manufacturing PMI surged from 59.1 to 64.9. The Swedish krona rose by 0.7% against the US dollar this week. Sweden is in a sweet spot, where low interest rates are emboldening risk taking and a robust global manufacturing cycle is keeping Swedish supply chains busy. With this virtuous cycle slated to continue, this would continue to be a boost for the krona. Report Links: Revisiting Our High-Conviction Trades - September 11, 2020 Updating Our Balance Of Payments Monitor - November 29, 2019 Where To Next For The US Dollar? - June 7, 2019 Trades & Forecasts Forecast Summary Core Portfolio Tactical Trades Limit Orders Closed Trades
Highlights Further fiscal easing is likely in the US now that the Democrats are set to take control of the US Senate following Tuesday’s runoff elections in Georgia. With the end of the pandemic in sight, a growing chorus of commentators, including none other than Larry Summers, are sounding the alarm over fears that fiscal policy could end up being too stimulative. In the short term, the risk that economies will overheat due to excessive fiscal support is low. There is still too much labor market slack, the bulk of any stimulus checks will be saved, and the short-run Phillips curve remains quite flat. Looking beyond the next two years, fiscal policy could indeed turn out to be inflationary. Political populism is rising. Central banks, fearful of the zero lower-bound constraint on interest rates, want higher inflation. Falling interest rates have also made it easier for governments to run larger budget deficits. We estimate that the US can run a primary budget deficit that is more than 2% of GDP larger than at the start of 2019, while still achieving a stable debt-to-GDP ratio. The “fiscal envelope” has increased significantly in other major economies as well. Ironically, in a world where interest rates are below the trend growth in GDP, a higher debt-to-GDP ratio permits larger budget deficits. Investors should remain overweight stocks relative to bonds over a cyclical 12-month horizon, favoring “value stocks” which will benefit more from steeper yield curves and the dismantling of lockdown measures. Financial markets will face a period of extreme turbulence in a couple of years once inflation begins to accelerate. A Race Against Time The past few weeks have seen a race between the virus, which continues to infect people at an alarming rate, and efforts to vaccinate the most vulnerable members of society. So far, the virus has the upper hand. Chart 1Tracking The Progress In Global Vaccination Rates
Fiscal Stimulus: How Much Is Too Much?
Fiscal Stimulus: How Much Is Too Much?
The “UK strain” has become more prevalent around the world.1 By some estimates it is 70% more contagious than the original virus that emerged in Wuhan, China. Another, potentially even more dangerous strain, has surfaced in South Africa and has spread to South America. The early evidence suggests that the recently approved vaccines will be effective in fighting the UK strain. Unfortunately, there is not enough data to judge whether this is also true for the South African strain. Right now, only 0.2% of the world’s population has been inoculated, but that number will rise rapidly over the coming months (Chart 1). Assuming that existing vaccines are effective against the myriad virus strains, the infection rate should fall precipitously by the middle of the year. Georgia Runoffs Will Lead To Even More Stimulus Governments eased fiscal policy significantly last year in response to the unfolding crisis (Chart 2). At the worst point of the pandemic in April, US real disposable income was up 14% year-over-year (Chart 3). Transfers to households fell sharply following the expiration of the CARES Act, but are set to rise again thanks to the recently completed stimulus deal. Chart 2Fiscal Policy In 2020: Governments Eased Significantly In Response To The Unfolding Crisis
Fiscal Stimulus: How Much Is Too Much?
Fiscal Stimulus: How Much Is Too Much?
The victory by both Democratic candidates in the Georgia Senate runoff races on Tuesday moves the political configuration in Washington even further towards fiscal easing. Having gained control of the Senate, the Democrats will now be able to use the “reconciliation process” to pass a budget that boosts spending on health care, education, infrastructure, and the environment. Granted, reconciliation requires that any extra spending be offset by additional revenue measures over a 10-year budgetary horizon. Thus, corporate taxes will probably rise. Nevertheless, the combination of more spending and higher corporate taxes will still produce a net boost to aggregate demand. This is partly because any revenue measures are likely to be backloaded. It is also because raising corporate taxes will not reduce investment by very much. The experience from the Trump tax cuts revealed that the main consequence of lowering corporate tax rates was to lower corporate tax receipts. The touted boost to corporate investment from lower taxes never materialized. In fact, outside of the energy sector – which benefited from an unrelated recovery in crude oil prices – US corporate capex grew more slowly between Q4 of 2016 and Q4 of 2019 than it did over the preceding three years (Chart 4). Chart 3Personal Income Jumped Early On In The Pandemic
Personal Income Jumped Early On In The Pandemic
Personal Income Jumped Early On In The Pandemic
Chart 4No Evidence That Trump Corporate Tax Cuts Boosted Investment
Fiscal Stimulus: How Much Is Too Much?
Fiscal Stimulus: How Much Is Too Much?
For stock market investors, the prospect of higher taxes will take some of the bloom off the rose from additional fiscal stimulus. That said, the impact will vary considerably across equity sectors. Cyclical stocks such as industrials and materials will benefit from stimulus-induced economic growth. Banks will also gain because stronger growth will suppress loan losses, while leading to steeper yield curves, thus raising net interest margins in the process. Value stocks have more exposure to banks and deep cyclicals, and hence we remain positive on them. Small caps also have more exposure to these sectors, but are starting to look increasingly pricey. Stimulus: How Much Is Enough? Chart 5Commercial Bankruptcies Are Well Contained
Fiscal Stimulus: How Much Is Too Much?
Fiscal Stimulus: How Much Is Too Much?
Fiscal stimulus helped avert the cascade of business failures that normally accompany recessions. Despite a tick up in bankruptcies among large companies shortly after the pandemic began, 16% fewer companies filed for bankruptcy in the first 11 months of 2020 compared to the same period in 2019 (Chart 5). Overall bankruptcy filings, which include personal bankruptcies, have fallen to a 35-year low according to Epiq AACER. The pipeline for bankruptcies also looks fairly narrow. Junk bond prices have been rebounding and consumer loan delinquency rates have been trending down (Table 1). Table 1Personal Loan Delinquencies Have Also Been Trending Lower
Fiscal Stimulus: How Much Is Too Much?
Fiscal Stimulus: How Much Is Too Much?
Generous fiscal transfers have allowed households to accumulate plenty of savings, which should help propel future spending. Chart 6 shows that accumulated US household savings are about $1.5 trillion above their pre-pandemic trend. We estimate that the combination of increased savings, rising home prices, and a surging stock market pushed up household net worth by $8 trillion in Q4 alone, leaving it 11% above Q4 2019 levels. In comparison, household net worth fell by over 15% during the Great Recession. Chart 6Households Have Accumulated Lots Of Savings, Which Should Help Propel Future Spending
Households Have Accumulated Lots Of Savings, Which Should Help Propel Future Spending
Households Have Accumulated Lots Of Savings, Which Should Help Propel Future Spending
Little Risk Of Near-Term Fiscal Overheat With the prospect of a vaccine-led economic recovery in sight, a growing chorus of commentators are sounding the alarm over fears that fiscal policy could end up being too stimulative. In an interview with Bloomberg Television, Larry Summers contended that President Trump’s attempt to increase the size of stimulus checks from $600 per person to $2000 was “a serious mistake” that risked overheating the economy. Summers argued for a more streamlined approach that prioritized aid to state and local governments and increased funding for Covid testing and vaccine deployment. Despite Larry’s admonition, we see little risk that loose fiscal policy will cause any major economy to overheat in the near term, even if the Senate does enact more stimulus. For one thing, recent stimulus proposals have emphasized direct transfers to households. Unlike most other types of spending, across-the-board stimulus checks will go mainly into savings. The New York Fed has estimated that less than 30% of the direct stimulus payments in the CARES Act were used for consumption, with 36% saved and 35% used to pay down debt. Consistent with past experience, households expect to spend only about one-third of the forthcoming stimulus checks according to CivicScience, a market research firm (Chart 7). Chart 7How Will Americans Spend Their Second Stimulus Check?
Fiscal Stimulus: How Much Is Too Much?
Fiscal Stimulus: How Much Is Too Much?
Chart 8Employment-To-Population Ratios Remain Well Below Pre-Pandemic Levels
Employment-To-Population Ratios Remain Well Below Pre-Pandemic Levels
Employment-To-Population Ratios Remain Well Below Pre-Pandemic Levels
Moreover, there is still plenty of labor market slack. Chart 8 shows the employment-to-population ratio for prime-aged workers remains well below pre-pandemic levels across the OECD. In a best-case scenario, it will take a couple more years for employment levels to return to normal. Long-term inflation expectations are also well anchored, implying that the short-run Phillips curve is quite flat. In simple English, this means that a temporary burst of stimulus is unlikely to trigger an inflationary price-wage spiral. Some decline in budget deficits is also likely after the pandemic ends. The Hutchins Center at Brookings expects the fiscal package passed by the US Congress in December to boost GDP by 7% in the first quarter. However, it expects the four-quarter moving average in the fiscal contribution to growth to turn negative in the third quarter, and stay that way right through 2022 (Chart 9). Likewise, in its most recent forecasts, the IMF projected a negative fiscal impulse in the major advanced economies in 2021-22 (Chart 10). Chart 9Budget Deficits Set To Decline, But Remain High By Historic Standards (Part I)
Fiscal Stimulus: How Much Is Too Much?
Fiscal Stimulus: How Much Is Too Much?
Chart 10Budget Deficits Set To Decline, But Remain High By Historic Standards (Part II)
Fiscal Stimulus: How Much Is Too Much?
Fiscal Stimulus: How Much Is Too Much?
Long-Term Fiscal Picture Is More Inflationary Granted, a negative fiscal impulse simply means that the structural budget deficit is declining over time. In absolute terms, the IMF expects budget deficits to remain quite large by historic standards, even if they do come down from their pandemic peak. Remember, it is the level of the budget deficit that helps determine the level of demand throughout the economy. Economies overheat when the level of aggregate demand exceeds the level of aggregate supply. If private-sector demand recovers more quickly than budget deficits come down, overall demand will rise. As such, it is certainly possible that excessively easy fiscal policy will contribute to an inflationary overshoot once labor market slack has been fully absorbed in two-to-three years. Politically, such an overshoot seems quite plausible. Populism is rising both on the left and the right. It is noteworthy that the Republican candidates in Tuesday’s runoff Senate races supported President Trump’s call for boosting the size of stimulus checks. The same goes for Senators Lindsey Graham of South Carolina and Marco Rubio of Florida. Rubio is widely considered an early front-runner for the 2024 Republican presidential nomination. Economically, the case for bigger budget deficits has also become more appealing. Real interest rates are negative across the major economies. Low interest rates allow governments to take on more debt without having to make large interest payments. Indeed, the Japanese government today receives more interest than it pays by virtue of the fact that more than half of its debt was issued at negative rates. Persistent worries about the zero lower-bound constraint also encourage central banks to pursue policies that could fuel inflation, such as refraining from tightening monetary policy in response to looser fiscal policy. The current level of policy rates gives central banks almost no scope to cut rates in response to an adverse economic shock. If inflation were to rise, central banks would be able to bring real rates even further into negative territory should economic conditions warrant it. The Paradox Of Debt Sustainability When r Is Less Than g One might think that today’s high debt-to-GDP ratios would force governments to slash deficits to keep debt from spiraling out of control. However, things are not so straightforward in a world of ultra-low interest rates. As Appendix A shows, the primary budget balance that is consistent with a stable debt-to-GDP ratio can be expressed as:
Fiscal Stimulus: How Much Is Too Much?
Fiscal Stimulus: How Much Is Too Much?
Where p is the primary budget balance (the difference between tax receipts and non-interest spending, expressed as a share of GDP), r is the real interest rate, and g is the growth rate of the economy. Notice that when r is less than g, a higher debt-to-GDP ratio corresponds to a larger primary budget deficit (i.e., a more negative p). In other words, by taking on more debt, governments would not only be able to raise spending or cut taxes, but they would also have enough money left over to pay the additional interest on the debt. And they could do all this without putting the debt-to-GDP ratio on an unsustainable upward trajectory. Chart 11More Space For Bigger Budget Deficits In The US...
More Space For Bigger Budget Deficits In The US...
More Space For Bigger Budget Deficits In The US...
What sort of funky magic allows this to happen? The answer is that even a small percentage increase in debt will correspond to a large increase in the absolute stock of debt when debt levels are elevated to begin with. If interest rates are low, most of the additional debt can go into financing a larger primary deficit instead of higher interest payments. One can see this point with a simple example. Suppose that initially, debt is 50, GDP is 100, and hence the debt-to-GDP ratio is 50%. Let us also assume that the primary deficit is 1% of GDP, the interest rate is 2%, and GDP grows at 4%. Next year, debt will be 50+50*0.02+1=52 while GDP will be 100*1.04=104. Hence, the debt-to-GDP ratio will remain 52/104=50%. Now rerun the same example but assume that debt is initially equal to 100, implying an initial debt-to-GDP ratio of 100%. In that case, it is simple to verify that the debt-to-GDP ratio would fall to 103/104≈99% the following year if the primary deficit remained at 1% of GDP. The primary deficit would have to rise to 2% of GDP to keep the debt-to-GDP stable – double what it was in the first example. The level of the US primary budget deficit that is consistent with a stable debt-to-GDP ratio has risen from 0.8% of GDP at the start of 2019 to 3.1% today if one uses the Congressional Budget Office’s estimate of trend growth and the 10-year TIPs yield as a proxy for the real interest rate (Chart 11). A similar trend is visible abroad (Chart 12). Chart 12... As Well As In Other Major Economies
Fiscal Stimulus: How Much Is Too Much?
Fiscal Stimulus: How Much Is Too Much?
Investment Conclusions Thanks to the drop in interest rates, governments today have more scope to run larger budget deficits than they did in the past. This suggests that the sort of fiscal tightening that impeded the recovery following the Great Recession is unlikely to reoccur. The combination of above-trend growth and continued low rates will buoy equities in 2021. Investors should remain overweight stocks relative to bonds over a cyclical 12-month horizon, favoring “value stocks” which will benefit both from steeper yield curves and the dismantling of lockdown measures. Financial markets will face a period of extreme turbulence in a couple of years as unemployment approaches pre-pandemic levels and central banks begin to contemplate raising interest rates. A higher debt burden allows for a larger budget deficit when r is less than g, but requires a bigger budget surplus when r rises above g. If debt-saddled governments are unable or unwilling to tighten fiscal policy, they may end up applying political pressure on central banks to keep rates artificially low in order to suppress interest payments. As such, excessively easy monetary policy could trigger a bout of inflation. With that in mind, investors should maintain below-benchmark duration exposure in fixed-income portfolios, favor inflation protected-securities over nominal bonds, and hold other inflation hedges such as gold and farmland. Cryptocurrencies could potentially serve as an inflation hedge, but given the recent run up in bitcoin prices, we would avoid this area of the market for the time being. Appendix AThe Arithmetic Of Debt Sustainability
Fiscal Stimulus: How Much Is Too Much?
Fiscal Stimulus: How Much Is Too Much?
Peter Berezin Chief Global Strategist peterb@bcaresearch.com Footnotes 1 A number of SARS-CoV-2 variants are circulating globally. The WHO reported this week that the UK variant of Covid-19 has spread to 40 other countries. Initial research suggests that the UK strain is more transmissible, but is characterized by unchanged disease severity compared to the original virus. The South African strain is also believed to be more contagious and was detected in six other countries. Some have raised concerns about the high number of mutations found in the South African variant. Research is ongoing to determine the potential consequences of the emerging variants on the speed of transmission, disease severity, ability to evade detection, and the efficacy of current treatments and vaccines. Please see Antony Sguazzin, “South Africa Virus Strain More Transmissible, Not More Severe,” Bloomberg, January 7, 2021; Gabriele Steinhauser, “The New Covid-19 Strain in South Africa: What We Know,” The Wall Street Journal, January 6, 2021; “Weekly epidemiological update - 5 January 2021,” World Health Organization; and “Emerging SARS-CoV-2 Variants,” Centers for Disease Control and Prevention, updated January 3, 2021. Global Investment Strategy View Matrix
Fiscal Stimulus: How Much Is Too Much?
Fiscal Stimulus: How Much Is Too Much?
Special Trade Recommendations
Fiscal Stimulus: How Much Is Too Much?
Fiscal Stimulus: How Much Is Too Much?
Current MacroQuant Model Scores
Fiscal Stimulus: How Much Is Too Much?
Fiscal Stimulus: How Much Is Too Much?
Highlights Markets largely ignored the uproar at the US Capitol on January 6 because the transfer of power was not in question. Democratic control over the Senate, after two upsets in the Georgia runoff, is the bigger signal. US fiscal policy will become more expansive yet the Federal Reserve will not start hiking rates anytime soon. This is a powerful tailwind for risk assets over the short and medium run. Politics and geopolitics affect markets through the policy setting, rather than through discrete events, which tend to have fleeting market impacts. The current setting, in the US and abroad, is negative for the US dollar. The implication is positive for emerging market stocks and value plays. Go long global stocks ex-US, long emerging markets over developed markets, and long value over growth. Cut losses on short CNY-USD. Feature Chart 1Market's Muted Response To US Turmoil
Market's Muted Response To US Turmoil
Market's Muted Response To US Turmoil
Scenes of mayhem unfolded in the US Capitol on January 6 as protesters and rioters flooded the building and temporarily interrupted the joint session of Congress convened to count the Electoral College votes. Congress reconvened later and finished the tally. President-elect Joe Biden will take office at noon on January 20. Financial markets were unperturbed, with stocks up and volatility down, though safe havens did perk up a bit (Chart 1). The incident supports our thesis that the US election cycle of 2020 was a sort of “Civil War Lite” and that the country is witnessing “Peak Polarization,” with polarization likely to fall over the coming five years. The incident was the culmination of the past year of pandemic-fueled unrest and President Trump’s refusal to concede to the Electoral College verdict. Trump made a show of force by rallying his supporters, and apparently refrained from cracking down on those that overran Congress, but then he backed down and promised an orderly transfer of power. The immediate political result was to isolate him. Fewer Republicans than expected contested the electoral votes in the ensuing joint session; one Republican is openly calling for Trump to be forced into resignation via the 25th amendment procedure for those unfit to serve. The electoral votes were promptly certified. Vice President Mike Pence and other actors performed their constitutional duties. Pence reportedly gave the order to bring out the National Guard to restore order – hence it is possible that Pence and Trump’s cabinet could activate the 25th amendment, but that is unlikely unless Trump foments rebellion going forward. Vandals and criminals will be prosecuted and there could also be legal ramifications for Trump and some government officials. Do Politics And Geopolitics Affect Markets? The market’s lack of concern raises the question of whether investors need trouble themselves with politics at all. Philosopher and market guru Nassim Nicholas Taleb tweeted the following: If someone, a year ago, described January 6, 2021 (and events attending it) & asked you to guess the stock market behavior, admit you would have gotten it wrong. Just so you understand that news do not help you understand markets.1 This is a valid point. Investors should not (and do not) invest based on the daily news. Of course, many observers foresaw social unrest surrounding the 2020 election, including Professor Peter Turchin.2 Social instability was rising in the data, as we have long shown. When you combined this likelihood with the Fed’s pause on rate hikes, and a measurable rise in geopolitical tensions between the US and other countries, the implication was that gold would appreciate. So if someone had told you a year ago that the US would have a pandemic, that governments would unleash a 10.2% of global GDP fiscal stimulus, that the Fed would start average inflation targeting, that a vaccine would be produced, and that the US would have a contested election on top of it all, would you have expected gold to rise? Absolutely – and it has done so, both in keeping with the fall in real interest rates plus some safe-haven bonus, which is observable (Chart 2). Chart 2Gold Price In Excess Of Fall In Real Rates Implies Geopolitical Risk
Gold Price In Excess Of Fall In Real Rates Implies Geopolitical Risk
Gold Price In Excess Of Fall In Real Rates Implies Geopolitical Risk
The takeaway is that policy matters for markets while politics may only matter briefly at best. Which brings us back to the implications of the Trump rebellion. What Will Be The Impact Of The Trump Rebellion? We have highlighted that this election was a controversial rather than contested election – meaning that the outcome was not in question after late November when the court cases, vote counts, and recounts were certified. This was doubly true after the Electoral College voted on December 14. The protests and riots yesterday never seriously called this result into question. Whatever Trump’s intentions, there was no military coup or imposition of martial law, as some observers feared. In fact the scandal arose from the President’s hesitation to call out the National Guard rather than his use of security forces to prevent the transfer of power, as occurs during a coup. This partially explains why the market traded on the contested election in December 2000 but not in 2020 – the result was largely settled. The Biden administration now has more political capital than otherwise, which is market-positive because it implies more proactive fiscal policy to support the economic recovery. Trump’s refusal to concede gave Democrats both seats in the Georgia Senate runoffs, yielding control of Congress. Household and business sentiment will revive with the vaccine distribution and economic recovery, while the passage of larger fiscal stimulus is highly probable. US fiscal policy will almost certainly avoid the mistake of tightening fiscal policy too soon. Taken with the Fed’s aversion to raising rates, greater fiscal stimulus will create a powerful tailwind for risk assets over the next 12 months. The primary consequence of combined fiscal and monetary dovishness is a falling dollar. The greenback is a counter-cyclical and momentum-driven currency that broadly responds inversely to global growth trends. But policy decisions are clearly legible in the global growth path and the dollar’s path over the past two decades. Japanese and European QE, Chinese devaluation, the global oil crash, Trump’s tax cuts, the US-China trade war, and COVID-19 lockdowns all drove the dollar to fresh highs – all policy decisions (Chart 3). Policy decisions also ensured the euro’s survival, marking the dollar’s bottom against the euro in 2011, and ensuring that the euro could take over from the dollar once the dollar became overbought. Today, the US’s stimulus response to COVID-19 – combined with the Fed’s strategic review and the Democratic sweep of government – marked the peak and continued drop-off in the dollar. Chart 3Euro Survival, US Peak Polarization, Set Stage For Rotation From USD To EUR
Euro Survival, US Peak Polarization, Set Stage For Rotation From USD To EUR
Euro Survival, US Peak Polarization, Set Stage For Rotation From USD To EUR
Chart 4China's Yuan Says Geopolitics Matters
China's Yuan Says Geopolitics Matters
China's Yuan Says Geopolitics Matters
The Chinese renminbi is heavily manipulated by the People’s Bank and is not freely exchangeable. The massive stimulus cycle that began in 2015, in reaction to financial turmoil, combined with the central bank’s decision to defend the currency marked a bottom in the yuan’s path. China’s draconian response to the pandemic this year, and massive stimulus, made China the only major country to contribute positively to global growth in 2020 and ensured a surge in the currency. The combination of US and Chinese policy decisions has clearly favored the renminbi more than would be the case from the general economic backdrop (Chart 4). Getting the policy setting right is necessary for investors. This is true even though discrete political events – including major political and geopolitical crises – have fleeting impacts on markets. What About Biden’s Trade Policy? Trump was never going to control monetary or fiscal policy – that was up to the Fed and Congress. His impact lay mostly in trade and foreign policy. Specifically his defeat reduces the risk of sweeping unilateral tariffs. It makes sense that global economic policy uncertainty has plummeted, especially relative to the United States (Chart 5). If US policy facilitates a global economic and trade recovery, then it also makes sense that global equities would rise faster than American equities, which benefited from the previous period of a strong dollar and erratic or aggressive US fiscal and trade policy. Trump’s last 14 days could see a few executive orders that rattle stocks. There is a very near-term downside risk to European and especially Chinese stocks from punitive measures, or to Emirati stocks in the event of another military exchange with Iran (Chart 6). But Trump will be disobeyed if he orders any highly disruptive actions, especially if they contravene national interests. Beyond Trump’s term we are constructive on all these bourses, though we expect politics and geopolitics to remain a headwind for Chinese equities. Chart 5Big Drop In Global Policy Uncertainty
Big Drop In Global Policy Uncertainty
Big Drop In Global Policy Uncertainty
US tensions with China will escalate again soon – and in a way that negatively impacts US and Chinese companies exposed to each other. Chart 6Geopolitical Implications Of Biden's Election
Geopolitical Implications Of Biden's Election
Geopolitical Implications Of Biden's Election
The cold war between these two is an unavoidable geopolitical trend as China threatens to surpass the US in economic size and improves its technological prowess. Presidents Xi and Trump were merely catalysts. But there are two policy trends that will override this rivalry for at least the first half of the year. First, global trade is recovering– as shown here by the Shanghai freight index and South Korean exports and equity prices (Chart 7). The global recovery will boost Korean stocks but geopolitical tensions will continue to brood over more expensive Taiwanese stocks due to the US-China conflict. This has motivated our longstanding long Korea / short Taiwan recommendation. Chart 7Global Economy Speaks Louder Than North Korea
Global Economy Speaks Louder Than North Korea
Global Economy Speaks Louder Than North Korea
Chart 8China Wary Of Over-Tightening Policy
China Wary Of Over-Tightening Policy
China Wary Of Over-Tightening Policy
Chart 9Global Stock-Bond Ratio Registers Good News
Global Stock-Bond Ratio Registers Good News
Global Stock-Bond Ratio Registers Good News
Second, China’s 2020 stimulus will have lingering effects and it is wary of over-tightening monetary and fiscal policy, lest it undo its domestic economic recovery. The tenor of China’s Central Economic Work Conference in December has reinforced this view. Chart 8 illustrates the expectations of our China Investment Strategy regarding China’s credit growth and local government bond issuance. They suggest that there will not be a sharp withdrawal of fiscal or quasi-fiscal support in 2021. Stability is especially important in the lead up to the critical leadership rotation in 2022.3 This policy backdrop will be positive for global/EM equities despite the political crackdown on General Secretary Xi Jinping’s opponents will occur despite this supportive policy backdrop. The global stock-to-bond ratio has surged in clear recognition of these positive policy trends (Chart 9). Government bonds were deeply overbought and it will take several years before central banks begin tightening policy. What About Biden’s Foreign Policy? Chart 10OPEC 2.0 Cartel Continues (For Now)
Accommodative US Monetary Policy, Tighter Commodity Markets Will Stoke Inflation OPEC 2.0 Cartel Continues (For Now)
Accommodative US Monetary Policy, Tighter Commodity Markets Will Stoke Inflation OPEC 2.0 Cartel Continues (For Now)
Iran poses a genuine geopolitical risk this year – first in the form of an oil supply risk, should conflict emerge in the Persian Gulf, Iraq, or elsewhere in the region. This would inject a risk premium into the oil price. Later the risk is the opposite as a deal with the Biden administration would create the prospect for Iran to attract foreign investment and begin pumping oil, while putting pressure on the OPEC 2.0 coalition to abandon its current, tentative, production discipline in pursuit of market share (Chart 10). Biden has the executive authority to restore the 2015 nuclear deal (Joint Comprehensive Plan of Action). He is in favor of doing so in order to (1) prevent the Middle East from generating a crisis that consumes his foreign policy; (2) execute an American grand strategy of reviving its Asia Pacific influence; (3) cement the Obama administration’s legacy. The Iranian President Hassan Rouhani also has a clear interest in returning to the deal before the country’s presidential election in June. This would salvage his legacy and support his “reformist” faction. The Supreme Leader also has a chance to pin the negative aspects of the deal on a lame duck president while benefiting from it economically as he prepares for his all-important succession. The problem is that extreme levels of distrust will require some brinkmanship early in Biden’s term. Iran is building up leverage ahead of negotiations, which will mean higher levels of uranium enrichment and demonstrating the range of its regional capabilities, including the Strait of Hormuz, and its ability to impose economic pain via oil prices. Biden will need to establish a credible threat if Iran misbehaves. Hence the geopolitical setting is positive for oil prices at the moment. Beyond Iran, there is a clear basis for policy uncertainty to decline for Europe and the UK while it remains elevated for China and Russia (Chart 11). Chart 11Relative Policy Uncertainty Favors Europe and UK Over Russia And China
Relative Policy Uncertainty Favors Europe and UK Over Russia And China
Relative Policy Uncertainty Favors Europe and UK Over Russia And China
The US international image has suffered from the Trump era and the Biden administration’s main priorities will lie in solidifying alliances and partnerships and stabilizing the US role in the world, rather than pursuing showdown and confrontation. However, it will not be long before scrutiny returns to the authoritarian states, which have been able to focus on domestic recovery and expanding their spheres of influence amid the US’s tumultuous election year. Chart 12GeoRisk Indicators Say Risks Underrated For These Bourses
GeoRisk Indicators Say Risks Underrated For These Bourses
GeoRisk Indicators Say Risks Underrated For These Bourses
The US will not seek a “diplomatic reset” with Russia, aside from renegotiating the New START treaty. The Democrats will seek to retaliate for Russia’s extensive cyberattack in 2021 as well as for election interference and psychological warfare in the United States. And while there probably will be a reset with China, it will be short-lived, as outlined above. This situation contrasts with that of the Atlantic sphere. The Biden administration is a crystal clear positive, relative to a second Trump term, for the European Union. The EU and the UK have just agreed to a trade deal, as expected, to conclude the Brexit process, which means that the US-UK “special relationship” will not be marred by disagreements over Ireland. European solidarity has also strengthened as a result of the pandemic, which highlighted the need for collective policy responses, including fiscal. Thus the geopolitical risks of the new administration are most relevant for China/Taiwan and Russia. Comparing our GeoRisk Indicators, which are market-based, with the relative equity performance of these bourses, Taiwanese stocks are the most vulnerable because markets are increasingly pricing the geopolitical risk yet the relative stock performance is toppy (Chart 12). The limited recovery in Russian equities is also at risk for the same reason. Only in China’s case has the market priced lower geopolitical risk, not least because of the positive change in US administration. We expect Biden and Xi Jinping to be friendly at first but for strategic distrust to reemerge by the second half of the year. This will be a rude awakening for Chinese stocks – or China-exposed US stocks, especially in the tech sector. Investment Takeaways Chart 13Global Policy Shifts Drive Big Investment Reversals
Global Policy Shifts Drive Big Investment Reversals
Global Policy Shifts Drive Big Investment Reversals
The US is politically divided. Civil unrest and aftershocks of the controversial election will persist but markets will ignore it unless it has a systemic impact. The policy consequence is a more proactive fiscal policy, resulting in virtual fiscal-monetary coordination that is positive both for global demand and risk assets, while negative for the US dollar. The Biden administration will succeed in partially repealing the Trump tax cuts, but the impact on corporate profit margins will be discounted fairly mechanically and quickly by market participants, while the impact on economic growth will be more than offset by huge new spending. Sentiment will improve after the pandemic – and Biden has not yet shown an inclination to take an anti-business tone. The past decade has been marked by a dollar bull market and the outperformance of developed markets over emerging markets and growth stocks like technology over value stocks like financials. Cyclical sectors have traded in a range. Going forward, a secular rise in geopolitical Great Power competition is likely to persist but the macro backdrop has shifted with the decline of the dollar. Cyclical sectors are now poised to outperform while a bottom is forming in value stocks and emerging markets (Chart 13). We recommend investors go strategically long emerging markets relative to developed. We are also going long global value over growth stocks. We are not yet ready to close our gold trade given that the two supports, populist fiscal turn and great power struggle, will continue to be priced by markets in the near term. We are throwing in the towel on our short CNY-USD trade after the latest upleg in the renminbi, though our view continues to be that geopolitical fundamentals will catch yuan investors by surprise when they reassert themselves. We also recommend preferring global equities to US equities, given the above-mentioned global trends plus looming tax hikes. Matt Gertken Vice President Geopolitical Strategy mattg@bcaresearch.com Footnotes 1 January 6, 2020, twitter.com. 2 See Turchin and Andrey Korotayev, "The 2010 Structural-Demographic Forecast for the 2010-2020 Decade: A Retrospective Assessment," PLoS ONE 15:8 (2020), journals.plos.org. 3 Not to mention that 2021 is the Communist Party’s 100th anniversary – not a time to make an unforced policy error with an already wobbly economy.
According to BCA Research’s new US Political Strategy service, investors should go long risk assets and reflation plays on a 12-month basis. We recommend value over growth stocks, materials over tech, TIPS over nominal treasuries, infrastructure plays, and…
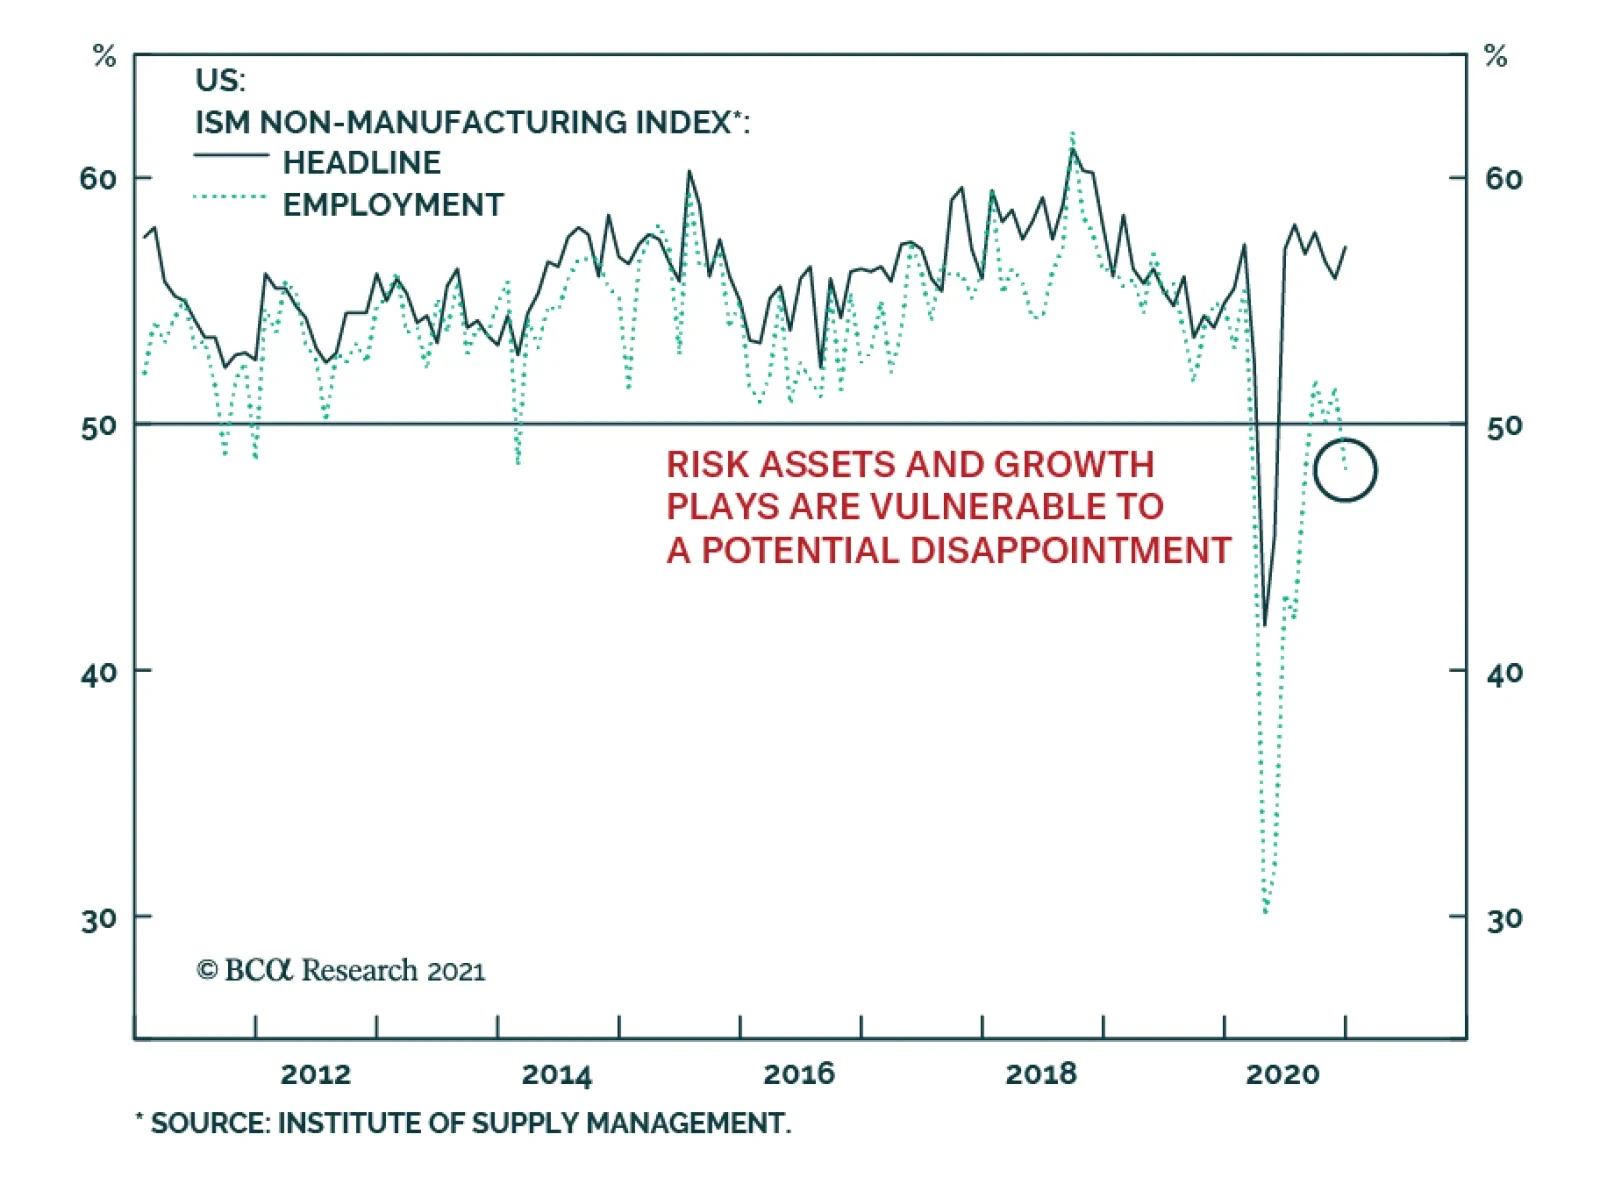
The December ISM Services Index points to an acceleration in the US service sector’s recovery, with the headline index rising 1.3 percentage points to 57.2 and beating expectations of 54.5. The headline index was supported by an acceleration in Business…
The Democrats look set to take control of the US senate by the slimmest margin possible. The odds of more reflationary policies have increased, even if corporate taxes are set to rise as well. The increase in taxes is a problem for Wall Street but is…
Dear Client, I am writing as the US Capitol goes under lockdown to tell you about a new development at BCA Research. Since you are a subscriber of Geopolitical Strategy, we wanted you to be the first to know. This month we are launching a new sister service, US Political Strategy, which will expand and deepen our coverage of investment-relevant US domestic political risks and opportunities. Over the past decade, we at Geopolitical Strategy have worked hard to craft an analytical framework that incorporates policy insights into the investment process in a systematic and data-dependent way. We have learned a lot from your input and have refined our method, while also building new quantitative models and indicators to supplement our qualitative, theme-based coverage. While our method served us well in 2020, the frantic US election cycle often caused clients to lament that US politics had begun to crowd out our traditional focus on truly global themes and trends. We concurred. Therefore we have decided to expand our team and deepen our coverage. With a series of new hires, we are now better positioned to provide greater depth on US markets in US Political Strategy while redoubling our traditional global sweep in the pages of Geopolitical Strategy. Going forward, US Political Strategy will cover executive orders, Capitol Hill, federal agencies, regulatory risk, the Supreme Court, emerging socioeconomic trends, and their impacts on key US sectors and assets. It will be BCA Research’s newest premium investment strategy service and will include the full gamut of weekly reports, special reports, webcasts, and client conferences. Meanwhile Geopolitical Strategy will return to its core competency of geopolitics writ large – including the US in its global impacts, but diving deeper into the politics and markets of China, Europe, India, Japan, Russia, the Middle East, and select emerging markets. Both strategies will utilize our proprietary analytical framework, which relies on data-driven assessments of the “checks and balances” that shape policy outcomes (i.e. comparing constraints versus preferences). As you know best, we are agnostic about political parties, transparent about conviction levels and scenario probabilities, and solely focused on getting the market calls right. To this end, we offer you a complimentary trial subscription of US Political Strategy. We aim to become an integral part of your work flow – separating the wheat from the chaff in the political and geopolitical sphere so that you can focus on honing your investment process. We know you will be pleased to see Geopolitical Strategy return to its roots – and we hope you will consider diving deeper with us into US politics and markets. We look forward to hearing from you. Happy New Year! All very best, Matt Gertken, Vice President BCA Research The outgoing Trump administration is powerless to stop the presidential transition and the US military and security forces will not participate in any “coup.” Investors should buy the dip if social instability affects the markets between now and President-elect Joe Biden’s Inauguration Day. Democrats have achieved a sweep of US government with two victories in Georgia’s Senate election. The Biden administration is no longer destined for paralysis. Investors no longer need fear a premature tightening of US fiscal policy. Fiscal thrust will expand by around 6.9% of GDP more than it otherwise would have in FY2021 and contract by 12.3% of GDP in FY2022. Democrats will partly repeal the Trump tax cuts to pay for new spending programs, including an expansion and entrenchment of Obamacare. Big Tech is the most exposed to the combination of higher corporate taxes and inflation expectations. Investors should go long risk assets and reflation plays on a 12-month basis. We recommend value over growth stocks, materials over tech, TIPS over nominal treasuries, infrastructure plays, and municipal bonds. The special US Senate elections in Georgia produced a two-seat victory for Democrats on January 5 and have thus given the Democratic Party de facto control of the Senate.Financial markets have awaited this election with bated breath. The “reflation trade” – bets on economic recovery on the back of ultra-dovish monetary and fiscal policy – had taken a pause for the election. There was a slight setback in treasury yields and the outperformance of cyclical, small cap, and value stocks, which rallied sharply after the November 3 general election (Chart 1). The Democratic victory ensures that US corporate and individual taxes will go up – triggering a one-off drop in earnings per share of about 11%, according to our US Equity Strategist Anastasios Avgeriou (Table 1). But it also brings more proactive fiscal policy. Since the Democrats project larger new spending programs financed by tax hikes, the big takeaway is that the US economic recovery will gain momentum and will not be undermined by premature fiscal tightening. Chart 1Markets Will Look Through Unrest To Reflation
Buy Reflation Plays On Georgia’s Blue Sweep
Buy Reflation Plays On Georgia’s Blue Sweep
Table 1What EPS Hit To Expect?
Buy Reflation Plays On Georgia’s Blue Sweep
Buy Reflation Plays On Georgia’s Blue Sweep
Chart 2Democrats Won Georgia Seats, US Senate
Buy Reflation Plays On Georgia’s Blue Sweep
Buy Reflation Plays On Georgia’s Blue Sweep
Republicans Snatch Defeat From Jaws Of Victory The results of the Georgia runoffs, at the latest count, are shown in Chart 2. Republican Senator David Perdue has not yet officially lost the race, as votes are still being tallied, but he trails his Democratic challenger Jon Ossoff by 16,370 votes. This is a gap that is unlikely to be changed by subsequent vote disputes or recounts (though it is possible and the results are not yet declared as we go to press). President-elect Joe Biden only lost 1,274 votes to President Trump when ballots were recounted by hand in November. The Democratic victory offers some slight consolation for opinion pollsters who underestimated Republicans in the general election in certain states. Opinion polls had shown a dead heat in both of Georgia’s races, with Republican Senators Perdue and Kelly Loeffler deviating by 1.4% and 0.4% respectively from their support rate in the average of polls in December. Democratic challengers Jon Ossoff and Raphael Warnock differed by 1.3% and 2.3% from their final polling (Charts 3A & 3B). Chart 3AOpinion Pollsters Did Better …
Buy Reflation Plays On Georgia’s Blue Sweep
Buy Reflation Plays On Georgia’s Blue Sweep
Chart 3B… In Georgia Runoffs
Buy Reflation Plays On Georgia’s Blue Sweep
Buy Reflation Plays On Georgia’s Blue Sweep
By comparison, in the November 3 general election, polls underestimated Perdue by 1.3% and overestimated Warnock by 5.3% (Chart 4). On the whole, the election shows that state-level opinion polling can improve to address new challenges. Our quantitative Senate election model had given Republicans a 78% chance of winning Georgia. This they did in the first round of the election, but conditions have changed since November 3, namely due to President Trump’s refusal to concede the election after the Electoral College voted on December 14.1 Our model is based on structural factors so it did not distinguish between the two Senate candidates in the same state. For the whole election, the model predicted that Democrats would win a net of three seats, resulting in a Republican majority of 51-49. Today we see that the model only missed two states: Maine and Georgia. But Georgia has made all the difference, with the result to be 50-50, for Vice President Kamala Harris to break the tie (Chart 5). Chart 4Ossoff In Line With Polls, Warnock Slightly Beat
Buy Reflation Plays On Georgia’s Blue Sweep
Buy Reflation Plays On Georgia’s Blue Sweep
Chart 5Our Quant Model Missed Maine And Georgia – And Georgia Carries Two Seats To Turn The Senate
Buy Reflation Plays On Georgia’s Blue Sweep
Buy Reflation Plays On Georgia’s Blue Sweep
COVID-19 likely took a further toll on Republican support in the interim between the two election rounds. The third wave of the COVID-19 pandemic has not peaked in the US or the Peach State. While the number of cases has spiked in Georgia as elsewhere, the number of deaths has not yet followed (Chart 6). Chart 6COVID-19 Surged Since November
Buy Reflation Plays On Georgia’s Blue Sweep
Buy Reflation Plays On Georgia’s Blue Sweep
Lame Duck Trump Risk Before proceeding to the policy impacts of the apparent Democratic sweep of both executive and legislative branches, a word must be said about the presidential transition and President Trump’s final 14 days in office. First, the Joint Session of Congress to count the Electoral College ballots to certify the election of the new US president has been interrupted as we go to press. There is zero chance that protesters storming the proceedings will change the outcome of the election. The counting of the electoral votes can be interrupted for debate; it will be reconvened. Disputes over the vote could theoretically become meaningful if Republicans controlled both the House and the Senate, as the combined voice of the legislature could challenge the legitimacy of a state’s electoral votes. But today the Republicans only control the Senate, and while some will press isolated challenges, based on legal disputes of variable merit, these challenges will not gain traction in the Senate let alone in the Democratic-controlled House. What did the US learn from this controversial election? US political polarization is reaching extreme peaks which are putting strain on the formal political system, but Trump lacks the strength in key government bodies to overturn the election. Second, there was no willingness of state legislatures to challenge their state executives on the vote results. This has to do with the evidence upon which challenges could be lodged, but there is also a built-in constraint. Any state legislature whose ruling party opposes the popular result will by definition put its own popular support in jeopardy in the next election. Third, the Supreme Court largely washed its hands of state-level disputes settled by state-level courts. Historically, the Supreme Court never played a role in presidential elections. The year 2000 was an exception, as the high court said at the time. The 2020 election has established a high bar for any future Supreme Court involvement, though someday it will likely be called on to weigh in. Hysteria regarding the conservative leaning on the court – which is now a three-seat gap – was misplaced. The three Supreme Court justices appointed by Trump took no partisan or interventionist role. Nevertheless, the court’s conservative leaning will be one of the Trump administration’s biggest legacies. The marginal judge in controversial cases is now more conservative and will take a larger role given that Democrats now have a greater ability to pass legislation by taking the Senate. President Trump is still in office for 14 days. There is zero chance of a successful military coup or anything of the sort in a republic in which institutions are strong and the military swears allegiance to the constitution. Attempts to oppose the Electoral College and Congress will be opposed – and ultimately they will be met with an overwhelming reassertion of the rule of law. All ten of the surviving secretaries of defense of the United States have signed an open letter saying that the election results should no longer be resisted and that any defense officials who try to involve the military in settling electoral disputes could be criminally liable.2 With Trump’s options for contesting the election foreclosed, he will turn to signing a flurry of executive orders to cement his legacy. His primary legacy is the US confrontation with China, so he will continue to impose sanctions on China on the way out, posing a tactical risk to equity prices. The business community will be slow to comply, however, so the next administration will set China policy. There is a small possibility that Trump will order economic or even military action against Iran or any other state that provokes the United States. But Trump is opposed to foreign wars and the bureaucracy would obstruct any major actions that do not conform with national interests. Basically, Trump’s final 14 days may pose a downside risk to equities that have rallied sharply since the November 9 vaccine announcement but we are long equities and reflation plays. Sweeps Just As Good For Stocks As Gridlock The balance of power in Congress is shown in Chart 7. The majorities are extremely thin, which means that although Democrats now have control, there will remain high uncertainty over the passage of legislation, at least until the 2022 midterm elections. Investors can now draw three solid conclusions about the makeup of US government from the 2020 election: The White House’s political capital has substantially improved – President-elect Joe Biden no longer faces a divided Congress. He won by a 4.5% popular margin (51.4% of the total), bringing the popular and electoral vote back into alignment. He will have a higher net approval rating than Trump in general, and household sentiment, business sentiment, and economic conditions will improve from depressed, pandemic-stricken levels over the course of his term. The Senate is evenly split but Democrats will pass some major legislation – Thin margins in the Senate make it hard to pass legislation in general. However, the budget reconciliation process enables laws to pass with a simple majority if they involve fiscal matters. Hence, Democrats will be able to legislate additional COVID relief and social support that they were not able to pass in the end-of-year budget bill. They can pass a reconciliation bill for fiscal 2022 as well. They will focus on economic recovery followed by expanding and entrenching the Affordable Care Act (Obamacare). We fully expect a partial repeal of Trump’s Tax Cut and Jobs Act, if not initially then later in the year. Democrats only have a five-seat majority in the House of Representatives – Democrats will vote with their party and thus 222 seats is enough to maintain a working majority. But the most radical parts of the agenda, such as the Green New Deal, will be hard to pass. Chart 7Democrats Control Both Houses
Buy Reflation Plays On Georgia’s Blue Sweep
Buy Reflation Plays On Georgia’s Blue Sweep
With the thinnest possible margin, the Senate has a highly unreliable balance of power. Table 2 shows top three Republicans and Democrats in terms of age, centrist ideology, and independent mentality. Four senators are above the age of 85 – they can vote freely and could also retire or pass away. Centrist and maverick senators will carry enormous weight as they will provide the decisive votes. The obvious example is Senator Joe Manchin of West Virginia, who has opposed the far-left wing of his party on critical issues such as the Green New Deal, defunding the police, and the filibuster. Table 2The Senate Will Hinge On These Senators
Buy Reflation Plays On Georgia’s Blue Sweep
Buy Reflation Plays On Georgia’s Blue Sweep
The Democrats could conceivably muster the 51 votes to eliminate the filibuster, which requires a 60-vote majority to pass most legislation, but it will be very difficult. Senators Dianne Feinstein (D, CA), Angus King (I, ME), Kyrsten Sinema (D, AZ), Jon Tester (D, MT), and Manchin are all skeptical of revoking this critical hurdle to Senate legislation.3 We would not rule it out, however. The US has reached a point of “peak polarization” in which surprises should be expected. By the same token, Republican Senators Lisa Murkowski and Susan Collins often vote against their party. Collins just won yet another tough race in Maine due to her ability to bridge the partisan gap. There are also mavericks like Rand Paul – and Ted Cruz will have to rethink his populist strategy given his thin margins of victory and the Trump-induced Republican defeat in the South. Not shown are other moderates who will be eager to cross the political aisle, such as Senator Mitt Romney of Utah. None of the above means Democrats will fail to raise taxes. All Democrats voted against Trump’s Tax Cut and Jobs Act, which did not end up being popular or politically beneficial for the Republicans. The Democratic base is fired up and mobilized by Trump to pursue its core agenda of increasing the government role in US society and the economy and redressing various imbalances and disparities. This requires revenue, especially if it is to be done with only 51 votes via the budget reconciliation process. The two Democratic senators from Arizona are vulnerable, but they will toe the party line because Trump and the GOP were out of step with the median voter. Moreover, Arizonians voted for higher taxes in a state ballot measure in November. Since 1980, gridlocked government has resulted in higher average annual returns on the S&P500. But since 1949, single-party sweeps have slightly edged out gridlocked governments in stock returns, though the results are about the same (Chart 8). The point is that gridlock makes it hard for government to get big things done. Sometimes that is positive for markets, sometimes not. The macro backdrop is what matters. The Federal Reserve is unlikely to start tightening until late 2022 at earliest and fiscal thrust in 2021-22 will be more expansionary now that the Democrats have control of the Senate. This policy backdrop is negative for the dollar and positive for risk assets, especially equity sectors that will suffer least from impending corporate tax hikes, such as energy, industrials, consumer staples, materials, and financials. Chart 8Sweeps Don’t Always Underperform Gridlock
Buy Reflation Plays On Georgia’s Blue Sweep
Buy Reflation Plays On Georgia’s Blue Sweep
Meanwhile, Biden will have far less trouble getting his cabinet and judicial appointments through the Senate (Appendix). His appointees so far reflect his desire to return the US to “rule by experts,” as opposed to Trump’s disruptive style of personal rule. Investors will cheer the return to technocrats and predictable policymaking even if they later relearn that experts make gigantic mistakes too. Fiscal Policy Outlook The critical feature of the Trump administration was the COVID-19 pandemic, which sent the US budget deficit soaring to World War II levels relative to GDP. In the coming years, the change in the budget deficit (fiscal thrust) will necessarily be negative, dragging on growth rates (Chart 9). Fiscal policy determines how heavy and abrupt that drag will be. Chart 9US Budget Deficit Surged – Pace Of Normalization Matters
Buy Reflation Plays On Georgia’s Blue Sweep
Buy Reflation Plays On Georgia’s Blue Sweep
Chart 10 presents four scenarios that we adjusted based on data from the Congressional Budget Office. The baseline would see an extraordinary 6.7% of GDP contraction in the budget deficit that would kill the recovery, which the Georgia outcome has now rendered irrelevant. The “Republican Status Quo” scenario is now the minimum. Chart 10Democratic Sweep Suggests Big Fiscal Thrust In FY2021 And Less Contraction FY2022
Buy Reflation Plays On Georgia’s Blue Sweep
Buy Reflation Plays On Georgia’s Blue Sweep
The “Democratic Status Quo” scenario assumes that the $600 per household rebate will be increased to $2,000 per family and that the remaining $2.5 trillion of the Democrats’ proposed HEROES Act will be enacted. The “Democratic High” scenario adds Biden’s $5.6 trillion policy agenda on top of the Democratic status quo, supercharging the economic recovery with a fiscal bonanza. Biden will not achieve all of this, so the reality will lie somewhere between the solid blue and dotted blue lines. This Democratic status quo implies a 6.9% of GDP expansion of the deficit in FY2021. It also implies that the deficit will contract by 12.3% of GDP in FY2022, instead of 13.5% in the Republican status quo scenario. The economic recovery will be better supported. So, too, will the Fed’s timeline for rate hikes – but the Fed’s new strategy of average inflation targeting shows that it is targeting an inflation overshoot. So the threat of Fed liftoff is not immediate. The longer the extraordinary fiscal largesse is maintained, the greater the impact on inflation expectations and the more upward pressure on bond yields (Chart 11). Big Tech will be the one to suffer while Big Banks, industrials, materials, and energy will benefit. Chart 11Bond Bearish Blue Sweep
Buy Reflation Plays On Georgia’s Blue Sweep
Buy Reflation Plays On Georgia’s Blue Sweep
Our US Political Risk Matrix There is no correlation between fiscal thrust and equity returns. This is true whether we consider the broad market, cyclicals/defensives, value/growth stocks, or small/large caps (Chart 12). Normally, fiscal thrust surges when recessions and bear markets occur, leading to volatility in asset prices. However, in the new monetary policy context, the risk is to the upside for the above-mentioned sectors, styles, and segments. Looking at sector performance before and after the November 3 election and November 9 vaccine announcement, there has been a clear shift from pandemic losers to pandemic winners. Big Tech and Consumer Discretionary (Amazon) thrived during the period before the vaccine, while value stocks (industrials, energy, financials) suffered the most from the lockdowns. These trends have reversed, with energy and financials outperforming the market since November (Chart 13). The Biden administration poses regulatory risks for Big Oil and arguably Big Banks, but these will come into play after the market has priced in economic normalization and the emerging consensus in favor of monetary-fiscal policy coordination, which is very positive for these sectors. Chart 12Fiscal Thrust Not Correlated With Stocks
Buy Reflation Plays On Georgia’s Blue Sweep
Buy Reflation Plays On Georgia’s Blue Sweep
Chart 13Energy And Financials Turned Around With Vaccine
Buy Reflation Plays On Georgia’s Blue Sweep
Buy Reflation Plays On Georgia’s Blue Sweep
In the case of energy, as stated above, the Biden administration will still struggle to get anything resembling the Green New Deal approved in Congress. Nevertheless, environmental regulation will expand and piecemeal measures to promote research and development, renewables, electric vehicles, and other green initiatives may pass. Large cap energy firms are capable of adjusting to this kind of transition. Coal companies are obviously losers. In the case of financials, Biden’s record is not unfriendly to the financial industry. His nominee for Treasury Secretary, former Fed Chair Janet Yellen, approved of the relaxation of some of its more stringent financial regulations under the Trump administration. Big Banks are no longer the target of popular animus like they were after the 2008 financial crisis – in that regard they have given way to Big Tech. Our US Investment Strategist Doug Peta argues that the Democratic sweep will smother any gathering momentum in personal loan defaults, which would help banks outperform the broad market. Biden’s regulatory approach to Big Tech will be measured, as the Obama administration’s alliance with Silicon Valley persists, but tech stands to suffer the most from higher taxes, especially a minimum corporate tax rate. With a unified Congress, it is also now possible that new legislation could expand tech regulation. There is a bipartisan consensus emerging on tech regulation so Republican votes can be garnered. Tech thrives on growth-scarce, disinflationary environments whereas the latest developments are positive for inflation expectations. In the recent lead-up to the Georgia vote, industrials, financials, and consumer discretionary stocks have not benefited much, even though they should (Chart 14). These are investment opportunities. Chart 14Upside For Energy And Financials Despite Regulatory Risk
Buy Reflation Plays On Georgia’s Blue Sweep
Buy Reflation Plays On Georgia’s Blue Sweep
In our Political Risk Matrix, we establish these views as our baseline political tilts, to be applied to the BCA Research House View of our US Equity Strategy. The results are shown in Table 3. When equity sectors become technically stretched, the political impacts will become more salient. Table 3US Political Risk Matrix
Buy Reflation Plays On Georgia’s Blue Sweep
Buy Reflation Plays On Georgia’s Blue Sweep
Investment Takeaways Over the past few years our sister Geopolitical Strategy has written extensively about “Civil War Lite,” “Peak Polarization,” and contested elections in the United States. We will dive deeper into these themes and issues in forthcoming reports, but for now suffice it to say that extremist events will galvanize the majority of the nation behind the new administration while also driving politicians of both stripes to use pork-barrel spending to try to stabilize the country. Congress will err on the side of providing too much fiscal stimulus just as surely as the Fed is bent on erring on the side of providing too much monetary stimulus. That means reflation, which will ultimately boost stocks in 2021. We also expect stocks to outperform government bonds, at least on a tactical 3-6 month timeframe. As the above makes clear, we prefer value stocks over growth stocks. Specifically we favor cyclical plays like materials over the big five of Google, Apple, Amazon, Microsoft, and Facebook. An infrastructure bill was one of the few legislative options for the Biden administration under gridlock, now it is even more likely. Infrastructure is popular and both presidential candidates competed to see who could offer the bigger plan. Moreover, what Biden cannot achieve under the rubric of climate policy he can try to achieve under the rubric of infrastructure. The BCA US Infrastructure Basket correlates with the US budget deficit as well as growth in China/EM and we recommend investors pursue similar plays. In the fixed income space, Treasury inflation protected securities (TIPS) are likely to continue outperforming nominal, duration-matched government bonds. Our US Bond Strategist Ryan Swift is on alert to downgrade this recommendation, but the change in US government configuration at least motivates a tactical overweight in TIPS. The chances of US state and local governments receiving fiscal support – previously denied by the GOP Senate – has increased so we will also go long municipal bonds relative to treasuries. Matt Gertken Vice President US Political Strategy mattg@bcaresearch.com Appendix Table A1Biden’s Cabinet Position Appointments
Buy Reflation Plays On Georgia’s Blue Sweep
Buy Reflation Plays On Georgia’s Blue Sweep
Footnotes 1 Perdue defeated Ossoff on November 3 but fell short of the 50% threshold to avoid a second round; meanwhile the cumulative Republican vote in the multi-candidate special election outnumbered the cumulative Democratic vote on November 3. 2 Ashton Carter, Dick Cheney, William Cohen, et al, “All 10 living former defense secretaries: Involving the military in election disputes would cross into dangerous territory,” Washington Post, January 3, 2021, washingtonpost.com. 3 Jordain Carney, “Filibuster fight looms if Democrats retake Senate,” The Hill, August 25, 2020, thehill.com.