United States
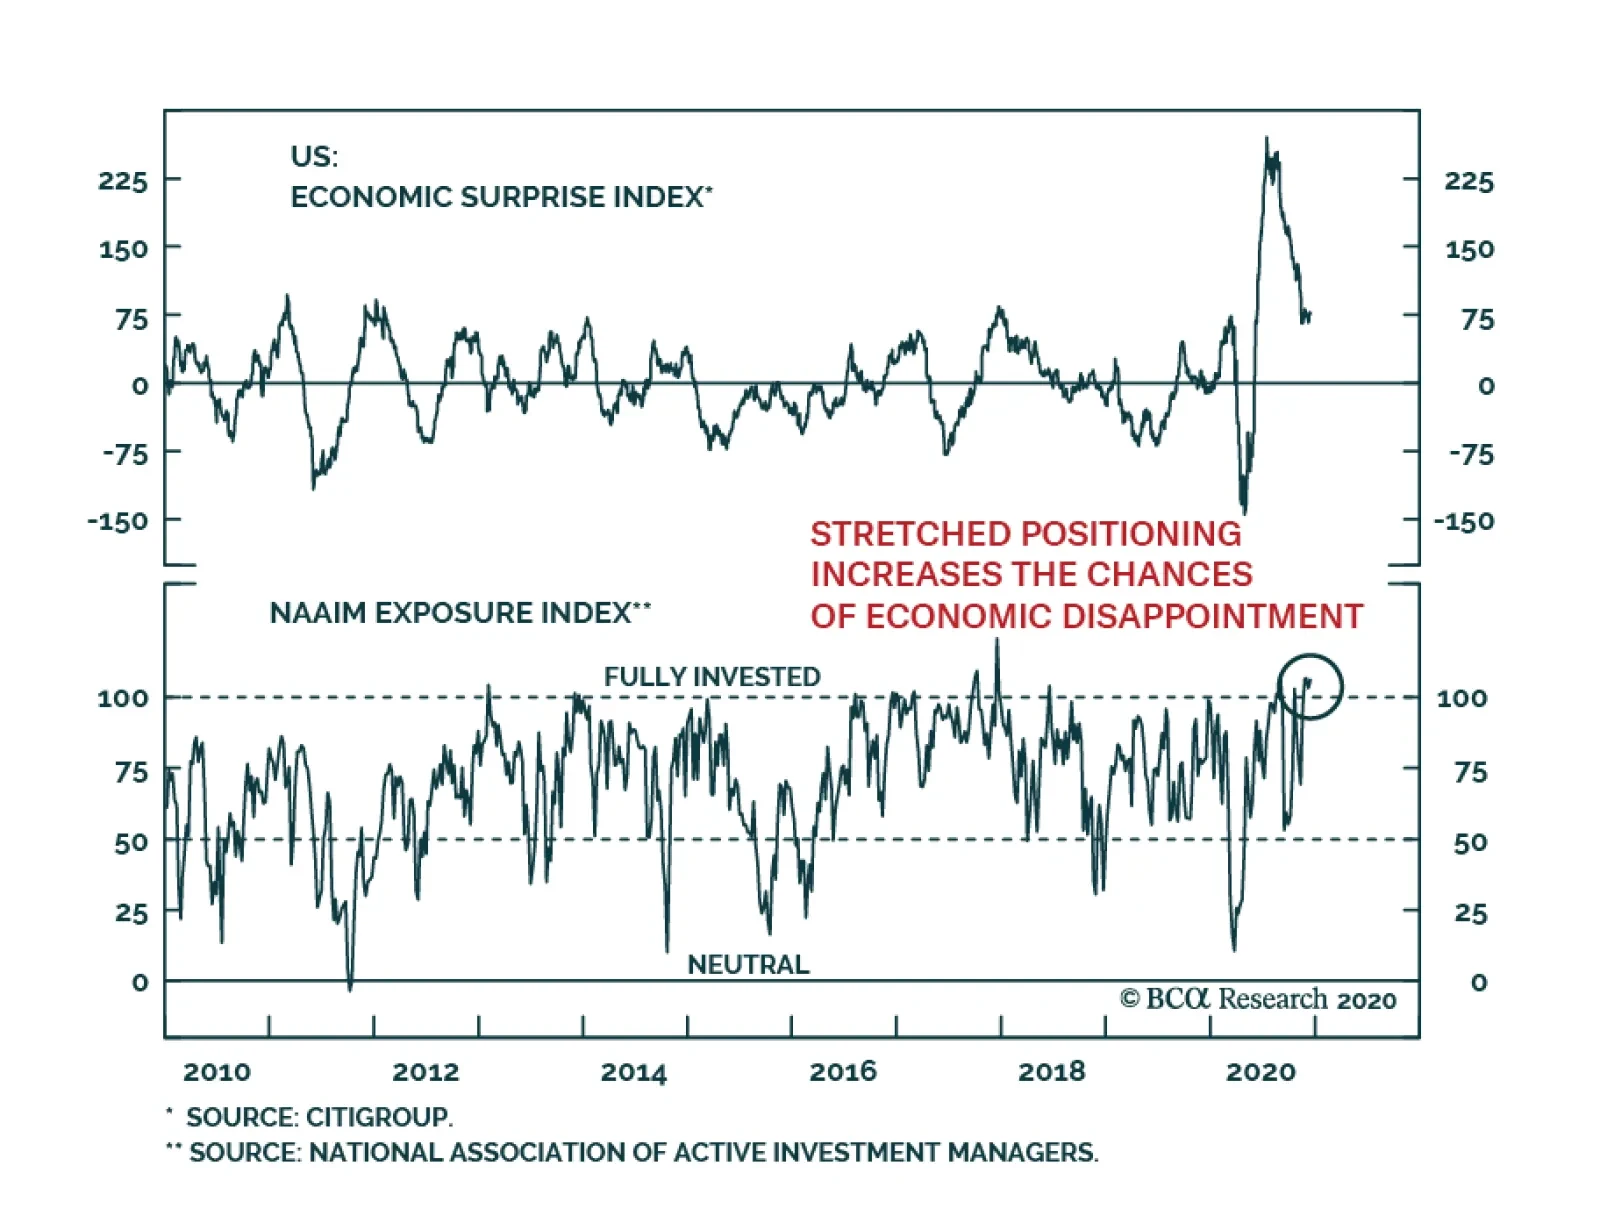
The chance of a tactical correction in risk assets remains very high. Risk assets of all ill are extremely overextended after their sharp rally since early November, yet the near-term weakness in the economy is growing as lockdowns continue to spread,…

DIS & NFLX Can Both Be Winners
DIS & NFLX Can Both Be Winners
Overweight The S&P movies & entertainment industry has sprung to life on the back of encouraging DIS news. In more detail, Disney’s price hike for the Disney+ service along with exponential subscription growth projections propelled this S&P consumer discretionary sub-group to fresh multi-year highs (top panel). Disney’s timing could not have been better, as both the ISM non-manufacturing PMI and NFIB surveys forecast improving consumer data (second & third panels). Tack on the secular rise in demand for at home entertainment that benefits both NFLX and DIS and the allure of the S&P movies & entertainment index increases further. Importantly, while on a relative forward price-to-earnings basis this index is expensive, correcting for growth reveals that it is actually very compellingly valued: using I/B/E/S data, the bottom panel of the chart shows that the relative P/E/G ratio has fallen both below the historical mean and below par. Bottom Line: We remain overweight the S&P movies & entertainment index. The ticker symbols for the stocks in this index are: BLBG: S5MOVI – DIS, NFLX, LYV.

BCA Research’s US Bond Strategy service concludes that investment-grade corporates will outperform Treasuries in 2021, but the potential for further spread compression is limited. Junk spreads have more room to tighten, and the Ba credit tier looks…
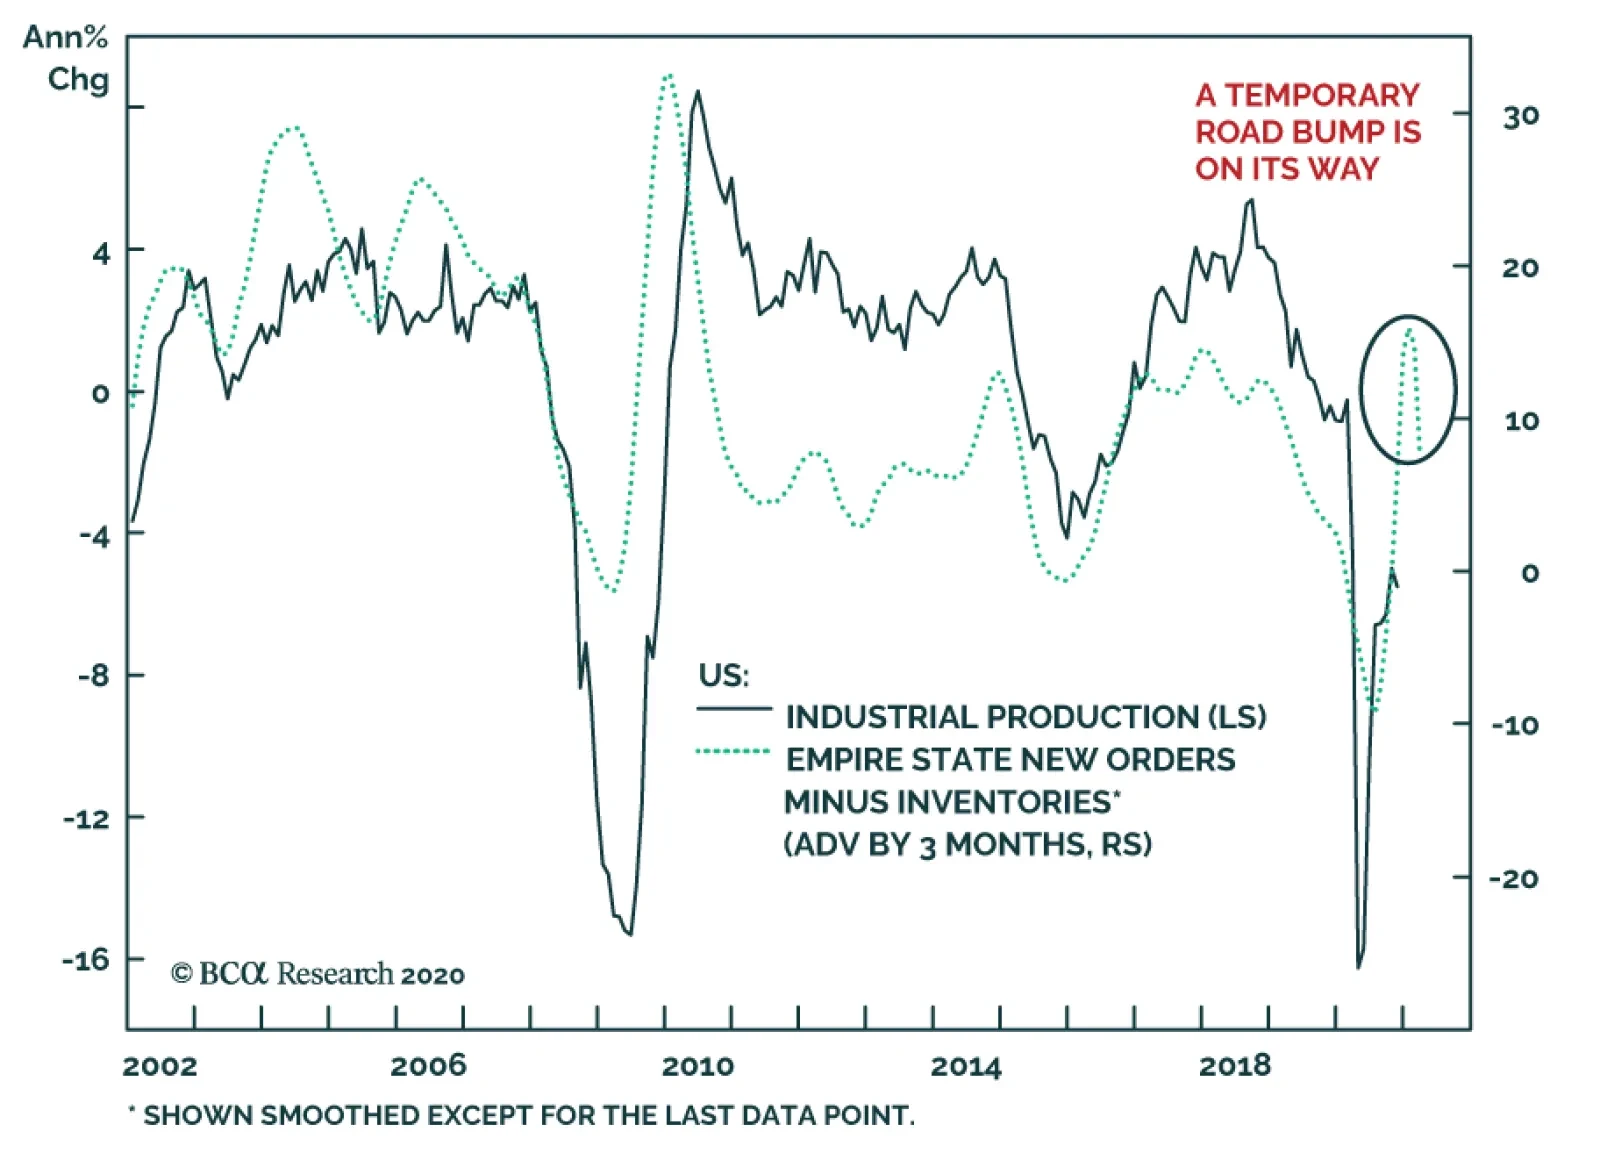
US industrial production surprised to the upside in November, rising 0.39% m/m from a revised 0.95% m/m. The positive IP number reflects continued growth in manufacturing output, which rose 0.75% m/m and beat expectations of a more muted 0.4% m/m rise. …
Highlights Below-Benchmark Portfolio Duration: The economic recovery will continue (and even accelerate) in 2021. Meanwhile, the Fed’s forward interest rate guidance is already as dovish as it will get. Keep portfolio duration below-benchmark in 2021, targeting a level of 1.25% to 1.5% for the 10-year Treasury yield. Overweight TIPS Versus Nominal Treasuries: We remain overweight TIPS versus nominal Treasuries for the time being but are actively looking for an opportunity to get tactically underweight. This opportunity could emerge in the first half of 2021 when core and trimmed mean inflation re-converge and when the 10-year TIPS breakeven inflation rate looks expensive on our model. Own Nominal Yield Curve Steepeners, Real Yield Curve Steepeners And Inflation Curve Flatteners: The nominal yield curve will continue to trade directionally with yields. Therefore, higher yields will coincide with a steeper nominal curve in 2021. Rising inflation and the Fed’s new Average Inflation Target both argue for a flatter inflation curve in 2021. We also recommend a real yield curve steepener as a high octane play on both a steeper nominal curve and flatter inflation curve. Overweight Spread Product Versus Treasuries: We see the economy as entering what we call “Phase 1” of the economic cycle in 2021, an environment of above-trend growth, low inflation and accommodative monetary policy. This is an environment where spread product typically performs very well relative to Treasuries. Move Down In Quality Within Corporates: Investment grade corporates will outperform Treasuries in 2021, but the potential for further spread compression is limited. Junk spreads have more room to tighten, and the Ba credit tier looks particularly attractive from a risk/reward perspective A Maximum Overweight Allocation To Municipal Bonds: Tax-exempt municipal bonds offer the best opportunity in the US fixed income space. Investors should adopt a maximum overweight allocation, and in particular, they should shift some allocation out of investment grade corporates and into Munis with the same credit rating and duration, but with a greater after-tax yield. Feature BCA published its 2021 Outlook on November 30. That report lays out the main macroeconomic themes that our strategists see driving markets next year. This Special Report explains how investors can profit from those themes in US fixed income markets. Specifically, we offer six key US fixed income views for 2021. This report is limited to the six key investment views listed on page 1, and only discusses Fed policy in the context of how it influences those views. Next week we will publish a more comprehensive “Fed In 2021” report that will delve into our outlook for the Fed next year. Outlook Summary First, a brief summary of the main economic views presented in BCA’s 2021 Outlook:1 The third wave of COVID infections will be a drag on economic activity in 2020 Q4 and 2021 Q1, but inventory re-stocking and the large build-up of household savings will prevent the US economy from falling into a double-dip recession. Ultimately, the vaccine roll-out will cause US GDP to grow well above trend in 2021. Inflation is likely to spike in the first half of 2021 due to base effects and the re-opening of some service sectors that were shuttered during the pandemic. But this initial surge will dissipate in the second half of the year. The wide output gap that opened in 2020 will persist in 2021 and will prevent a broad-based acceleration in consumer prices. The Fed’s forward interest rate guidance is as dovish as it will get. A large portion of the Outlook is devoted to considering longer-run economic and political trends that were accelerated by the global policy response to COVID-19. Specifically, rising populism, heavier corporate regulation and a greater appetite for MMT-like taxing and spending policies. The ultimate outcome of these trends will be significantly higher inflation, on the order of 3% to 5%, in the second half of the decade. Key View #1: Below-Benchmark Portfolio Duration Chart 1Treasury Yields In 2020
2021 Key Views: US Fixed Income
2021 Key Views: US Fixed Income
The economic recovery will continue (and even accelerate) in 2021. Meanwhile, the Fed’s forward interest rate guidance is already as dovish as it will get. Keep portfolio duration below-benchmark in 2021, targeting a level of 1.25% to 1.5% for the 10-year Treasury yield. Our recommendation to maintain below-benchmark portfolio duration rests on two key pillars. The first is BCA’s view that the economic recovery will continue in 2021 and will even accelerate once enough of the population has received the COVID vaccine. The second pillar is our view that the Federal Reserve’s reaction function is as dovish as it will get. In other words, having already laid out the conditions that must be in place for it to begin the next rate hike cycle, the Fed will not undertake further efforts to guide interest rates lower in the face of economic recovery. Chart 1 provides a bit more context for our assessment of Fed policy. This year, economic growth and inflation expectations troughed in March and moved rapidly higher throughout the summer. Bond yields, however, stayed relatively flat between March and August. The reason is that, even as the economic outlook improved, the Fed was steadily guiding markets towards a dramatic shift in its forward interest rate guidance. Specifically, the adoption of an Average Inflation Target – a pledge to allow a moderate overshoot of the 2% inflation target to make up for past downside misses. The result of the Fed’s dovish shift is that the increase in inflation expectations between March and August was entirely offset by falling real yields (Chart 1, panel 3), leaving nominal yields close to unchanged. However, the Fed made its Average Inflation Target official at the Jackson Hole Symposium in August. Then, in September, it formalized its forward rate guidance by promising not to lift rates off the zero bound until inflation reaches 2% and is expected to moderately overshoot for a while. These events changed the dynamic in the bond market. The Fed is no longer trying to guide markets towards a more dovish reaction function. That reaction function is now officially in place, and presumably in the market price. Indeed, nominal bond yields have risen in concert with improving economic conditions since August, and we expect that trend to continue in 2021. Our Golden Rule of Bond Investing states that we should set portfolio duration by considering our own expectations for future changes in the fed funds rate relative to what is already priced in the yield curve. Appendix A at the end of this report shows that the Golden Rule once again performed well in 2020. Looking ahead, the market is currently pricing-in one full 25 basis point rate hike by mid-2023 and then only one more by mid-2024 (Chart 2). We see high odds that inflation could sustainably reach 2% – the Fed’s stated criteria for lifting off the zero bound – before that, necessitating some Fed tightening in 2022. Chart 2Market Priced For Liftoff In 2023
2021 Key Views: US Fixed Income
2021 Key Views: US Fixed Income
How High Could Yields Go In 2021? To answer this question, we first look at the 5-year/5-year forward Treasury yield relative to survey estimates of the longer-run equilibrium fed funds rate. In theory, long-dated forward yields should be relatively insulated from near-term shifts in the policy rate and should settle near levels consistent with estimates of the equilibrium fed funds rate. In practice, we find that the 5-year/5-year forward Treasury yield does settle near these levels, but only during periods of global economic recovery when investors are presumably more inclined to envision the closing of the output gap and an eventual neutralizing of monetary policy. Notice that during the past two global growth upturns, 2013/14 and 2017/18, the 5-year/5-year forward Treasury yield peaked close to survey estimates of the long-run equilibrium fed funds rate from the New York Fed’s Survey of Market Participants and the Survey of Primary Dealers (Chart 3A). If the same thing happens next year, the 5-year/5-year forward Treasury yield will rise to a range of roughly 2% to 2.25%, 54 bps to 79 bps above current levels. Chart 3AHow High Can Yields Rise?
2021 Key Views: US Fixed Income
2021 Key Views: US Fixed Income
Chart 3BLess Upside In 10y Than In 5y5y
2021 Key Views: US Fixed Income
2021 Key Views: US Fixed Income
We see less upside next year for the benchmark 10-year yield than for the 5-year/5-year forward. Long-dated forward rates are not mathematically influenced by the near-term outlook for the policy rate, but the yield on the 10-year Treasury note embeds those expectations. Since it is unlikely that inflation will be strong enough to prompt a Fed rate hike in 2021, the yield curve will steepen as the economic outlook improves and the 10-year yield will rise by less than the 5-year/5-year forward. Looking at Chart 3B, next year’s bond market moves will look a lot more like 2013/14 than like 2017/18. The Fed kept rates at zero in 2013/14. This led to yield curve steepening and caused the 10-year Treasury yield to peak at a level well below survey estimates of the long-run equilibrium fed funds rate. In contrast, the Fed was hiking rates in 2017/18. This led to a flatter yield curve and caused the 10-year yield to peak at around the same level as the 5-year/5-year forward. All in all, while we could see the 5-year/5-year forward Treasury yield reach a range of 2% to 2.25% next year, we expect the 10-year Treasury yield to reach a range of 1.25% to 1.5%. Will The Fed Use Its Balance Sheet To Stop Treasury Yields From Rising? By far, the most common disagreement we’ve received from clients on our call for higher bond yields is that the Fed will simply use its balance sheet to prevent any increase in long-maturity yields. We don’t see this as having a meaningful impact. For one, the Fed will only take significant steps to ease monetary policy if it looks like the economic recovery is under threat. This would require a large tightening of financial conditions, meaning significantly lower stock prices and wider corporate bond spreads. We don’t see a 1.25% to 1.5% 10-year Treasury yield in the context of a steepening yield curve, low inflation and improving economic growth as likely to cause such an event. Granted, the Fed could take more minor actions, like keeping the same pace of purchases but shifting them further out the curve, but a significant tightening of financial conditions is likely required for them to increase the monthly pace of bond buying. Second, even if the Fed does decide to ramp up the pace of bond buying (either overall or only at the long-end of the curve), if it keeps the same forward interest rate guidance, then bond yields will be driven by the market’s perceived progress toward the conditions that would prompt the start of the next tightening cycle. It won’t matter how many bonds the Fed buys in the meantime. Our Golden Rule of Bond Investing has a strong track record that it achieves by focusing only on changes in the fed funds rate relative to expectations. It does not consider asset purchases at all, and we are also inclined to view them more as a distraction. Key View #2: Overweight TIPS Versus Nominal Treasuries Chart 4Adaptive Expectations Model
2021 Key Views: US Fixed Income
2021 Key Views: US Fixed Income
We remain overweight TIPS versus nominal Treasuries for the time being but are actively looking for an opportunity to get tactically underweight. This opportunity could emerge in the first half of 2021 when core and trimmed mean inflation re-converge and when the 10-year TIPS breakeven inflation rate looks expensive on our model. TIPS breakeven inflation rates fell dramatically when the COVID crisis struck in March, but they then rebounded just as quickly and are now near fair value according to our Adaptive Expectations Model (Chart 4). Our model forecasts the future 12-month change in the 10-year TIPS breakeven inflation rate based on where the rate currently sits relative to several different measures of actual CPI inflation. Right now, our model is looking for a 12 basis point decline in the 10-year breakeven rate during the next year, but this forecast will rise if CPI prints strongly in the coming months, which is exactly what we expect. Chart 5Expect Higher Inflation In H1 2021
2021 Key Views: US Fixed Income
2021 Key Views: US Fixed Income
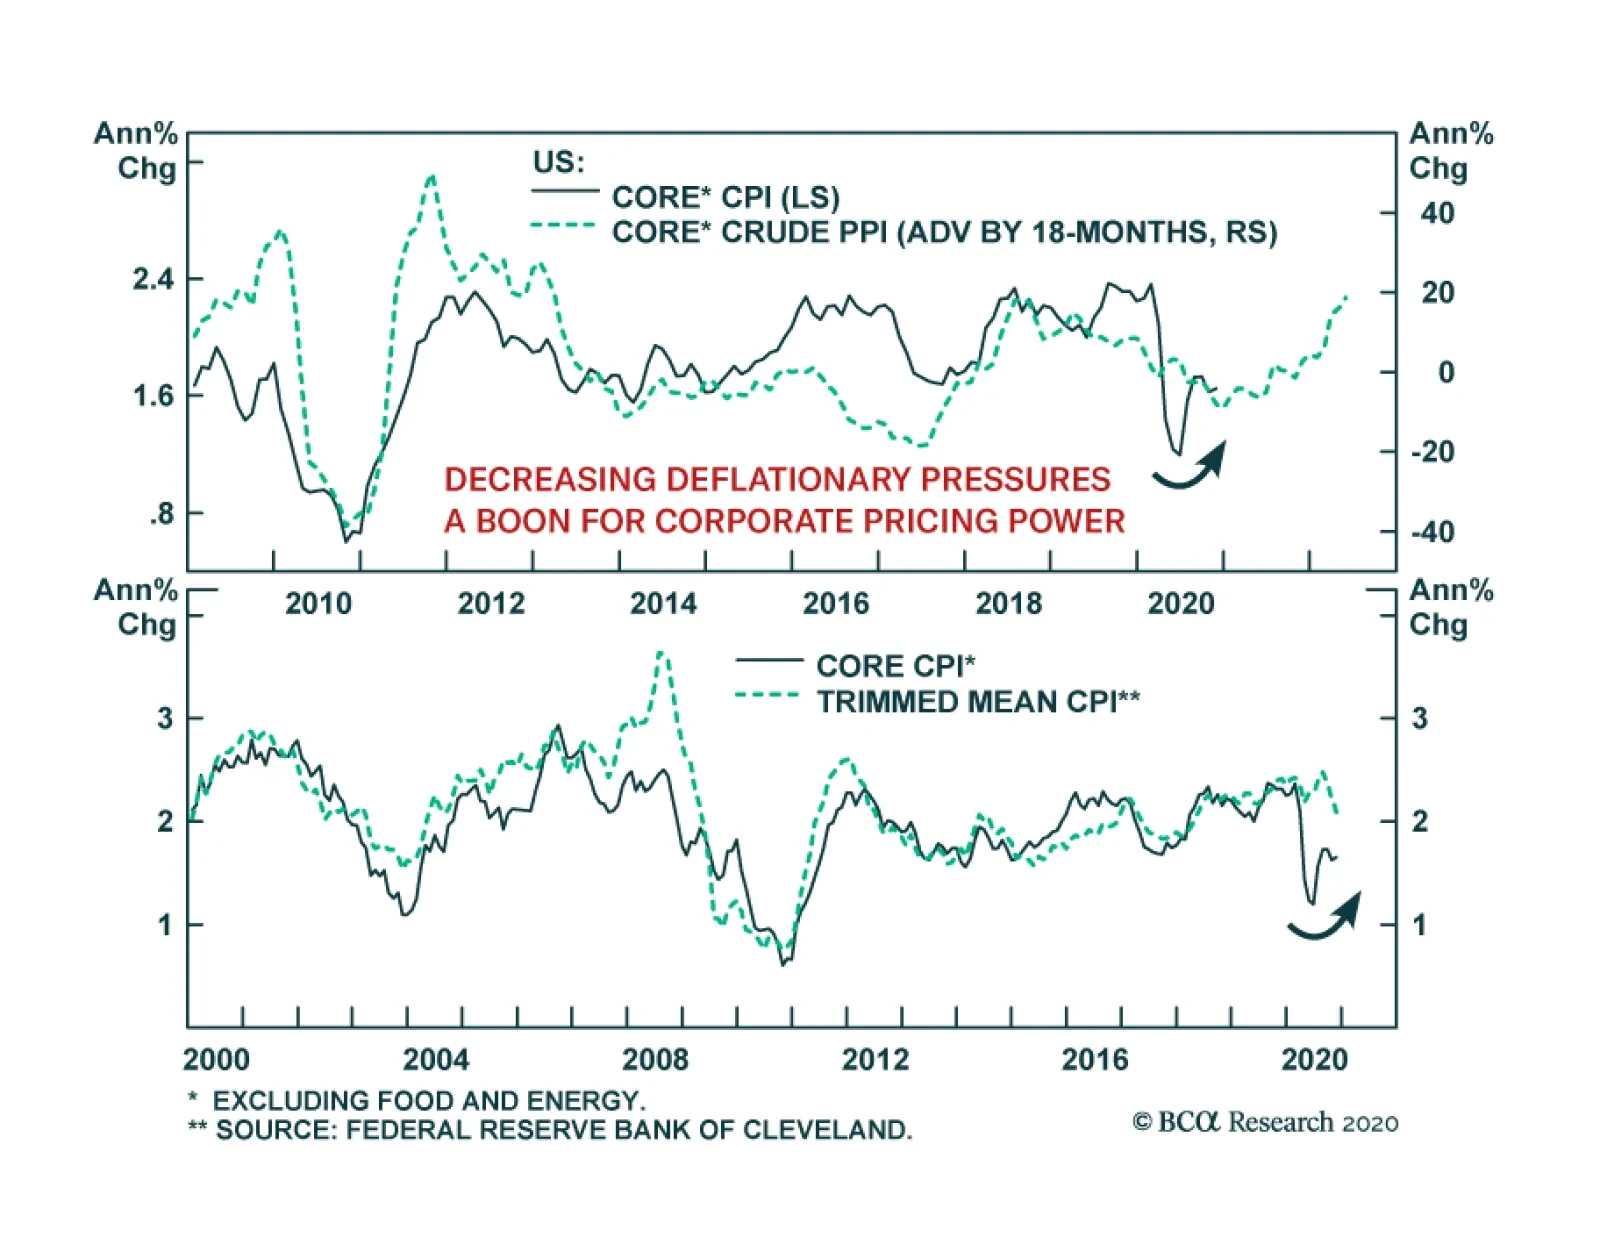
As noted in the above Outlook Summary, base effects and the re-opening of some service sectors will cause inflation to jump in the first half of 2021. A good way to see this is to look at the gap between 12-month core and trimmed mean CPI (Chart 5). Core inflation fell dramatically in March and April and is now in the process of bouncing back. Meanwhile, trimmed mean inflation measures were much more stable in the spring because they filtered out those sectors that experienced huge negative inflation prints during quarantine. We think the gap between core and trimmed mean CPI is a good guidepost for our TIPS strategy. As long as the gap remains wide, we see upside risks to inflation. However, once the gap closes, that will signal that the “snapback phase” from re-opening the economy is over and that inflation pressures will moderate in line with the wide output gap. Shelter inflation is one of the components of inflation that is most sensitive to the output gap, and it has already been rolling over in line with the rising unemployment rate (Chart 5, bottom panel). Overall, our TIPS strategy in 2021 is to remain overweight TIPS versus nominal Treasuries for the time being. However, we are actively looking for an opportunity to get tactically short TIPS versus nominals. This could occur sometime in the first half of 2021 when core and trimmed mean inflation have re-converged and when (hopefully) the 10-year TIPS breakeven inflation rate looks more expensive on our model. Key View #3: Own Nominal Yield Curve Steepeners, Real Yield Curve Steepeners and Inflation Curve Flatteners Chart 62/5/10 Butterfly Spread Valuation
2021 Key Views: US Fixed Income
2021 Key Views: US Fixed Income
The nominal yield curve will continue to trade directionally with yields. Therefore, higher yields will coincide with a steeper nominal curve in 2021. Rising inflation and the Fed’s new Average Inflation Target both argue for a flatter inflation curve in 2021. We also recommend a real yield curve steepener as a high octane play on both a steeper nominal curve and flatter inflation curve. Nominal Yield Curve With the funds rate pinned at zero and the Fed unlikely to actually lift it until 2022 (at the earliest), it is quite clear that the slope of the nominal yield curve will continue to trade directionally with yields as we head into 2021. That is, with volatility at the front-end of the curve completely suppressed, the yield curve will steepen when yields rise and flatten when they fall. In that context, we recommend complementing our below-benchmark portfolio duration view with nominal yield curve steepeners. Our preferred way to implement a nominal yield curve steepener is to buy the 5-year Treasury note and short a barbell consisting of the 2-year note and 10-year note. Allocations to the 2-year and 10-year should be weighted so that the duration of the 2/10 barbell matches that of the 5-year note. As we have explained in prior research, this sort of position is designed to profit from 2/10 yield curve steepening and it has worked well during the past few months (Chart 6).2 The one problem with this 5 over 2/10 trade is that it is not cheap. The 5-year yield is below the yield on the 2/10 barbell (Chart 6, panel 3) and the 5-year bullet looks expensive on our fair value model (Chart 6, bottom panel). However, we should also note that the 5-year looked much expensive during the last period of zero-bound rates in 2012. Given today’s very similar policy environment, we could see the 5-year yield getting even more expensive in 2021. Inflation Curve Chart 7Favor Inflation Curve Flatteners...
2021 Key Views: US Fixed Income
2021 Key Views: US Fixed Income
Our second recommended yield curve position relates to the inflation curve, either the TIPS breakeven inflation curve or the CPI swap curve. Here, we recommend owning inflation curve flatteners for two reasons. First, short-maturity inflation expectations are more sensitive to the actual inflation data than long-maturity expectations. We saw a prime example of this relationship in 2020. The 2-year CPI swap rate plunged into negative territory when inflation fell in March while the 10-year CPI swap rate held relatively stable in comparison (Chart 7). Subsequently, the 2-year CPI swap rate rose much more quickly than the 10-year rate this summer as inflation rebounded. Looking ahead, with inflation biased higher in the first half of 2021, we should see greater upside in short-maturity inflation expectations than in long-maturity ones. The Fed’s adoption of an Average Inflation Target is the second reason to favor inflation curve flatteners. If the Fed is ultimately successful at achieving an overshoot of its 2% inflation target, it will mean that the Fed will be attacking its inflation target from above rather than from below for the first time since the 1980s. Logically, the inflation curve should be inverted in this sort of environment. This means that the inflation curve still has a lot of room to flatten from current levels (Chart 7, bottom panel). Real Yield Curve Chart 8...And Real Yield Curve Steepeners
2021 Key Views: US Fixed Income
2021 Key Views: US Fixed Income
The Fisher Equation tells us that real yields are simply the difference between nominal yields and inflation expectations. Viewed that way, it is easy to see that – all else equal – a steeper nominal curve will lead to a steeper real yield curve. Meanwhile, a flatter inflation curve will also lead to a steeper real yield curve. In that sense, a real yield curve steepener is just a combination of the nominal curve steepener and inflation curve flattener that we already mentioned (Chart 8). As inflation rises, it will pressure short-dated inflation expectations higher relative to long-dated ones. This will exert bull-steepening pressure on the real yield curve. Meanwhile, investors starting to price-in eventual rate hikes will lead to nominal yield curve steepening. This will exert bear-steepening pressure on the real yield curve. With that in mind, a real yield curve steepener is a high conviction position for us in 2021. We have less conviction on the outright direction for real yields, though we suspect that long-maturity real yields have already troughed for the cycle. Key View #4: Overweight Spread Product Versus Treasuries We see the economy as entering what we call “Phase 1” of the economic cycle in 2021, an environment of above-trend growth, low inflation and accommodative monetary policy. This is an environment where spread product typically performs very well relative to Treasuries. Most spread sectors will likely end the year having underperformed duration-equivalent Treasuries in 2020. However, this simple fact obscures the actual pattern of spread movements that was witnessed during the year. Spreads widened sharply when COVID struck but they peaked on March 23, the same day that the Federal Reserve announced its slew of emergency lending facilities.3 Spread product has been outperforming Treasuries since then (see Appendix B), a trend we expect will continue in 2021. The phase of the economic cycle when the economy is just emerging from a recession is typically one where risk assets perform well. The principal reason to expect spread product outperformance to continue is that the phase of the economic cycle when the economy is just emerging from a recession is typically one where risk assets perform well. It tends to be an environment where economic activity is growing at an above-trend pace, but inflation is still low and monetary conditions are accommodative. This is the perfect environment for credit spreads to tighten. The slope of the yield curve is a useful variable for summarizing the above macro conditions and we often use it to define three phases of the economic cycle (Chart 9): Chart 9The Three Phases Of The Cycle
2021 Key Views: US Fixed Income
2021 Key Views: US Fixed Income
Phase 1 is defined as the time between the end of the last recession and when the 3-year/10-year Treasury slope flattens to below 50 bps. Phase 2 is defined as when the 3-year/10-year Treasury slope is between 0 bps and 50 bps. Phase 3 is defined as the time between when the 3-year/10-year Treasury slope turns negative and the start of the next recession. As we are just now emerging from recession and the 3-year/10-year slope is above 50 bps and steepening, we see the economy as being firmly in Phase 1 of the cycle. Historically, this phase has been the best one for spread product returns relative to duration-matched Treasuries (Table 1). Table 1Corporate Bond Performance In Different Phases Of The Cycle
2021 Key Views: US Fixed Income
2021 Key Views: US Fixed Income
The main risk to this view of spread product is that we are not yet emerging from the recession and the corporate default rate may have another leg higher. Our sense, however, is that the default rate has already peaked. Gross leverage (the ratio between total corporate debt and pre-tax corporate profits) and job cut announcements are two variables that correlate very tightly with the default rate (Chart 10). Starting with leverage, net earnings revisions – a leader profit indicator – have already troughed and the corporate financing gap has turned negative (Chart 11). A negative financing gap means that the corporate sector has sufficient retained earnings to cover its capital expenditures. In other words, most firms are flush with cash and they won’t need to issue more debt in the coming quarters. Further, job cut announcements have come down sharply during the past few months (Chart 11, bottom panel). Chart 10The Default Rate Correlates With Gross Leverage And Job Cuts
2021 Key Views: US Fixed Income
2021 Key Views: US Fixed Income
Chart 11Firms Have Enough Cash
2021 Key Views: US Fixed Income
2021 Key Views: US Fixed Income
The above trends in corporate profits, corporate debt and job cut announcements are consistent with what we’re already seeing on the default front. The US corporate sector was experiencing upwards of 20 default events per month back in May, June and July. But only seven defaults occurred in November, following five in October and six in September (Chart 12). Chart 12The Default Rate Has Peaked
2021 Key Views: US Fixed Income
2021 Key Views: US Fixed Income
The bottom line is that the macro environment of above-trend growth, low inflation and accommodative monetary policy is one where we should expect spread product to outperform Treasuries. Relative valuation dictates which spread sectors we prefer over other ones, and the next two Key Views address this issue. Key View #5: Move Down In Quality Within Corporates Investment grade corporates will outperform Treasuries in 2021, but the potential for further spread compression is limited. Junk spreads have more room to tighten, and the Ba credit tier looks particularly attractive from a risk/reward perspective. As noted in the previous section, the macroeconomic environment is one where spread product should flourish. However, valuation in certain sectors could limit how much further spread tightening is possible. In particular, valuation looks to be a constraint for investment grade corporates. In absolute terms, investment grade corporate spreads look like they still have some room to compress (Chart 13). The overall index spread is 12 bps above its pre-COVID level. The Aa, A and Baa-rated spreads are 16 bps, 11 bps and 13 bps above, respectively. Only seven defaults occurred in November, following five in October and six in September. However, valuation looks much worse in risk-adjusted terms. Chart 14 shows the 12-month breakeven spread, i.e. the spread widening required for the sector to underperform Treasuries on a 12-month investment horizon. In addition, we re-weight the overall corporate index to ensure that it maintains a constant credit rating distribution over time, and we show all breakeven spreads as percentile ranks relative to their own histories. For example, a reading of 8% for the Baa credit tier means that the 12-month breakeven spread for the Baa credit tier has only been lower than it is today 8% of the time since our data begin in 1995. Chart 13IG Spreads Still Above ##br##Pre-COVID levels
2021 Key Views: US Fixed Income
2021 Key Views: US Fixed Income
Chart 14IG Looks More Expensive In Risk-Adjusted Terms
2021 Key Views: US Fixed Income
2021 Key Views: US Fixed Income
Adding it all up, we think there is scope for investment grade corporates to modestly outperform Treasuries in 2021, but there are also more attractively priced sectors that investors may want to consider. Municipal bonds are one particularly attractive alternative to investment grade corporates (we discuss our view on municipal bonds in the next section), but investors are also advised to pick-up additional spread by moving down in quality within the corporate credit space. High-Yield corporate bonds have significantly more scope for tightening than their investment grade counterparts, with the overall junk index spread still 69 bps above its pre-COVID level (Chart 15). Within junk, the Ba credit tier looks like the best place to camp out from a risk/reward perspective. The incremental spread offered by Ba-rated junk bonds compared to Baa-rated corporates is elevated compared to history, 111 bps above its 2019 low (Chart 15, panel 2). In contrast, the additional spread pick-up you get from moving into the lower junk tiers (B & Caa) is more in line with typical historical levels (Chart 15, bottom 2 panels). Chart 15Ba-Rated Bonds Look Best
2021 Key Views: US Fixed Income
2021 Key Views: US Fixed Income
Another reason to be cautious about chasing the extra spread in the B-rated and below credit tiers is that the High-Yield index is pricing-in a fairly rapid decline in the default rate for the next 12 months (Chart 16). If we assume a 25% recovery rate and target an excess spread of 150 bps above default losses,4 then we calculate a spread-implied default rate of 3.1%. That is, we should only expect junk bonds to outperform duration-matched Treasuries if the default rate comes in below 3.1% during the next 12 months. This would represent a steep decline of 5.3% from the 8.4% default rate we just witnessed during the past 12 months, but this sort of big drop in the default rate would not be out of line with what typically happens when the economy emerges from recession. For example, in the last recession, the 12-month default rate peaked at 14.6% in November 2009 and then fell to 3.6% by November 2010, a decline of 11%! Chart 16Spread-Implied Default Rate
2021 Key Views: US Fixed Income
2021 Key Views: US Fixed Income
All in all, we view the Ba-rated credit tier as the sweet spot within corporate credit in terms of offering the best combination of risk and reward. We also expect the default rate to fall quickly enough that the lower-rated junk credit tiers will outperform Treasuries, but the risk here is greater and the potential additional compensation is not historically elevated. Investment grade corporate spreads will remain tight, but have limited room to compress further. Investors are advised to look at Ba-rated corporates and municipal bonds instead. Key View #6: A Maximum Overweight Allocation To Municipal Bonds Tax-exempt municipal bonds offer the best opportunity in the US fixed income space. Investors should adopt a maximum overweight allocation, and in particular, they should shift some allocation out of investment grade corporates and into Munis with the same credit rating and duration, but with a greater after-tax yield. At present, we think that tax-exempt municipal bonds represent the best opportunity in US fixed income. Muni spreads have certainly tightened since March, but valuation remains attractive relative to both Treasuries and investment grade corporates. First, let’s consider value relative to Treasuries (Chart 17). Spreads between Aaa-rated municipal bonds and maturity-matched Treasuries are elevated compared to history across the entire yield curve. 2-year Munis even offer a 3 bps yield pick-up over 2-year Treasuries before adjusting for the tax advantage. Further out the curve, value is worst at the 5-year part of the curve where the breakeven effective tax rate between Munis and Treasuries is 42%, slightly above the top marginal tax rate of 37%. But value improves again for longer maturities. The breakeven effective tax rate between 10-year Munis and Treasuries is 24% and it is a mere 10% for 30-year bonds.5 Next, we can look at relative value between Munis and credit. This is where the attractiveness of munis really stands out (Chart 18). After controlling for credit rating and duration, municipal revenue bonds offer a yield advantage over the Bloomberg Barclays Credit Index across the entire yield curve, before any adjustment is made for the municipal tax exemption. General Obligation (GO) Munis only offer a before-tax yield advantage over credit beyond the 12-year maturity point, but the GO Muni/credit spread is nonetheless historically elevated for all maturity buckets. Chart 17Muni/Treasury Yield Spreads
2021 Key Views: US Fixed Income
2021 Key Views: US Fixed Income
Chart 18Munis Versus Credit
2021 Key Views: US Fixed Income
2021 Key Views: US Fixed Income
This is all well and good, but it could easily be countered that municipal bonds only offer such attractive valuations because the COVID recession has been an historically challenging period for state & local government balance sheets. If this period leads to a spate of downgrades and defaults, then municipal bonds no longer look cheap. All this is true, but we think investors’ worst fears in this regard will not be realized. For one thing, state & local governments have been very quick to clamp down on spending and cut employment (Chart 19). Coming out of the last recession, Muni/Treasury yield spreads had almost fully recovered by the time that state & local government austerity began. Also, state budgets were in pretty good shape heading into the COVID downturn, with all-time high Rainy Day Fund balances (Chart 19, bottom panel). Chart 19State & Local Austerity Has Begun
2021 Key Views: US Fixed Income
2021 Key Views: US Fixed Income
We recommend that investors take advantage of historically attractive municipal bond spreads by adopting a maximum overweight allocation. In particular, investors should shift allocation out of investment grade rated corporate bonds, where valuations are stretched, and into municipal bonds that offer the same credit rating and duration with a greater yield pick-up. Finally, Chart 20 shows the spread between different municipal bond sectors and the Bloomberg Barclays US Credit Index. We match the credit rating and duration in each case, but we make no adjustments for the municipal tax exemption. The message from Chart 20 is that the yield advantage in investment grade Munis is broad based, with the exception of the Electric sector. We also see that attractive valuations do not extend to high-yield Munis, which appear expensive relative to High-Yield Credit. Chart 20Municipal Bond Sector Valuation
2021 Key Views: US Fixed Income
2021 Key Views: US Fixed Income
Appendix A: The Golden Rule Of Bond Investing Our Golden Rule of Bond Investing says that we should determine what change in the fed funds rate is priced into the overnight index swap curve for the next 12 months, and then decide whether the Fed will deliver a hawkish or dovish surprise relative to that expectation. We contend that if the Fed delivers a hawkish surprise, then a below-benchmark portfolio duration positioning will pay off. Conversely, if the Fed delivers a dovish surprise, then an above-benchmark portfolio duration positioning will profit. Chart A1 shows how the Golden Rule has performed in every calendar year going back to 1990. We include year-to-date performance for 2020. In 31 years of historical data, our Golden Rule performed well in 23. It provided the wrong recommendation in 8 years, though 3 of those years were during the zero-lower-bound period between 2009 and 2015 when 12-month rate expectations were essentially pinned at zero.6 Chart A1The Golden Rule's Track Record
2021 Key Views: US Fixed Income
2021 Key Views: US Fixed Income
At the beginning of this year, the market was priced for 13 bps of rate cuts in 2020. The funds rate actually fell by 146 bps, leading to a dovish surprise of 133 bps. Based on a historical regression, we would expect a dovish surprise of 133 bps to coincide with a Treasury index yield that falls by 81 bps. In actuality, the index yield fell by 122 bps, more than our Golden Rule predicted. Chart A2 shows how close changes in the Treasury index yield have been to our Golden Rule’s prediction in each of the past 31 years. This regression between the change in Treasury index yield and the monetary policy surprise is the main source of error in our Treasury return forecasts. Chart A2Treasury Index Yield Changes Versus Fed Funds Surprises
2021 Key Views: US Fixed Income
2021 Key Views: US Fixed Income
Based on our expected -81 bps index yield change, we would have expected the Treasury index to deliver 6.5% of total return in 2020 and to outperform cash by 5.5%. In actuality, the index earned 7.9% of total return and outperformed cash by 7%. Charts A3 and A4 show how index total and excess returns have performed relative to our Golden Rule’s expectations in each of the past 31 years. Chart A3Treasury Index Total Returns Versus The Golden Rule’s Predictions
2021 Key Views: US Fixed Income
2021 Key Views: US Fixed Income
Chart A4Treasury Index Excess Returns Versus The Golden Rule’s Predictions
2021 Key Views: US Fixed Income
2021 Key Views: US Fixed Income
Appendix B: Spread Product Performance In 2020 Table B1Spread Product Year-To-Date Performance
2021 Key Views: US Fixed Income
2021 Key Views: US Fixed Income
Table B2Performance Since March 23 Announcement Of Emergency Fed Facilities
2021 Key Views: US Fixed Income
2021 Key Views: US Fixed Income
Ryan Swift US Bond Strategist rswift@bcaresearch.com Footnotes 1 Please see The Bank Credit Analyst, “Outlook 2021: A Brave New World”, dated November 30, 2020, available at bca.bcaresearch.com 2 Please see US Bond Strategy Special Report, “Bullets, Barbells And Butterflies”, dated July 25, 2017, available at usbs.bcaresearch.com 3 We discussed these facilities in detail in two Special Reports published jointly this year with our US Investment Strategy team. US Investment Strategy / US Bond Strategy Special Report, “Alphabet Soup: A Summary Of The Fed’s Anti-Virus Measures”, dated April 14, 2020 and US Investment Strategy / US Bond Strategy Special Report, “Alphabet Soup Part 2: Shocked And Awed”, dated July 28, 2020. Both reports available at usbs.bcaresearch.com 4 Our research has shown that this is the minimum excess spread investors should require to be confident that junk bonds will outperform duration-matched Treasuries. For more details please see US Bond Strategy Weekly Report, “No Holding Back”, dated June 16, 2020, available at usbs.bcaresearch.com 5 The breakeven effective tax rate is the effective tax rate that makes the after-tax muni yield the same as the Treasury yield. If the investor’s personal tax rate is above the breakeven effective tax rate, they will get an after-tax yield pick-up from owning the municipal bond over the Treasury. 6 We say the Golden Rule “worked” if a dovish surprise coincided with positive Treasury index excess returns versus cash, or if a hawkish surprise coincided with negative Treasury excess returns versus cash. Recommended Portfolio Specification
2021 High-Conviction Overweight Calls: Prefer Small Caps Over Large Caps
2021 High-Conviction Overweight Calls: Prefer Small Caps Over Large Caps
Overweight Vaccine efficacy announcements have paved the way for a sustainable great rotation trade into small caps and out of large caps. One of the key small size bias drivers is the delta in sector composition between the small and large cap indexes. The relative gap in deep cyclicals alone is 13% as we highlighted in recent research. Relative share prices remain far apart from the budding recovery in the commodity complex including Dr. Copper’s flirtations with seven-year highs. Thus, the small caps catch up phase has a long ways to go (top & fourth panels). The financials sector gulf is also significant, with small caps’ exposure relative to their large cap brethren clocking in at over 700bps. Already, the yield curve is steepening and there are high odds of a selloff in the bond market as the economy continues to reopen (third panel). In addition, easy fiscal policy is a tonic to the small/large share price ratio. As a flood of money enters the economy with a slight lag, small caps will continue to make up ground lost during the early stages of the pandemic (fiscal balance shown inverted, second panel). Bottom Line: A small size bias is a high-conviction call for 2021.
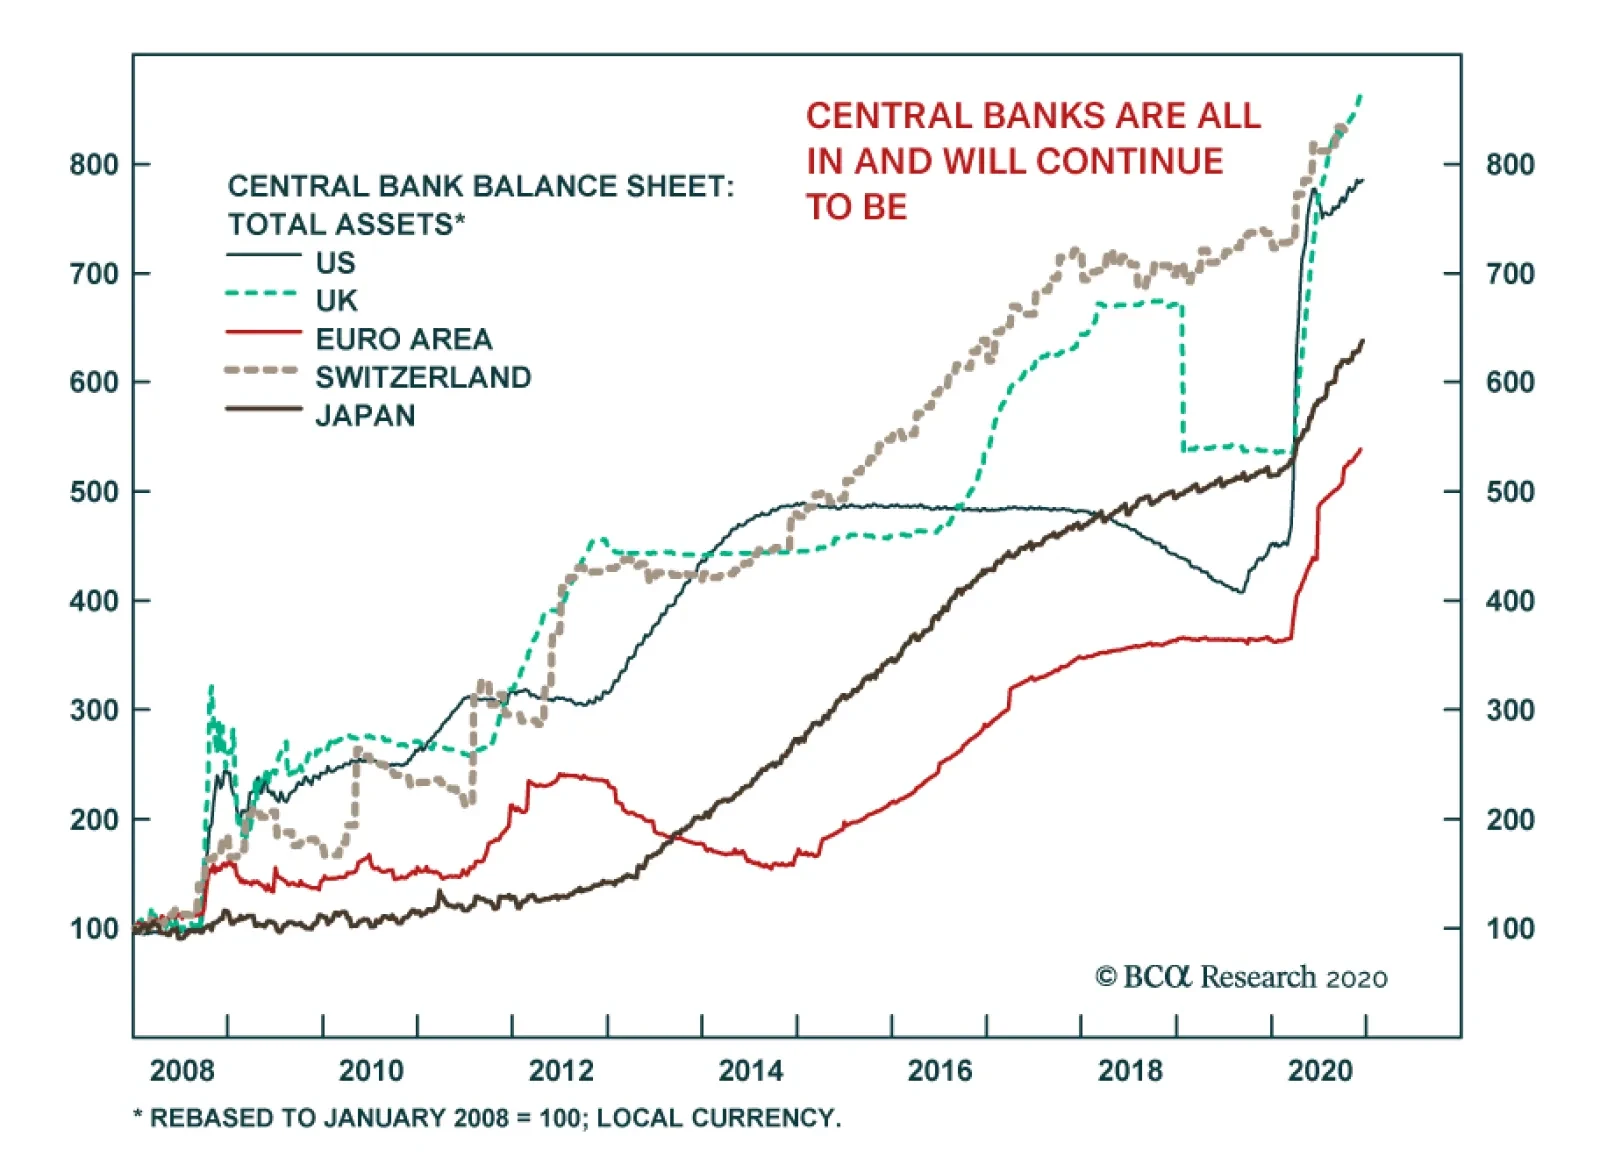
According to BCA Research’s US Investment Strategy service, policymakers are not letting the virus kill the economy and we expect them to continue to do so. Ample support will prime consumption while staving off the negative consequences that would follow a…
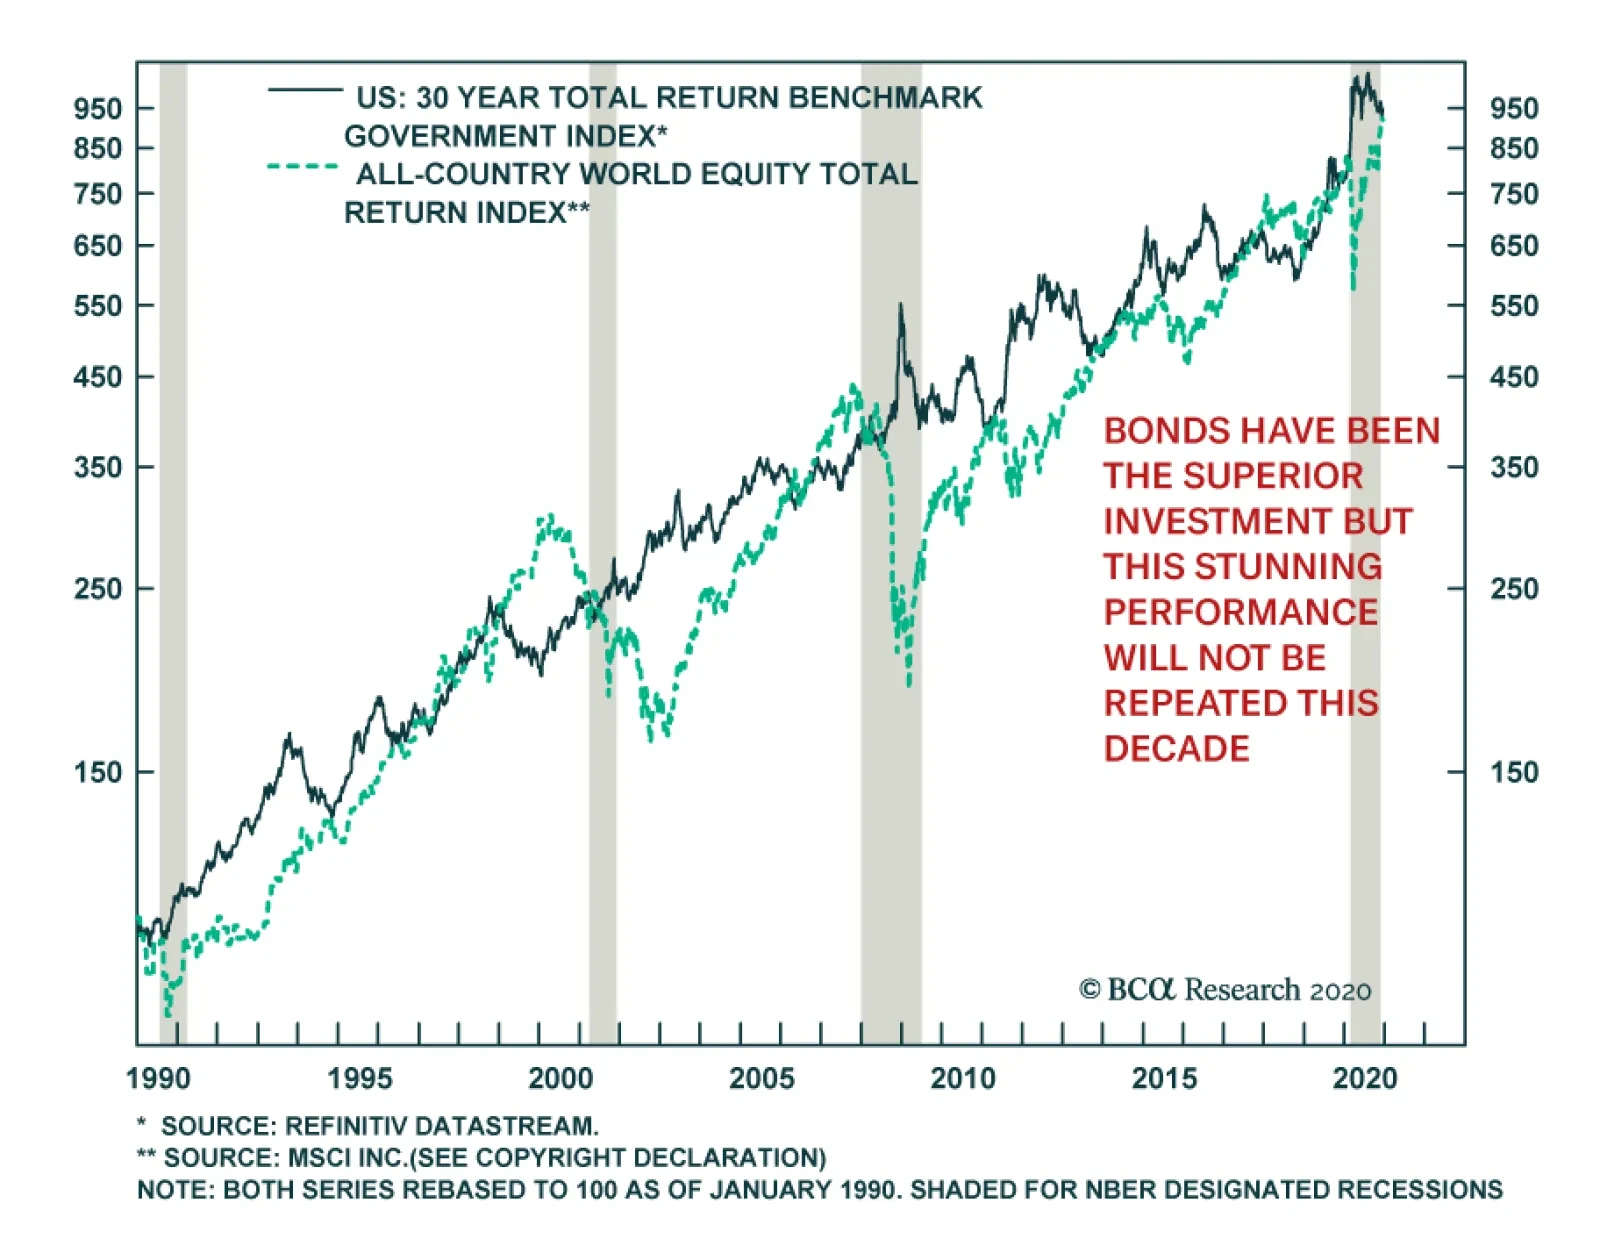
From 1990 to today, US Treasuries and global equities have delivered equivalent returns of roughly 7.5% on an annualized basis. This means that bonds have been the superior investment because of their significantly lower volatility. These equivalent…
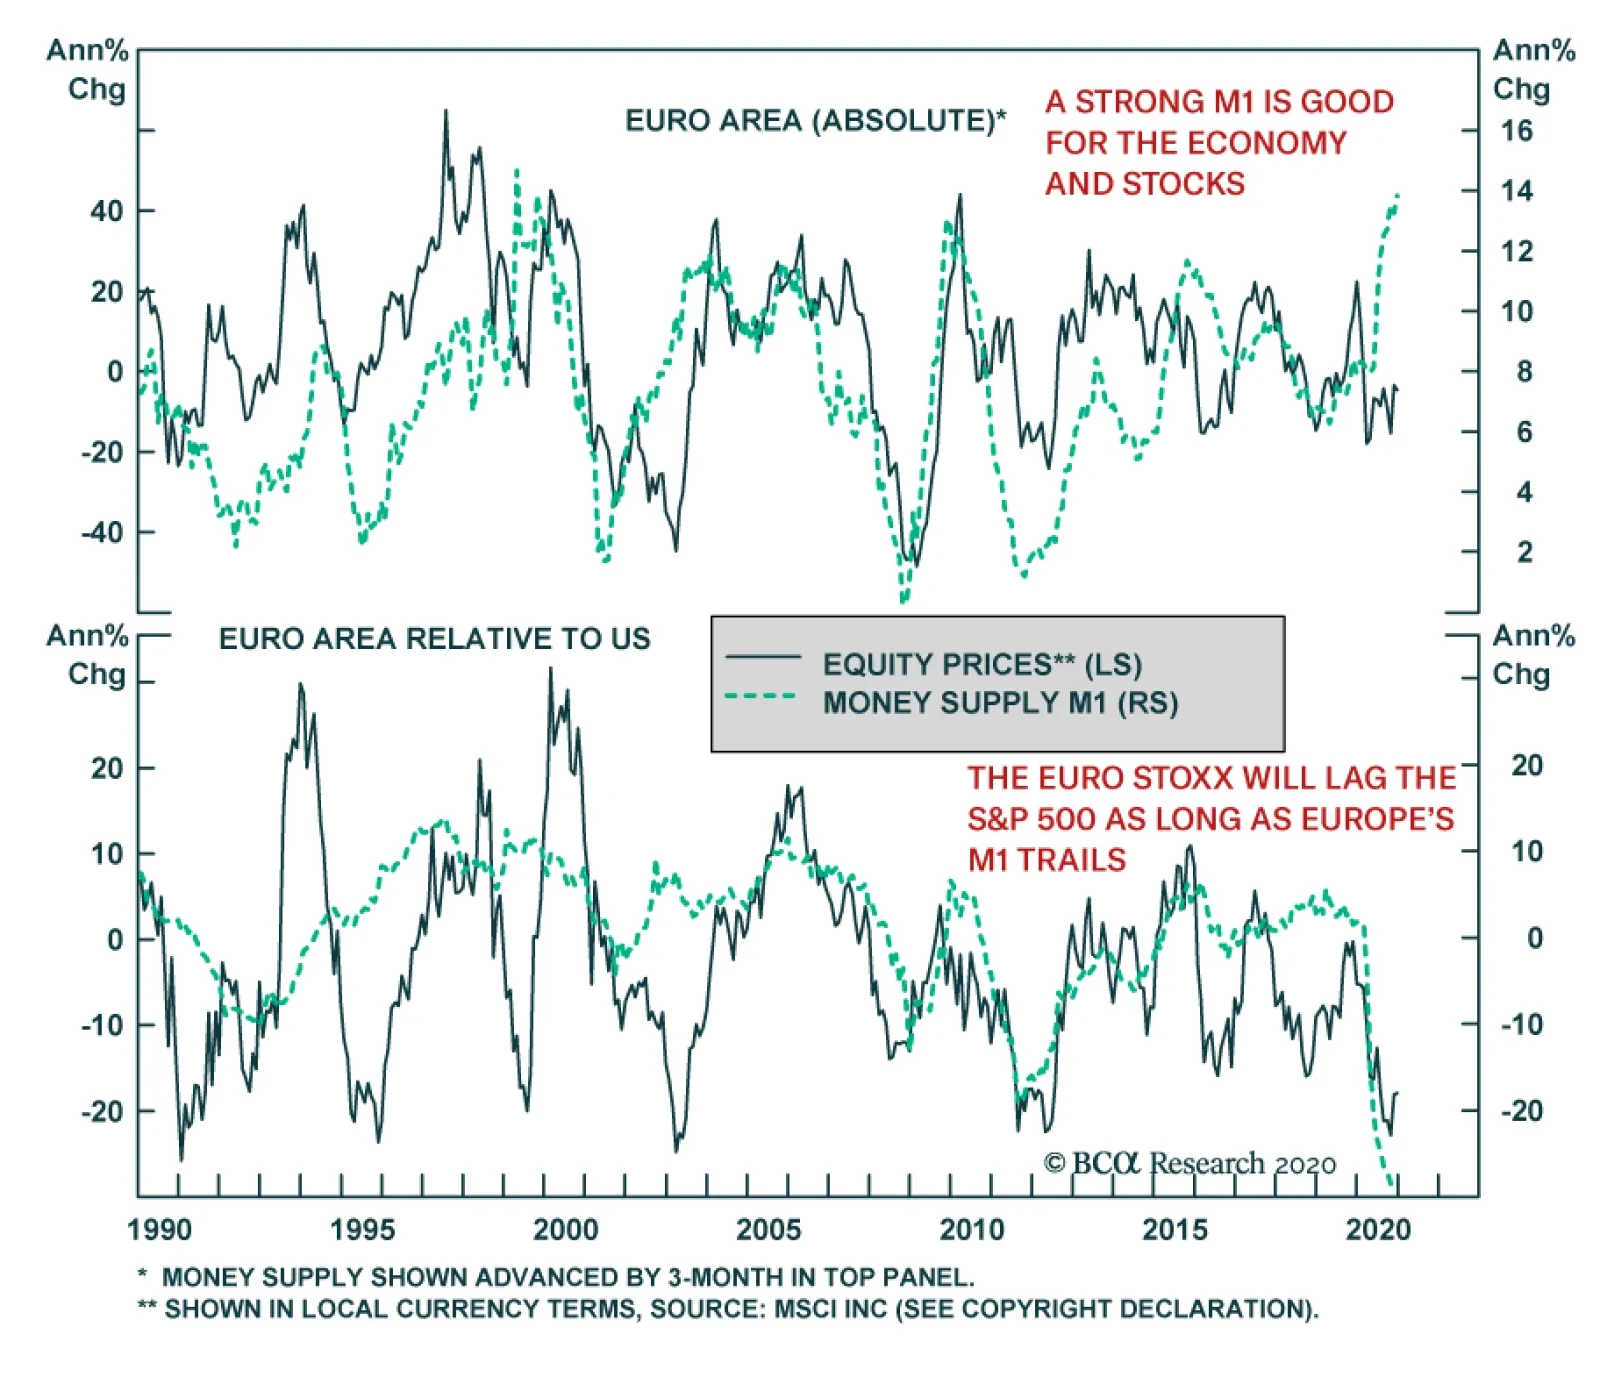
The Eurozone’ M1 money supply is expanding at a 14% annual pace, its fastest rate since 1999. On the European continent, banks represent a much larger share of credit origination than they do in the US. Due to this lack of credit disintermediation, M1 still…
US consumer prices accelerated more than expected in November, with both the headline and core (excluding food and energy) figures picking up to 0.2% month-on-month from 0.0%. On a year-on-year basis, headline and core consumer prices were flat at 1.2% y/y…