United States
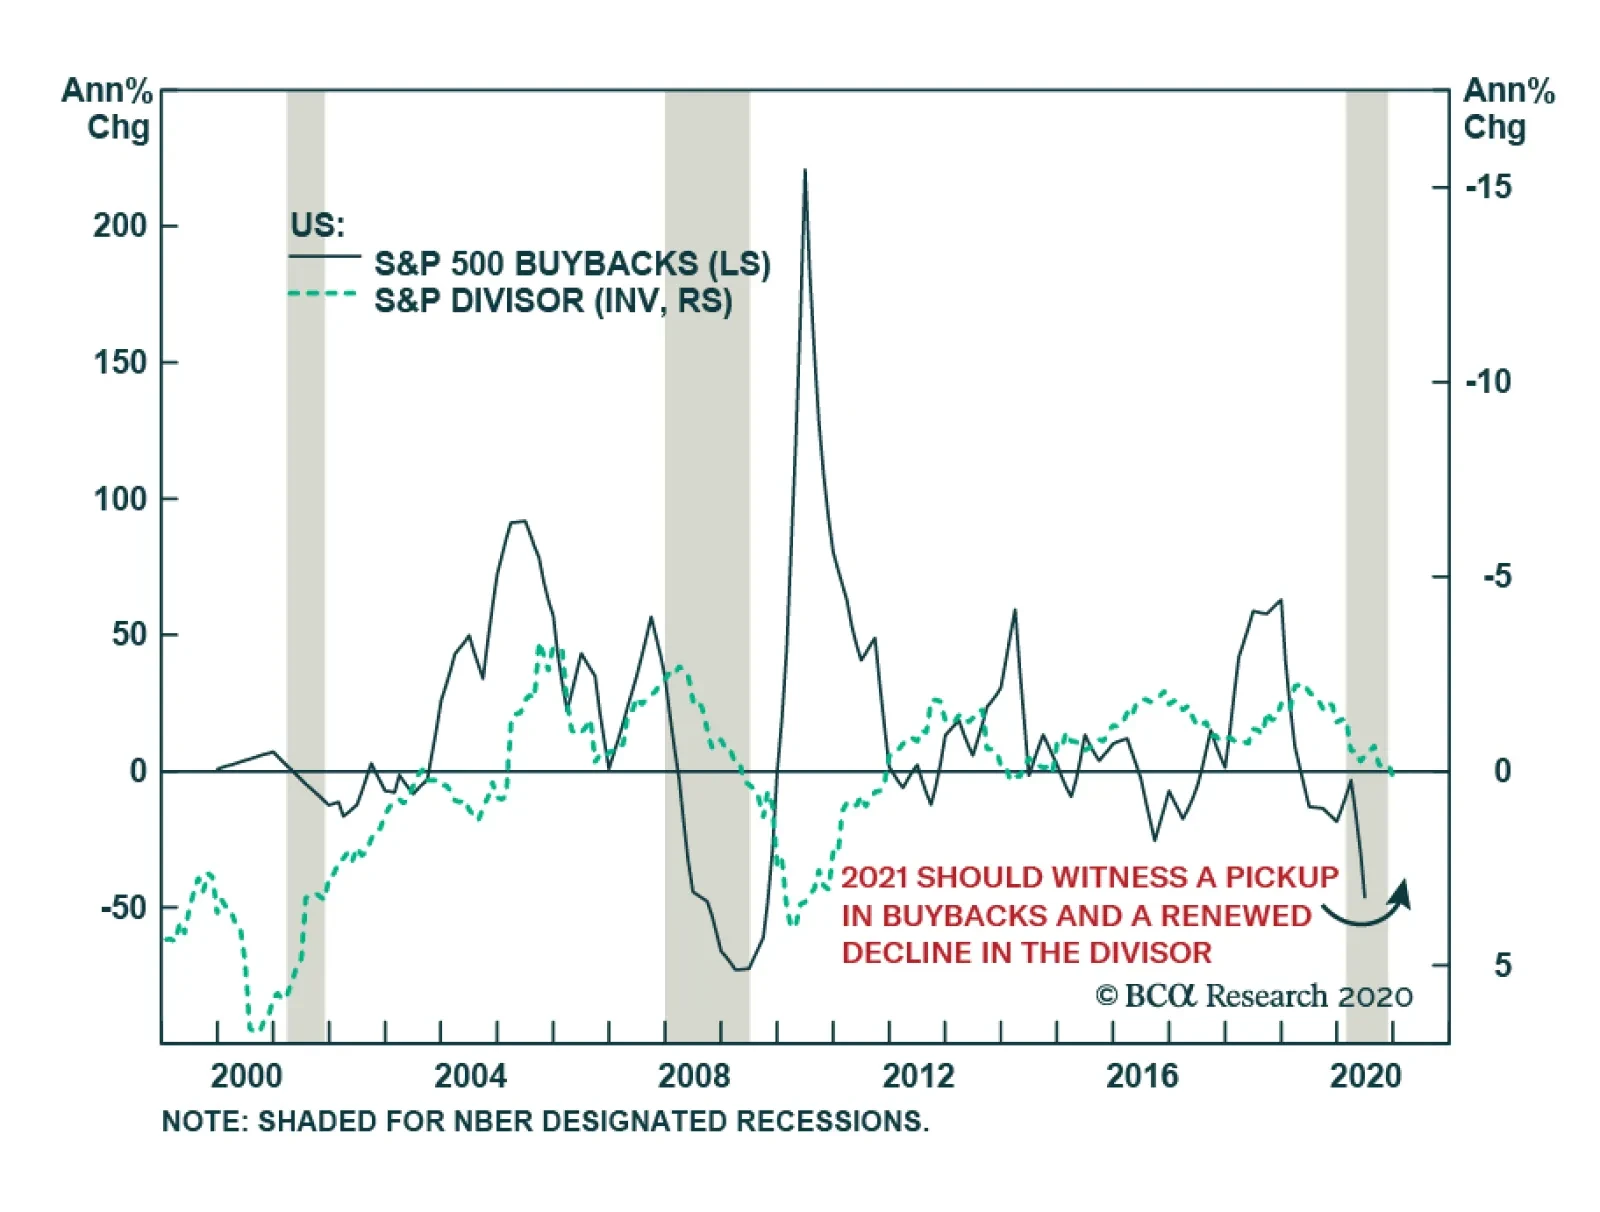
S&P 500 Divisor Will Remerge As A Tailwind To EPS Growth
…
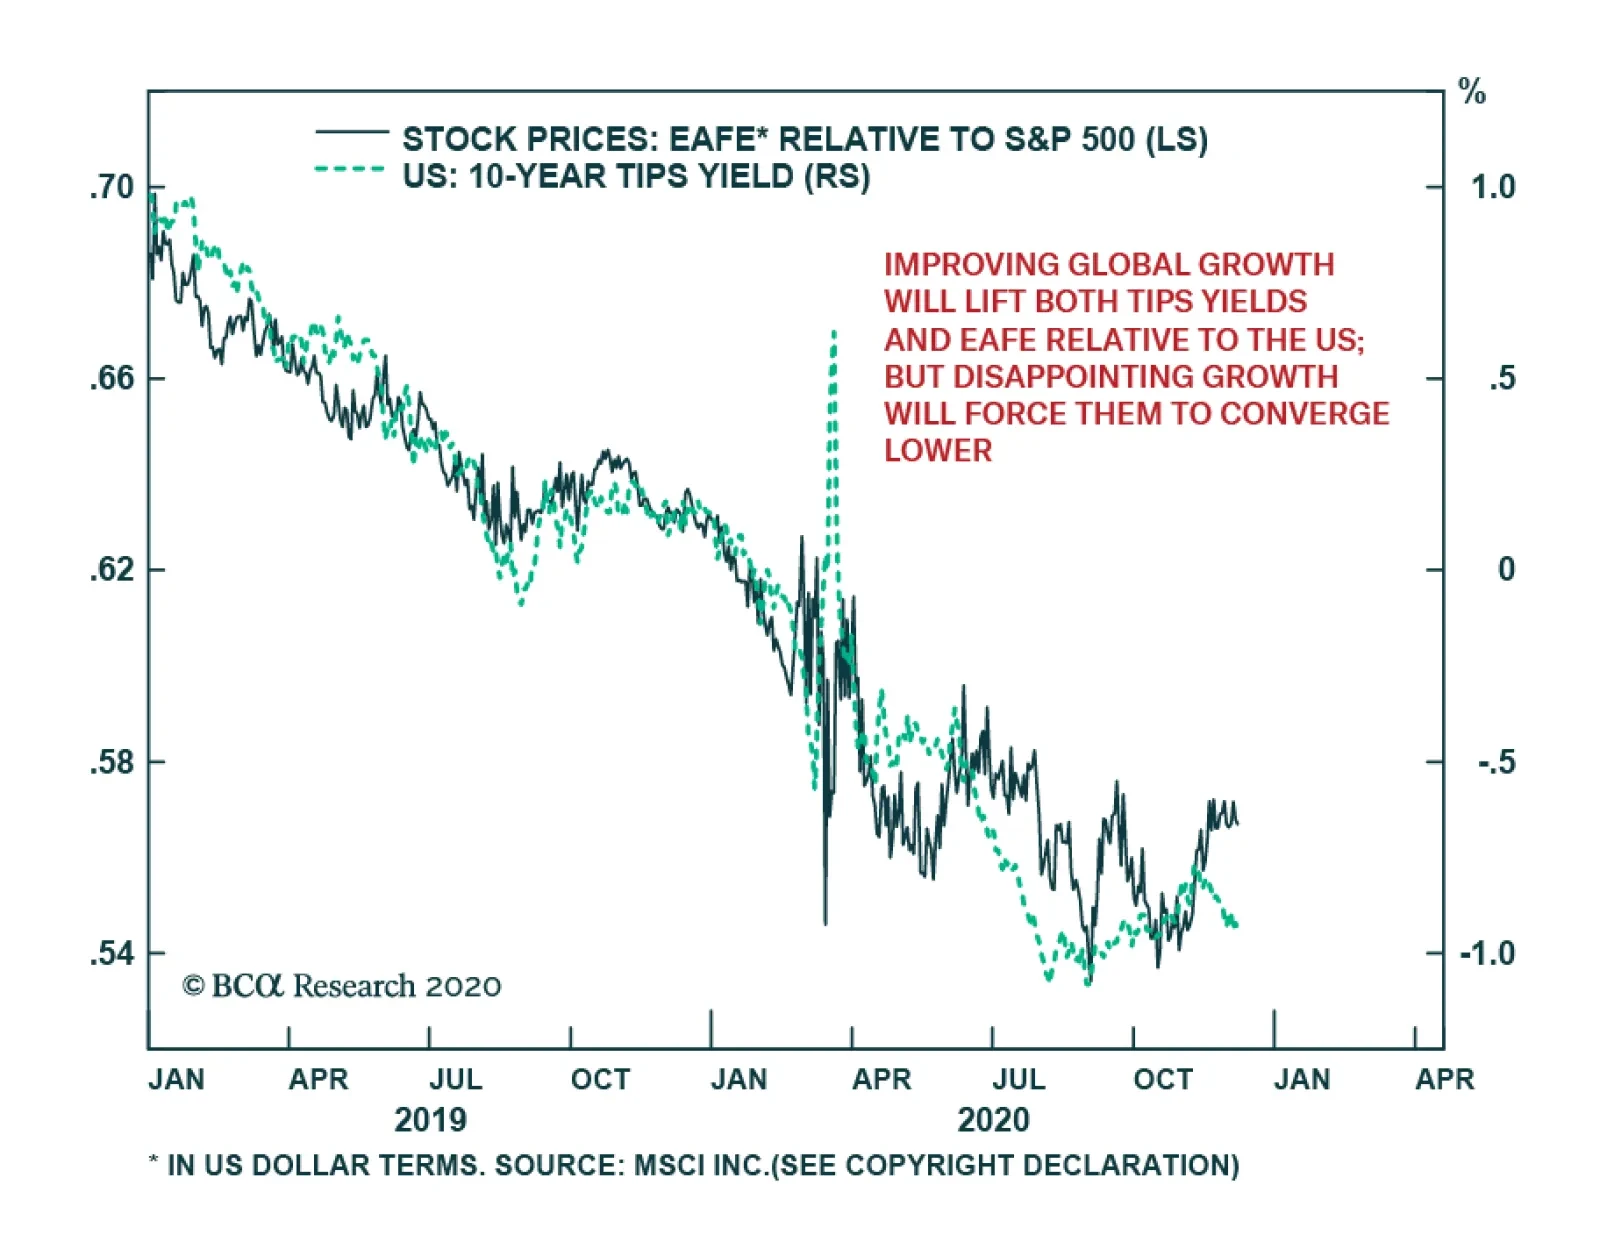
Over the past two years, the performance of EAFE equities relative to the US has tightly followed real bond yields. This is because both the relative performance of foreign equities and real interest rates are extremely sensitive to the global economic…

2020 will soon be history and on the eve of the New Year, it is instructive to update our presidential cycle and SPX returns research. Encouragingly, still elevated policy uncertainty will likely continue to recede next year and act as a tonic to equity returns. The chart shows the S&P 500’s performance in the first year of a presidential cycle. The market rallies 8% and 6% on a median and average basis, respectively. With regard to the range of outcomes, since 1952 the healthiest rally can net more than 30% in gains, while bear markets have also pushed SPX returns down 30%. Our sense is that 2021 will turn out to resemble 2013 or 2017 rather than 2001 or 2009. Currently, our end-2021 SPX 4,000 target (first introduced in our November 9 Special Report) represents a 17% gain from the Election Day and falls within the historical return norm. Bottom Line: Our cyclically sanguine broad equity market view remains intact.
New Presidential Cycle Begins
New Presidential Cycle Begins
Highlights Chart 1Bond Yields & The CRB/Gold Ratio
Bond Yields & The CRB/Gold Ratio
Bond Yields & The CRB/Gold Ratio
In our last report of November, we noted that the rising COVID case count was likely to lead to a challenging few months for the US economy, but we also questioned whether financial markets would pay attention or whether they would stay focused on the vaccine roll-out and eventual economic recovery. We now have our answer. November’s employment report was the worst since April, but the Treasury curve has bear-steepened, credit spreads have come in and TIPS have outperformed nominals. What’s more, the jump in the CRB Raw Industrials / Gold ratio suggests that the 10-year Treasury yield has even more near-term upside (Chart 1). With a vaccine on the horizon and Congress closing in on a fiscal relief package, investors should stay positioned for the reflation trade on a 6-12 month horizon: below-benchmark portfolio duration, nominal and real yield curve steepeners, inflation curve flatteners, overweight TIPS versus nominals and overweight corporate bonds rated Ba and higher. Feature Investment Grade: Overweight Investment grade corporate bonds outperformed the duration-equivalent Treasury index by 233 basis points in November, bringing year-to-date excess returns up to -74 bps. The strong rally in corporate bonds since March has culminated in extremely tight valuations for investment grade corporates. The 12-month breakeven spread for the Bloomberg Barclays Corporate Index (adjusted to keep the average credit rating constant) has only been tighter 4% of the time since 1995 (Chart 2). The same figure for the Baa-rated credit tier is 5%. We retain a positive outlook on corporate credit despite these stretched valuations. In our view, an environment where the economy is recovering and where the Fed will be very cautious about scaling back accommodation is the exact sort of environment where we should expect a lot of enthusiasm for spread product and, as a result, extremely tight spreads. We will not be surprised if our 12-month breakeven spread percentile rank valuation measure reaches its all-time expensive level within the next couple of months. While the macro environment makes it difficult to turn negative on investment grade corporates, we acknowledge that other sectors may offer better opportunities, particularly in the higher credit tiers. Specifically, we find better value in tax-exempt municipal bonds than in corporates and recommend that investors favor the former over the latter. At the sector level, we continue to recommend overweight allocations to subordinate Bank bonds, Healthcare and Energy bonds. We also advise underweight allocations to Technology and Pharmaceutical bonds. Chart 2Investment Grade Market Overview
Investment Grade Market Overview
Investment Grade Market Overview
Table 3ACorporate Sector Relative Valuation And Recommended Allocation*
Stay Positioned For Reflation
Stay Positioned For Reflation
Table 3BCorporate Sector Risk Vs. Reward*
Stay Positioned For Reflation
Stay Positioned For Reflation
High-Yield: Neutral High-Yield outperformed the duration-equivalent Treasury index by 382 basis points in November, bringing year-to-date excess returns up to -5 bps. After last month’s strong outperformance, Ba-rated junk bonds are now beating duration-equivalent Treasuries by 267 bps, year-to-date. The B and Caa credit tiers are lagging by 179 bps and 548 bps, respectively. We still view Ba-rated junk bonds as the sweet spot within the corporate credit space. The sector is relatively insulated from default risk and yet still offers a sizeable spread pick-up over investment grade corporates (Chart 3). We remain underweight B-rated and lower junk bonds for now as those securities are pricing-in a relatively optimistic outlook for the default rate. But, an imminent vaccine roll-out makes that outlook appear more realistic and we could soon upgrade the lower-rated junk credit tiers when we think the value is exhausted in the Ba-rated and higher securities. Looking at value for the junk index as a whole, we see that the index is pricing-in a default rate of 3% for the next 12 months, significantly below the 8.3% that was observed during the most recent 12-month period (panel 3). However, only four corporate issuers defaulted in October down from a monthly peak of 22 in July. Job cut announcements, an excellent indicator of the default rate, are also falling rapidly (bottom panel). At the sector level, we advise overweight allocations to high-yield Technology and Energy bonds. We are underweight the Healthcare and Pharmaceutical sectors. Chart 3High-Yield Market Overview
High-Yield Market Overview
High-Yield Market Overview
MBS: Underweight Mortgage-Backed Securities underperformed the duration-equivalent Treasury index by one basis point in November, dragging year-to-date excess returns down to -39 bps. The conventional 30-year MBS index option-adjusted spread (OAS) tightened 1 bp on the month, and it currently sits at 64 bps (Chart 4). This is significantly higher than the 59 bps offered by Aa-rated corporate bonds, the 53 bps offered by Agency CMBS and the 25 bps offered by Aaa-rated consumer ABS. Despite the relatively attractive OAS, we continue to view the elevated primary mortgage spread as a risk for MBS investors. It suggests that mortgage rates need not rise alongside Treasury yields in the near-term, meaning that mortgage refinancings can continue at their current rapid pace (panel 3). All else equal, this elevated refinancing activity will pressure MBS spreads wider. The recent spike in the mortgage delinquency rate does not pose a near-term risk to spreads as it is being driven by households that have been granted forbearance from the federal government (panel 4). The risk for MBS holders only comes into play if many households are unable to resume their regular mortgage payments when the forbearance period expires early next year. But even in that case, further government intervention to either support household incomes or extend the forbearance period would mitigate the risk. Chart 4MBS Market Overview
MBS Market Overview
MBS Market Overview
Government-Related: Underweight The Government-Related index outperformed the duration-equivalent Treasury index by 64 basis points in November, bringing year-to-date excess returns up to -222 bps. Sovereign debt outperformed duration-equivalent Treasuries by 157 bps on the month, bringing year-to-date excess returns up to -269 bps. Foreign Agencies outperformed the Treasury benchmark by 46 bps in November, bringing year-to-date excess returns up to -647 bps. Local Authority debt outperformed Treasuries by 139 bps in November, bringing year-to-date excess returns up to -228 bps. Domestic Agency bonds outperformed by 10 bps, bringing year-to-date excess returns up to -23 bps. Supranationals outperformed by 9 bps, bringing year-to-date excess returns up to +2 bps. US dollar weakness is usually a boon for Emerging Market (EM) Sovereign and Foreign Agency returns. However, this year’s dollar weakness has occurred mostly relative to other Developed Market currencies (Chart 5). Value has improved somewhat for EM Sovereigns during the past few weeks, but the index continues to offer less spread than the Baa-rated US Credit index (panel 4). At the country level, Turkey, Colombia, Mexico, Russia and South Africa are the only countries that offer a spread pick-up relative to duration and quality-matched US corporates. Of those, only Mexico looks attractive on a risk/reward basis. Chart 5Government-Related Market Overview
Government-Related Market Overview
Government-Related Market Overview
Municipal Bonds: Overweight Municipal bonds outperformed the duration-equivalent Treasury index by 130 basis points in November, bringing year-to-date excess returns up to -340 bps (before adjusting for the tax advantage). Municipal bond spreads tightened sharply relative to both Treasuries and Corporates in November, but they remain exceptionally attractive relative to history (Chart 6). In fact, as we showed in a recent report, the Bloomberg Barclays Revenue Bond index offers a greater yield than the quality-matched Credit index across the entire maturity spectrum (before adjusting for the tax advantage).1 This is also true for the Bloomberg Barclays General Obligation (GO) index beyond the 12-year maturity point. Eight-to-twelve-year maturity GO bonds trade only 1 basis point through the Credit index, implying a breakeven effective tax rate of 4%. Six-to-eight-year maturities trade 11 bps through the Credit index, implying a breakeven effective tax rate of 16%. Extraordinary valuation is the main reason for our recommendation to overweight municipal bonds. The severe ongoing state & local government credit crunch is a concern, but it is a risk we are willing to take. It now looks possible that a relief package containing some federal funds for state & local governments will be passed before the end of the year. This would alleviate a lot of the concern. But even in the absence of federal assistance, the combination of austerity measures (bottom panel) and all-time high State Rainy Day Fund balances should help stave off a wave of municipal downgrades. Chart 6Municipal Market Overview
Municipal Market Overview
Municipal Market Overview
Treasury Curve: Buy 5-Year Bullet Versus 2/10 Barbell The Treasury curve bull-flattened in November, but then bear-steepened sharply during the first week of December. All told, the 2/10 Treasury slope is currently 81 bps, 7 bps steeper than at the end of October. The 5/30 Treasury slope is 131 bps, 4 bps steeper than at the end of October. Our expectation is that continued economic recovery will cause investors to price-in eventual monetary tightening at the long-end of the Treasury curve. With the Fed maintaining a firm grip on the front end, this will lead to Treasury curve bear steepening. A timely vaccine roll-out and/or further fiscal stimulus will speed this process up. We recommend positioning for a steeper curve by owning the 5-year Treasury note and shorting a duration-matched barbell consisting of the 2-year note and 10-year notes. This position is designed to profit from 2/10 curve steepening. Valuation is a concern with our recommended steepener, as the 5-year yield is below the yield on the duration-matched 2/10 barbell (Chart 7). However, the 5-year looked much more expensive during the last zero-lower-bound period between 2010 and 2013 (bottom 2 panels). We anticipate a return to similar levels. Chart 7Treasury Yield Curve Overview
Treasury Yield Curve Overview
Treasury Yield Curve Overview
TIPS: Overweight TIPS outperformed the duration-equivalent nominal Treasury index by 70 basis points in November, bringing year-to-date excess returns up to -23 bps. The 10-year and 5-year/5-year forward TIPS breakeven inflation rates rose 8 bps and 5 bps on the month. They currently sit at 1.91% and 1.96%, respectively. Core CPI was flat in October and the year-over-year rate dropped from 1.73% to 1.63%. The 12-month trimmed mean CPI fell even more – from 2.37% to 2.22% – so the gap between core and trimmed mean inflation continued to narrow (Chart 8). We expect further narrowing in the months ahead, and therefore expect core CPI to come in relatively hot. For this reason, we recommend maintaining an overweight allocation to TIPS versus nominal Treasuries for the time being, even though the 10-year TIPS breakeven rate is now somewhat expensive according to our Adaptive Expectations Model (panel 2).2 Inflation pressures may moderate once core and trimmed mean inflation measures converge, and this could give us an opportunity to tactically reduce TIPS exposure sometime next year. We also recommend holding real yield curve steepeners and inflation curve flatteners. With the Fed now officially targeting an overshoot of its 2% inflation goal, we would expect the cost of 2-year inflation protection to rise above the cost of 10-year inflation protection (panel 4). With the Fed also exerting more control over short-dated nominal yields than over long-term ones, we expect that short-maturity real yields will come under downward pressure relative to the long end (bottom panel). Chart 8TIPS Market Overview
TIPS Market Overview
TIPS Market Overview
ABS: Overweight Asset-Backed Securities outperformed the duration-equivalent Treasury index by 11 basis points in November, bringing year-to-date excess returns up to +82 bps. Aaa-rated ABS outperformed the Treasury benchmark by 10 bps on the month, bringing year-to-date excess returns up to +68 bps. Non-Aaa ABS outperformed by 17 bps, bringing year-to-date excess returns up to +174 bps (Chart 9). On paper, the Treasury department’s decision to let the Term Asset-Backed Loan Facility (TALF) expire at the end of the year is quite negative for ABS. However, as we explained in a recent report, we don’t expect a material impact on spreads.3 For one thing, Aaa ABS spreads are already well below the borrowing cost offered by TALF. But more importantly, consumer credit quality remains quite robust. As we first explained back in June, the stimulus received from the CARES act led to a significant increase in disposable income and a jump in the savings rate (panel 4).4 Faced with an income boost and few spending opportunities, many households took the opportunity to pay down consumer debt. Granted, further income support from Congress is needed now that the CARES act’s enhanced unemployment benefits have expired. But given the substantial boost to savings that has already occurred, we are confident that more stimulus will arrive in time to prevent a wave of consumer bankruptcies. Chart 9ABS Market Overview
ABS Market Overview
ABS Market Overview
Non-Agency CMBS: Neutral Chart 10CMBS Market Overview
CMBS Market Overview
CMBS Market Overview
Non-Agency Commercial Mortgage-Backed Securities outperformed the duration-equivalent Treasury index by 85 basis points in November, bringing year-to-date excess returns up to -168 bps. Aaa Non-Agency CMBS outperformed Treasuries by 71 bps on the month, bringing year-to-date excess returns up to -2 bps. Non-Aaa Non-Agency CMBS outperformed by 127 bps, bringing year-to-date excess returns up to -620 bps (Chart 10). We continue to recommend an overweight allocation to Aaa-rated Non-Agency CMBS and an underweight allocation to non-Aaa CMBS. Even with the imminent expiry of TALF, Aaa CMBS spreads are already well below the cost of borrowing through TALF and thus will not be negatively impacted.5 Meanwhile, the structurally challenging environment for commercial real estate could lead to problems for lower-rated CMBS (panels 3 & 4). Agency CMBS: Overweight Agency CMBS outperformed the duration-equivalent Treasury index by 38 basis points in November, bringing year-to-date excess returns up to +55 bps. The average index spread tightened 6 bps on the month. It currently sits at 53 bps, above typical historical levels (bottom panel). At its September meeting, the Fed decided to slow its pace of Agency CMBS purchases. It is no longer looking to increase its Agency CMBS holdings, but rather, it is only purchasing what is “needed to sustain smooth market functioning”. This is nonetheless a Fed back-stop of the market, and it does not change our overweight recommendation. Appendix A: Buy What The Fed Is Buying The Fed rolled out a number of aggressive lending facilities on March 23. These facilities focused on different specific sectors of the US bond market. The fact that the Fed has decided to support some parts of the market and not others has caused some traditional bond market correlations to break down. It has also led us to adopt of a strategy of “Buy What The Fed Is Buying”. That is, we favor those sectors that offer attractive spreads and that benefit from Fed support. The below Table tracks the performance of different bond sectors since the March 23 announcement. We will use this to monitor bond market correlations and evaluate our strategy’s success. Table Performance Since March 23 Announcement Of Emergency Fed Facilities
Stay Positioned For Reflation
Stay Positioned For Reflation
Appendix B: Butterfly Strategy Valuations The following tables present the current read-outs from our butterfly spread models. We use these models to identify opportunities to take duration-neutral positions across the Treasury curve. The following two Special Reports explain the models in more detail: US Bond Strategy Special Report, “Bullets, Barbells And Butterflies”, dated July 25, 2017, available at usbs.bcaresearch.com US Bond Strategy Special Report, “More Bullets, Barbells And Butterflies”, dated May 15, 2018, available at usbs.bcaresearch.com Table 4 shows the raw residuals from each model. A positive value indicates that the bullet is cheap relative to the duration-matched barbell. A negative value indicates that the barbell is cheap relative to the bullet. Table 4Butterfly Strategy Valuation: Raw Residuals In Basis Points (As Of December 4TH, 2020)
Stay Positioned For Reflation
Stay Positioned For Reflation
Table 5 scales the raw residuals in Table 4 by their historical means and standard deviations. This facilitates comparison between the different butterfly spreads. Table 5Butterfly Strategy Valuation: Standardized Residuals (As Of December 4TH, 2020)
Stay Positioned For Reflation
Stay Positioned For Reflation
Table 6 flips the models on their heads. It shows the change in the slope between the two barbell maturities that must be realized during the next six months to make returns between the bullet and barbell equal. For example, a reading of 70 bps in the 5 over 2/10 cell means that we would only expect the 5-year to outperform the 2/10 if the 2/10 slope steepens by more than 70 bps during the next six months. Otherwise, we would expect the 2/10 barbell to outperform the 5-year bullet. Table 6Discounted Slope Change During Next 6 Months (BPs)
Stay Positioned For Reflation
Stay Positioned For Reflation
Appendix C: Excess Return Bond Map The Excess Return Bond Map is used to assess the relative risk/reward trade-off between different sectors of the US bond market. It is a purely computational exercise and does not impose any macroeconomic view. The Map’s vertical axis shows 12-month expected excess returns. These are proxied by each sector’s option-adjusted spread. Sectors plotting further toward the top of the Map have higher expected returns and vice-versa. Chart 11Excess Return Bond Map (As Of December 4TH, 2020)
Stay Positioned For Reflation
Stay Positioned For Reflation
Our novel risk measure called the “Risk Of Losing 100 bps” is shown on the Map’s horizontal axis. To calculate it, we first compute the spread widening required on a 12-month horizon for each sector to lose 100 bps or more relative to a duration-matched position in Treasury securities. Then, we divide that amount of spread widening by each sector’s historical spread volatility. The end result is the number of standard deviations of 12-month spread widening required for each sector to lose 100 bps or more versus a position in Treasuries. Lower risk sectors plot further to the right of the Map, and higher risk sectors plot further to the left. Ryan Swift US Bond Strategist rswift@bcaresearch.com Footnotes 1 Please see US Bond Strategy Weekly Report, “Political Risk Will Dominate In A Pivotal Month For The Bond Market”, dated October 13, 2020, available at usbs.bcaresearch.com 2 For more details on our model please see US Bond Strategy Weekly Report, “How Are Inflation Expectations Adapting?”, dated February 11, 2020, available at usbs.bcaresearch.com 3 Please see US Bond Strategy Weekly Report, “Preparing For A Dark Winter … But Do Markets Care?”, dated November 24, 2020, available at usbs.bcaresearch.com 4 Please see US Bond Strategy Weekly Report, “No Holding Back”, dated June 16, 2020, available at usbs.bcaresearch.com 5 Please see US Bond Strategy Weekly Report, “Preparing For A Dark Winter … But Do Markets Care?”, dated November 24, 2020, available at usbs.bcaresearch.com Fixed Income Sector Performance Recommended Portfolio Specification Corporate Sector Relative Valuation And Recommended Allocation

The euro area is likely to experience a contraction in economic activity in the 4th quarter of 2020, but there is hope this deterioration is already passing. The decline in activity highlighted by the Google Mobility Trend data is a direct…
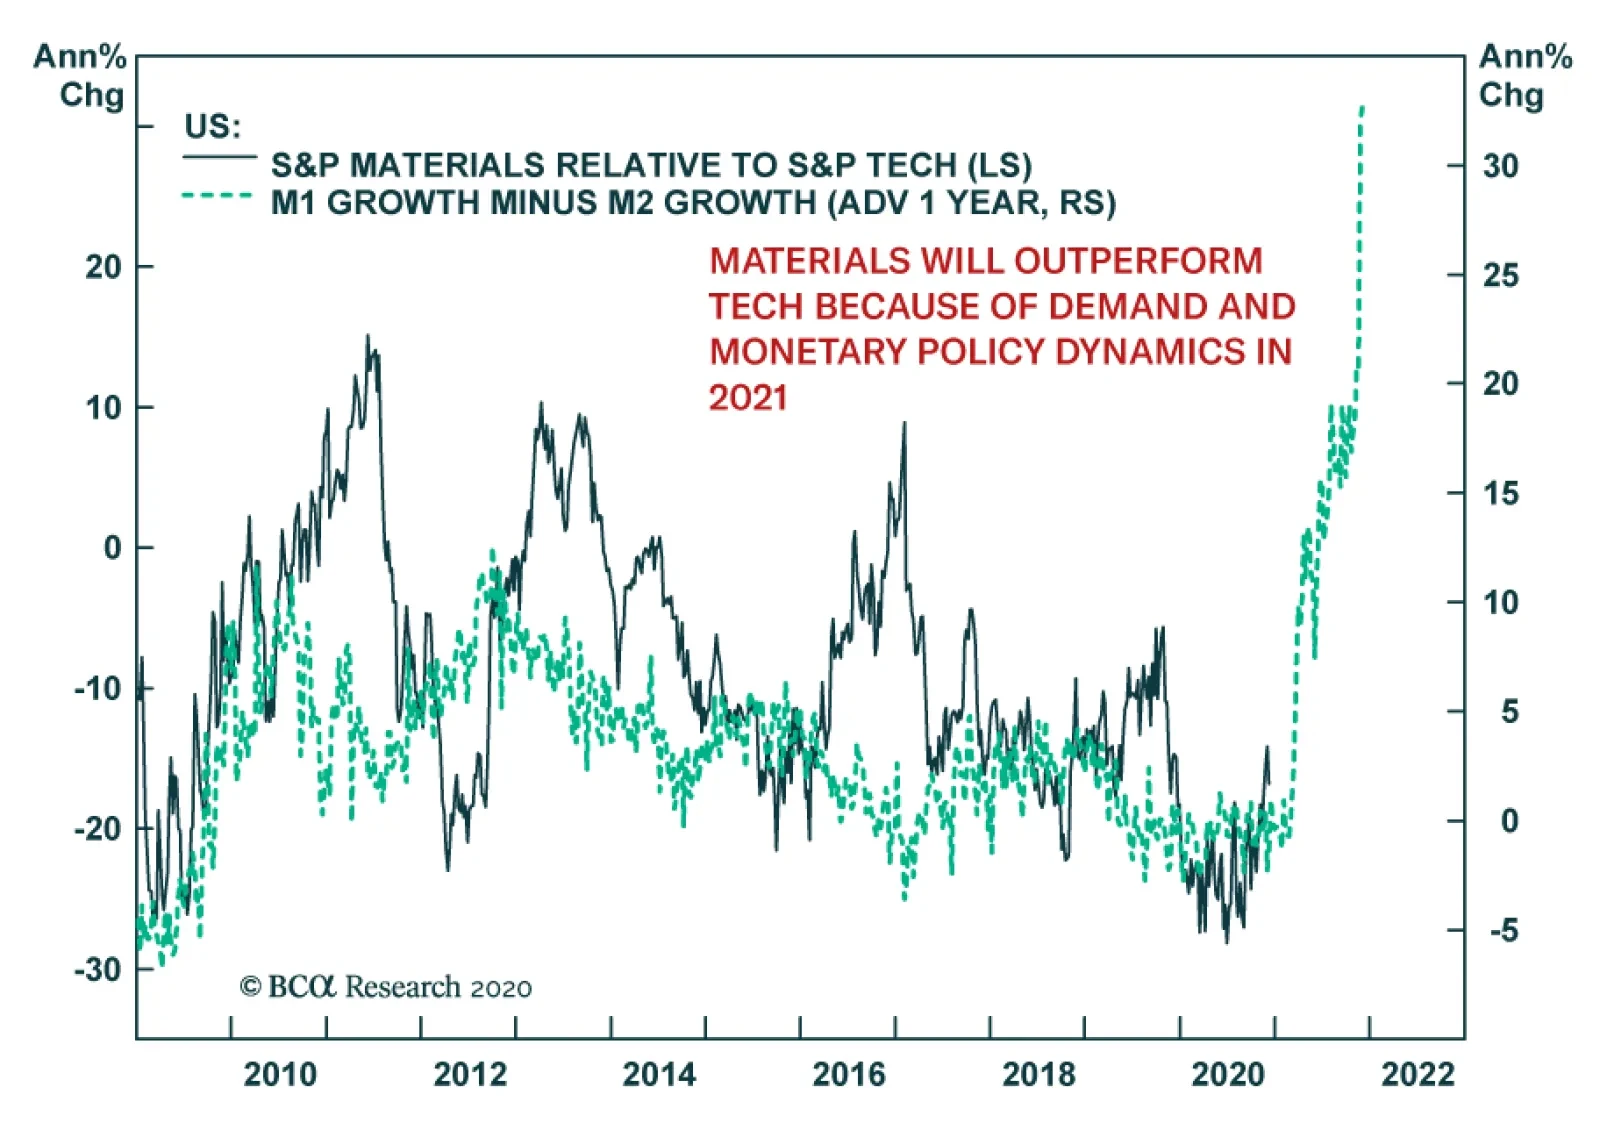
Historically, both materials and tech stocks are classified as cyclical sectors. This year, tech equities have followed the business cycle a lot less closely than material equities, as demand for tech goods and services surged during the first wave of the…
BCA Research’s US Equity Strategy service recommends that investors go long the VIX June 2021 futures as a small hedge to protect long equity positions. We want to hedge our overweight exposures with a long VIX futures position for the June 16, 2021…
Dear client, Next Monday December 14, 2020 we will be hosting our last webcasts for the year “From Alpha To Omega With Anastasios”, one at 10am EST for our US, European and Middle Eastern clients and one at 8pm EST for our Asia Pacific, Australia and New Zealand clients; our final weekly publication for 2020 will be on Monday December 21, 2020 where we will highlight our top charts of the past year. Kind Regards, Anastasios Highlights Portfolio Strategy Our high-conviction overweight calls comprise four “Back-To Work” beneficiaries, and a hedge. In marked contrast, all of our high-conviction underweights are focused on “COVID-19 Winners” that should lose some of their luster next year. Recent Changes Upgrade the S&P real estate sector to overweight, today. Feature Favorable Macro Backdrop Easy monetary and loose fiscal policies will remain intact and sustain flush liquidity conditions next year. As a result, the global economy will continue to gain traction. Importantly, early-August marked a critical economic inflection point. Gold prices peaked and 10-year real and nominal yields troughed (yields shown inverted, top & middle panels, Chart 1). The bullion and bond markets corroborated the economic recovery that equities and the ISM manufacturing surveys sniffed out in late-spring. This is important for cementing the bull market in equities which is predicated on a durable economic recovery. In other words, the rise in real yields serves as a green light for further stock gains as it signals that the economy is on the recovery path. The bottom panel of Chart 1 also highlights that non-US equity markets started sporting accelerating profit growth expectations in August. Eurozone and other ex-US bourses zoomed past the US EPS growth trajectory as the latter reached a plateau. Chart 1Inflection Point
Inflection Point
Inflection Point
This gives us confidence that 2021 will be a bumper year for SPX profits and help carry the market higher near our 4,000 target. As a reminder, on November 9 in a Special Report, we lifted our EPS estimate to $168 for calendar 2021 and introduced an end-2021 SPX target of 4,000 (Chart 2). Chart 2Earnings Will Do The Heavy Lifting In 2021
Earnings Will Do The Heavy Lifting In 2021
Earnings Will Do The Heavy Lifting In 2021
Two Risks To Monitor Nevertheless, the bond market represents a risk to our sanguine equity market view. Simply put, if the 10-year US Treasury yield stalls, then it will also stop the rotation trade in its tracks. The budding improvement in the Chinese and EM economic cycles will likely be sustainable next year, consistent with the Chinese four-year cycles of the past twenty years (Chart 3). Each up-cycle has typically been driven by credit expansion and capital spending, on the back of fiscal and monetary easing. These conditions are in place once again. Chart 3Follow The Chinese Four-year Cycle
Follow The Chinese Four-year Cycle
Follow The Chinese Four-year Cycle
We recently showed that China’s fiscal easing will likely continue to grease the wheels of global trade into mid-2021 and thus debase the greenback (Chart 4), but will likely run out of steam in the back half of next year. Thus, China’s reflation going on hiatus is another key risk we will monitor in 2021 that could serve as a growth scare catalyst and reset stocks. Chart 4Laggard Deep Cyclicals Have The Upper Hand
Laggard Deep Cyclicals Have The Upper Hand
Laggard Deep Cyclicals Have The Upper Hand
Year In Review 2020 is a year to forget as far as the coronavirus human toll is concerned; the economic and EPS recessions, while short lived, were deep. The COVID-19-inflicted wounds, especially to services industries the world over, were deep and there will be severe scarring. Early in the year, equities felt the COVID-19 tremor and collapsed 35% from the February 19 highs, but extremely aggressive monetary and fiscal policy responses filled the void and were the dominant themes in the ensuing recovery that saw the SPX vault to all-time highs. Our portfolio was resilient and was able to absorb the COVID-19 shock as we were bulletproofing it in the back half of 2019 and early-2020 for a recession owing largely to the yield curve inversion. Importantly, we were not dogmatic and on March 16 we turned cyclically bullish. This eventually culminated into the March 23 Strategy Report where we penned 20 reasons to start buying stocks and coincided with the trough in the SPX. This cyclical shift in our view from bearish-to-bullish aided our portfolio performance as we started adding cyclical exposure and trimming defensive exposure in order to benefit from the immense monetary and fiscal policy responses. Early on, we deemed these macro forces were forceful enough to really turn things around and we remained bullish on a cyclical time horizon. All in all, our trades produced alpha to the tune of 425bps. While our pair trades were sub-par (as is custom we are closing the remaining today), our high-conviction trades and cyclical portfolio moves recorded solid gains (please see the final tally below). Ray Of Light Encouragingly, there is light at the end of the tunnel, as a number of vaccines will become available late this year and/or early in 2021. This is great news for the economy and for stocks. We have positioned the portfolio to benefit from the reopening of the economy and the vaccine will act as an accelerant as our flagship publication posited last week while documenting BCA’s upbeat Outlook for 2021. Our portfolio enjoys a cyclical-over-defensive bent, has a small cap bias and we remain committed to the “Back-To-Work” basket versus the “COVID-19 Winners” basket (Chart 5). In the short-term, equities have discounted a lot of good news, which is likely to steal from next year’s returns. However, as populations get inoculated and large parts of the global economy reopen, a virtuous cycle of increasing consumer and business confidence would boost investment and GDP and prove a boon for corporate profits. Already the rally is broadening out with the value line arithmetic and geometric indexes outshining the SPX (Chart 6). An active ETF (RVRS:US) that has a reverse weighting to US large caps is also besting the S&P 500 and signals that more gains are in store in the New Year, especially for the still beaten down deep cyclical laggards. Chart 5Stick With The Reopening Trade
Stick With The Reopening Trade
Stick With The Reopening Trade
Chart 6Rally Is Broadening Out, And That’s Healthy
Rally Is Broadening Out, And That’s Healthy
Rally Is Broadening Out, And That’s Healthy
More Overweights Than Underweights As is custom every year, this Strategy Report introduces our high-conviction calls for 2021. This year we have four overweights, a bonus volatility trade on the long side, three underweights, and a bonus structural trade that we add to our trades of the decade first introduced in mid-December 2019. Our overweights comprise three “Back-To-Work” beneficiaries, a great rotation trade and a hedge. All of our underweights are focused on “COVID-19 Winners” that should lose some of their luster next year. Finally, this year we take a page out of Byron Wien’s annual “10 surprises” list and offer our clients three “also rans”, which got close but ultimately failed to make our high-conviction list. Anastasios Avgeriou US Equity Strategist anastasios@bcaresearch.com Overweight Hotels (Back-To-Work Theme) The recent positive vaccine news is a key reason we are warming up to this consumer discretionary sub group. While neither lodging nor cruise line vacationing will return to their previous peaks any time soon, both industries will survive and thus should no longer be priced for bankruptcy. One key industry demand determinant is confidence. Consumer sentiment has staged a W-shaped recovery. It is still flimsy, but the vaccine efficacy news should catapult confidence higher in the coming quarters. The implication is that the wide gulf between consumer confidence and relative share prices will narrow via a catch up phase in the latter (top panel, Chart 7). Moreover, the ISM non-manufacturing survey is on a sling shot recovery following the bombed out spring readings. This rebound also suggests that the path of least resistance is higher for lodging stocks (second panel, Chart 7). Our hotel demand indicator does an excellent job in encapsulating all these different forces and forecasts an enticing lodging services demand backdrop into 2021 (third panel, Chart 7). Already, consumer outlays on hotels are staging a comeback, albeit from an extremely depressed level. The upshot is that an earnings-led bounce is in the cards (fourth panel, Chart 7). Finally, washed out technicals and extremely alluring valuations provide an attractive reward/risk tradeoff at the current juncture (bottom panel, Chart 7). Bottom Line: The S&P hotels, resorts & cruise lines index is a high-conviction overweight. The ticker symbols for the stocks in this index are: BLBG: S5HOTL – MAR, HLT, CCL, RCL, NCLH. Chart 7Buy Hotels
Buy Hotels
Buy Hotels
Overweight Real Estate (Back-To-Work Theme) Boost the S&P real estate sector all the way to overweight today, in order to benefit from the looming full reopening of the economy on the back of the vaccine’s arrival. We have been bearish this niche S&P sector and delivered alpha to our portfolio both via the cyclical and high-conviction underweights this year. Nevertheless, we do not want to overstay our welcome and the time is ripe for a bullish commercial real estate (CRE) stance. The bearish story is well known, but some bullish undertones are widely neglected. The rebound in relative share prices is substantially trailing the 2009 episode, when REITs outshined the SPX by 65% one year following the March 2009 trough. Currently, on a similar SPX advance from the March 2020 lows, REITs are lagging the S&P 500 by 22% (top panel, Chart 8). As large parts of CRE have been at the epicenter of the pandemic, any return to even semi-normalcy in 2021 should see these beaten down stocks sling shot passed the SPX. When the fiscal package finally passes, it will likely serve as a fresh reflationary bridge to support the economy. The proverbial “kicking the can down the road” will thus lift some uncertainty hanging over CRE landlords receiving rents and also via banks not foreclosing distressed properties which would have further depressed CRE prices. CRE prices will likely recover in the New Year as vulture funds and opportunistic investors are already bargain hunting. Tack on the likely refinancing lifeline bankers will extend to CRE debt originators (middle & bottom panels, Chart 8) and such a backdrop will loosen the noose around distressed property landlords. Bottom Line: Boost the S&P real estate sector to an above benchmark allocation and add it to the high-conviction overweight call list. Chart 8Upgrade Real Estate To Overweight
Upgrade Real Estate To Overweight
Upgrade Real Estate To Overweight
Overweight Industrials (Back-To-Work Theme) Add the S&P industrials sector to the high-conviction overweight list. Emerging markets (EM) and China represent the key source for the sector’s buoyancy. The EM manufacturing PMI clocking in at 53.9 hit an all-time high (top panel, Chart 9). China’s PMIs are also on a similar trajectory, and the Chinese Citi economic surprise index has swung a whopping 277 points from -239 to +38 over the past nine months (second panel, Chart 9). The upshot is that US industrials stocks should outperform when China and the EM are vibrant. Peering over to the currency market, the debasing of the US dollar should also underpin industrials stocks via the export relief valve. A depreciating greenback also lifts the commodity complex and hence industrials equities that are levered to the extraction of commodities and other derivative activities (middle panel, Chart 9). Capex intentions are firming and CEO confidence is upbeat for the coming six months. The ISM manufacturing new orders-to-inventories ratio is corroborating the budding recovery in the soft data. Green shoots are also evident in hard data releases. Durable goods orders are on the verge of expanding anew (fourth panel, Chart 9). Sell-side analysts have never been more pessimistic with regard to the sector’s long-term EPS growth rate that is penciled in to trail the broad market by almost 800bps (bottom panel, Chart 9)! This bearishness is contrarily positive as a little bit of good news can go a long way. Bottom Line: The S&P industrials sector is a high-conviction overweight. Chart 9Overweight Industrials
Overweight Industrials
Overweight Industrials
Overweight Small Caps At The Expense Of Large Caps (Rotation Trade) Recent vaccine efficacy announcements have paved the way for a sustainable great rotation trade into small caps and out of large caps. One of the key small size bias drivers is the delta in sector composition between the small and large cap indexes. The relative gap in deep cyclicals alone is 13% as we highlighted in recent research. Relative share prices remain far apart from the budding recovery in the commodity complex including Dr. Copper’s flirtations with seven-year highs. Thus, the small caps catch up phase has a long ways to go (top & fourth panels, Chart 10). The financials sector gulf is also significant, with small caps’ exposure relative to their large cap brethren clocking in at over 700bps. Already, the yield curve is steepening and there are high odds of a selloff in the bond market as the economy continues to reopen (third panel, Chart 10). In addition, easy fiscal policy is a tonic to the small/large share price ratio. As a flood of money enters the economy with a slight lag, small caps will continue to make up ground lost during the early stages of the pandemic (fiscal balance shown inverted, second panel, Chart 10). Not only is fiscal stimulus providing a lifeline to debt-burdened small caps, but also the Fed’s opening up of the monetary spigots has pushed fixed income investors out the risk spectrum. Thus, the proverbial “kicking the can down the road” is boosting the allure of small cap stocks (junk spread shown inverted, bottom panel, Chart 10). Bottom Line: A small size bias is a high-conviction call for 2021. Chart 10Prefer Small Caps To Large Caps
Prefer Small Caps To Large Caps
Prefer Small Caps To Large Caps
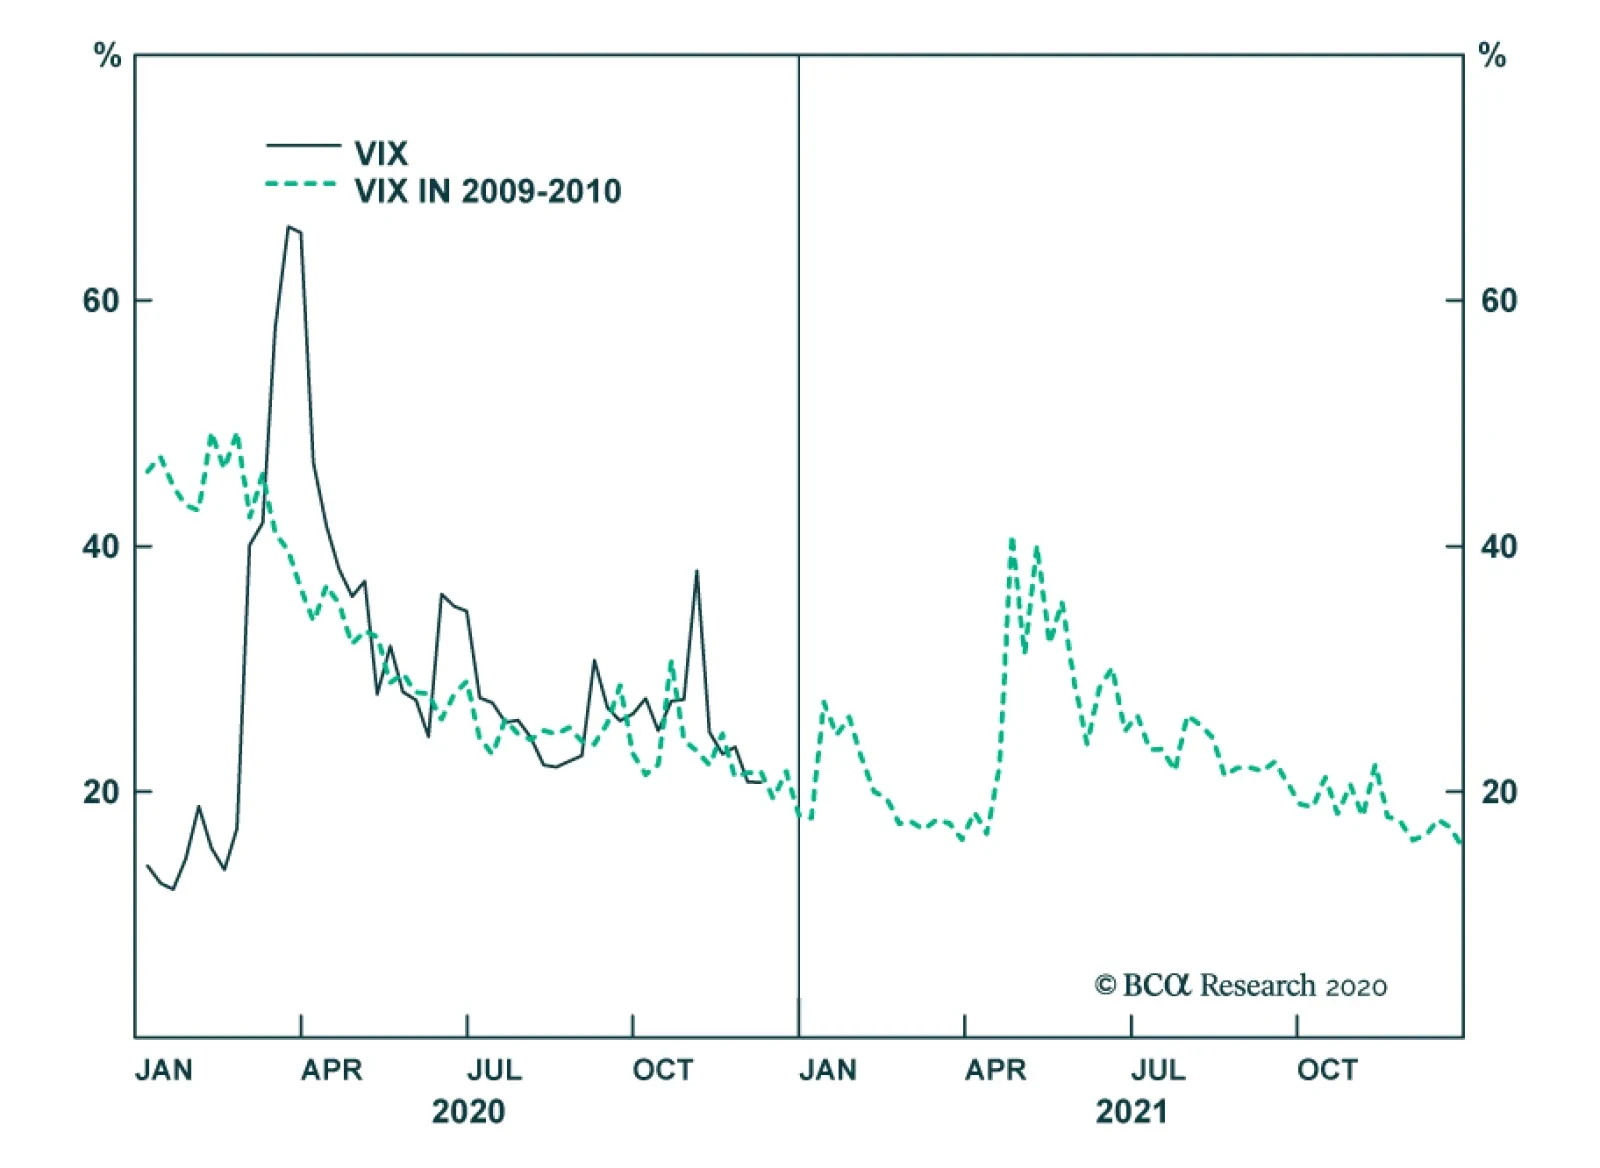
Long VIX June 2021 Expiry Futures (Hedge Trade) We want to hedge our overweight exposures with a long VIX futures position for the June 16, 2021 expiry. We are spending $25.3 to go long and are comfortable paying up for insurance when the SPX is at all-time highs and there is a risk of some growth disappointment in the next six months. Chart 11 draws a parallel with the March 2009 SPX lows and plots the VIX in 2009 and 2010. While the path of least resistance is lower for volatility, sporadic surges are typical in the year following recessions. The S&P 500 also troughed in March 2020 and if history is an accurate guide, the path to SPX 4,000 will be rocky next year. As a reminder, the S&P 500 suffered a 16% correction in May 2010 and the VIX spiked higher. Positioning remains lopsided with both VIX put/call ratios (volume and open interest) at historically high levels, underscoring investor complacency. Net speculative futures positions as a percent of open interest are also probing multi-year lows, corroborating the complacent options data. Finally, the equity volatility curve has flipped from a 10% backwardation to a steep contango in the past month with the 3rd month now trading at a 25% premium to spot VIX; such a complacent level typically warns of a looming spike in the VIX. Bottom Line: Go long the VIX June 2021 futures as a small hedge to overweight equity positions. Chart 11Go Long VIX Futures As A Hedge
Go Long VIX Futures As A Hedge
Go Long VIX Futures As A Hedge
Underweight Homebuilders (COVID-19 Winner Theme) We deem that most, if not all, of the good news (low mortgage rates, low inventories, high demand, work-from-home reality, all-time highs on the overall NAHB housing sentiment survey) is already priced in galloping homebuilders stock prices and exuberant expectations. While being contrarian is fraught with danger, because more often than not the herd is right, there is a key macro driver that gives us confidence to be bearish homebuilders: interest rates. If our economic reopening thesis proves accurate next year, then the COVID-19 winners – homebuilders included – will take the back seat. Historically, interest rates and relative share prices have been inversely correlated and a steep selloff in the bond market is bad news for homebuilding stocks (top panel, Chart 12). On the operating housing front, some cracks are forming. New home sales, while brisk in absolute terms, are losing out to existing housing sales and homebuilders have resorted to price concessions in order to drive volumes (second & third panels, Chart 12). Profit margins are at the highest level since the subprime crisis and are vulnerable to a squeeze, not only from lower selling prices, but also from rising input costs. Framing lumber comprises roughly 15% of a new home’s commodity related costs and lumber prices have been expanding all year long (bottom panel, Chart 12). Bottom Line: Put the S&P homebuilding index to the high-conviction underweight call list. The ticker symbols for the stocks in this index are: BLBG: S5HOME – LEN, PHM, DHI, NVR. Chart 12Avoid Homebuilders
Avoid Homebuilders
Avoid Homebuilders
Underweight Pharma (COVID-19 Winner Theme) The S&P pharmaceutical index is a high-conviction underweight for 2021. On the macro front, the Fed’s ZIRP bodes ill for defensive pharma equities. The Fed was uncharacteristically quick this recession to drop rates to the lower zero bound to reflate the economy. As a result, safe haven equities, Big Pharma included, typically trail the broad market as the economy gets out of the ER and into the recovery room (second panel, Chart 13). Importantly, relative pharmaceutical profits are highly counter cyclical: they rise at the onset of recession and collapse as the economy heals. Currently, as the world economy has transitioned to a V-shaped recovery, the reopening of the economy into the New Year will continue to knock the wind out of relative pharma profitability. Similarly, an appreciating greenback has historically been synonymous with pharma outperformance and vice versa (third panel, Chart 13). Keep in mind, Big Pharma make the lion’s share of their profits domestically, further cementing the positive correlation with the US dollar. This local profit sourcing represents one of the main reasons why politicians on both sides of the aisle are after domestic pharma profits. Pharma prices are on the cusp of contracting. Importantly, President Trump’s late-July executive order “to allow importation of certain prescription drugs from Canada” among other provisions is a direct blow to the profit prospects of Big Pharma (bottom panel, Chart 13). Bottom Line: We are cognizant that the COVID-19 vaccine will lift Big Pharma, but only temporarily, as cyclical forces will more than offset the positive vaccine news. The S&P pharmaceuticals index is a high-conviction underweight. The ticker symbols for the stocks in this index are: BLBG – S5PHARX: JNJ, PFE, MRK, LLY, BMY, ZTS, CTLT, MYL, PRGO. Chart 13Sell Pharma
Sell Pharma
Sell Pharma
Underweight Consumer Staples (COVID-19 Winner Theme) Countercyclical consumer staples stocks served their purpose and supported our portfolio in the front half of 2020. Now that vaccines are coming, we are adding the S&P consumer staples sector to the high-conviction underweight call list. The current macro backdrop underscores that the path of least resistance is lower for relative share prices. Not only is the ISM manufacturing survey on fire, but also, consumer confidence is forming a trough (ISM manufacturing shown inverted, second panel, Chart 14). One of the factors that will drive relative earnings lower is the weaker US dollar. As a reminder, the S&P consumer staples sector derives approximately 32% of its sales from abroad, which is 10 percentage points lower than the S&P 500. As a consequence, on a relative basis, staples stocks benefit much less than the rest of the market from a falling currency (third panel, Chart 14). Our relative macro earnings model does an excellent job in encapsulating all these moving parts and paints a dark profit picture for this GICS1 sector in the New Year (fourth panel, Chart 14). Bottom Line: The S&P consumer staples sector is a high-conviction underweight. Chart 14Underweight Consumer Staples
Underweight Consumer Staples
Underweight Consumer Staples
Short NASDAQ 100 / Long S&P 500 (Secular 10-year Call) We first wrote about the extreme market cap concentration in January when we were cautioning investors of an SPX drawdown and drew parallels with the dotcom era. Back in late-1999/early-2000 the top 5 stocks comprised 18% of the S&P 500. In July we delved deeper and split the S&P 500 in the S&P 5 versus the S&P 495 to highlight the extraordinary narrow returns since 2015. Such extreme concentration in a handful of tech titan stocks is clearly unsustainable. The bullish case for tech is well documented and understood; the COVID-19 pandemic acted as an accelerant to the technological adoption of the new remote working realities. However, $2tn valuations (AAPL, MSFT & AMZN) make little sense to us, especially if there is little earnings follow through and most of the returns are explained by multiple expansion. In all likelihood, the easy money has been made. Going back to the early 1970s is instructive in order to put the tech juggernaut into proper perspective. Every decade or so there have been clearly defined booms and busts in US tech stocks (Chart 15). Schumpeter’s “creative destruction” forces are undoubtedly at play. What is interesting is that not only have tech stocks likely stalled near the dotcom era peak, but also they have been outperforming since the end of the GFC (i.e. roughly a decade); they are due for at least a breather. If history rhymes, we have entered a new bust cycle and the tech sector’s underperformance will play out over the coming decade. Bottom Line: We are compelled to add to our structural trades and recommend investors underweight the tech sector on a ten-year time horizon via the short QQQ / long SPY exchange traded funds which offer the most liquidity. Chart 15Short QQQ / Long SPX For The Next Decade
Short QQQ / Long SPX For The Next Decade
Short QQQ / Long SPX For The Next Decade
Also Rans Within consumer discretionary, automobiles & auto parts & components piqued our interest from the long side. These stocks would greatly benefit from a reopening economy as a semblance of normality returns sometime next year. Nevertheless, two key factors kept us at bay. First, similar to homebuilders, this index has gone vertical since the March lows, besting the SPX by a factor of 2:1 (top panel, Chart 16). We maintain exposure via our “Back-To-Work” basket with GM, but even this auto manufacturer is up 50% since the September 8, 2020 inception. Finally, TSLA is about to enter the SPX at a stratospheric valuation that would dominate the automobile sub group. This is eerily reminiscent of YHOO’s SPX inclusion in late-1999 that led the dotcom bubble peak by four months. The parallel is making us nervous, therefore we are staying patiently on the sidelines. On the underweight side we wanted to include the niche S&P semi equipment index, but opted not to as the Bitcoin mania has really pushed these stocks to the stratosphere (middle panel, Chart 16). In addition, this chip sub-group has one of the highest export exposures in the SPX with a large slice of foreign revenue originating in China. Hence, news of a Biden presidency also served as a catalyst to propel them higher (i.e. at the margin, a less hawkish president on the Sino/American trade war). We really struggled with global gold miners (GDX:US). Our initial thinking was to downgrade them to underweight (from currently neutral), which is consistent with global growth reaccelerating and interest rates rising. However, we missed the boat when it set sail in early August (bottom panel, Chart 16). Now, the gold bearish trade is gaining momentum and has become a consensus trade as big macro investors (Tudor and Druckenmiller among others) are shifting toward Bitcoin and have been vociferous about their positioning. Thus, we preferred to remain on the sidelines with a benchmark allocation. Chart 16Three “Also Rans”
Three “Also Rans”
Three “Also Rans”
Footnotes Current Recommendations Current Trades Strategic (10-Year) Trade Recommendations
2021 High-Conviction Calls
2021 High-Conviction Calls
Size And Style Views October 26, 2020 Favor small over large caps July 27, 2020 Overweight cyclicals over defensives June 11, 2018 Long the BCA Millennial basket The ticker symbols are: (AAPL, AMZN, UBER, HD, LEN, MSFT, NFLX, SPOT, TSLA, V). January 22, 2018 Favor value over growth
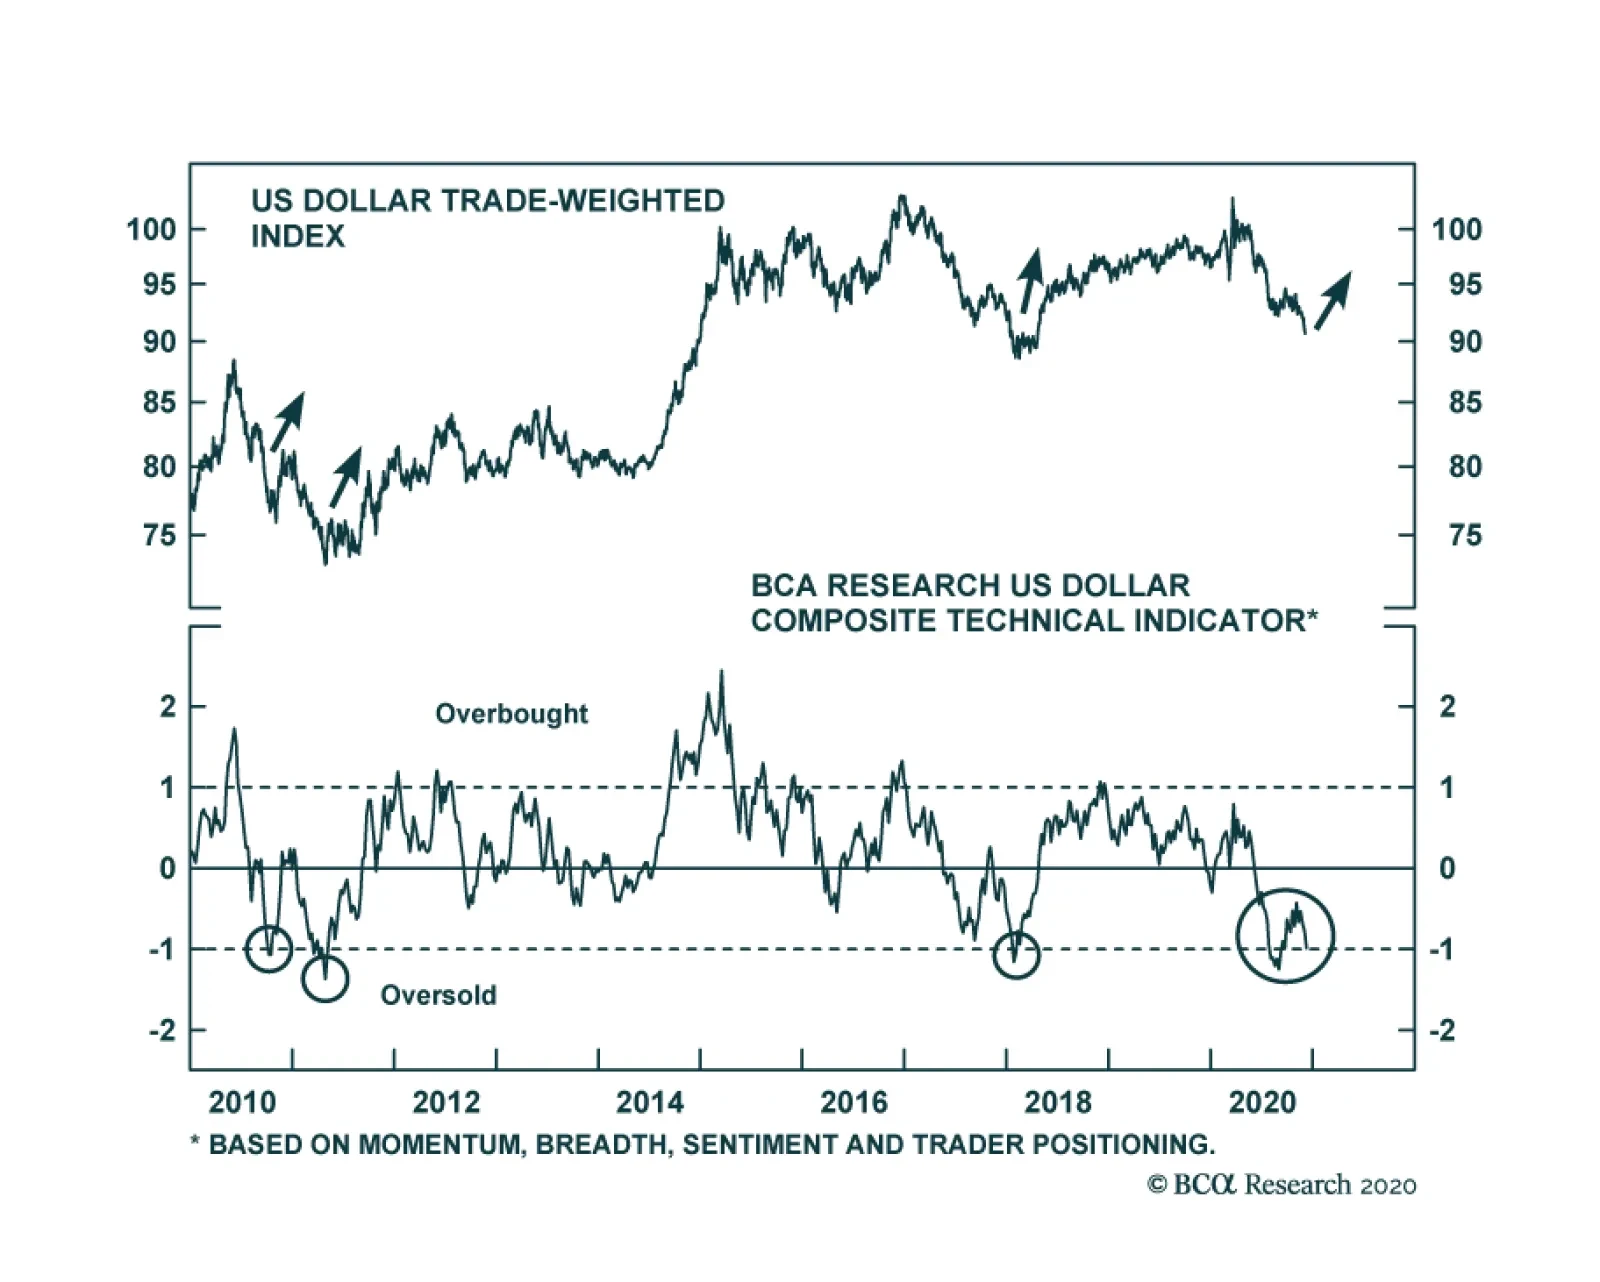
Important technical indicators are increasingly arguing that the dollar is ripe for a rebound, despite the DXY’s recent breakdown. Sentiment toward the dollar has become depressed and positioning in the euro is extended. Moreover, our BCA US Dollar Composite…
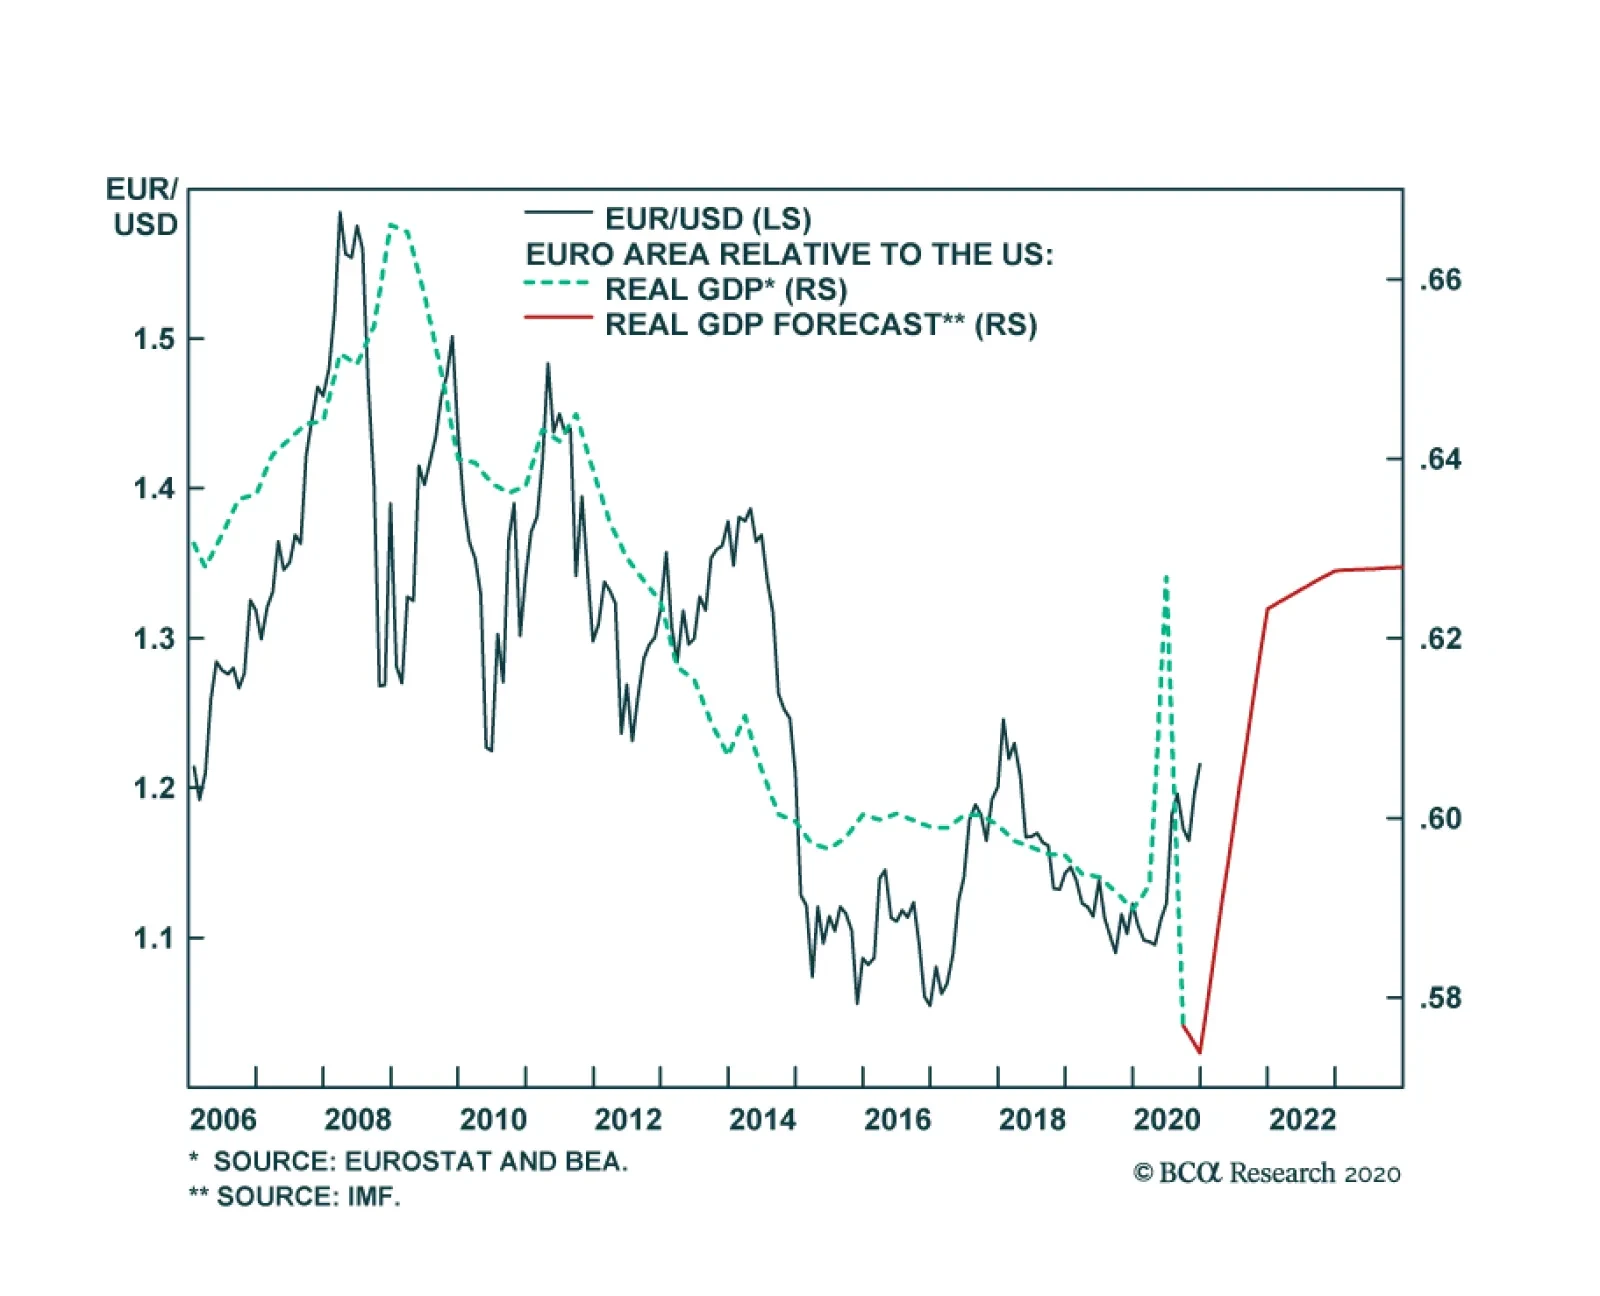
BCA Research’s Foreign Exchange Strategy service concludes that the DXY should hit 80 in 2021, which implies a euro towards 1.35. Over the last few years, the relative growth performance between the Eurozone and the US has driven EUR/USD. The IMF expects…