United States
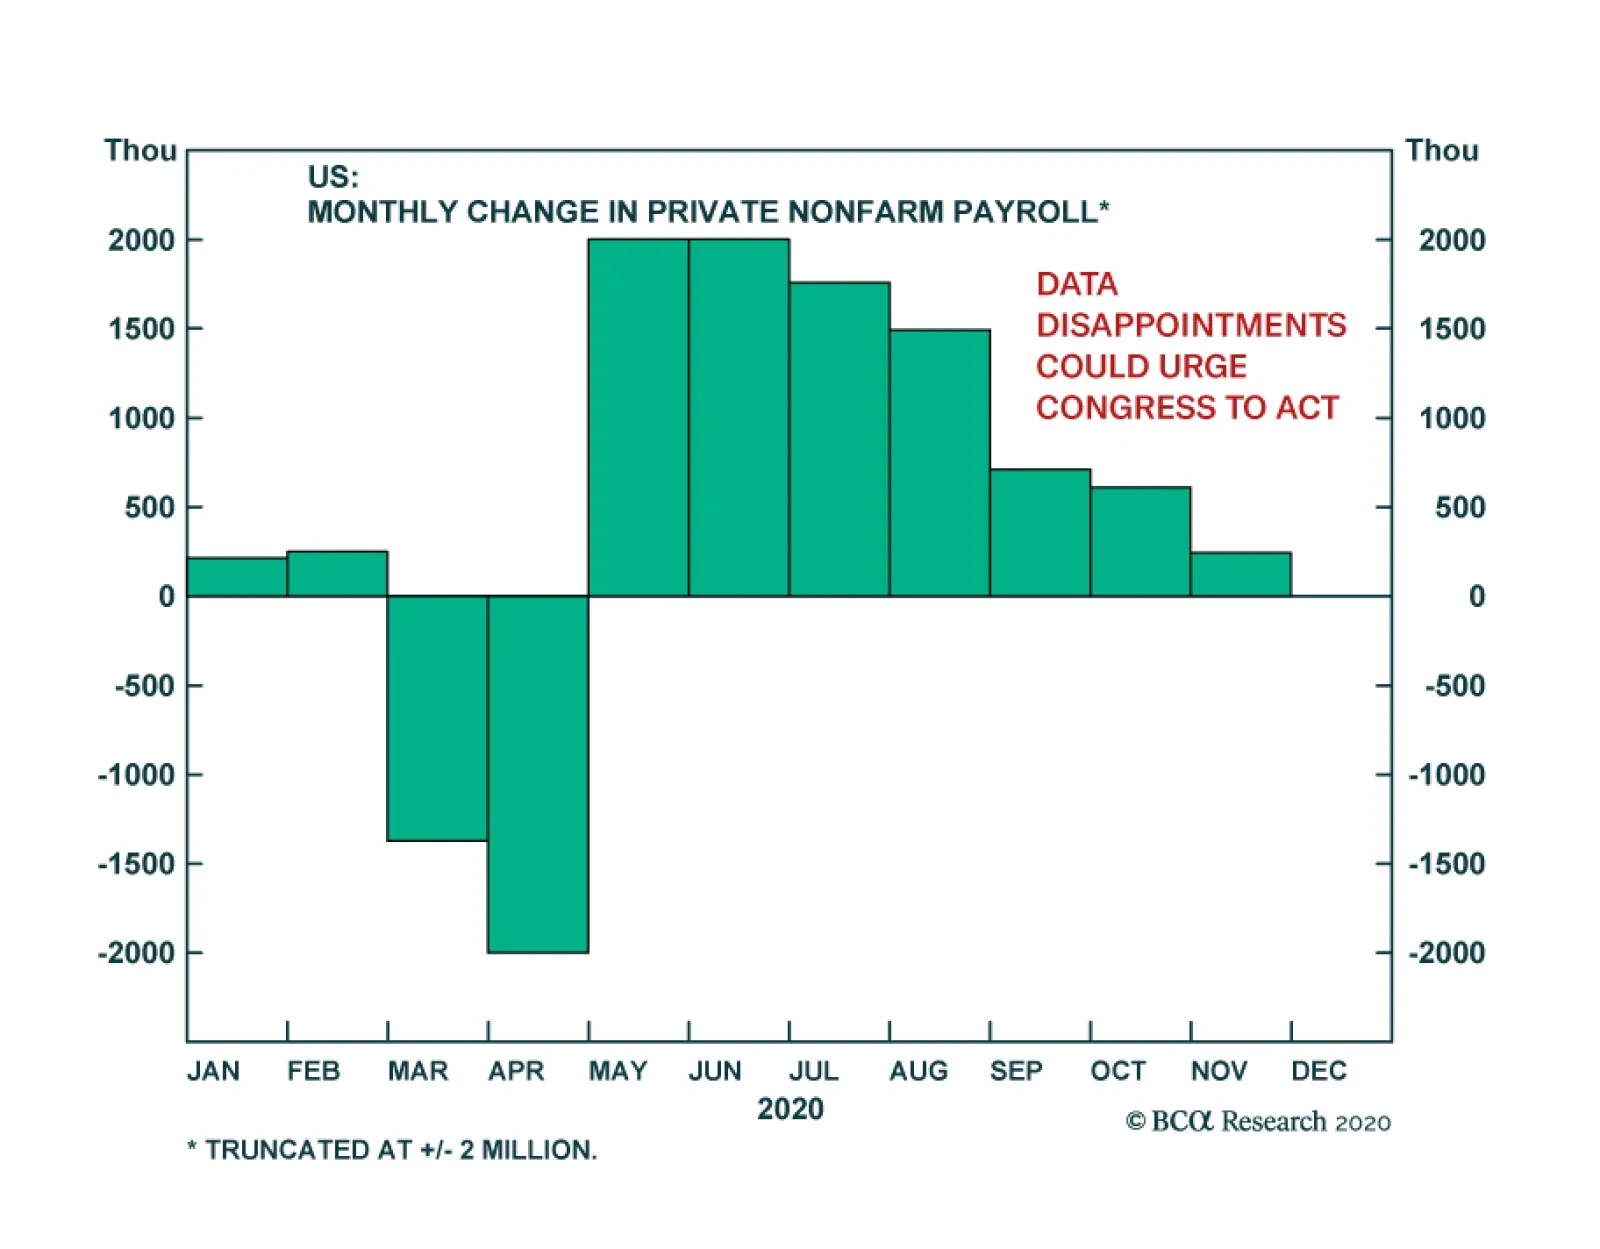
November’s US Nonfarm Payrolls report confirms that the US labor market’s momentum is slowing. The headline job number of 245 thousand fell below consensus forecasts of 460 thousand. The negative surprise extended to the private sector, where 344 thousand…

Profit Margin Expansion Looms
Profit Margin Expansion Looms
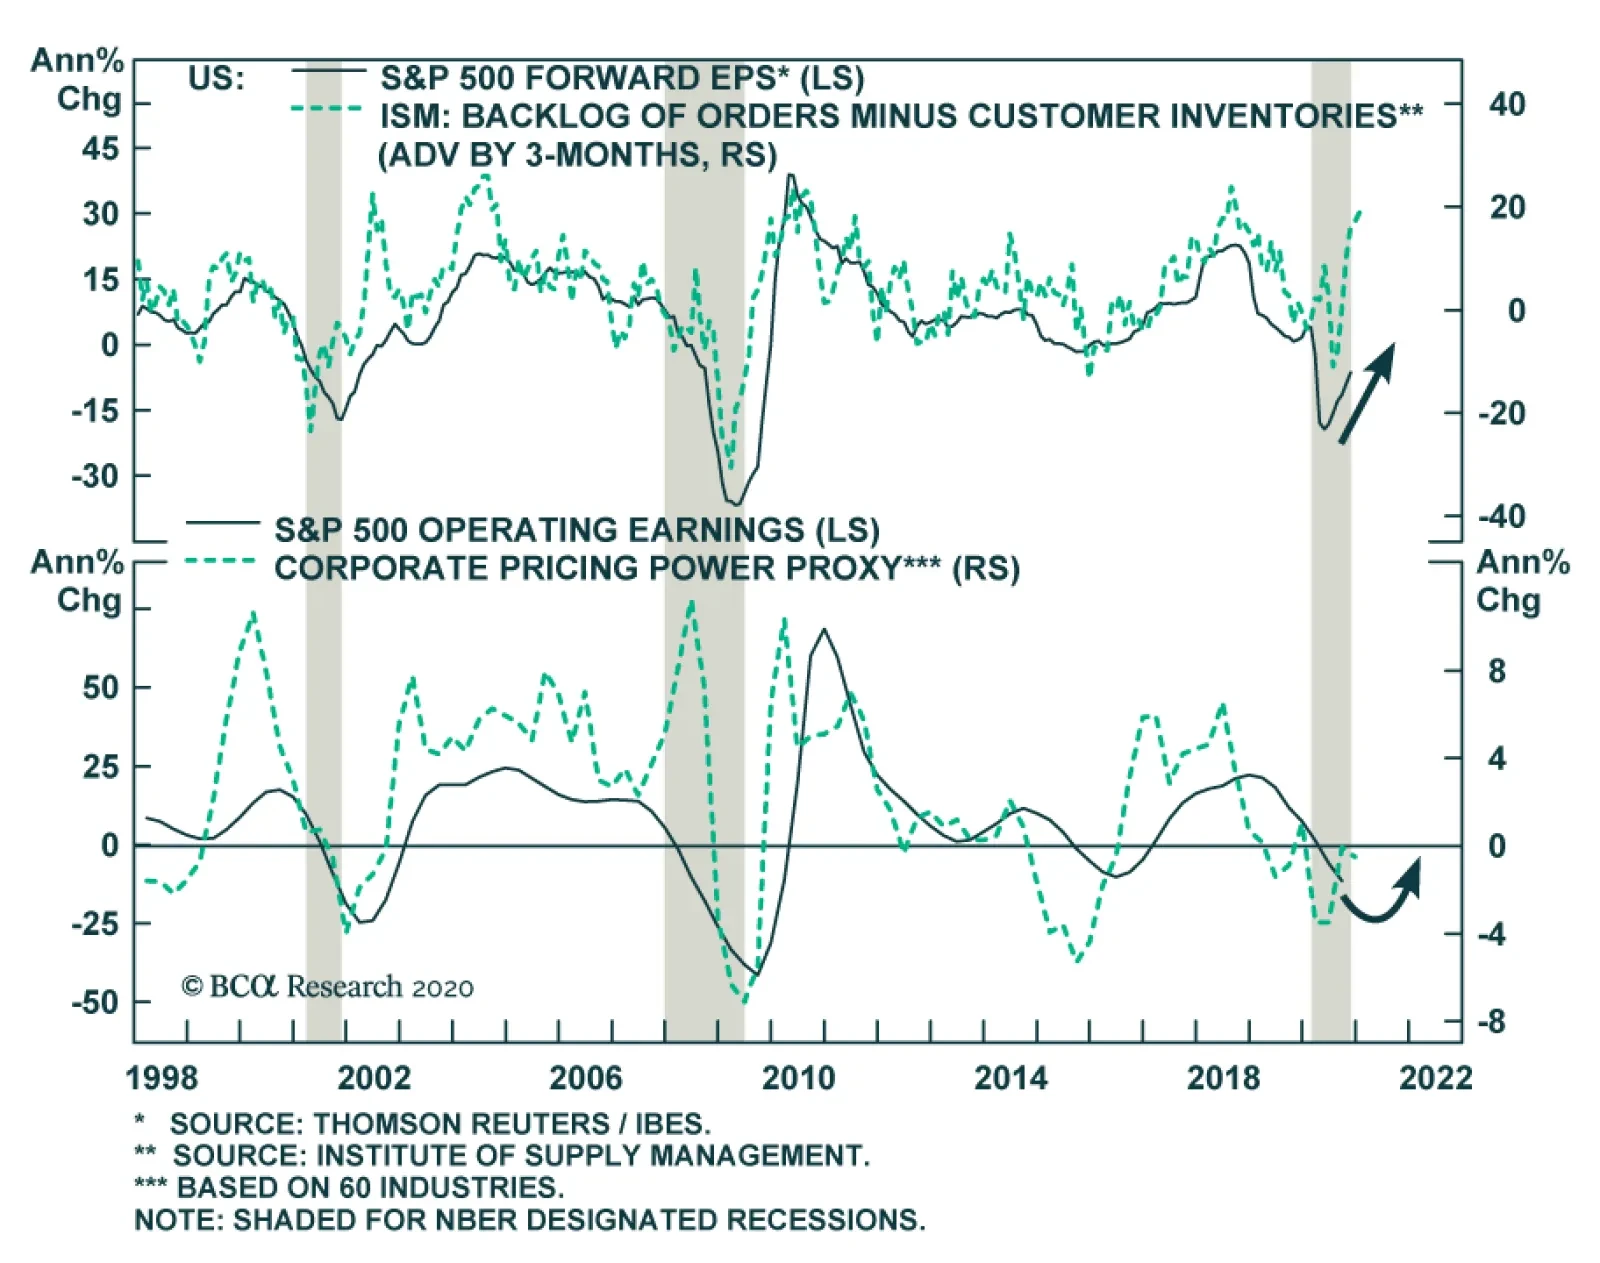
Our long-held view has been that profit margins really only mean revert during recessions. This cycle has proved no different and empirical evidence shows that SPX margins fell over 200bps from peak-to-trough (top panel). Now that the recession is disappearing in the rear view mirror, a margin expansion phase looms. Not only are sell-side analysts’ forward margin expectations in a V-shaped recovery (top panel), but also our very own profit margin proxy (corporate pricing power growth / nonfarm payroll growth, middle panel) signals that margins will widen significantly next year. Take DIS for example. This consumer discretionary stock has vaulted to all-time highs, but DIS's cost structure is a lot leaner because of the pandemic. In other words, CEOs have adjusted cost structures to new lower run rates and investors are hoping profits will also make a comeback. Moreover, national accounts data corroborate our margin proxy message and point to a brightening margin and thus profit backdrop for 2021. Up to very recently, labor productivity was moribund, but it has now shot through the moon to the highest growth rate since the GFC (bottom panel). Bottom Line: A profit margin expansion phase is looming. We remain cyclically and structurally bullish on the prospects of the broad equity market.
Highlights The dollar has entered a multi-year decline. However, in the very near term, we are at risk of a tactical bounce, which should be in the order of 2%-4%. Eventually, the DXY should hit 80 in 2021. This will lift the euro towards 1.35. The best-performing currency in 2021 will be the Norwegian krone. The Swedish krona will be a close second. The story for 2021 will also shift from broad dollar weakness to playable themes within the currency market. This entails more differentiation among currency losers and winners. Our ranking model suggests USD, NZD, and CHF will be the underperformers. The value-versus-growth debate will be one theme that will emerge as an important driver of currencies. Exchange rates for countries with a heavy weighting of value stocks in their domestic bourses will outperform. Currencies of oil-producing countries will also outperform those of oil-consuming ones. The Japanese yen remains a viable portfolio hedge for 2021. Gold and silver will rise in 2021, but silver will outperform gold. Remain short the gold/silver ratio, which was our top trade in 2020. Feature Our key conclusions from last year’s outlook were as follows:1 Go short the DXY index with a target of 90 and a stop loss of 100. The top-performing G10 currencies in 2020 will be the NOK and SEK. Remain short USD/JPY as portfolio insurance. The path to a lower yen is via an overshoot, as the Bank of Japan will need a shock to act more aggressively. A weak dollar will support gold prices. Gold will also benefit from abundant liquidity and persistently low/negative real rates. EUR/USD should touch 1.18, while GBP/USD will retest 1.40. Chart 1The US Dollar Is Breaking Down
2021 Key Views: Tradable Themes
2021 Key Views: Tradable Themes
Most of these calls have panned out as we initially expected. Granted, we did not forecast the pandemic, and the first half of 2020 torpedoed much of our expectations. But we were quick to reimplement a lot of these trades throughout the year. EUR/USD has just kissed the 1.20 mark, while GBP/USD is a whisker below 1.35, even though there has not yet been a full resolution to the Brexit imbroglio. The best-performing developed market currency this year has been the Swedish krona, while the Norwegian krone and Australian dollar are up almost 30% from their March lows. Even the Japanese yen has appreciated by about 4% against the US dollar this year. In a nutshell, 2020 has been a story about broad dollar weakness (Chart 1). This has been rooted in three fundamental pillars: Unprecedented liquidity injections by the Federal Reserve, especially in terms of addressing the offshore dollar shortage. The world is now awash with dollars, as the Fed remains the most aggressive central bank in printing domestic currency. This has compressed the US’ interest rate advantage vis-à-vis the rest of the world. A strong and synchronized rebound in global growth, as we slowly emerge from the depths of the pandemic. As a counter-cyclical currency, the dollar has suffered. This is both a combination of Asia having been able to keep the pandemic under wraps and focus on reopening its economy, as well as a pickup in manufacturing activity around the world. Fiscal stabilizers have been able to contain a more severe contraction in global consumption. Economies more levered to Chinese growth have seen a pickup in their economies, especially versus the US. This has supported capital flows back into these economies, buffeting their currencies in the process. Much of these trends will continue into next year. However, 2021 will be a year of differentiation rather than broad-based dollar weakness. What this means is that the dollar will still decline in 2021, but more money will be made at the crosses as playable themes begin to pan out. Meanwhile, in the very near term, the dollar is due for a technical reset. The Dollar In A Market Reset The dollar rarely rises or declines in a straight line, and most indicators suggest that the dollar is deeply oversold. Having broken below major trendlines, the DXY index is now sitting at the same critical spot where we suspected it would begin to see some technical resistance. Chart 2A Surge In Bullish Positioning For EUR/USD
A Surge In Bullish Positioning For EUR/USD
A Surge In Bullish Positioning For EUR/USD
Chart 3Risk: The Dollar And Equity Markets
Risk: The Dollar And Equity Markets
Risk: The Dollar And Equity Markets
In fact, it has been remarkable that the dollar has not risen so far, given that November has been a seasonally strong month for the dollar since the 1970s, and that the dollar has tended to stage meaningful rallies into year-end since the GFC. From a positioning perspective, sentiment on the anti-dollar (the euro) is quite ebullient (Chart 2). Such positioning has usually been associated with a correction in the EUR/USD cross and a tactical bounce in the dollar. There are three reasons why we could experience a tactical bounce in the dollar: The greenback has had a near-perfect inverse correlation with risk assets, and the latter are due for a reset after a strong month in November (Chart 3). Sentiment on stocks is quite fervent, as measured by the American Association of Individual Investors and the equity put-to-call ratio. The pandemic is still raging in many countries (Chart 4). While promising vaccines are on the horizon, there is still an air pocket to growth which can reinvigorate flows into safe havens, including the dollar. Real rates have started to rise again in the US, compared to the rest of the world. Real rates remain much lower in the US, but the small improvement in both nominal and real yields will curtail some foreign outflows from the US Treasury market (Chart 5A and 5B). Chart 4Risk: Covid-19 Still Prevalent, But Cresting
Risk: Covid-19 Still Prevalent, But Cresting
Risk: Covid-19 Still Prevalent, But Cresting
Chart 5ARisk: Interest Rate Differentials Moving In Favor Of The US
Risk: Interest Rate Differentials Moving In Favor Of The US
Risk: Interest Rate Differentials Moving In Favor Of The US
Chart 5BRisk: Interest Rate Differentials Moving In Favor Of The US
Risk: Interest Rate Differentials Moving In Favor Of The US
Risk: Interest Rate Differentials Moving In Favor Of The US
As we discussed with Mr. X this week, the DXY has about 2%-4% upside, but not much more. For one, we no longer have the liquidity issues that handicapped global markets in March this year. The outstanding swap lines between major central banks and the Federal Reserve is close to zero, suggesting that most foreign official entities have ample access to dollar liquidity (Chart 6). This was also a signal in 2009 that the dollar liquidity shortage was behind us. While promising vaccines are on the horizon, there is still an air pocket to growth which can reinvigorate flows into safe havens, including the dollar. Second, the Fed has also been the most aggressive central bank in increasing its supply of its domestic currency, as we have argued above. Today, interest rates around the world are at zero. Therefore, the onus is now shifting to central bank balance sheet policy (and/or forward guidance) to communicate the future path of interest rates. Chart 7 shows that other G10 central banks have been lagging the Fed in terms of their balance sheet expansion. This has been hurting the dollar and benefiting other currencies Chart 6Dollar Liquidity Crisis Addressed
Dollar Liquidity Crisis Addressed
Dollar Liquidity Crisis Addressed
Chart 7The Fed Is Stimulating The Most
The Fed Is Stimulating The Most
The Fed Is Stimulating The Most
Third, US growth is set to lag the rest of the world in 2021. The IMF expects global growth to rebound by 5.2% in 2021. This will be driven by emerging markets (such as China, at 8%) but also Europe, at 5.2%. The US is expected to lag, with growth at 3.1%. Relative growth between the US and the rest of the world has been an important driver of the dollar over the last few years (Chart 8). If US growth lags over the next few quarters, it will be a headwind to the dollar. Chart 8The Dollar And Relative Growth
The Dollar And Relative Growth
The Dollar And Relative Growth
An Attractiveness Ranking For Currencies As the dollar declines in 2021, the Scandinavian currencies remain most primed to benefit. Chart 9 ranks the G10 currencies on a swathe of measures, including their basic balances, our internal valuation models, sentiment measures, economic divergences, and external vulnerability. The ranking is in order of preference, with a lower score suggesting the currency is sitting in the top/most attractive quartile of the measures. The Norwegian krone is especially attractive as a 2021 play. Chart 9The Scandinavian Currencies Are Very Attractive
2021 Key Views: Tradable Themes
2021 Key Views: Tradable Themes
More specifically, the Scandinavian currencies have borne the brunt of the dollar bull market that began in 2011, and could see quick reversals as we enter into a multi-year dollar decline (Chart 10). Exchange rates tend to be extremely fluid in discounting a wide set of economic data, and in the case of Sweden, in discounting the outcome for global growth. With EUR/SEK and USD/SEK still at levels close to their 2008 highs, the room for mean reversion remains quite wide. Chart 10Buy Some NOK and SEK On Weakness
Buy Some NOK and SEK On Weakness
Buy Some NOK and SEK On Weakness
Chart 11The NOK And Oil Markets
The NOK And Oil Markets
The NOK And Oil Markets
The Norwegian krone is also primed to benefit from the reopening of economies, particularly through the terms-of-trade channel. As an oil producer, Norway benefits from rising oil prices. This is why the Norwegian krone has been closely correlated with the relative performance of the global oil and gas sector (Chart 11). The least attractive G10 currencies are the New Zealand dollar and the greenback. This is mostly due to valuation. More importantly, the attractiveness ranking allows us to easily devise trading strategies at the crosses. In our portfolio, we are long NOK/EUR, CAD/NZD, EUR/CHF, and JPY/USD. We are looking to buy the Scandinavian currencies on a 2% pullback. EUR/USD As The Anti-Dollar The most liquid beneficiary of dollar downside will be the euro. As we posited in our report last month, beyond near-term weakness, EUR/USD could touch 1.50 over the next few years.2 Below are the conclusions of the report: The euro has been driven over the last few years by the relative growth performance between the Eurozone and the US (Chart 12). The IMF expects euro area growth to bounce by about 5.2% next year, compared to 3.1% in the US. Much of the rise will be due to a surge in investment in the euro area, especially driven by pent-up demand in the peripheral countries. Chart 12EUR/USD And Relative Growth
EUR/USD And Relative Growth
EUR/USD And Relative Growth
From the 1960s up to the Great Financial Crisis, trend productivity growth was around 2.2% in the US and 2.8% in the euro area. However, since 2009, productivity growth has been 0.6% per year in the euro area and 1.1% in the US (Chart 13). In other words, the European debt crisis has substantially subdued productivity growth in the region. As a thought experiment, if we assume European productivity growth plays catch up over the next decade, it will be roughly 1.6% higher in Europe relative to the US. Cumulatively, that is a rise by over 20%. Given that the euro is undervalued by over 10%,3 this pins the euro well above 1.50. Ultimately, European growth is cyclically tied to export growth. And with a huge concentration of cyclical sectors – such as financials, industrials, materials and energy – in European bourses, the euro tends to be largely driven by procyclical flows. Rising inflows into European bourses will be a positive catalyst for the euro. Chart 13Could European Productivity Surprise To The Upside?
Could European Productivity Surprise To The Upside?
Could European Productivity Surprise To The Upside?
The euro has been lagging other cyclical assets like copper or global stocks (Chart 14). This suggests that the current breakout has been a catch-up phase. While we are likely to consolidate gains in the very near term, the euro should ultimately head higher. Our 2021 target for EUR/USD is 1.35. Chart 14The Euro Is Still Lagging Copper
The Euro Is Still Lagging Copper
The Euro Is Still Lagging Copper
Currencies And The Value Versus Growth Debate The debate about the performance of value versus growth will have a significant bearing on currencies in 2021. We discussed this topic in depth in our special report last summer.4 In a nutshell, getting the value versus growth call right could be key to targeting the currencies likely to outperform in 2021. The debate about the performance of value versus growth will have a significant bearing on currencies in 2021. Table 1 shows that value sectors have been heavily concentrated in countries with more cyclical currencies such as the Australian dollar, Norwegian krone, Swedish krona, and Canadian dollar. It has also been the case that the performance of value versus growth has tended to lead the US dollar by about a year or so. Table 1Sector Weights Across G10
2021 Key Views: Tradable Themes
2021 Key Views: Tradable Themes
Flows tend to gravitate to capital markets with the highest expected returns, and this is certainly the case where value or growth style tilts are concerned. This is important for currency strategy, since sector composition can drive a country’s equity returns. Chart 15 shows that a basket of the CAD, NOK, AUD, and SEK (heavily weighted in cyclical sectors) relative to the CHF (heavily weighted in growth sectors) has tracked a global value/growth basket pretty closely. Given the massive underperformance over the last decade, room for mean reversion in value stocks is immense and meaningful. This will lead to powerful inflows into currencies such as the CAD, NOK, SEK, and AUD. Another playable strategy at the crosses will be US versus non-US growth. For example, the Canadian economy is more economically linked to the US than, say, the Norwegian economy. As a result, CAD/NOK has tended to track the DXY index quite well (Chart 16). And so, while both the Canadian dollar and the Norwegian krone will rise in 2021, the CAD should greatly underperform NOK. Chart 15Value Versus Growth And Currencies
Value Versus Growth And Currencies
Value Versus Growth And Currencies
Chart 16A Cheaper Way To Play Dollar Downside
A Cheaper Way To Play Dollar Downside
A Cheaper Way To Play Dollar Downside
Oil Consumers Versus Oil Producers One reason CAD will also underperform NOK has been the tectonic shift in oil markets. In short, the NOK benefits more from oil prices than the CAD, given that it is less reliant on US oil imports. There has been a disconnect between the price of oil and the performance of petrocurrencies over the last decade. During much of the early 2000s, petrocurrencies outperformed along with rising oil prices. However, from the 2016 oil bottom, a petrocurrency basket has massively underperformed versus the US dollar (Chart 17). We have written about this at length, and the key reason is that the US is now the largest oil producer in the world. As a result, while rising oil prices are bullish for petrocurrencies, being long versus the US dollar is no longer an appropriate strategy. From the 2016 oil bottom, a petrocurrency basket has massively underperformed versus the US dollar. Oil demand tends to follow the ebb and flow of the business cycle, with demand having slowed sharply on the back of the pandemic. Transport constitutes the largest share of global petroleum demand. As economies reopen, oil demand should inflect higher. However, playing this trend requires an adjustment: Being long a basket of oil producers versus consumers, rather than the US dollar. Chart 18 shows that a currency basket of oil producers versus consumers has had both a strong positive correlation with oil prices and has outperformed a traditional petrocurrency basket Chart 17Petrocurrencies Versus Oil
Petrocurrencies Versus Oil
Petrocurrencies Versus Oil
Chart 18Oil Producers Versus Oil Consumers
Oil Producers Versus Oil Consumers
Oil Producers Versus Oil Consumers
In our portfolio, we are long a basket of CAD, NOK, COP, RUB, and MXN against the euro. We intend to tactically play oil upside throughout 2021 via this new strategy. On JPY And CHF Chart 19The Yen And The Dollar Are Inversely Correlated
The Yen And The Dollar Are Inversely Correlated
The Yen And The Dollar Are Inversely Correlated
In an environment where the dollar is in a broad-based decline, most currencies will do well, as was the case this year. This is also the case for safe-haven currencies, such as the Japanese yen and the Swiss franc. But as we argued with Mr. X earlier this week, there are even more compelling reasons to hold the yen in an FX portfolio. First, the yen is cheap. Falling prices in Japan over the years have tremendously improved the fair value of the yen on a PPP basis. Second, Japan has one of the highest real rates in the developed world. So, outflows from JGB’s are going to be curtailed, while inflows might actually accelerate. And finally, both the DXY and USD/JPY are positively correlated, meaning when the dollar declines, the yen rises, but less so than other currencies. This correlation tends to shift during crises, when the yen generally appreciates more than the dollar (Chart 19). This places the yen in a very enviable “heads I win, tails I don’t lose too much” position. The Swiss franc is likely to fare worse than the yen. First, it is more expensive, and the fact that deflation is becoming more prominent in Switzerland will force the Swiss National Bank to fend off any additional currency strength. A Final Word On Gold, Silver, And Precious Metals We agree with our commodity strategists that gold is due for a tactical bounce.5 Investors had piled into gold on the bet that a raging pandemic, combined with unprecedented monetary and fiscal stimulus, was a potent cocktail for currency debasement and inflation. With positive vaccine news on the horizon, these trades are being violently unwound. A flushing out of stale longs is very healthy in our view, since our bullish thesis has never been dependent on the pandemic in the first place. Here are the reasons: Almost every major economy now has negative real interest rates. While within the foreign exchange sphere, it is relative interest rate policy that matters, the global landscape is extremely fertile for upside in gold prices. Gold has a long-standing relationship with negative interest rates, even though the correlation has shifted over time (Chart 20). The intuition behind falling real rates and rising gold prices is that low rates reduce the opportunity cost of holding non-income generating assets such as gold. And while odds are on the side of yields creeping higher from current low levels, this will still be bullish for gold, if driven by rising inflation expectations. Chart 20Real Rates And Gold
Real Rates And Gold
Real Rates And Gold
Support for the dollar is fraying at the edges. For the first time since the end of the Bretton Woods system, central banks are becoming net purchasers of gold. Central bank purchases are extremely potent in any bull market, since historically, central banks have been indiscriminate buyers. Foreign central banks have been amassing tremendous gold reserves, almost to the tune of the total annual mine output. This diversification into gold has occurred mostly via the dollar (Chart 21). Jewelry demand is a significant chunck of gold purchases, and rising emerging market currencies have improved their purchasing power for gold. The reality is that both China and India went on a buying binge of coins and jewelry during gold’s last bull market, and there is no reason to expect this time to be different. Chart 21Gold And Diversification
Gold And Diversification
Gold And Diversification
In a nutshell, we believe we have entered an assymetic reality for gold prices. A fall in prices encourages accumulation by EM central banks as a way to diversify out of their dollar reserves, while a rise in prices encourages financial demand and speculation. This might be the reason why gold is decoupling from the traditional variables that drive its price. Gold was rising along with the dollar for much of 2019. As gold rises in 2021, the true winners will be the other precious metals, especially silver6 and platinum. As such, a hedged trade likely to continue being profitable is short gold versus silver. As gold rises in 2021, the true winners will be the other precious metals, especially silver. The Gold/Silver ratio (GSR) tends to track the US dollar quite closely, so a bearish view on the dollar can be expressed by being short the GSR (Chart 22). This is simply because silver tends to rise and fall more explosively than the price of gold. The reason is that the silver market is thinner and more volatile, with futures open interest much smaller than that of gold. Meanwhile, silver’s larger industrial use benefits from new industries such as solar power and a flourishing “cloud” orbit – both of which are capturing the new manufacturing landscape. Chart 22Gold Versus Silver And The Dollar
Gold Versus Silver And The Dollar
Gold Versus Silver And The Dollar
Chart 23GSR: A Long Term Profile
GSR: A Long Term Profile
GSR: A Long Term Profile
Second, when gold tends to make new highs (as it did in 2020), silver tends to follows suit as well. That is why over the centuries, the GSR has tended to mean-revert (Chart 23). That means silver prices could double from current levels over the next few years, to reclaim their 2011 highs. Finally, the bullish case for platinum is the same as for silver. It has lagged both gold and palladium prices (Chart 24). Meanwhile, breakthroughs are being made in substituting palladium for platinum in gasoline catalytic converters.7 Chart 24Platinum Is Attractive
Platinum Is Attractive
Platinum Is Attractive
Concluding Thoughts Chart 25FX Trading Model
FX Trading Model
FX Trading Model
Our currency positions, as we enter 2021, largely reflect the themes and ideas developed above. Our full trade table is available on page 19. These include: The DXY will bounce to 95, but then retrace back to 80 over the course of 2021. An attractiveness ranking reveals the most appealing currencies are NOK, SEK, and JPY, while the least attractive are CHF, USD, and NZD. We are positive on both gold and silver, but prefer the latter. We are short the gold/silver ratio at a level of 80, with a target of 65. One point we have not discussed in this report is our trading model, which continues to perform well. This models remains short the USD. We will continue to enhance this model in the coming years, as we incorporate more of our thought methodology into it (Chart 25).8 Chester Ntonifor Foreign Exchange Strategist chestern@bcaresearch.com Footnotes 1 Please see Foreign Exchange Strategy Special Report, "2020 Key Views: Top Trade Ideas," dated December 13, 2019. 2 Please see Foreign Exchange Strategy Special Report, "EUR/USD: Towards Parity Or 1.50?" dated November 20, 2020. 3 Please see our Foreign Exchange Strategy Weekly Report, "Updating Our PPP Models," dated November 13, 2020. 4 Please see our Foreign Exchange Strategy Special Report, "Currencies And The Value-Versus-Growth Debate," dated July 10, 2020. 5 Please see our Commodity & Energy Strategy Report, “Gold Correction Has Run Its Course,” dated December 3, 2020. 6 Please see Foreign Exchange Strategy Weekly Report, “On Money Velocity, EUR/USD And Silver,” dated October 11, 2019. 7 Marleny Arnoldi, “Palladium/platinum substitution tech unveiled by BASF, PGM producers”, Creamer Media’s Mining Weekly, dated March 10, 2020. 8 Please see our Foreign Exchange Strategy Special Report, "Introducing An FX Trading Model," dated April 24, 2020. Trades & Forecasts Forecast Summary Core Portfolio Tactical Trades Limit Orders Closed Trades
Profits, Not Multiples, Will Drive The S&P 500 Higher
…
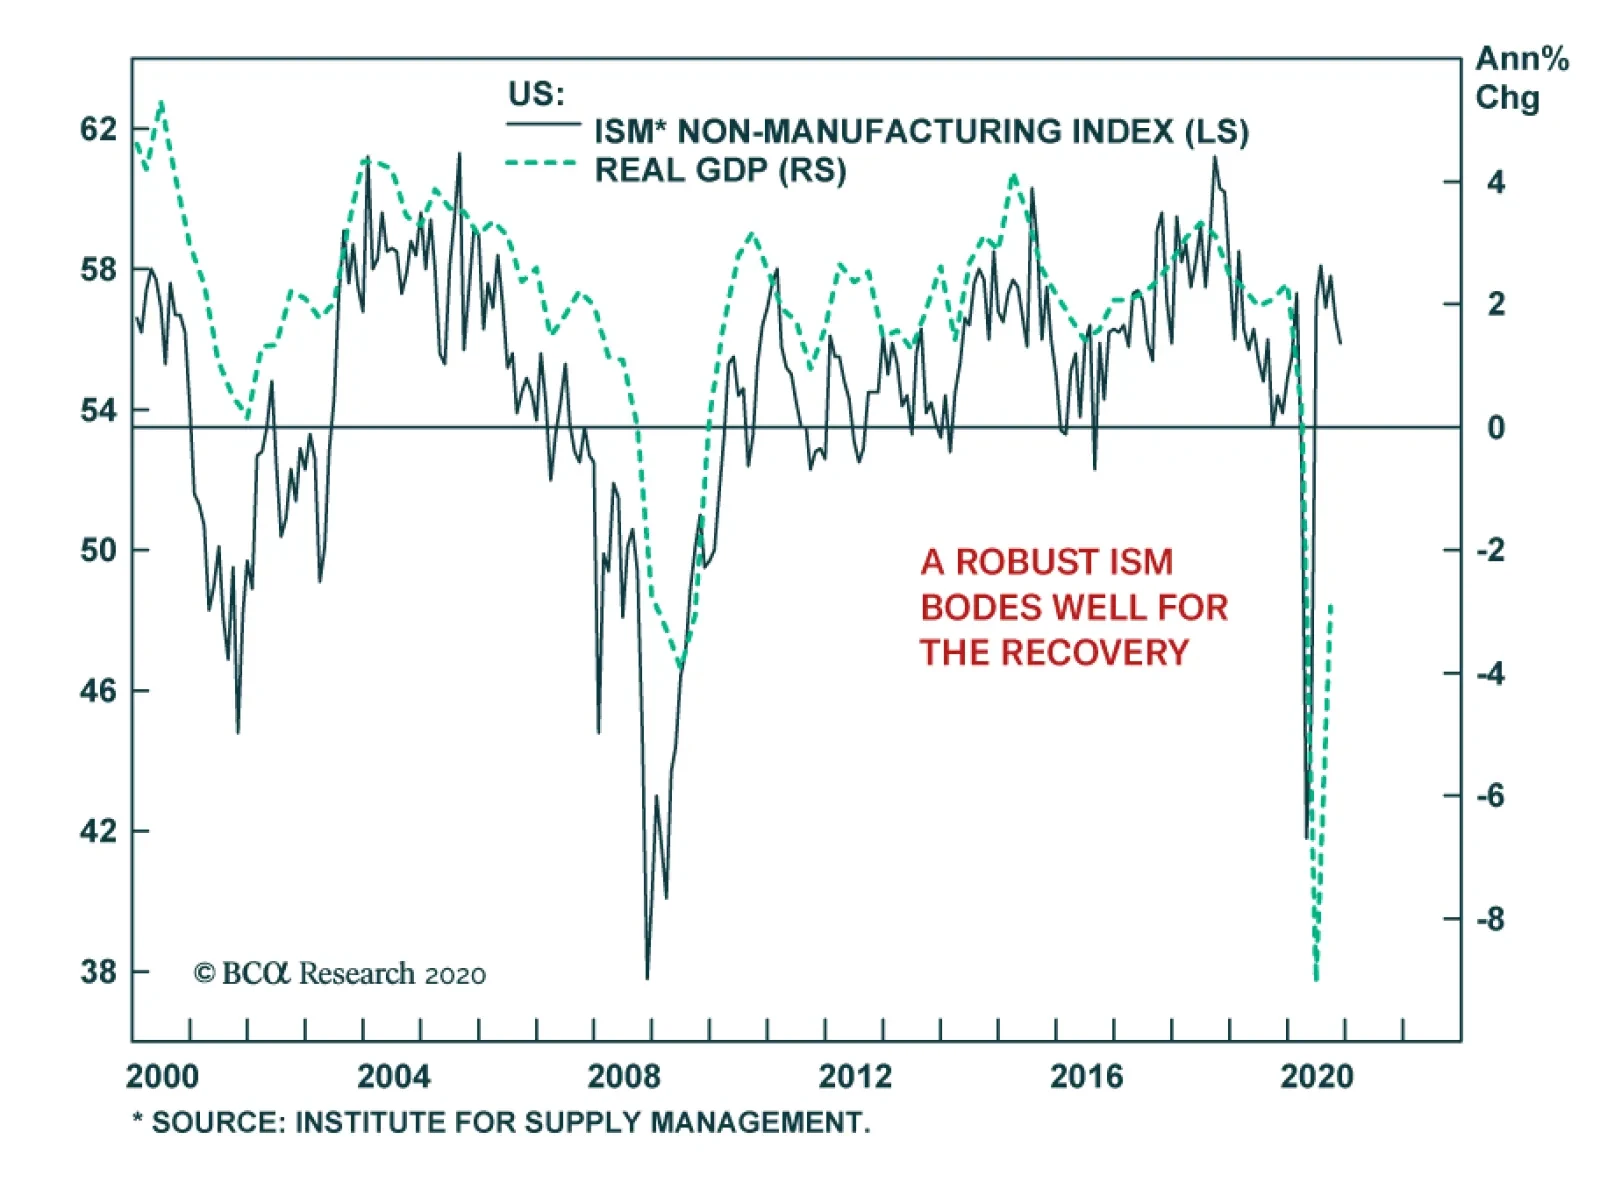
The ISM Non-Manufacturing survey for November fell to 55.9 from 56.6, in line with the 55.8 expected by the consensus. Declines in Business Activity, and to a lesser extent New Orders, drove the overall index lower. This was partially offset by increases in…
On Shaky Grounds
On Shaky Grounds
Underweight Last Monday we executed our S&P homebuilders downgrade alert and reduced allocation in this consumer discretionary sub-group to below benchmark. While the media has been cheering homebuilder-related data recently, the reality is that the data has been fully priced in (top & bottom panels). We expect rates to continue climbing higher, which means that the catalyst that let homebuilders run wild in the first place will be heavily weighing on the index. In more detail, the middle panel of the chart shows that the ten-year US Treasury yield (shown inverted) has likely sealed the verdict for US homebuilders when looking at the sub-group in absolute terms, which makes relative outperformance a tall order. Bottom Line: We reiterate our recent underweight in the S&P homebuilding index; the position is already up 9% since the November 23 inception. The ticker symbols for the stocks in the index are: BLBG: S5HOME – LEN, PHM, DHI, NVR.
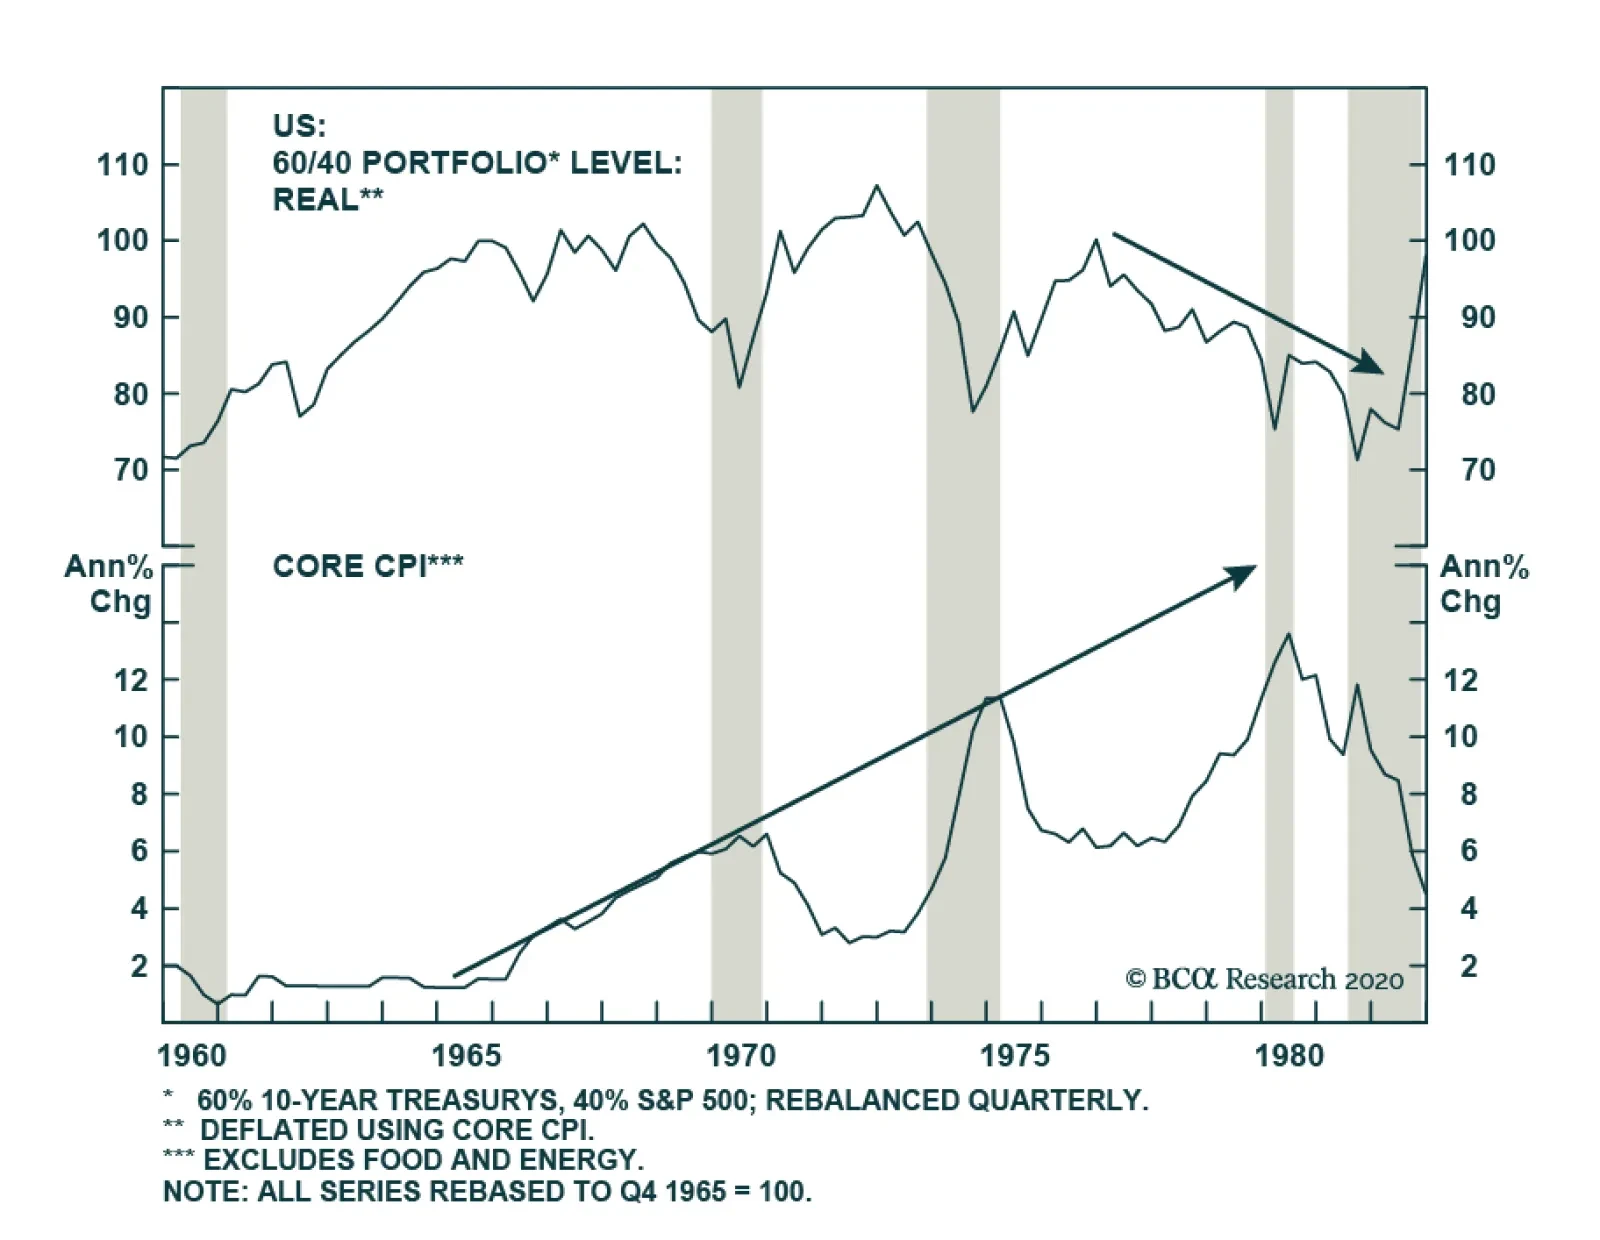
While the near-term inflation risk is limited, various forces point toward expanding odds of higher long-term inflation. The broadening preference among the population toward greater government involvement in the economy suggests that fiscal deficits will…
EUR/USD Will Follow Dr. Copper And So Will Cyclical/Defensives
EUR/USD Will Follow Dr. Copper And So Will Cyclical/Defensives
Dr. Copper has gone ballistic of late, breaking out to multi-year highs. While there is an element of speculative fervor, global growth is ascending and China’s demand for commodities remains insatiable (top panel). Copper’s recent spike signals that EUR/USD will likely decisively break above the 1.20 ceiling (bottom panel), a message that China’s immense easing corroborates as we highlighted last week. The Fed was adamant in debasing the US dollar as a way to reflate not only the US but also the global economy as we highlighted early on in the recovery in early-May. Now the Fed has passed the baton to investors and USD bears are squarely in control. The implication is that a positive feedback loop of a falling currency and rising global growth is great news for commodity producers. We expect a V-shaped recovery in the cyclicals/defensives profits on the back of the budding economic recovery the world over (middle panel). Bottom Line: Continue to prefer deep cyclicals at the expense of defensives.
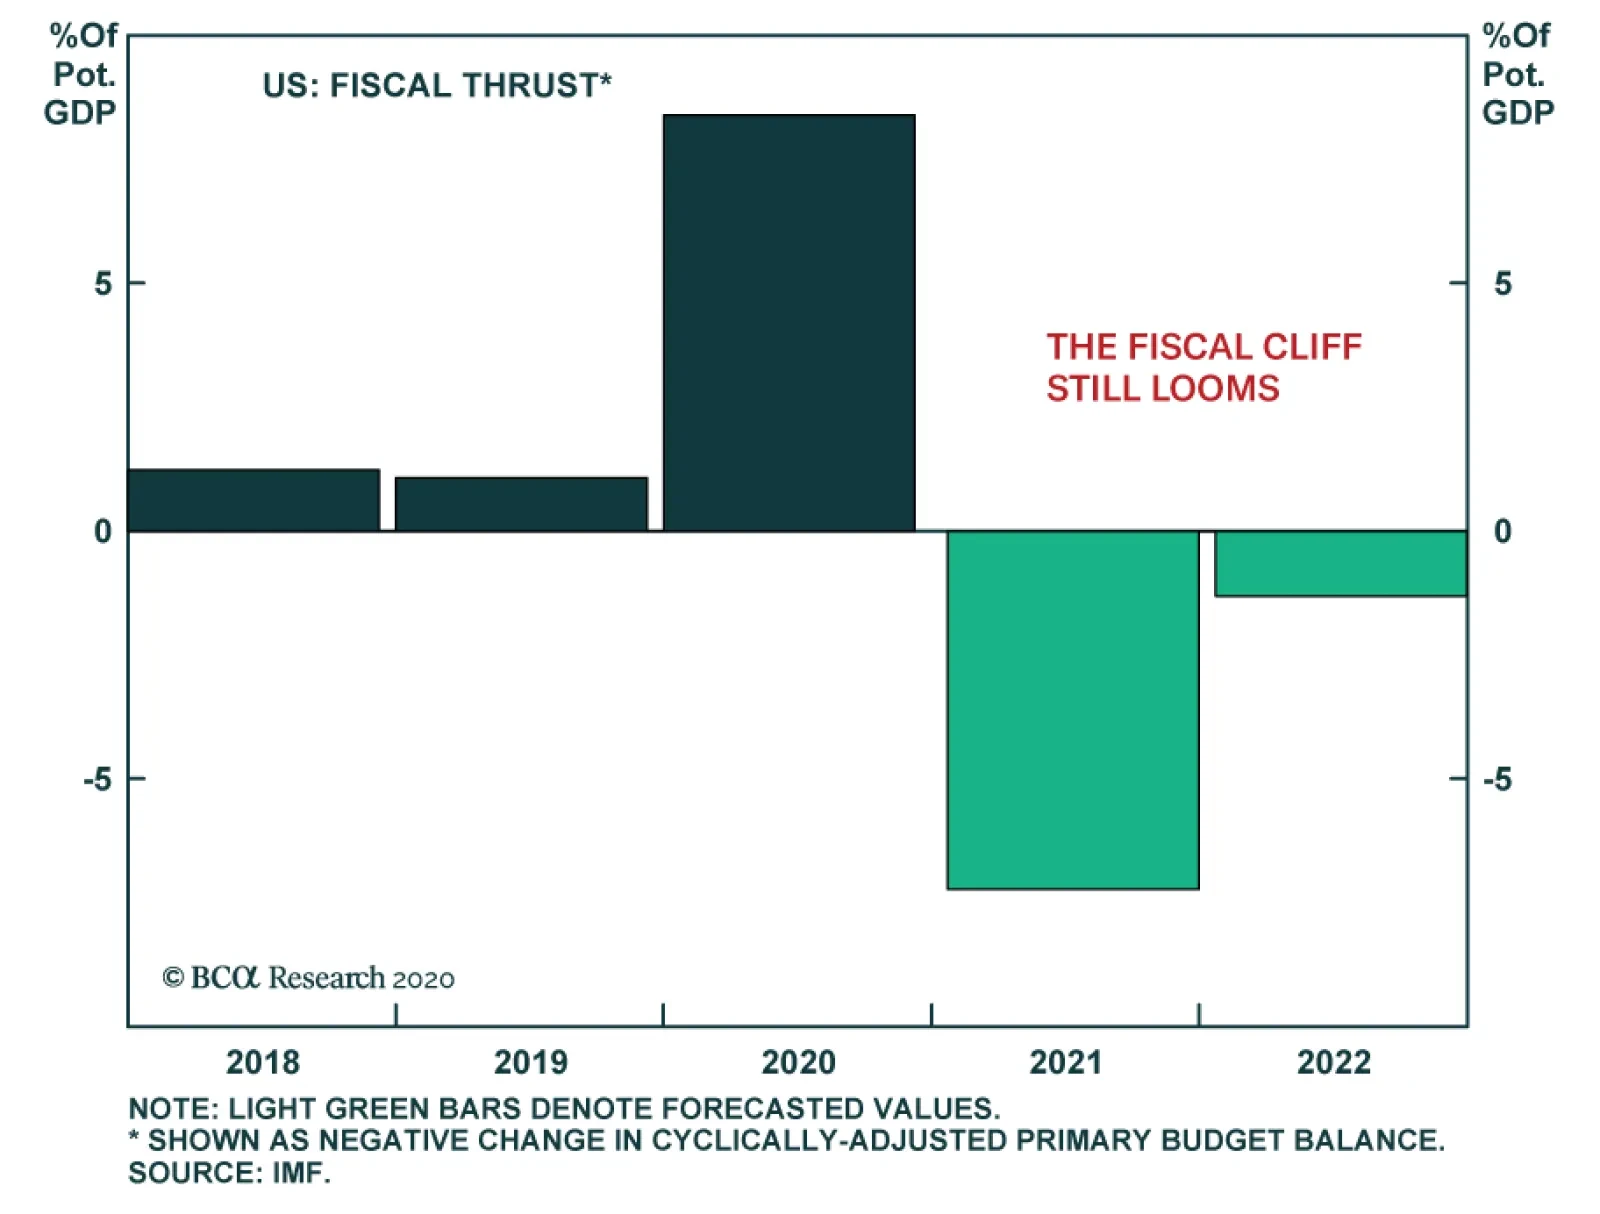
The $908 billion relief package unveiled by a bipartisan group of lawmakers on Tuesday appears to be good news for the durability of the rally. In reality, the proposal is only marginally more positive. True, it reveals that Democrats have an incentive to…
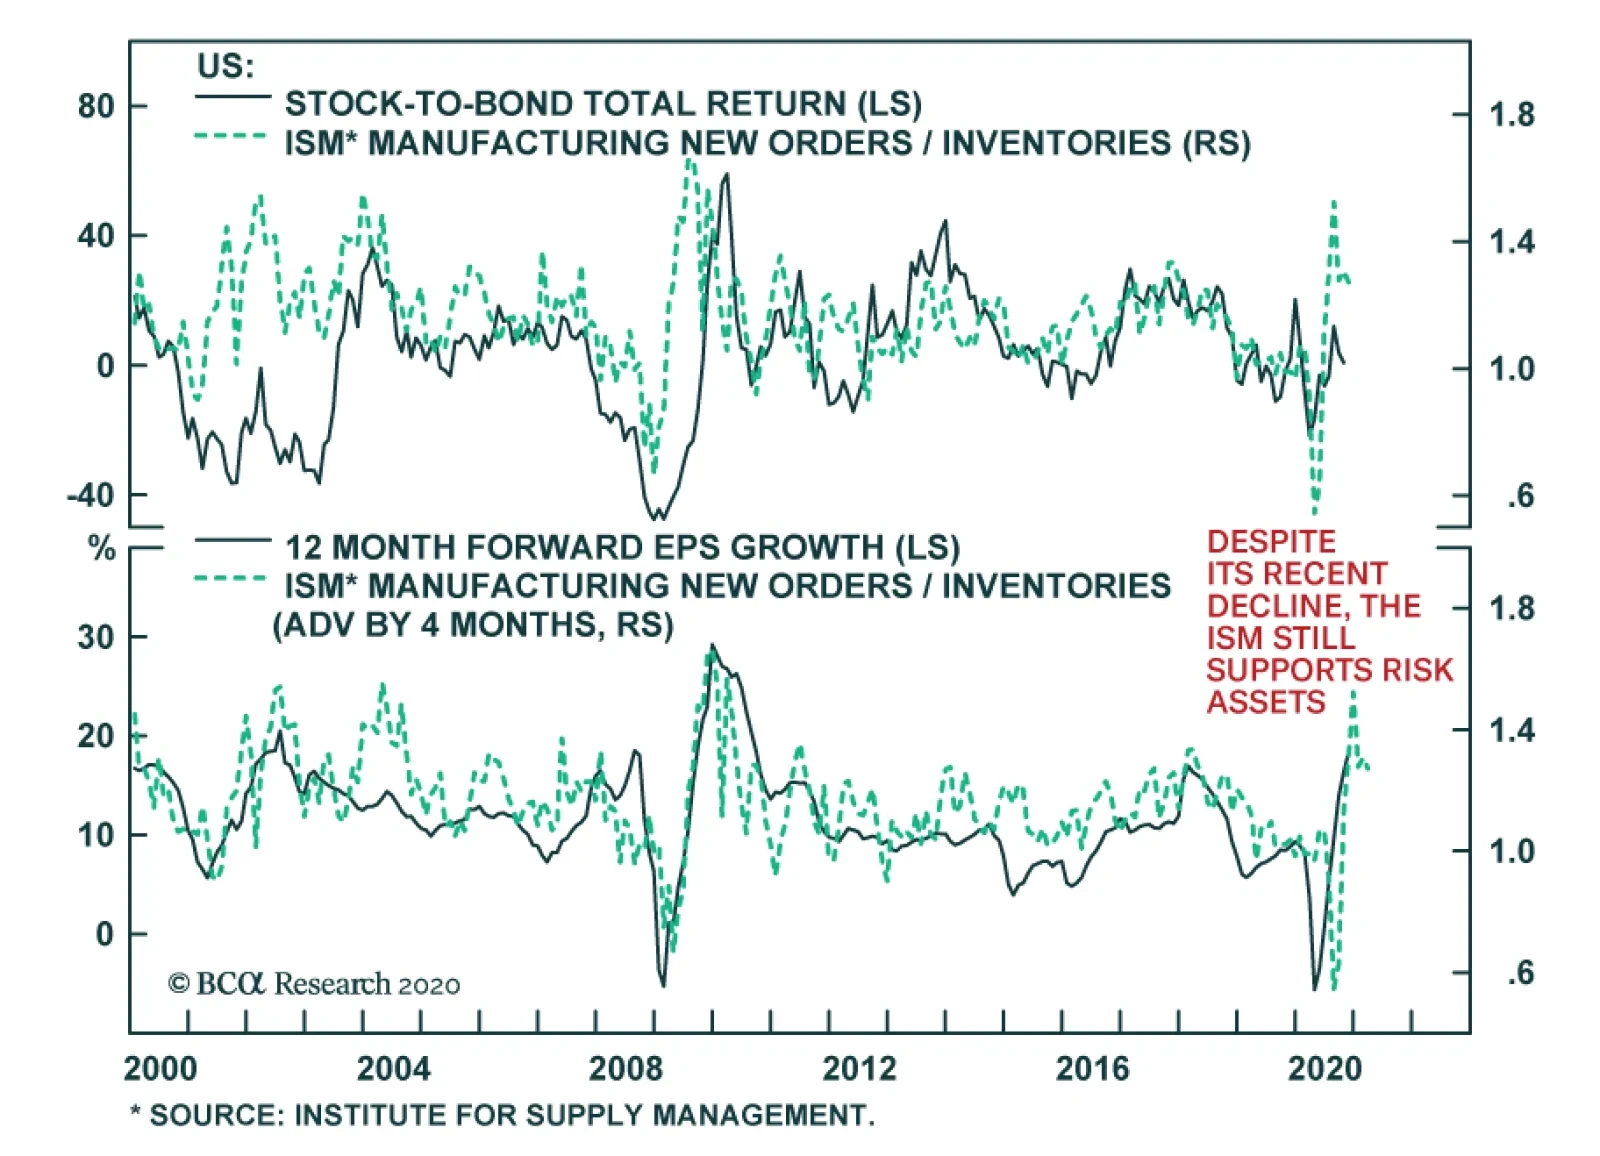
The US ISM Manufacturing Index eased to 57.5 in November from 59.3, below consensus expectations of 58.0. The employment subcomponent was the biggest drag on the overall index, falling to 48.4 after rebounding above the 50 boom-bust mark to 53.2 in October.…