United States

Please note that there will be no US Bond Strategy report next week. We will publish December’s Portfolio Allocation Summary on December 8th, followed by our Key Views For 2021 on December 15th and a Special Report titled “The Fed In 2021” on December 22nd. Highlights Duration: Weaker Q4 economic growth could cause Treasury yields to fall in the near-term, but knowledge of a vaccine coming in 2021 will limit the downside. Investors should maintain below-benchmark portfolio duration on a 6-12 month horizon. Fed: The Treasury’s decision to let the Fed’s emergency lending facilities expire is unlikely to have a meaningful impact on credit spreads, and it may even increase the odds of getting another fiscal stimulus bill through Congress. Spread Product: Value is quickly disappearing from high-rated corporate bonds, and municipal bonds look like an attractive alternative. Stay overweight municipal bonds and corporate bonds rated Ba and higher. Avoid junk bonds rated B and lower. Feature Increasingly, financial markets look caught in a tug-of-war between two competing economic outlooks. On the one hand, the US sits on the precipice of what is likely to be a dark winter. COVID hospitalizations are breaking through prior peaks and deaths are following closely behind (Chart 1). On the other hand, excellent results from vaccine trials offer a ray of light in the not-too-distant future. Focusing on the next 1-to-2 months, economic activity is poised to slow. This is partly because many states will respond to the surging case count by enacting stricter lock-down measures (Chart 2). In fact, New York shuttered schools just last week. But even in the absence of stricter quarantine laws, consumers will certainly exercise greater caution this holiday season. Already, consumer sentiment looks to be waning at a time when more than 700 thousand people are filing new unemployment claims each week (Chart 2, bottom 2 panels). Chart 1A Dark Winter
A Dark Winter
A Dark Winter
Chart 2Look For Slower Growth In Q4
Look For Slower Growth In Q4
Look For Slower Growth In Q4
With consumer sentiment souring at a time when the household income support from the CARES act has expired, it is only a matter of time before consumer spending dips. Added to that, last week’s decision by the Treasury Department to call in the funds used to back-stop the Fed’s emergency lending facilities demonstrates that Donald Trump’s administration will be increasingly erratic during the next two months.1 Chart 3Treasury & Corporate Excess Returns
Treasury & Corporate Excess Returns
Treasury & Corporate Excess Returns
Heightened political uncertainty during a period of slowing economic growth should point to lower bond yields and wider credit spreads in the near term. But, at least so far, the market reaction has been muted (Chart 3). Treasuries have strengthened somewhat during the past week. Treasury returns in excess of cash are running at +735 bps, year-to-date. This is up from +617 bps on November 10th. However, year-to-date investment grade corporate returns in excess of duration-matched Treasuries just hit -121 bps, the highest since February. Year-to-date High-Yield excess returns have dipped to -72 bps, after peaking at -39 bps on November 9th. It’s possible that investors need more evidence of weakening economic growth before the market impact is really felt. Or, it could simply be that forward-looking markets are much more focused on news about the COVID vaccine, and that investors are willing to tolerate a couple months of poor growth if they are confident that better times lie ahead. It’s also conceivable that financial markets would look through a spate of poor economic data if investors believed that more fiscal stimulus is on the way. Given the protracted nature of fiscal negotiations so far, it’s fair to be skeptical that a deal can be struck. But with the election now over, the House Democrats and Senate Republicans may have a greater incentive to compromise on a small relief bill, on the order of $1 trillion or less. According to surveys, a compromise deal would curry favor with voters of all political stripes. Most Republicans, Democrats and Independents support further fiscal aid (Table 1). What’s more, having a timeline for vaccine distribution could make negotiations less contentious, since any stimulus can be sold as the final COVID relief bill before a vaccine is available. Finally, it’s possible that Treasury Secretary Steve Mnuchin’s gambit will pay off, and that policymakers will view the funds being returned by the Fed as “free money” that should be re-deployed in the form of fiscal support. All in all, we are optimistic that a moderately-sized relief bill will be passed, if not this year then early next year. Table 1The Public Supports Another Round Of Stimulus
Preparing For A Dark Winter … But Do Markets Care?
Preparing For A Dark Winter … But Do Markets Care?
Investment Implications Chart 4Better Value In Munis Than IG Corporates
Better Value In Munis Than IG Corporates
Better Value In Munis Than IG Corporates
With regards to our outlook for Treasury yields, we could see yields dip during the next month or two as the economic data weaken. However, we expect the knowledge that a vaccine is on the horizon will prevent yields from falling that much. We also could see progress made on a fiscal stimulus package, which would offset any downward pressure on yields. With that in mind, we advise investors to maintain below-benchmark portfolio duration on a 6-12 month horizon. On spread product, our investment conclusion is similarly colored by the tug of war between a negative near-term economic outlook and the positive news of a COVID vaccine. We recommend maintaining our current positioning: overweight investment grade corporates and Ba-rated junk, underweight junk bonds rated B and lower. If we do get some spread widening during the next month or two, driven by negative economic news or the expiry of the Fed’s emergency lending facilities, we would view that as an opportunity to get more aggressive by upgrading the lower-rated junk credit tiers. One caveat to our positive view on corporate credit is that value has deteriorated markedly in recent months, particularly for higher-rated investment grade corporates (Chart 4). At the same time, tax-exempt municipal bonds offer an exceptional spread pick-up relative to both Treasuries and equivalently-rated corporate bonds (Chart 4, bottom panel). We recommend that investors favor municipal bonds over corporate credit, particularly at the upper-end of the credit spectrum. The value in high-rated investment grade corporates has deteriorated markedly. Bottom Line: Maintain below-benchmark portfolio duration on a 6-12 month horizon. Stay overweight investment grade corporates and Ba-rated junk, while avoiding high-yield bonds rated B and below. Stand ready to upgrade low-rated junk bonds if spreads widen significantly during the next two months. Favor municipal bonds over equivalently-rated corporate credit, particularly at the upper-end of the credit spectrum. Treasury – Fed Disaccord As mentioned above, last week’s big news was that Treasury Secretary Steve Mnuchin sent a letter to the Federal Reserve saying that he would (a) not authorize an extension of some of the Fed’s emergency lending facilities beyond December 31st and (b) would like the Fed to return the unused funds that the Treasury Department had allocated to serve as the equity back-stop for those facilities. Though the Fed issued a statement saying that it would prefer to extend the facilities, Chair Powell eventually acceded to both requests. This means that the Secondary and Primary Market Corporate Credit Facilities (SMCCF & PMCCF), the Municipal Liquidity Facility (MLF), the Main Street Lending Facilities (MSLF) and the Term Asset-Backed Securities Loan Facility (TALF) will all cease operations at the end of the year.2 Gone For Good? Given the Fed’s stated desire for the facilities to continue and the fact that a new Treasury Secretary – presumably one that will show greater deference to the Fed – will take over in January. It’s conceivable that the facilities could be quickly re-started. If the Treasury had simply not authorized an extension of the facilities without taking its money back, this would be as simple as flicking a switch. The fact that the Fed will return the money makes the process slightly more complicated, but by no means impossible. The facilities in question are all structured as Special Purpose Vehicles (SPVs) to which the Treasury Department supplies some amount of equity financing. The Fed then loans money to the SPVs, levering them up dramatically in the process. Crucially, there is no statutory limit on the amount of leverage the Fed can provide to the SPVs. This means that the Fed could ramp them back up, even if it gets only a small injection of capital from the Treasury. A new Treasury Department could easily find enough money in the Exchange Stabilization Fund for the Fed to re-start the facilities in January, without seeking Congressional approval. While the Fed and Treasury will be able to re-start the facilities in January, we aren’t sure they will feel the need to do so. While the Fed and Treasury will be able to re-start the facilities in January, we aren’t sure they will feel the need to do so. In our view, Secretary Mnuchin has a point when he writes that markets are functioning well enough on their own. Simply look at how little the emergency facilities have been used (Table 2). The Fed has purchased only $13 billion of corporate bonds in the SMCCF. TALF has only been tapped for $3.75 billion and both the MSLF and MLF are operating at less than 1% of their maximum capacities. The PMCCF, which the Fed can use to purchase new issuance in the corporate bond market, has never been accessed! Table 2Usage Of The 2020 Federal Reserve Emergency Lending Facilities
Preparing For A Dark Winter … But Do Markets Care?
Preparing For A Dark Winter … But Do Markets Care?
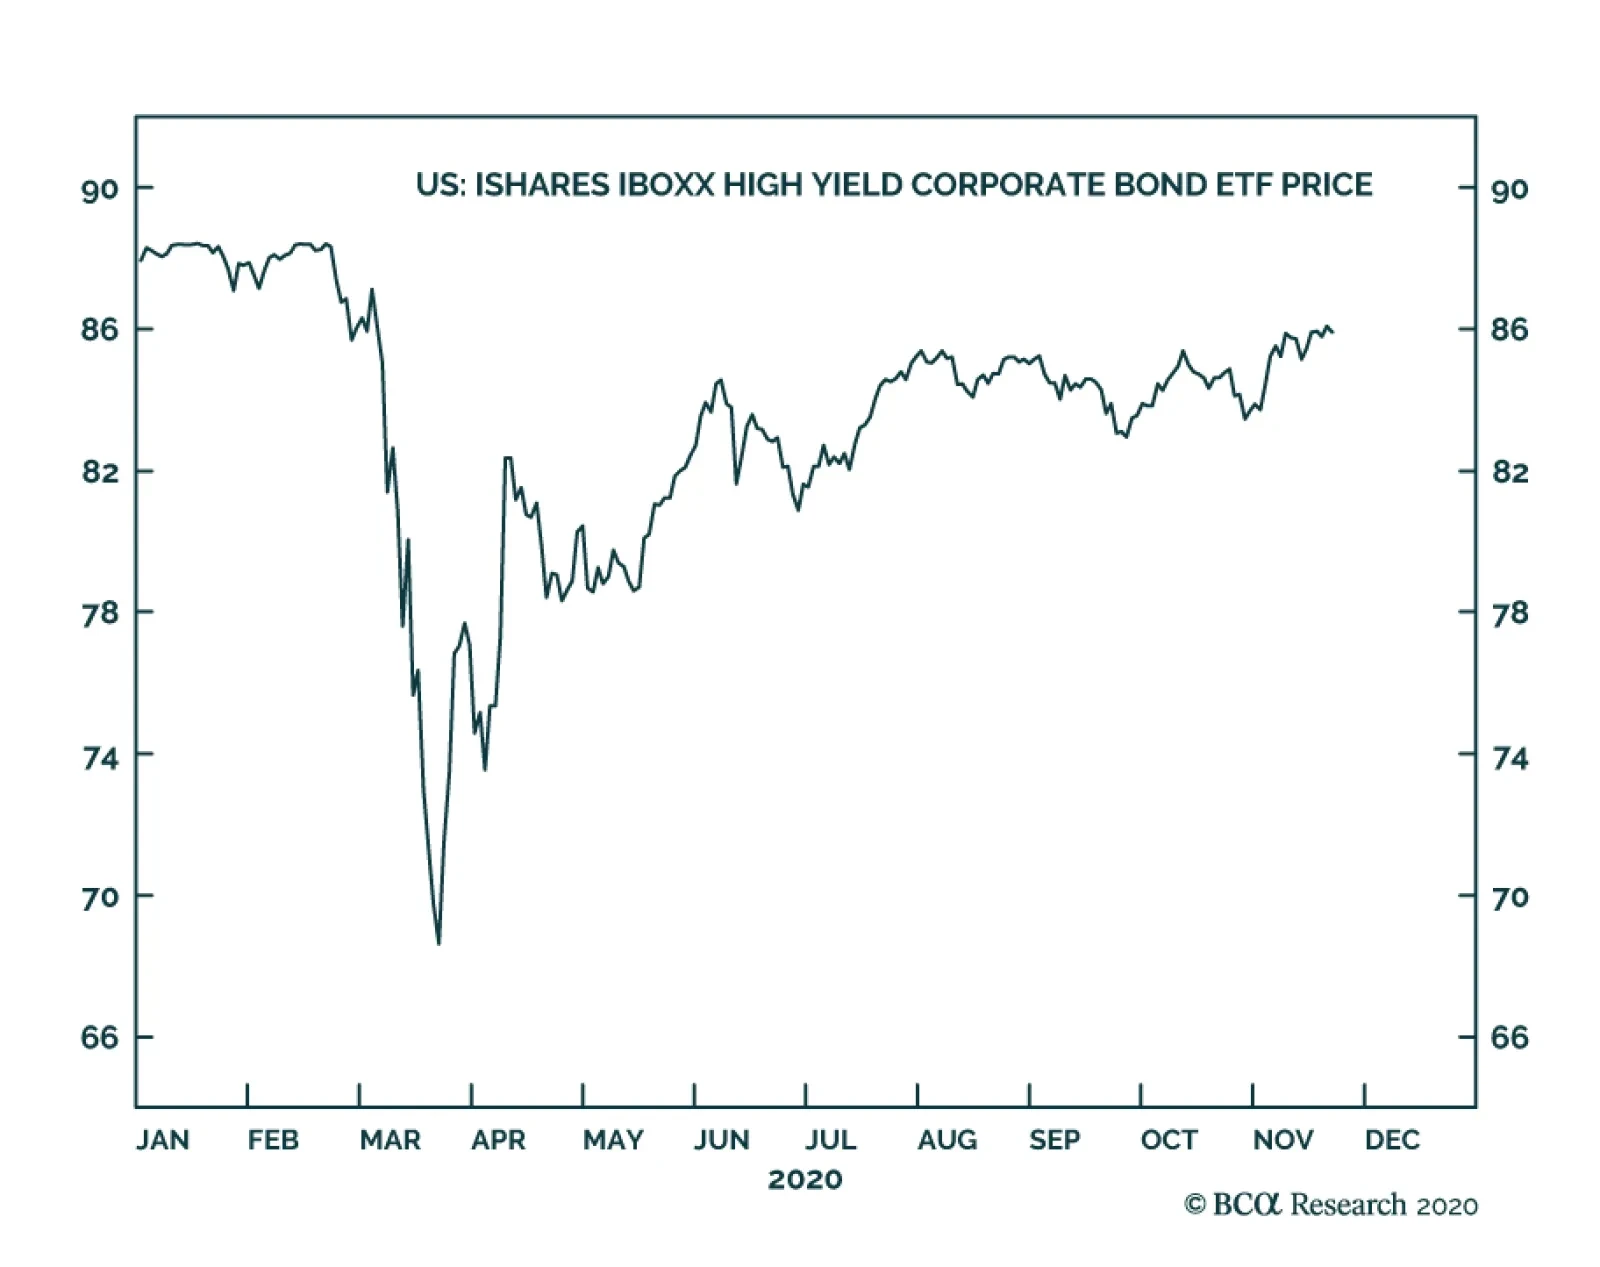
Even the SMCCF, the facility through which the Fed buys corporate bonds and corporate bond ETFs in the secondary market, has significantly scaled back its purchases during the past few months. It also hasn’t purchased an ETF since August (Chart 5). Chart 5The Fed Is Not Very Active In The Corporate Bond Market
Preparing For A Dark Winter … But Do Markets Care?
Preparing For A Dark Winter … But Do Markets Care?
At a certain point, if the facilities aren’t being used, it is entirely reasonable to ask whether they are still necessary. They would no doubt prove useful if we hit another crisis – like in March – where spreads widen sharply and primary markets shut down. But that seems like a relatively low-risk tail event at this stage of the recovery. Finally, Secretary Mnuchin made the case in his letter that the returned funds from the Fed could be re-deployed as fiscal stimulus by Congress. This argument doesn’t make a lot of sense economically. When it scored the CARES act, the Congressional Budget Office assumed that the Treasury would take no losses on the money used to finance the Fed’s emergency lending facilities, so clawing those funds back has no impact on the deficit. But this may not matter. What matters is whether Senate Republicans can use the Treasury’s maneuver as political cover to justify voting for more fiscal relief. We think they might be able to do so, and we therefore see the Treasury’s move as increasing the odds of getting another fiscal relief bill through Congress. Investment Implications Chart 6MLF And TALF Aren't Pushing Yields Lower
MLF And TALF Aren't Pushing Yields Lower
MLF And TALF Aren't Pushing Yields Lower
This development does not immediately influence our recommended investment strategy. On corporate bonds, we can’t definitively rule out the possibility that the expiry of the facilities will cause spreads to widen in the near-term. But if that does occur, we will view it as an opportunity to quickly increase exposure. For municipal bonds, the MLF allows municipal governments to place new debt with the Fed at a rate that varies depending on the municipality’s credit rating. At present, that MLF rate is well above municipal bond yields for all credit ratings (Chart 6), meaning that it would only become important in the event of a crisis that caused municipal yields to rise sharply. Similarly, TALF allows participants to take out loans from the Fed using Aaa-rated securitizations as collateral. But the current yields on Aaa-rated consumer ABS and Aaa-rated non-agency CMBS are 91 bps and 33 bps below this rate, respectively (Chart 6, bottom panel). In other words, spreads would need to widen fairly sharply for TALF to be relevant for investors. The expiry of TALF is more concerning for CMBS than consumer ABS. Commercial real estate is structurally challenged by the current crisis, while consumer balance sheets are in good shape. We recommend overweighting consumer ABS across the entire credit spectrum but would limit non-agency CMBS exposure to the Aaa credit tier. Appendix: Buy What The Fed Is Buying The Fed rolled out a number of aggressive lending facilities on March 23. These facilities focused on different specific sectors of the US bond market. The fact that the Fed has decided to support some parts of the market and not others has caused some traditional bond market correlations to break down. It has also led us to adopt of a strategy of “Buy What The Fed Is Buying”. That is, we favor those sectors that offer attractive spreads and that benefit from Fed support. The below Table tracks the performance of different bond sectors since the March 23 announcement. We will use this to monitor bond market correlations and evaluate our strategy’s success. TablePerformance Since March 23 Announcement Of Emergency Fed Facilities
Preparing For A Dark Winter … But Do Markets Care?
Preparing For A Dark Winter … But Do Markets Care?
Ryan Swift US Bond Strategist rswift@bcaresearch.com Footnotes 1 The second section of this report (titled “Treasury – Fed Disaccord”) examines the specific market implications of the Treasury Department’s decision to not authorize an extension of the Fed’s emergency lending facilities. 2 For details on how these facilities are structured and what they are designed to do please see US Investment Strategy / US Bond Strategy Special Report, “Alphabet Soup: A Summary Of The Fed’s Anti-Virus Measures”, dated April 14, 2020 and US Investment Strategy / US Bond Strategy Special Report, “Alphabet Soup Part 2: Shocked And Awed”, dated July 28, 2020, available at usbs.bcaresearch.com Fixed Income Sector Performance Recommended Portfolio Specification
The collapse in government bond yields this year has caused a surge in investor interest in assets with the potential to add incremental yield to a portfolio. Within a global government bond portfolio, our Global Fixed Income Strategy service has emphasized…
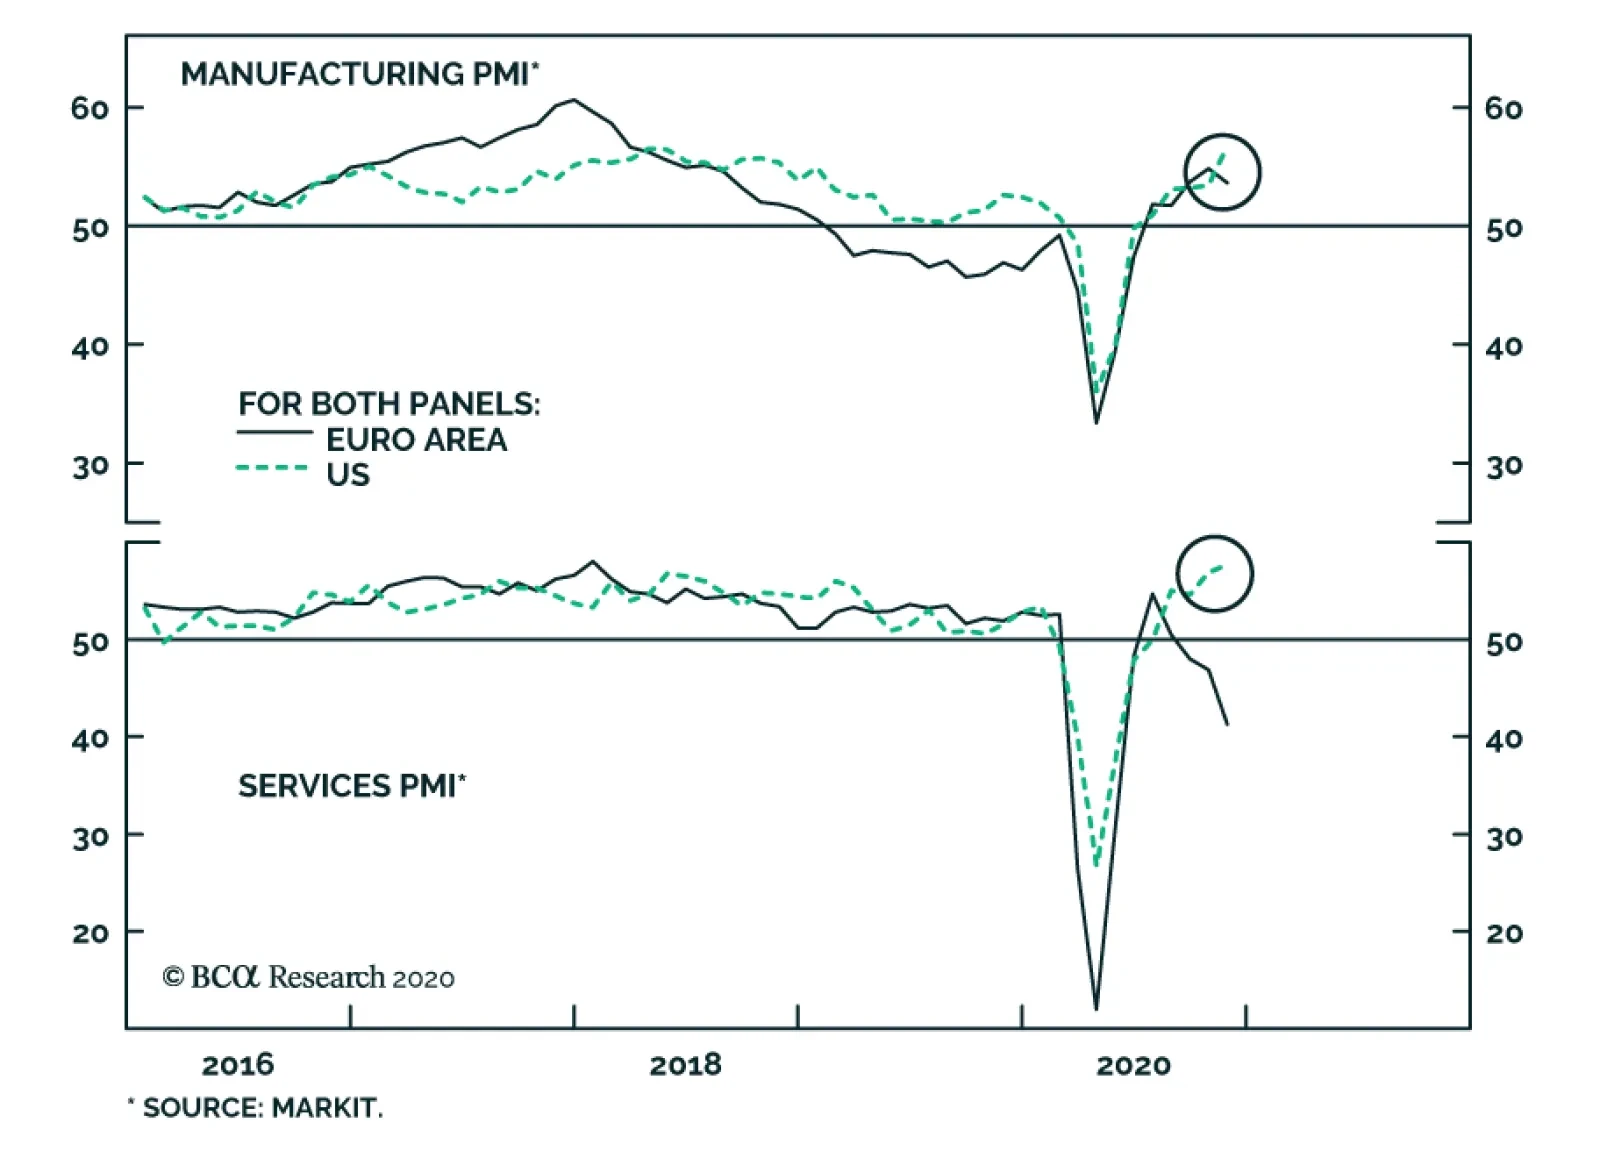
The Eurozone Flash Composite PMI in November fell from 50 to 45.1, the lowest reading since May. The collapse in services led the overall index lower. It fell to 41.3 from 46.9, slightly below expectations of 42 and reflecting the impact of the lockdown…
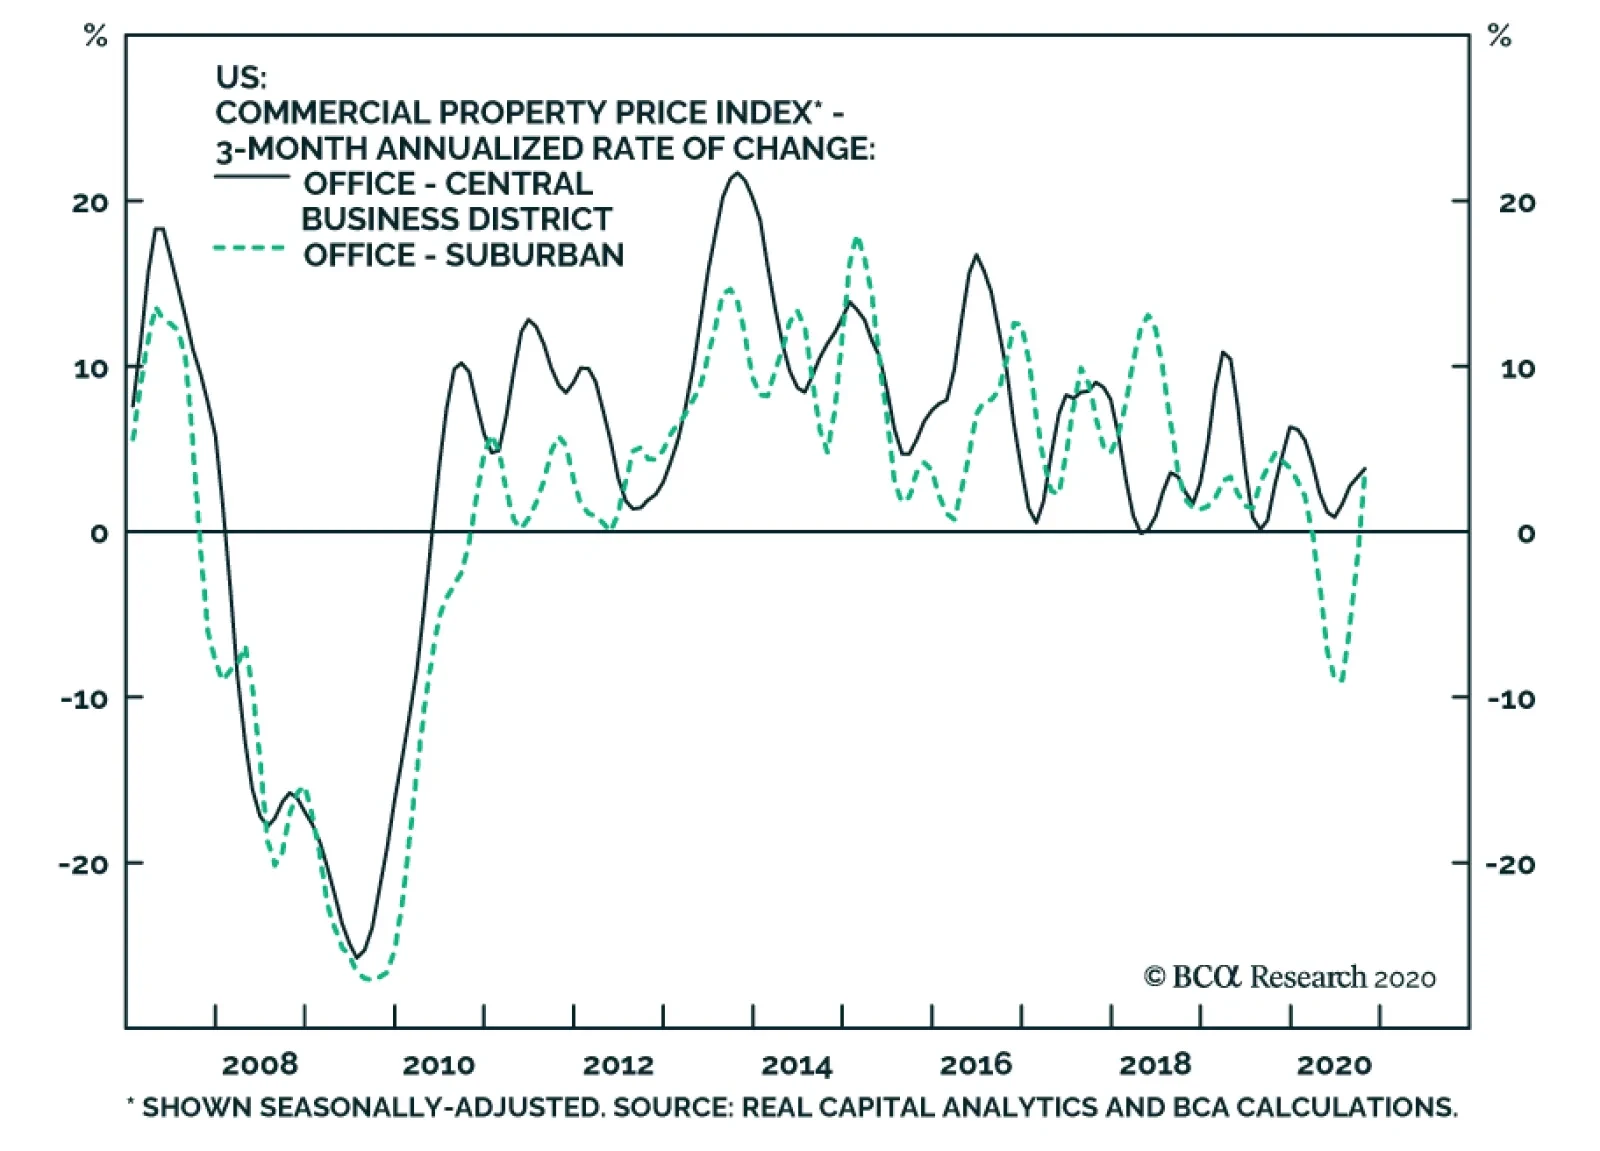
We noted in a late-October Insight that a disaster in the office segment of the US commercial real estate market had not yet occurred. November’s update to CRE prices reinforces this view. The chart above shows the 3-month annualized rate of change in…
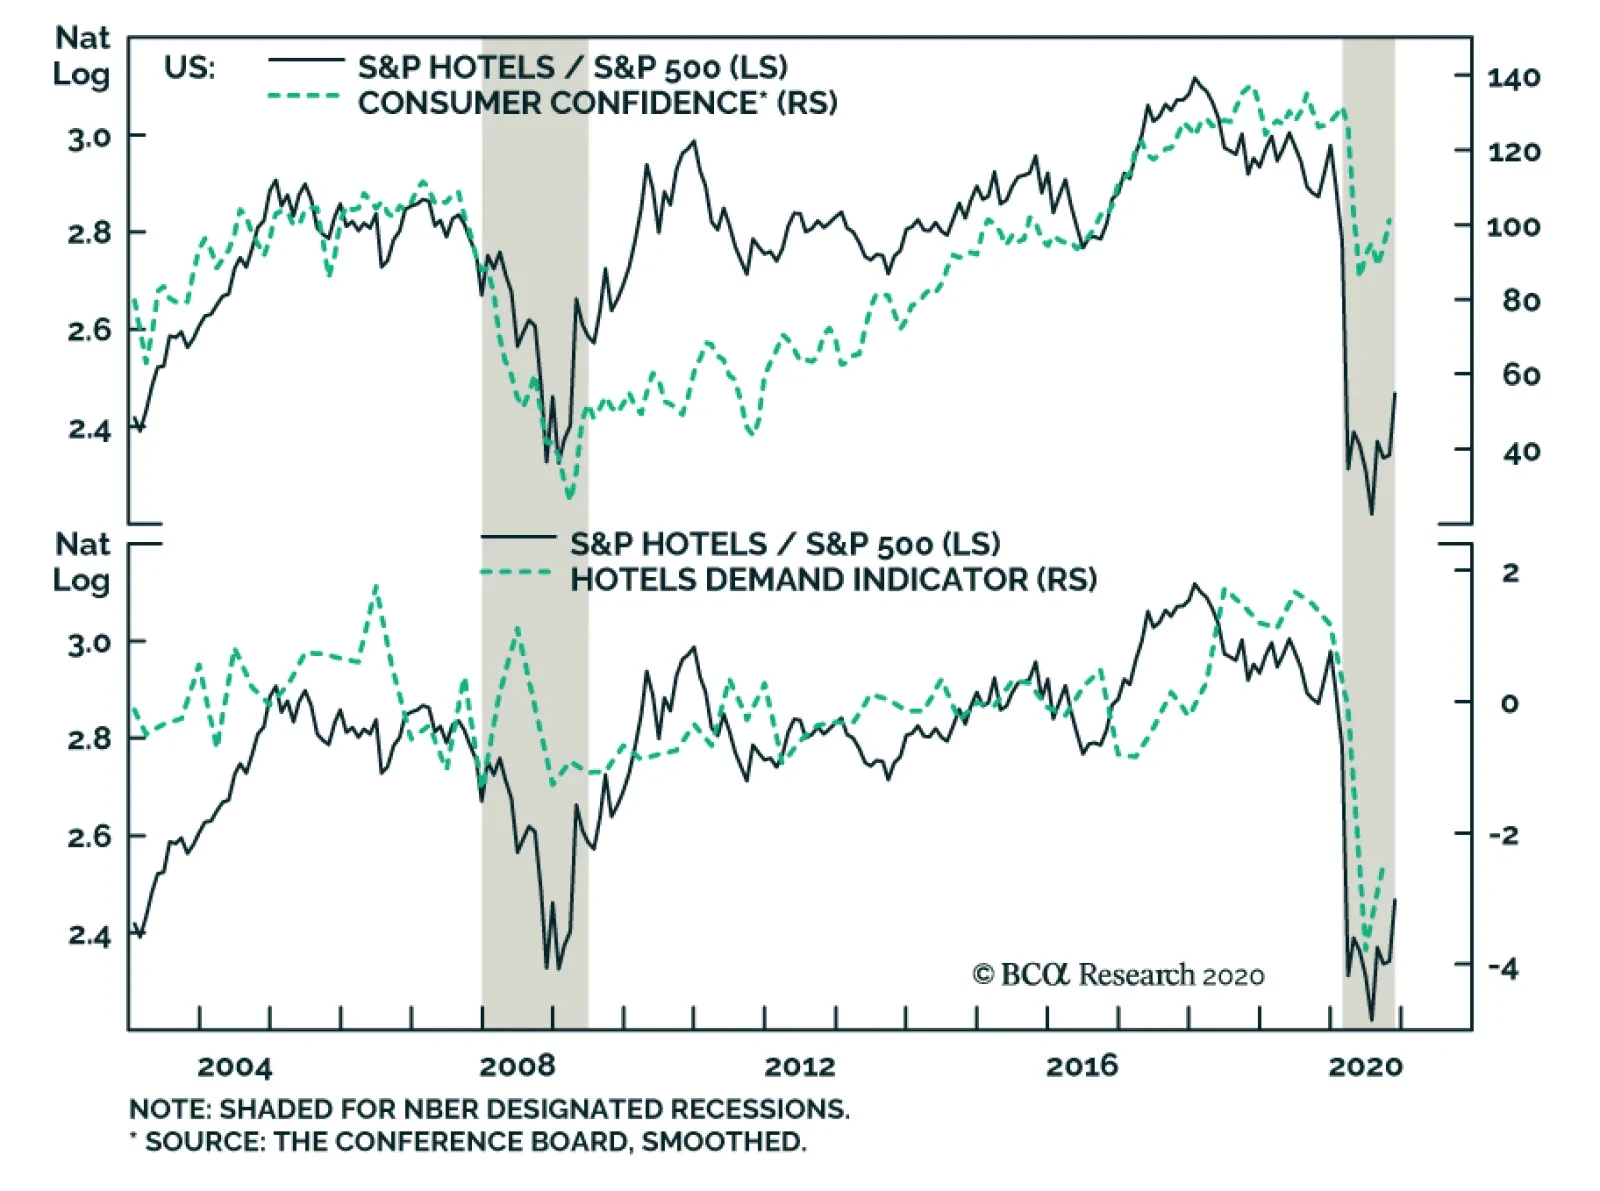
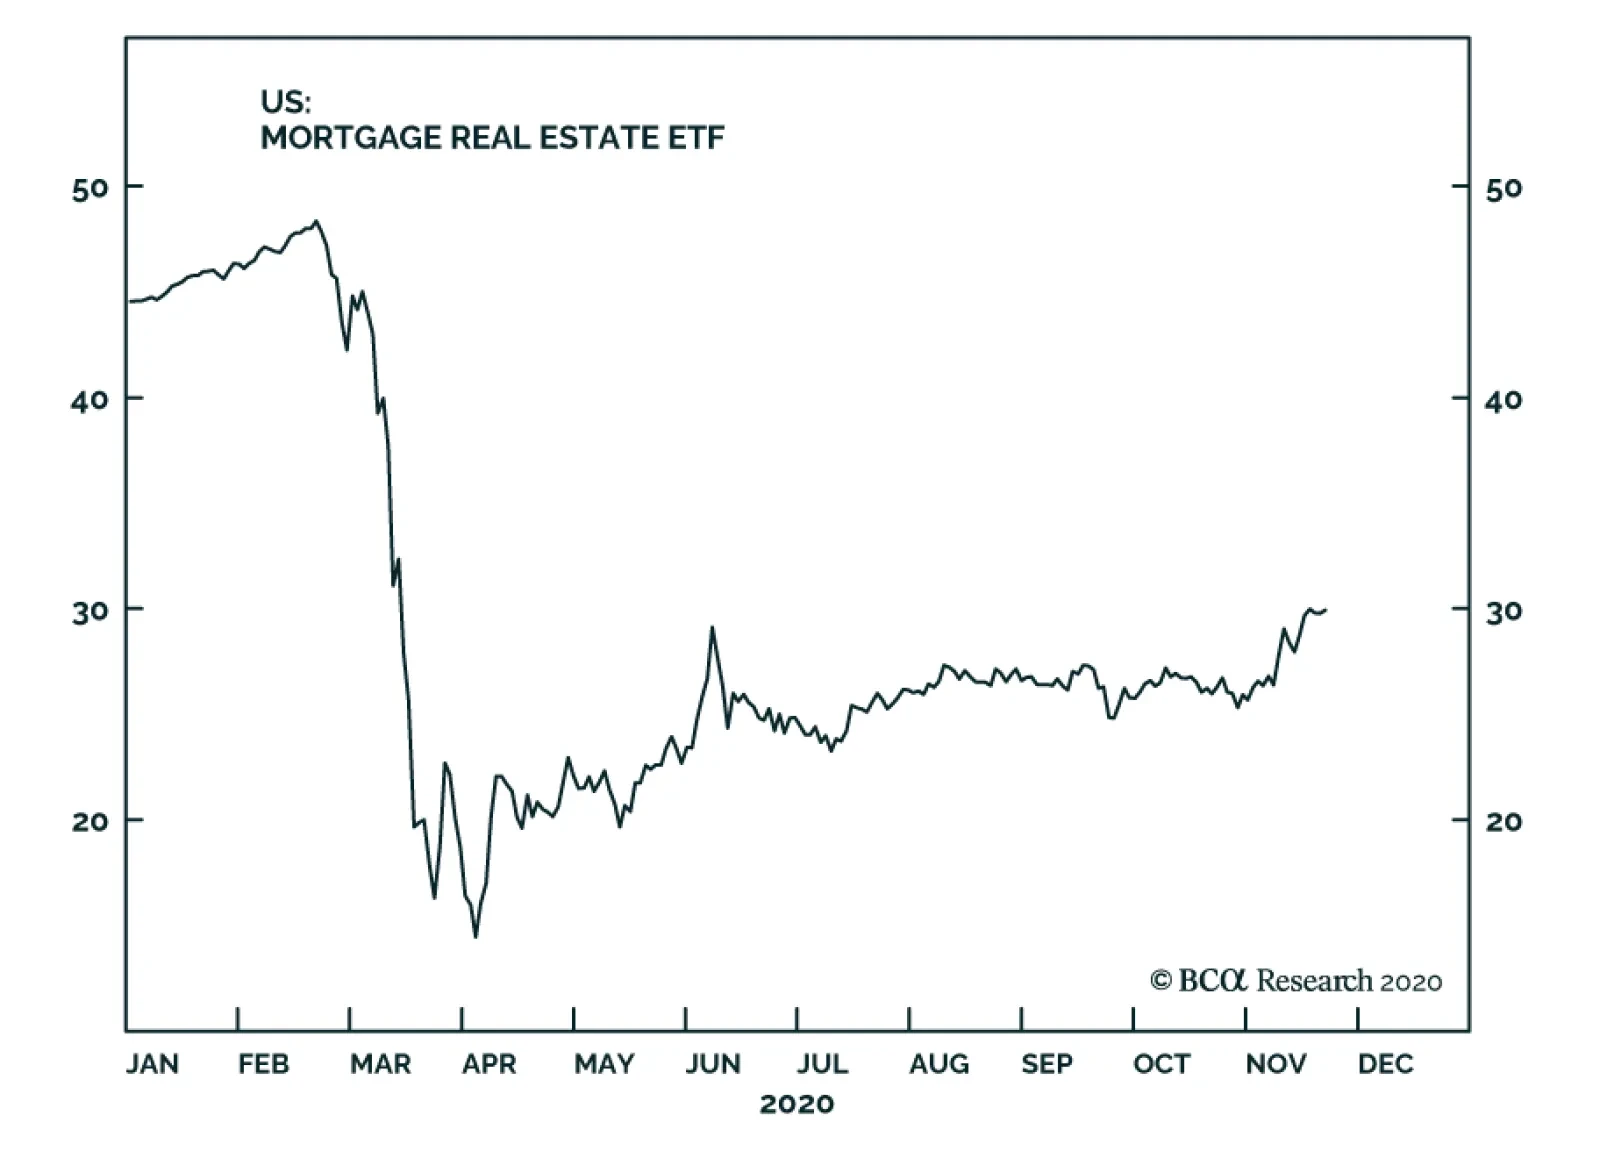
BCA Research's US Equity Strategy service has upgraded the S&P hotels, resorts & cruises index to an overweight stance. Relative share prices have bounced from an extremely depressed level, only last seen during the GFC and not far off from the…
Dear Client, As is custom every year, next Monday November 30 instead of our regular Strategy Report you will receive BCA’s flagship publication “The Bank Credit Analyst” detailing the house views and themes for next year. Our regular publishing schedule resumes on December 7 with our 2021 High-Conviction Calls Strategy Report. On December 14 we will host a Webcast to discuss our calls in more detail and answer questions. Happy Thanksgiving. Kind Regards, Anastasios Highlights Portfolio Strategy A firming demand backdrop for lodging services courtesy of the positive vaccine news, enticing industry operating metrics along with compelling valuations encourage us to take a punt on the niche S&P hotels, resorts & cruise line index. In marked contrast, we recommend investors avoid the high-flying S&P homebuilding index. Home-related survey data paint a rosy picture for homebuilding demand in the coming months underpinned by low mortgage rates and low housing supply. Nevertheless, most of the good news is baked in resurgent homebuilder stock prices and the prospects of rising interest rates, a looming profit margin squeeze and extremely high earnings expectations warn that the time is ripe to shed S&P homebuilding exposure. Recent Changes Upgrade the S&P hotels, resorts & cruise lines index to overweight, today. Downgrade the S&P homebuilding index to underweight, today. Feature Similar to two Mondays ago, the SPX opened weekly trading with gusto courtesy of MRNA’s 94% efficacy vaccine news, but failed to breach previous all-time highs. The market has rallied roughly 10% this month, and while we remain cyclically and structurally bullish, a short-term consolidation period is likely in the cards. Extremely easy financial conditions along with a near halving in implied volatility – which have been key rally drivers since the March lows as we pointed out numerous times in our research – are nearly perfectly priced in the SPX. The implication is that were a meaningful rally to resume, further easing is required which is a tall order (top panel, Chart 1). Another factor underpinning the market’s recent advance is the drop in the CBOE’s implied correlation index (pair wise correlation of S&P500 constituents, shown inverted, bottom panel, Chart 1). However, correlations have collapsed and are near levels that have marked prior temporary peaks in the SPX. Beyond near-term jitters, output is poised to recover smartly next year and most importantly so are SPX EPS. In a recent Special Report we lifted our EPS target to $168 for calendar 2021 and introduced an end-2021 SPX target of 4,000. The GS Current Activity Indicator corroborates our macro four-factor profit growth estimate and heralds a slingshot EPS recovery next year (Chart 2). Chart 1Good News Is Priced In
Good News Is Priced In
Good News Is Priced In
Chart 2One More V-Shape Is Coming
One More V-Shape Is Coming
One More V-Shape Is Coming
Turning over to capital spending, the latest GDP report was revealing. On the surface private sector capex made a splash with non-residential investment contributing 2.88% to real GDP growth, the highest since Q4/1983 when the economy was recovering from that severe double-dip recession. In absolute terms, the Q/Q annualized growth clocked in at over 20%, a growth rate last seen in the late-1990s (Chart 3). Drilling deeper into capex is instructive. Technology investment was on fire. Surprisingly, software took the back seat and investment in tech goods roared. In other words, this data confirms that businesses and consumers alike prepared to work from home and bought up tech gadgets en masse, and stole demand from the future (Chart 3). Looking ahead we expect a reversal of this trend with software retaking the reigns and the rest of the tech sector fading. As a reminder, while base effects really augmented this capex rebound, recovering animal spirits signal that a capex upcycle is in the offing. We have shown in the past that as profits grow, CEOs become more confident in the longevity of the cycle and choose to deploy long-term oriented capital, albeit with a one-year lag. Eventually, this creates a virtuous upcycle where rising profits lead to rising capital outlays that further boost sales and profits and sustain the positive feedback loop (Chart 4). Chart 3Exploring Investment Data
Exploring Investment Data
Exploring Investment Data
Chart 4Lagging Capex Will Also Recover
Lagging Capex Will Also Recover
Lagging Capex Will Also Recover
This week we make two sub-surface consumer discretionary sector changes further adding exposure to our back-to-work reopening laggards and shedding exposure to work-from-home winners. Open For Business While admittedly we were early in locking in gains in the S&P hotels, resorts & cruises index last spring by lifting exposure to neutral from underweight, today we are compelled to augment this niche leisure index to an overweight stance. Relative share prices have bounced at a level last seen during the GFC and not far off the level hit post the 9/11 accelerated recession that dealt a big blow to everything travel related (top panel, Chart 5). The recent positive vaccine news is a key reason we are warming up to this consumer discretionary sub group. While neither lodging nor cruise line vacationing will return to their previous peaks any time soon, both industries will survive and thus should no longer be priced for bankruptcy. Industry pricing power has plunged, but it is trying to trough at an extremely depressed level (middle panel, Chart 5). As a result, profit margins have gone haywire (bottom panel, Chart 5), but again most of the negative news is likely priced into this negative profits backdrop. Chart 5Fell Off A Cliff…
Fell Off A Cliff…
Fell Off A Cliff…
One key industry demand determinant is confidence. Consumer sentiment has staged a W-shaped recovery and while still flimsy the brightening vaccine efficacy news should catapult it higher in the coming quarters. The implication is that the wide gulf between consumer confidence and relative share prices will narrow via a catch up phase in the latter (top panel, Chart 6). Closely linked to the budding recovery in confidence are discretionary versus non-discretionary retail sales. Thus, the latter have been tightly correlated with the oscillations in relative share prices, and the current message is positive (top panel, Chart 7). Chart 6...But There Are Signs Of Life
...But There Are Signs Of Life
...But There Are Signs Of Life
Moreover, the ISM non-manufacturing survey is on a sling shot recovery following the depths of the spring readings. This rebound also suggests that the path of least resistance is higher for lodging stocks (middle panel, Chart 6). Chart 7Enticing Signals
Enticing Signals
Enticing Signals
On the business side, capex intentions are slated to increase in the coming year – as we highlighted above on the back of recovering animal spirits – and by extension so will business-related travel (bottom panel, Chart 7). Our hotel demand indicator does an excellent job at encapsulating all these different forces and forecasts an enticing lodging services demand backdrop into 2021 (bottom panel, Chart 6). Already, consumer outlays on hotels are staging a comeback albeit from an extremely depressed level. The upshot is that an earnings-led rebound is in the cards (middle panel, Chart 7). With regards to industry operating metrics, industry executives have reined in expansion plans: construction spending on hotels has been contracting all year long. At the margin, such a supply restraint on the heels of a seven-year expansion phase is quite encouraging (middle panel, Chart 8) as it will aid in the industry’s efforts to lift beaten down occupancy rates. Another reassuring industry operating metric is the confirmation that hotel workers are returning to work. Not only has leisure and hospitality employment absorbed more than half the losses suffered since the spring carnage, but also industry hours worked have ticked higher of late (bottom panel, Chart 8). Finally, washed out technicals and extremely alluring valuations provide an attractive reward/risk tradeoff at the current juncture (Chart 9). Chart 8Receding Supply Is Good
Receding Supply Is Good
Receding Supply Is Good
Chart 9Plenty Of Upside
Plenty Of Upside
Plenty Of Upside
Netting it all out, a firming demand backdrop for lodging services courtesy of the positive vaccine news, enticing industry operating metrics along with compelling valuations encourage us to take a punt on the niche S&P hotels, resorts & cruise line index. Bottom Line: Upgrade the S&P hotels, resorts & cruise lines index to overweight, today. The ticker symbols for the stocks in this index are: BLBG: S5HOTL – MAR, HLT, CCL, RCL, NCLH. Contrarian Housing Call Today we recommend a downgrade in the S&P homebuilding index to underweight. Since the March 23 SPX lows, consumer discretionary stocks are up 74%, besting the S&P 500 by 1500 basis points (bps). While single stock GICS4 sub-groups like household appliances (i.e. Whirlpool) have reached escape velocity rising over 200% over the same time frame, the S&P homebuilding index is also up a whopping 140%. While we were quick enough to close our underweight recommendation in March and cement impressive relative gains for the portfolio to the tune of 50%, we refrained from lifting exposure all the way to overweight and remained at benchmark. As a reminder, we opted instead to play a housing rebound via the sister home improvement retail index in mid-April that also added significant alpha to our portfolio. Residential real estate optimism abounds. The media’s bombardment is non-stop reminding consumers of runaway home prices, all-time lows in fixed mortgage rates (third panel, Chart 10) and nearly non-existent housing inventory (supply of homes shown inverted, middle panel, Chart 11), painting an urgency to stampede into home buying (top panel, Chart 11). Chart 10Positives Reflected In Prices
Positives Reflected In Prices
Positives Reflected In Prices
Chart 11The Good…
The Good…
The Good…
True, the COVID-19 recession has acted as an accelerant to the suburban housing boom and there is an element of at least a semi-permanent shift away from city centers and toward the suburbs as the work-from-home flexibility is not a fad. Tack on all-time highs on the overall NAHB housing sentiment survey and a number of sub-components like sales expectations (second panel, Chart 10) and no wonder mortgage applications to purchase a new home are also flirting with multi-year highs (bottom panel, Chart 10). Another survey, part of the Conference Board’s consumer confidence monthly survey, revealed that consumers’ plans to buy a new home are also probing all-time highs (second panel, Chart 10). Even the Fed’s October Senior Loan Officer survey highlighted that demand for residential mortgage loans is on the mend (bottom panel, Chart 11). However, we deem that most, if not all, of the good news is already priced in galloping homebuilders stock prices and exuberant expectations. While being contrarian is fraught with danger, as more often than not the herd is right, there is a key macro driver that gives us confidence to our going against the grain housing trade: interest rates. If our economic reopening thesis proves accurate next year, then the COVID-19 winners – homebuilders included – will take the back seat. Importantly, as the economy rebounds and is ready to stand on its own two feet, then the selloff in the bond market should gain significant steam. Using our 100-125bps rule of thumb to gauge how much monetary tightening the economy can withstand in a year’s time, then the 10-year US Treasury yield can hit 1.5% by next March. Historically, interest rates and relative share prices have been inversely correlated and a steep selloff in the bond market is bad news for homebuilding stocks (top panel, Chart 12). Chart 12...The Bad...
...The Bad...
...The Bad...
Chart 13...And The Ugly
...And The Ugly
...And The Ugly
Meanwhile on the operating housing front, some cracks are forming. New home sales, while brisk in absolute terms, are losing out to existing housing sales and homebuilders have resorted to price concessions in order to drive volumes (second, third & bottom panels, Chart 12). Profit margins are at the highest mark since the subprime crisis and are vulnerable to a squeeze not only from lower selling prices, but also from rising input costs. Framing lumber comprises roughly 15% of a new home’s commodity related costs and lumber prices have been expanding all year long (Chart 13). Finally, unfettered sell-side optimism reigns supreme. Net earnings revisions cannot go any higher as they hit a wall at the 100% ceiling. One year forward relative profit growth expectations are literally through the roof, and even five-year relative EPS growth estimates are up 1500bps since the 2019 nadir (Chart 14). All these metrics represent a high bar for homebuilders to surpass and we would lean against such extreme enthusiasm toward this niche early-cyclical group. However, there is a key risk to our bearish homebuilders call we are monitoring: cheap valuations. On relative forward P/E, trailing P/S and EV / EBITDA bases, home construction stocks offer compelling value (bottom panel, Chart 14). Whether this is a value opportunity or a trap, the jury is still out. For the time being we side with the latter. Chart 14Peak Sell-Side Euphoria
Peak Sell-Side Euphoria
Peak Sell-Side Euphoria
In sum, home-related survey data paint a rosy picture for homebuilding demand in the coming months underpinned by low mortgage rates and low housing supply. Nevertheless, most of the good news is baked in resurgent homebuilder stock prices and the prospects of rising interest rates, a looming profit margin squeeze and extremely high earnings expectations warn that the time is ripe to shed S&P homebuilding exposure. Bottom Line: Trim the S&P homebuilding index to underweight, today. The ticker symbols for the stocks in this index are: BLBG: S5HOME – LEN, PHM, DHI, NVR. Anastasios Avgeriou US Equity Strategist anastasios@bcaresearch.com Current Recommendations Current Trades Strategic (10-Year) Trade Recommendations
Priced For Perfection
Priced For Perfection
Size And Style Views October 26, 2020 Favor small over large caps July 27, 2020 Overweight cyclicals over defensives June 11, 2018 Long the BCA Millennial basket The ticker symbols are: (AAPL, AMZN, UBER, HD, LEN, MSFT, NFLX, SPOT, TSLA, V). January 22, 2018 Favor value over growth
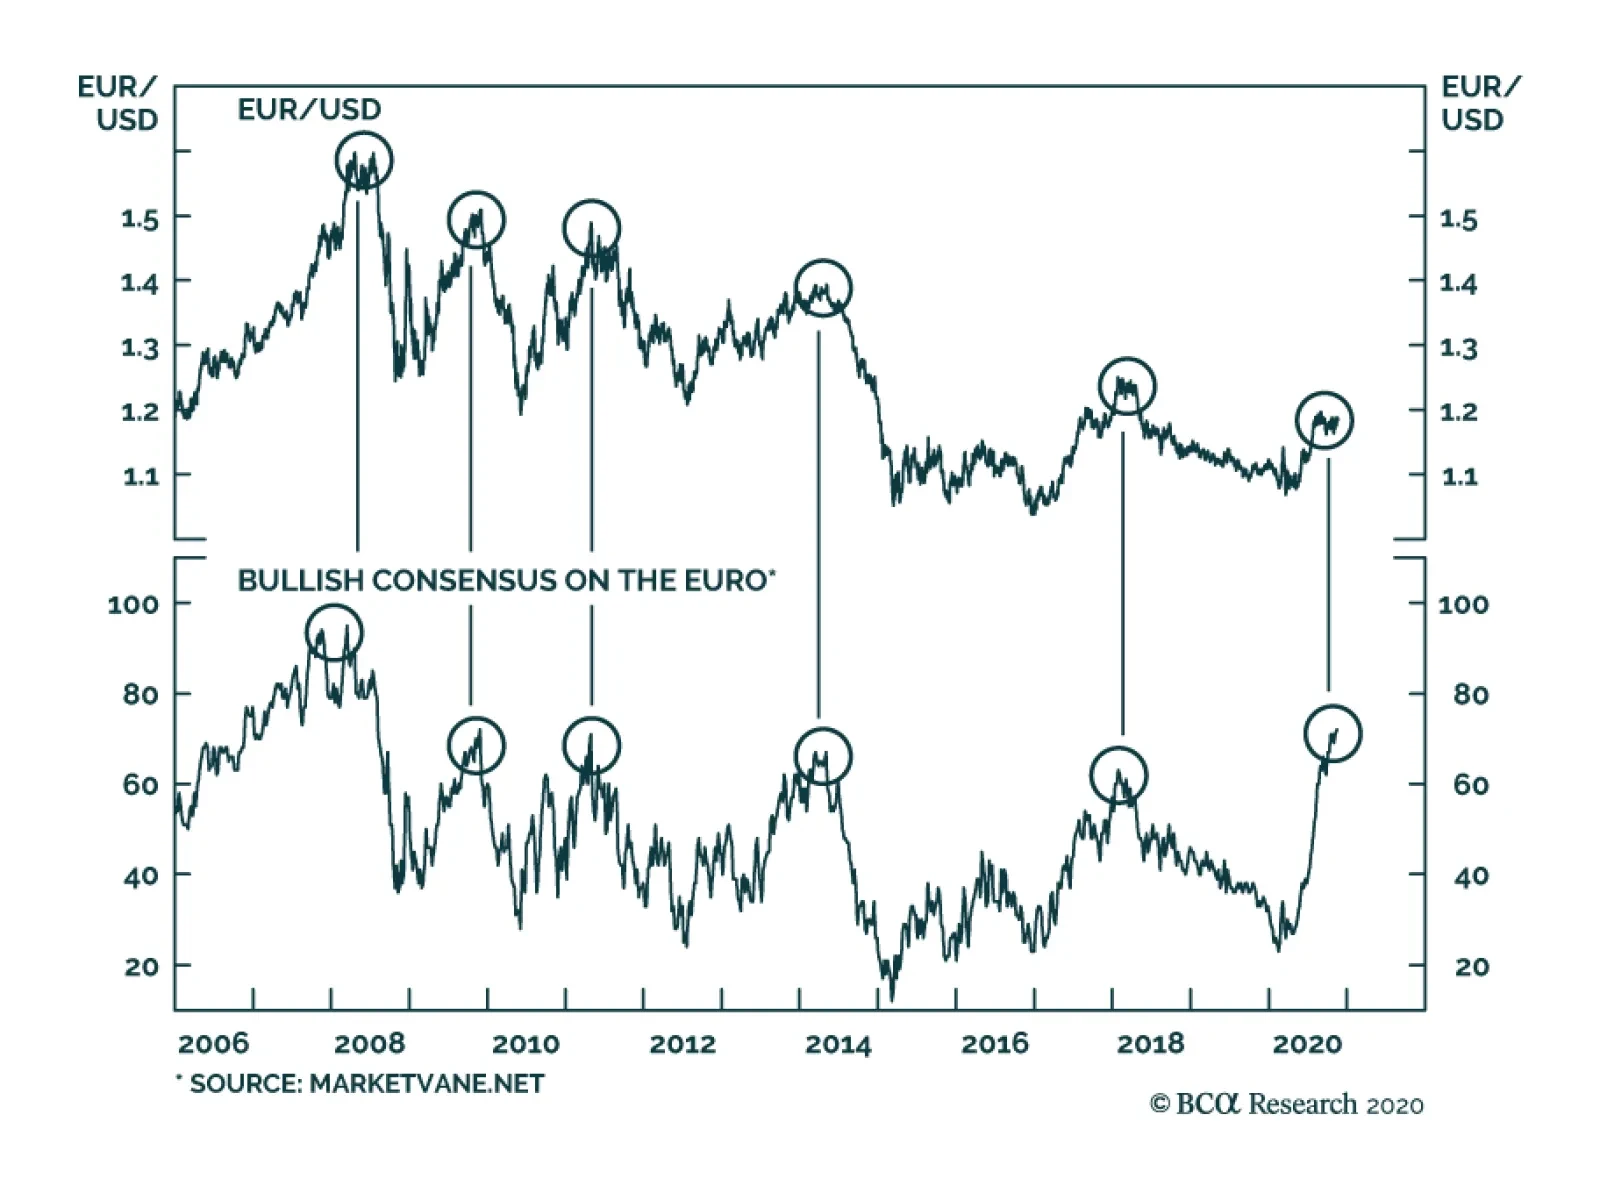
According to BCA Research's Foreign Exchange Strategy service, there is some evidence that the euro could gravitate to 1.50 over the next few years. The key assumption is that the equilibrium rate of interest will rise in the euro area relative to that in…
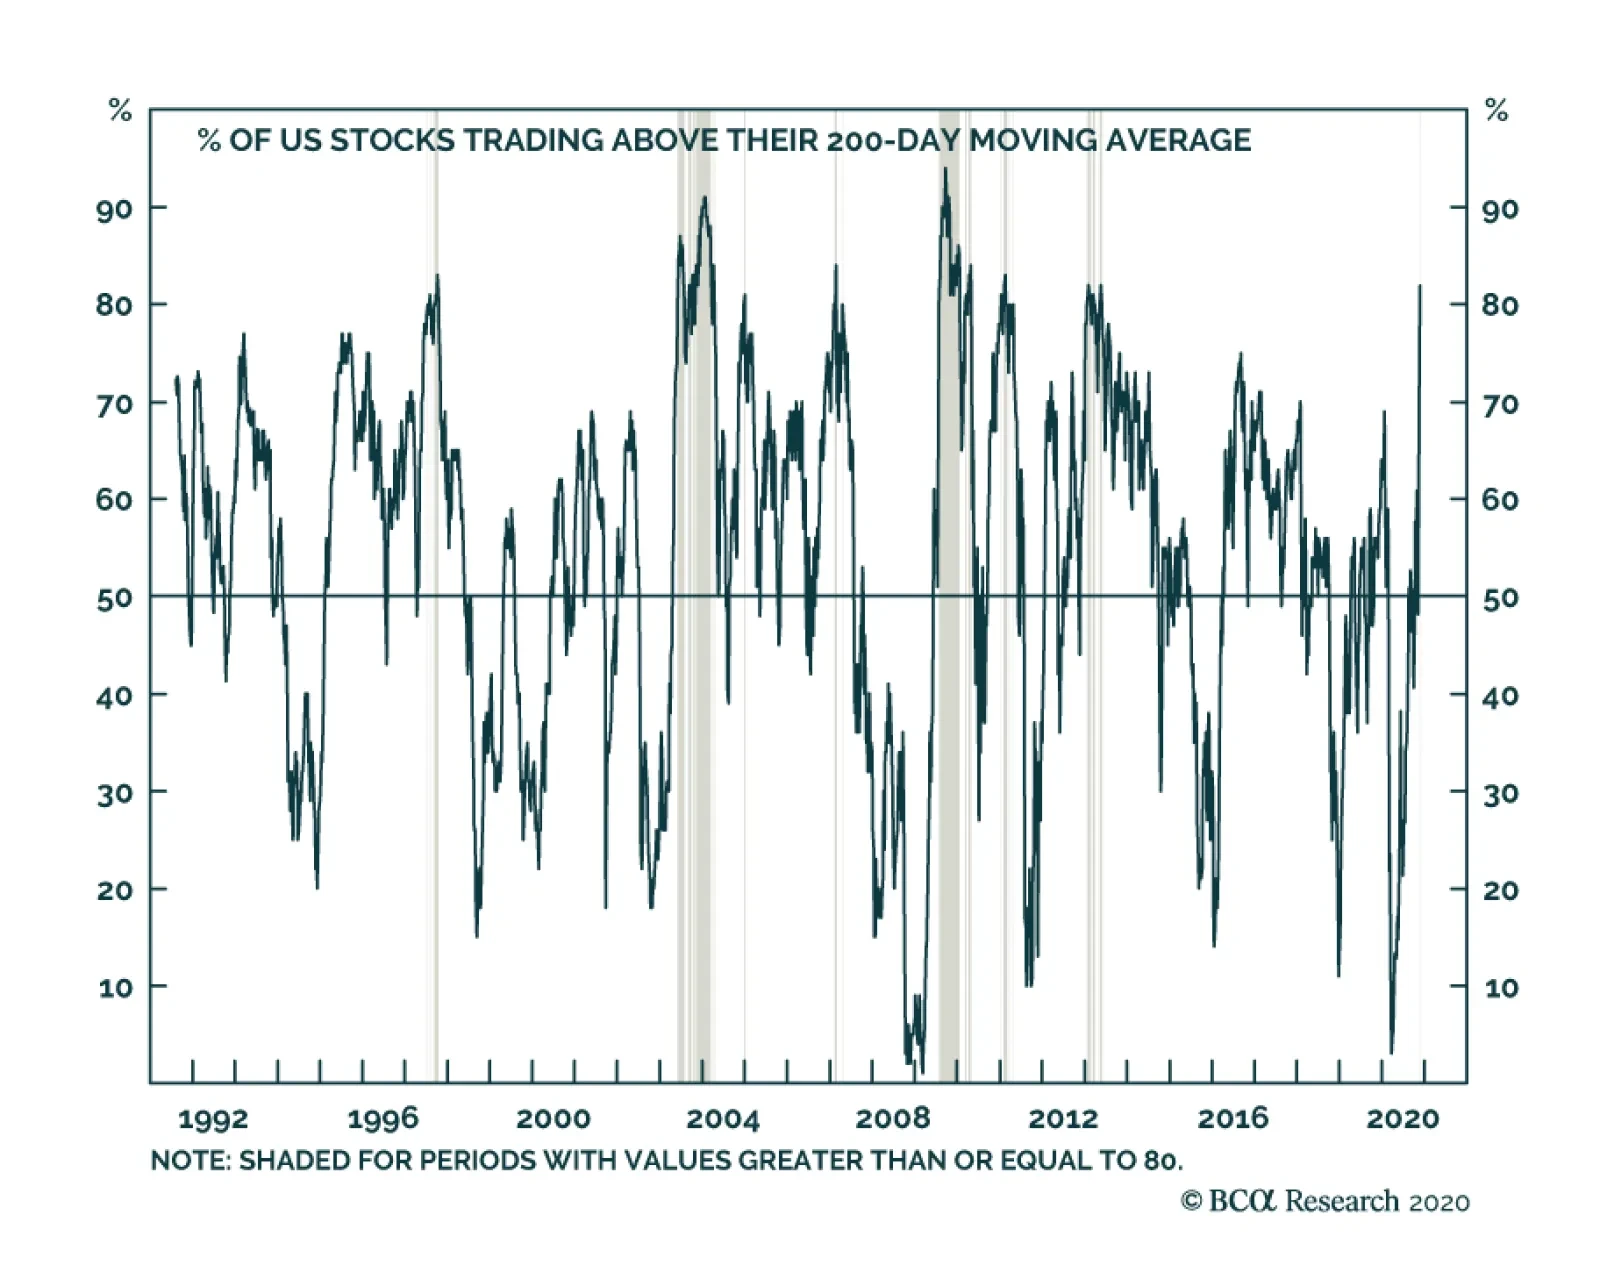
The chart above shows a measure of breadth for the US equity market that has recently caught the attention of some investors. It shows that the percent of US stocks trading above their 200-day moving average has risen above 80%, the highest point since…
On Friday, Treasury Secretary Mnuchin requested that the Fed return unused funds from some select emergency facilities that were unveiled earlier this year, and is not seeking to renew them when they expire on December 31st 2020. These programs include the…
Today we update our Millennial Basket as TSLA and UBER have gone vertical this month rising 29% and 46%, respectively. Specifically, we rebalance the basket back to an equal weight with AAPL, UBER, LEN, and TSLA being rebalanced lower, and AMZN, HD, MSFT, NFLX, SPOT, and V higher. Our Millennial Basket is up 116% in absolute terms and 68% relative to the SPX since inception in our June 11, 2018 Special Report. In addition, we also recommended investors overweight our Millennial Basket on a secular ten year view basis, predicated upon our Millennials spending theme. While profit potential has not changed, recent news and price action in TSLA (eerily reminiscent of the YHOO inclusion in the SPX announcement 21 years ago on November 30th 1999!) compel us to rebalance this basket back to equal weight. We also add another layer of risk management in order to protect cyclical-only profits and institute a rather wide rolling 18% stop. Bottom Line: We reiterate our structural and cyclical overweight stance on our Millennial Basket, but today we recommend an 18% rolling stop in order to protect cyclical-only profits. The ticker symbols in the US Equity Strategy Millennials Basket are: AAPL, AMZN, UBER, HD, LEN, MSFT, NFLX, SPOT, TSLA, and V.
Rebalancing Our Millennial Basket
Rebalancing Our Millennial Basket