United States

Similar to last Monday, the SPX opened weekly trading with gusto courtesy of the MRNA’s 94% efficacy vaccine news, but failed to breach previous all-time highs. In the short-term there are high odds that the SPX will move sideways, before rallying higher, in order to digest the recent up move and work off overbought conditions. According to the American Association of Individual investors (AAII), bulls are back in droves and the AAII bull/bear ratio has slingshot to the highest level since January 2018. This is cause for near-term concern as it has historically served as a reliable contrary signal (Chart 1). The knee-jerk equity market reaction on the back of the positive vaccine news has also pushed the percentage of SPX stocks trading above their 200-day moving average to a zenith, warning that the SPX will most likely move laterally (Chart 2). Chart 1
Stock Buying Reached Fever Pitch
Stock Buying Reached Fever Pitch
Chart 2
Stock Buying Reached Fever Pitch
Stock Buying Reached Fever Pitch
Bottom Line: We remain cyclically and structurally bullish, but in the shorter-term, chances are that the SPX will take a breather. For more details, please refer to this Monday’s Weekly Report.
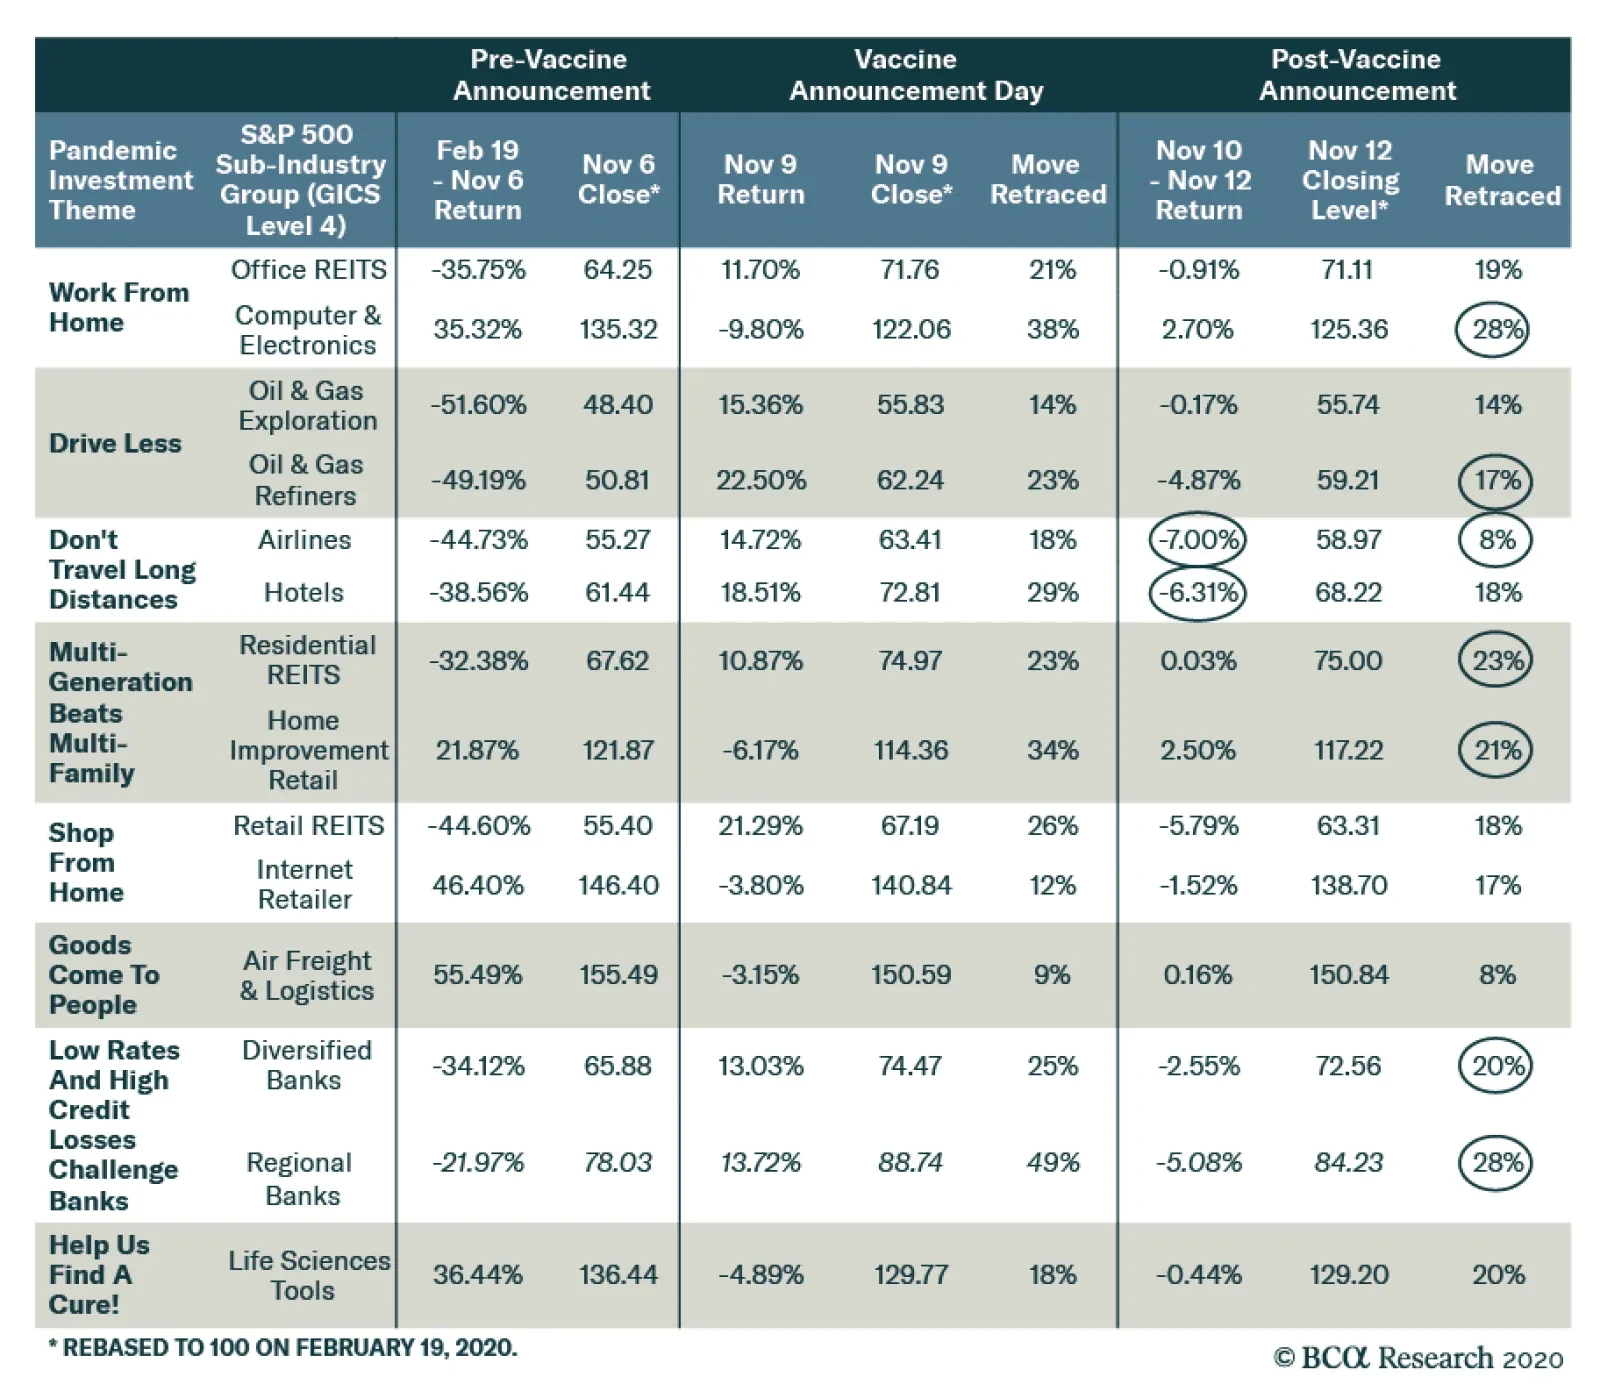
According to BCA Research's US Investment Strategy service, last week’s moves offer a glimpse into what the equity rotation might look like when it eventually arrives. To illustrate the rotation impulse, we identified eight pandemic themes and…
In an Insight last week, we noted that low inventories of consumer goods, durable and non-durable, have likely supported the recent strength in the manufacturing sector. In addition, we highlighted that the Atlanta Fed GDPNOW model is forecasting that the US…
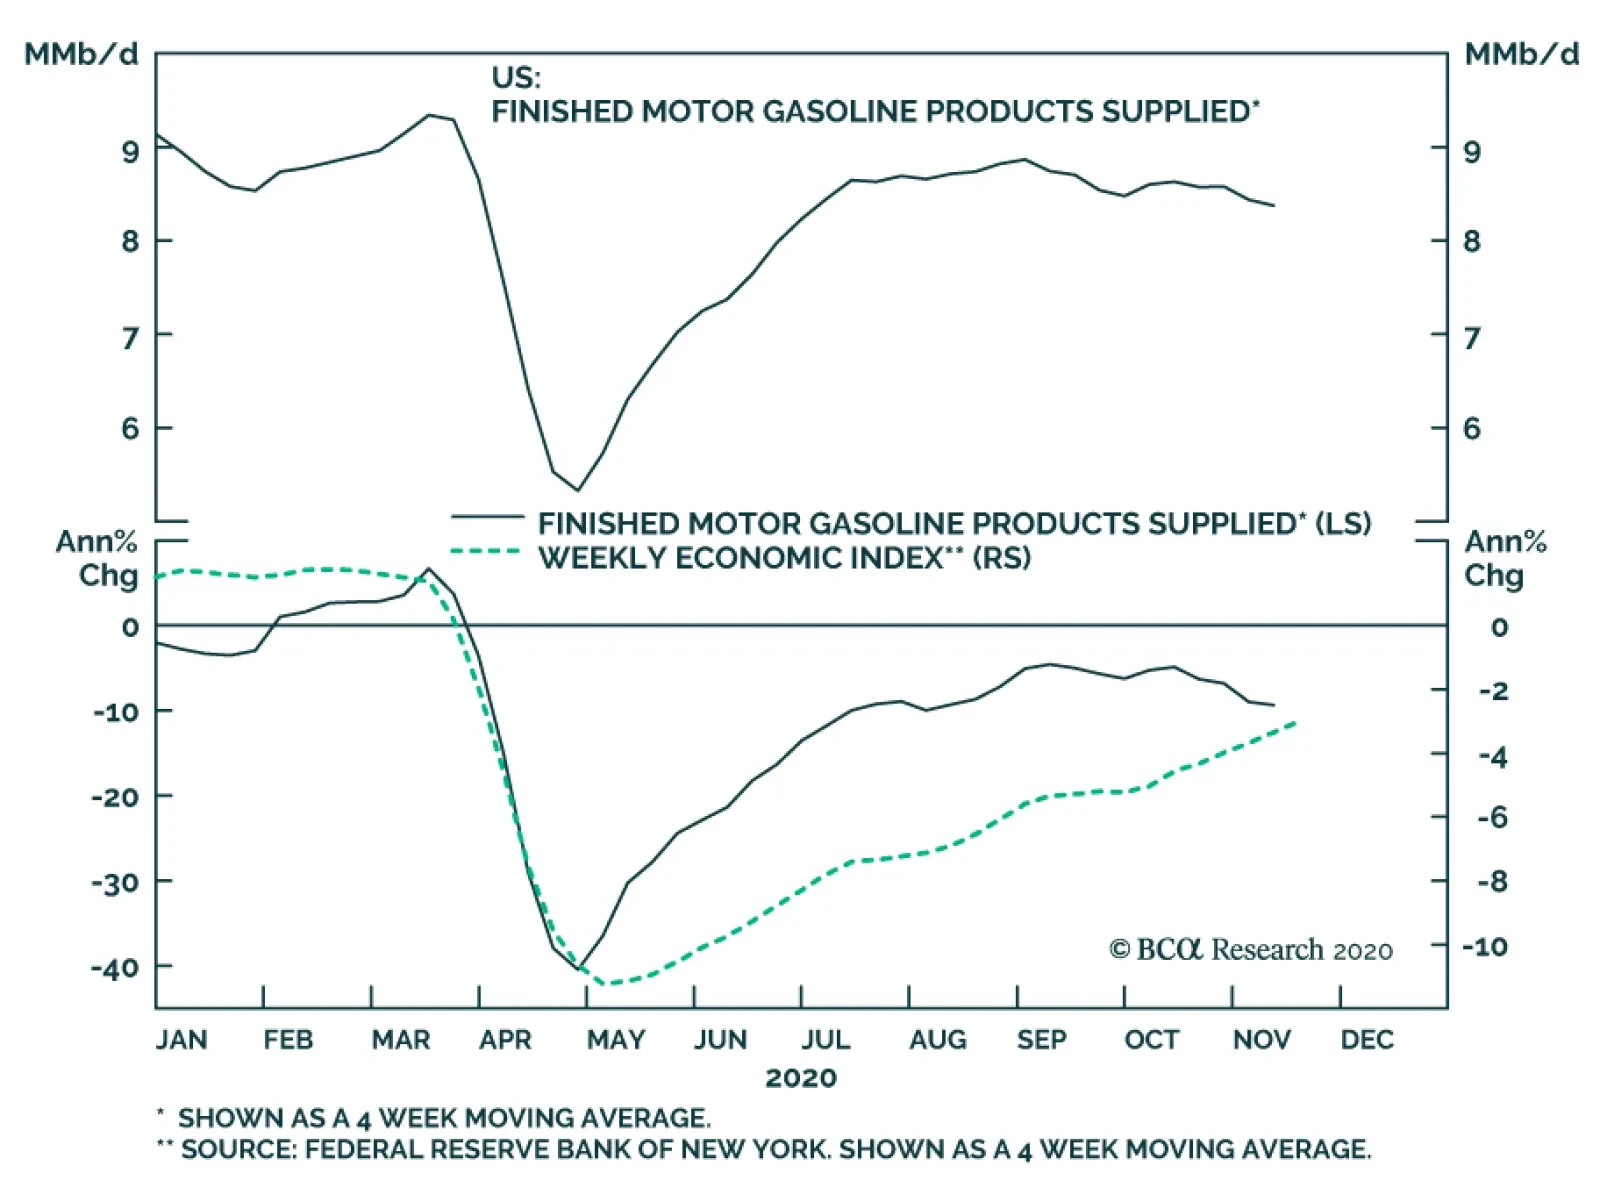
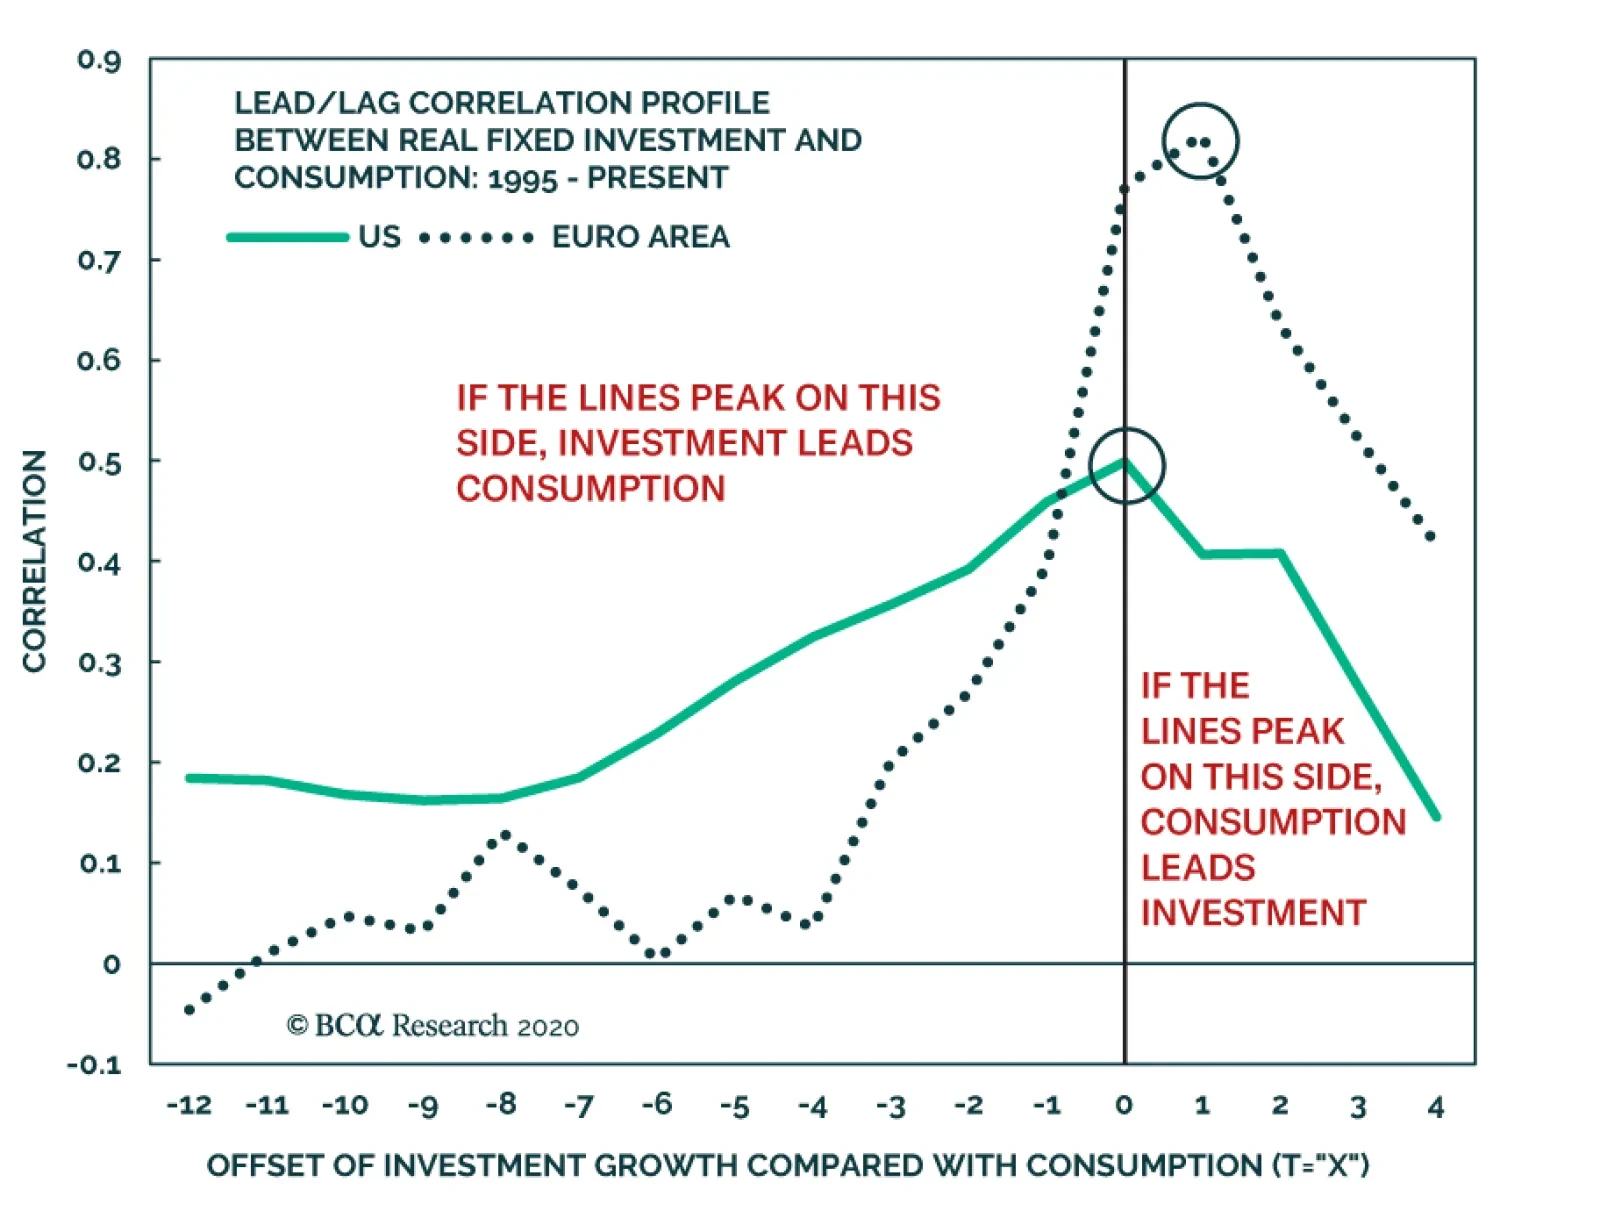
In a previous Insight, we made reference to “Dr. Petrol” and noted that she was advising cautious optimism towards the US economy. “Dr. Petrol” was an allusion to “Dr. Copper”, a common and humorous reference to the red metal’s historical importance as an…
Highlights Portfolio Strategy The hardening insurance market on the back of firming demand for insurance services especially in residential real estate and automobile markets compel us to lift insurers to a benchmark allocation. A resurgent stock-to-bond ratio, the reopening of the economy and receding fiscal policy, election and COVID-19 uncertainties which will further suppress the equity risk premium, all boost the allure of the S&P asset management & custody bank index. Stay overweight. Recent Changes Upgrade the S&P insurance index to neutral and lock in relative gains of 38%, today. This move also augments the S&P financials sector weighting to a modest overweight stance. Table 1
Inoculated
Inoculated
Feature News of a vaccine last Monday turbocharged equities to new intraday all-time highs, following up from a stellar performance the week of the election as odds of a “Blue Wave” collapsed. One of the implications is that the Trump corporate tax cuts will remain in place and investors breathed a sigh of relief (tax policy uncertainty shown inverted, Chart 1). While a smaller fiscal package owing to a split government postponed the rotation trade, the PFE vaccine efficacy news brought it back with a vengeance. This set up caused equities to discount all the good news in a heartbeat as typically happens when uncertainty is sky high and investors stampede into stocks. As we have argued here a VIX with a 40 handle was overdone and thus we crystalized our gains and closed our long VIX December futures trade prior to the election. We have been preparing our portfolio for such a looming rotation and this has been most evident in our long “Back To Work”/short “Covid-19 Winners” equity baskets. Last Monday they went in polar opposite directions and compelled us to put a trailing stop at the 10% return mark in order to protect profits (top three panels, Chart 2). Chart 1Tax Policy Uncertainty Relief
Tax Policy Uncertainty Relief
Tax Policy Uncertainty Relief
Our recent preference of small caps at the expense of large caps that we first recommended a week before the election also depicts the ongoing equity market rotation out of overvalued tech stocks and into beaten down laggard cyclicals (bottom panel, Chart 2). Importantly, the economic reopening trade is still in the early innings, and we remain cyclically bullish on the prospects of the S&P 500 with a fresh end-2021 target of 4,000 that we updated last Monday in a Special Report before news of a vaccine hit the wires. Nevertheless, the recent parabolic rise in equities raises the obvious question: have stocks run too far too fast? Chart 2“Back To Work” Recovery
“Back To Work” Recovery
“Back To Work” Recovery
First, there is no doubt that equities are overextended in the near-term as the collapse in the equity put/call (EPC) ratio highlights. Over the past year, the EPC ratio has formed a clearly defined range and a reading below 0.4 suggests overbought conditions (EPC ratio shown inverted, Chart 3). Second, while the violent rotation has pushed the SPX higher despite the deflating tech sector, we doubt that in the coming weeks the SPX will continue to gallop higher without the heavyweight tech sector partially participating in the rally. As a reminder, adding FANG (FB, AMZN, NFLX & GOOGL) weights to the GICS1 tech sector’s weighting results in a roughly 40% market cap weight of tech-related stocks in the S&P 500 (Chart 4). Chart 3No More Hedging
No More Hedging
No More Hedging
Chart 4Tech Is 40% Of The Market
Tech Is 40% Of The Market
Tech Is 40% Of The Market
Third, according to the American Association of Individual investors (AAII), bulls are back in droves and the AAII bull/bear ratio has slingshot to the highest level since January 2018. This is cause for near-term concern as it has historically served as a reliable contrary signal (Chart 5). Fourth, the knee-jerk equity market reaction on the back of the positive vaccine news has also pushed the percentage of SPX stocks trading above their 200-day moving average to a zenith, warning that the SPX will most likely move laterally (Chart 6). Chart 5Bull Stampede
Bull Stampede
Bull Stampede
Chart 6Too Far Too Fast?
Too Far Too Fast?
Too Far Too Fast?
Finally, following a rough September and choppy October, seasonality is now in favor of owing stocks and given diminishing odds of year-end tax loss selling, equities should grind higher as 2020 draws to a close. Netting it all out, in the short-term our going assumption is that, barring exponential moves in the reopening trade similar to what we witnessed last week, the SPX will likely move sideways in order to digest the recent up move and work off overbought conditions. This is especially true if a selloff in the bond market continues to weigh on the tech sector’s still lofty valuation footprint. This week we make a sub-surface financials sector tweak that pushes this early cyclical sector to a modest above benchmark allocation. Time To Lock In Gains On Insurance The shifting macro landscape signals that it no longer pays to be bearish insurance stocks; thus we are upgrading the S&P insurance index to a neutral weighting today, crystalizing relative gains of 38% since inception. This cyclical underweight exposure in insurance stocks – as part of our barbell portfolio strategy within the financials universe – has cushioned the blow from our positive bank exposure and served its hedging purpose. Now that the election uncertainty is waning and given the recent positive PFE news on the effectiveness of their COVID-19 vaccine, insurance stocks will at least catch a bid. The economic reopening underscores that home and auto sales will continue to climb as nonfarm payrolls make a run for the pre-recession highs likely sometime in 2021. Keep in mind that consumers’ plans to buy a new car and a home are recovering smartly according to the most recent Conference Board survey (third panel, Chart 7). This upbeat demand backdrop for these key insurance end-markets should boost industry profits (bottom panel, Chart 7). Already a hardening insurance market (second panel, Chart 8) owing to pent-up residential real estate and automobile demand is a boon for underwriting results. Chart 7Insuring Gains
Insuring Gains
Insuring Gains
Chart 8Hardening Market
Hardening Market
Hardening Market
Importantly, the latest national account data corroborates firming final demand for insurance services: consumer outlays on insurance are galloping higher. The upshot is that the insurance valuation de-rating will transition to a rerating phase (bottom panel, Chart 8). Our Insurance Indicator does an excellent job in encapsulating all these moving parts and heralds rosier days ahead for relative share prices (second panel, Chart 9). However, there is a caveat that prevents us from swinging all the way to an overweight stance. Insurance CEOs have been anything but disciplined. Headcount is surging and industry wages are also accelerating. While executives may be preparing for a durable rebound in the coming months, a spiking wage bill will eat into insurance margins (third & bottom panels, Chart 9). Netting it all out, a hardening insurance market on the back of firming demand for insurance services especially in residential real estate and automobile markets compel us to lift insurers to a benchmark allocation. Bottom Line: Upgrade the S&P insurance index to neutral today, cementing relative profits of 38% since inception. This upgrade bumps the broad S&P financials sector to a modest overweight stance. The ticker symbols for the stocks in the S&P insurance index are: BLBG: S5INSU - AIG, CB, MET, MMC, PRU, TRV, AFL, AON, ALL, PGR, WLTW, HIG, PFG, L, CINF, LNC, AJG, UNM, AIZ, RE, GL, WRB. Chart 9One Positive And One Risk
One Positive And One Risk
One Positive And One Risk
Stick With Asset Management & Custody Banks While we have moved to the sidelines on the S&P banks and S&P investment banks & brokers groups, we have maintained bank-related exposure via the S&P asset management & custody banks (AMCB) index and today we reiterate our overweight stance in this early cyclical group. Recent news of industry M&A activity has propped up stocks in this index. Any reduction of supply is great news not only because investors have fewer constituents available to deploy capital to, but also because of oligopolistic power with positive industry pricing power knock-on effects. Tack on the recent selloff in the bond market and factors are falling into place for a durable outperformance phase in the S&P AMCB index (top panel, Chart 10). In fact, the stock-to-bond ratio has caught on fire of late forecasting a pickup in momentum in relative share prices (middle panel, Chart 10). Fund flows are also emitting a bullish signal. Historically, increasing bond and equity fund flows have been positively correlated with the relative share price ratio and the current message is positive (bottom panel, Chart 10). Our view remains that the economy will continue to reopen in 2021 and news of the PFE vaccine reiterates our thesis. Thus, as economic uncertainty lifts, it should lead to multiple expansion in this beaten down early cyclical industry (middle panel, Chart 11). More broadly speaking, receding fiscal and election uncertainties should push down the still high equity risk premium and boost the allure of the S&P AMCB index (bottom panel, Chart 11). Chart 10Increasing Flows Are A Boon
Increasing Flows Are A Boon
Increasing Flows Are A Boon
Chart 11A Play On The Economic Reopening
A Play On The Economic Reopening
A Play On The Economic Reopening
Securities lending is another source of income for the industry. Oscillating margin debt balances are an excellent demand gauge for such income producing services. Recently, margin debt has made a run for all-time highs in level terms, expanding at a near 20%/annum clip, underscoring that an earnings led advance is in the offing (bottom panel, Chart 12). With regard to earnings, there is broad-based skepticism on the industry’s profit growth recovery prospects both on a cyclical and structural time horizon. The middle panel of Chart 13 highlights that over the past two decades every time sell-side extreme pessimism reigned supreme, it was a good contrary signal. More precisely, when relative 12-month profit growth expectations sink to negative double digits, a reflex rebound typically ensues. We doubt this time will prove different. Chart 12Follow The Margin Debt
Follow The Margin Debt
Follow The Margin Debt
In sum, a resurgent stock-to-bond ratio, the reopening of the economy and receding fiscal and election uncertainties which will further suppress the equity risk premium, all boost the allure of the S&P AMCB index. Chart 13Lean Against Extreme Analyst Pessimism
Lean Against Extreme Analyst Pessimism
Lean Against Extreme Analyst Pessimism
Bottom Line: We continue to recommend an above benchmark allocation in the S&P AMCB index. The ticker symbols for the stocks in this index are: BLBG: S5AMGT – BK, BLK, STT, AMP, NTRS, TROW, BEN, IVZ. Anastasios Avgeriou US Equity Strategist anastasios@bcaresearch.com Current Recommendations Current Trades Strategic (10-Year) Trade Recommendations
Drilling Deeper Into Earnings
Drilling Deeper Into Earnings
Size And Style Views October 26, 2020 Favor small over large caps July 27, 2020 Overweight cyclicals over defensives June 11, 2018 Long the BCA Millennial basket The ticker symbols are: (AAPL, AMZN, UBER, HD, LEN, MSFT, NFLX, SPOT, TSLA, V). January 22, 2018 Favor value over growth
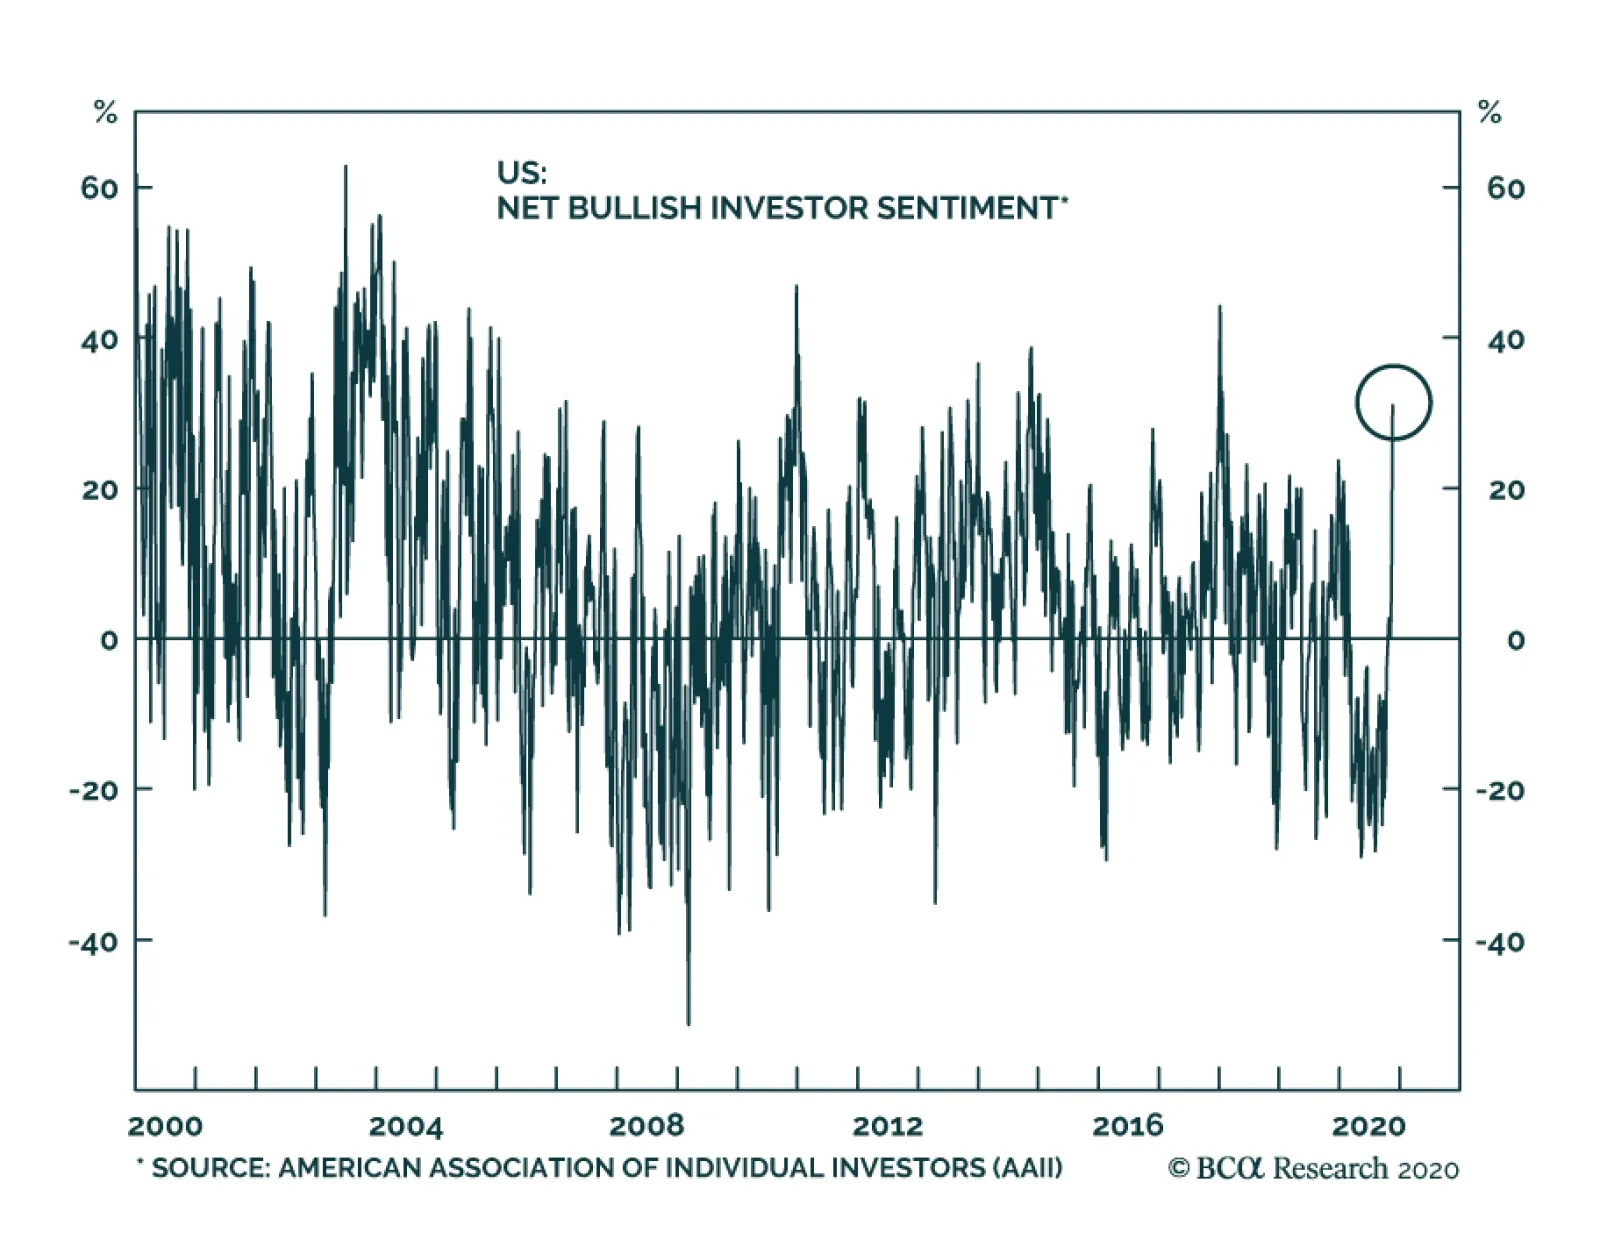
Pfizer's vaccine efficacy announcement last week had a major impact on investor sentiment. The chart above highlights that net bullish investor sentiment, surveyed by the American Association of Individual Investors (AAII), has risen from roughly neutral…
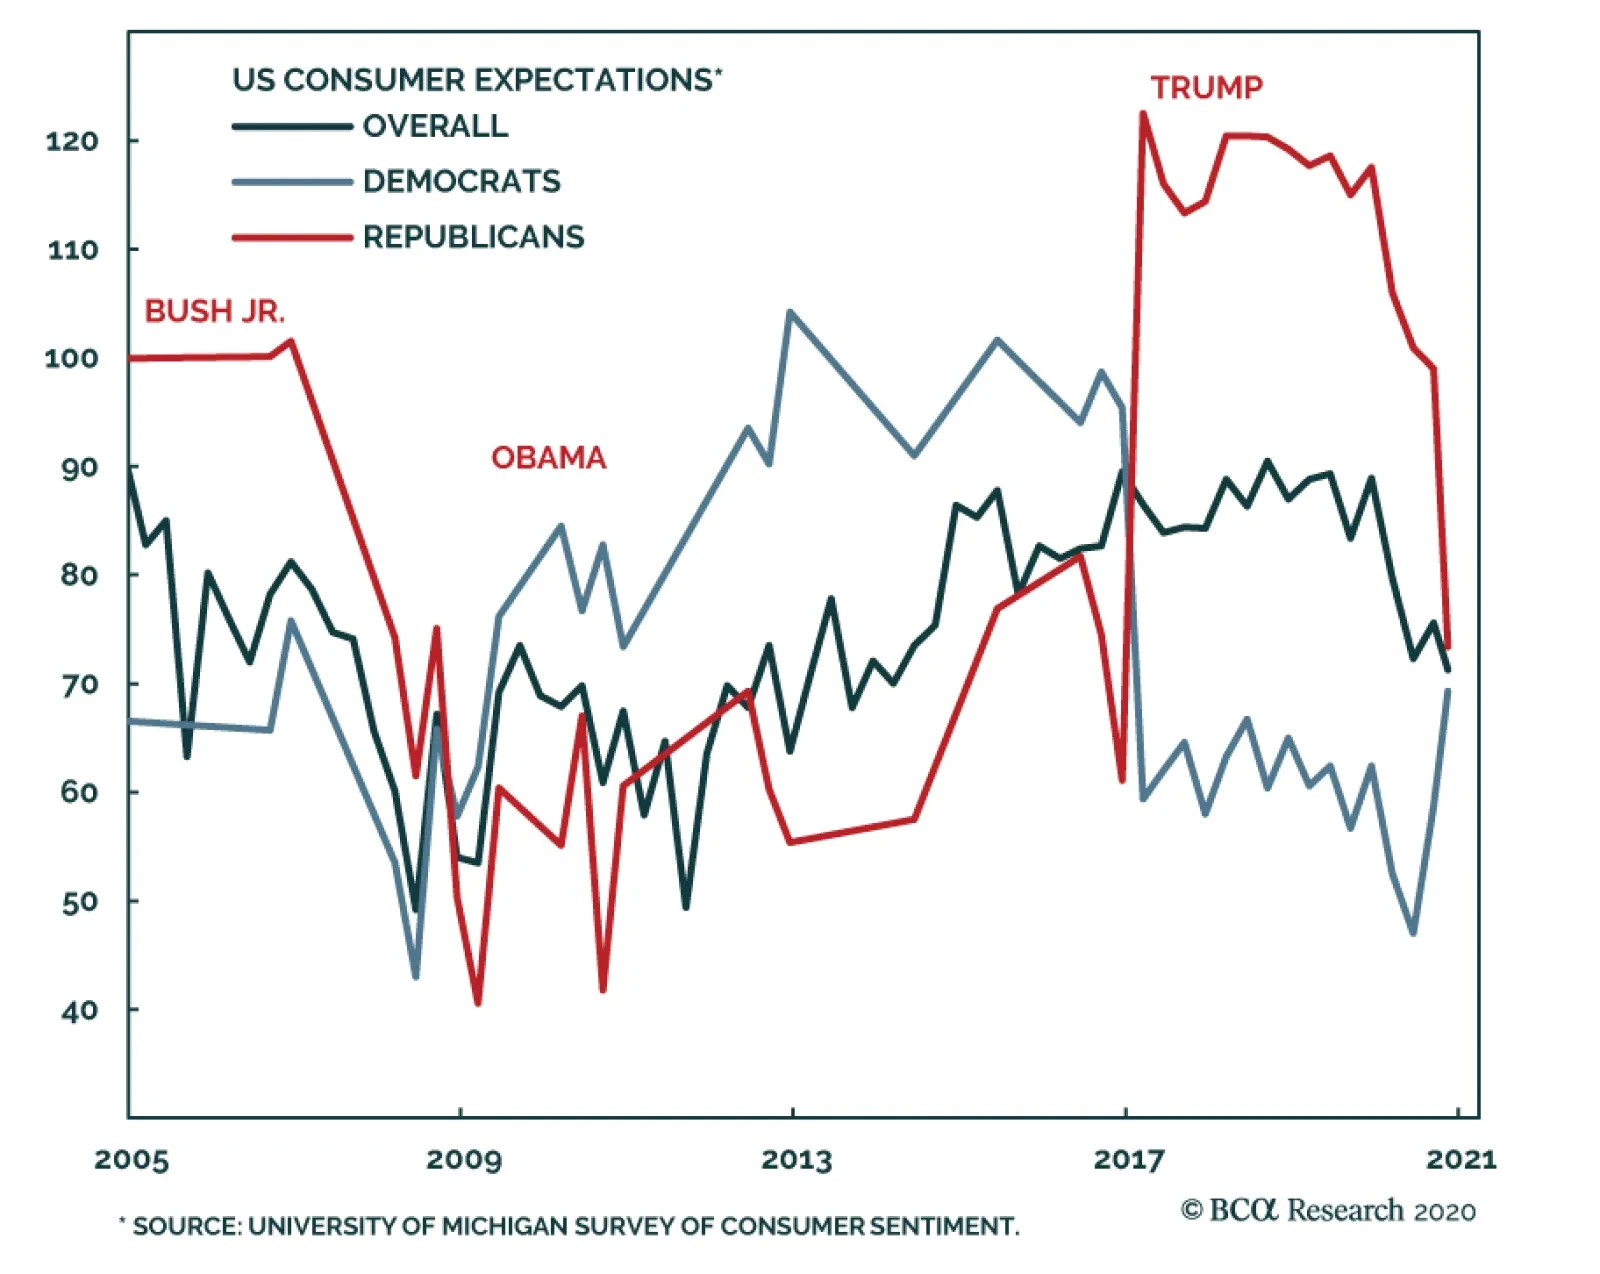
According to the University of Michigan’s sentiment survey, US consumer confidence is once again deteriorating. The overall sentiment index fell to 77.0 in November from 81.8, disappointing expectations that it would rise to 82.0. Greater pessimism about the…
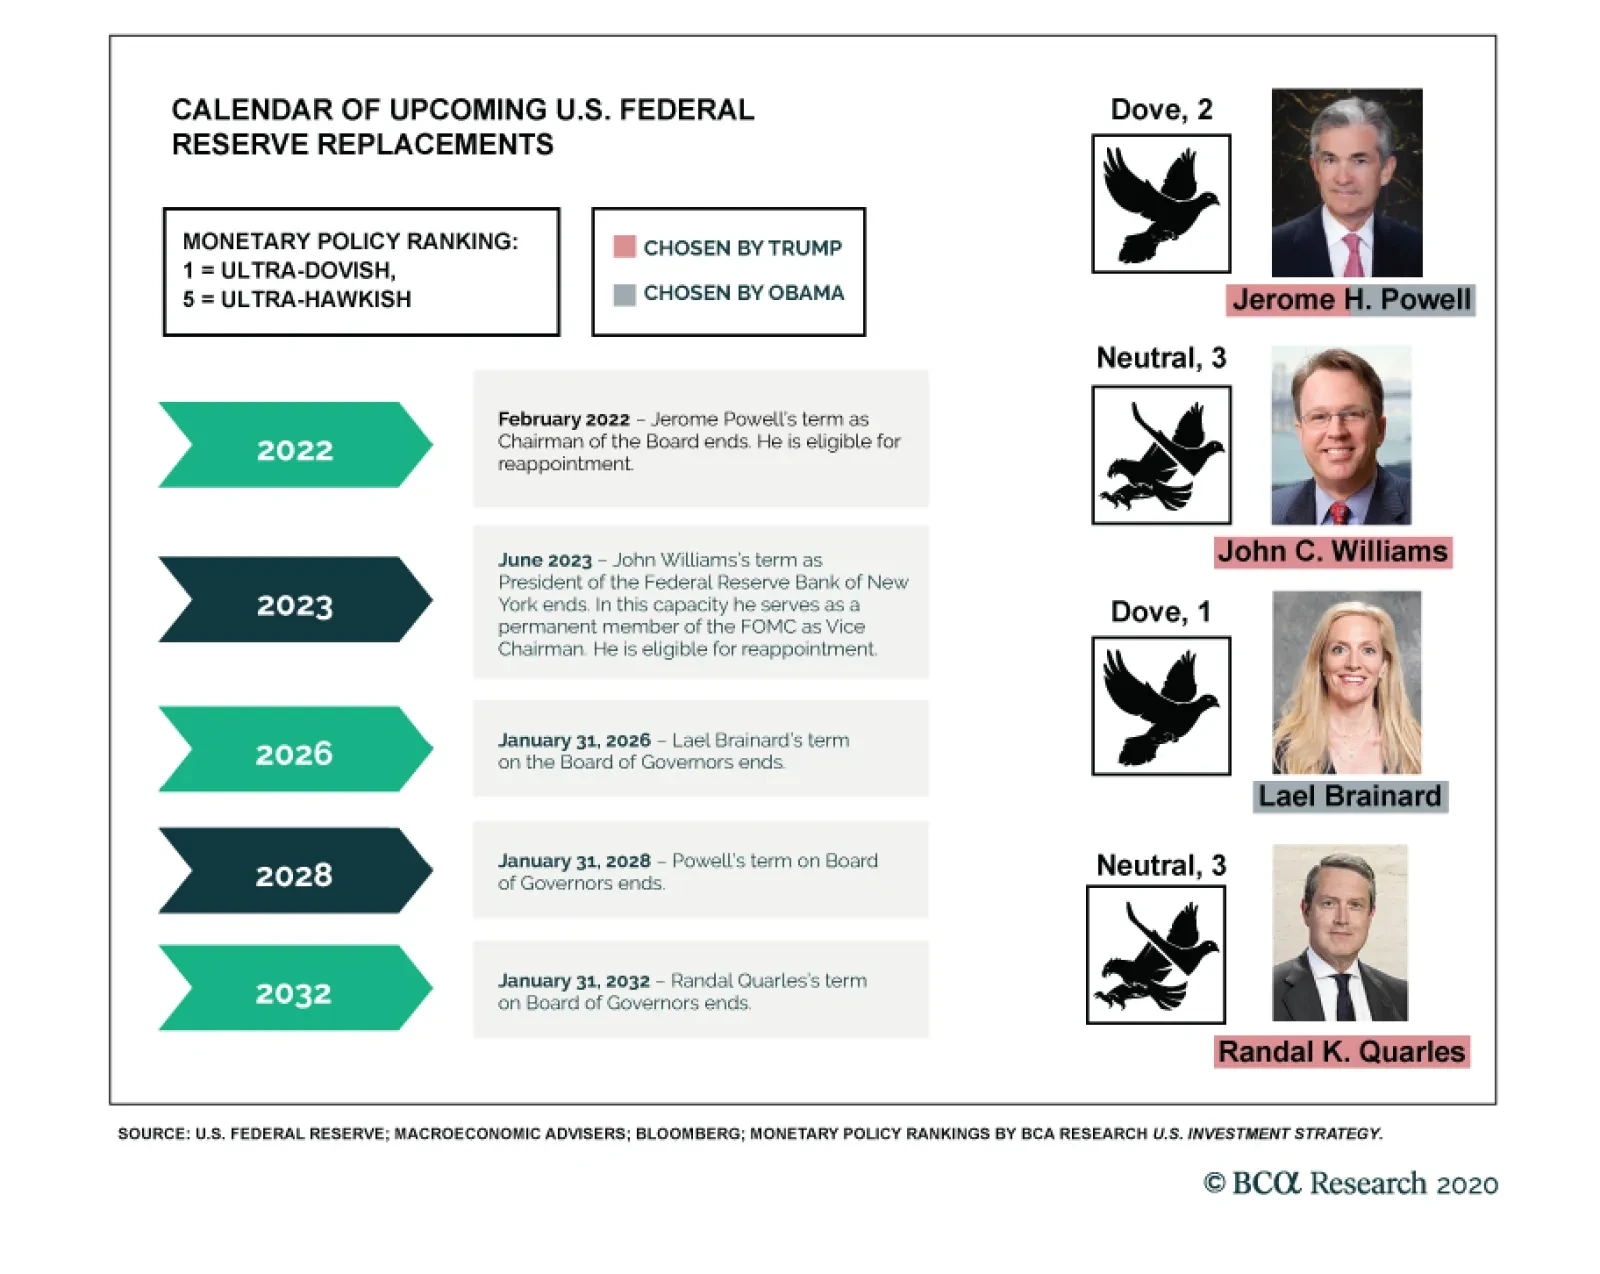
BCA Research's Geopolitical Strategy service recently discussed potential cabinet picks in a Biden administration, and argued that they would confirm the “return to normalcy” theme and hence will be market-friendly (to the extent that they impact financial…
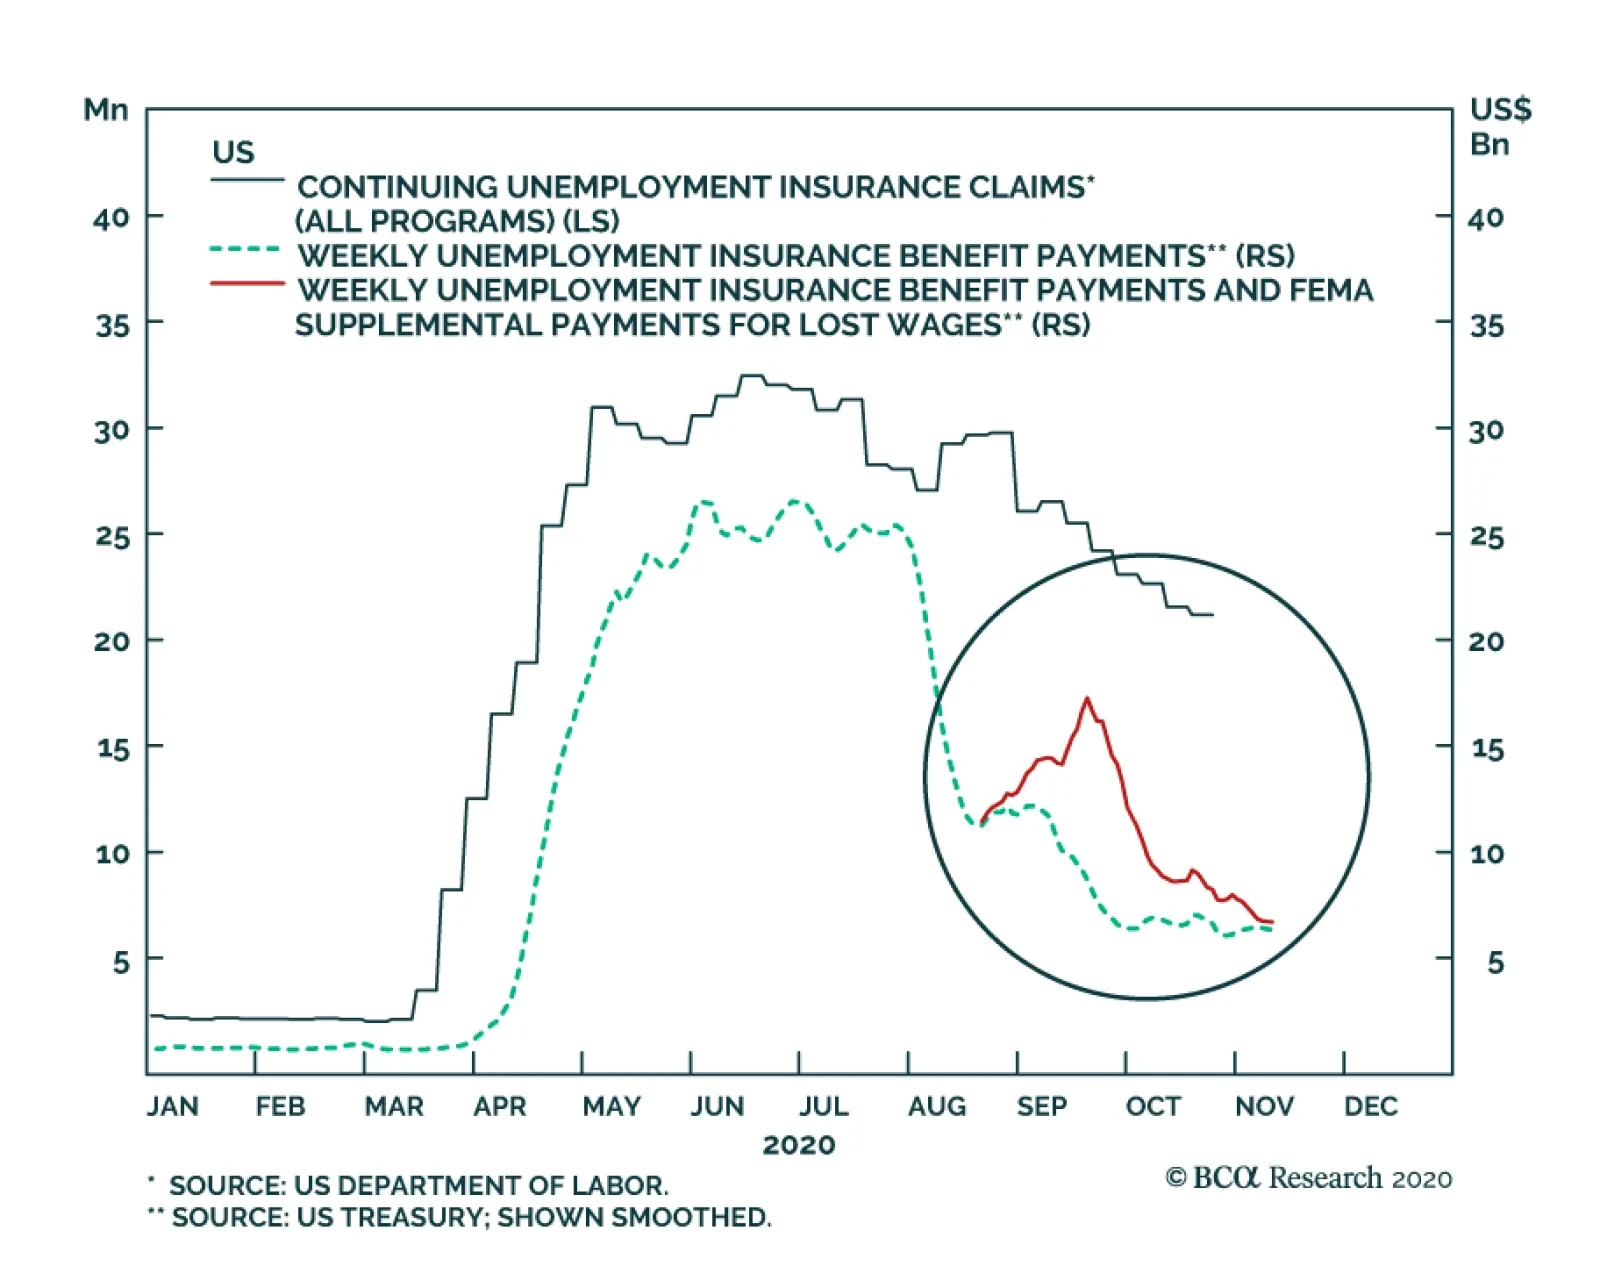
The chart above presents weekly US continuing unemployment insurance claims alongside unemployment insurance benefit payments. The red line accounts for the $44 billion increase in payments expended from FEMA's Disaster Relief Fund as a result of President…
The market has rallied roughly 10% this month, and while we remain cyclically and structurally bullish, a short-term consolidation period is likely in the cards. As Chart 1 highlights below, extremely easy financial conditions along with a near halving in implied volatility – which have been key rally drivers since the March lows as we pointed out numerous times in our research – are nearly perfectly priced in the SPX. The implication is that if a meaningful rally is to resume, further easing is required. Another factor underpinning the market’s recent advance is the drop in the CBOE’s implied correlation index (pair wise correlation of S&P500 constituents, shown inverted, Chart 2). However, correlations have collapsed and are near levels that have marked prior temporary peaks in the SPX. Bottom Line: A short-term consolidation phase is likely in the cards
Consolidation
Consolidation
Consolidation
Consolidation