United States
On Monday, global investors cheered Pfizer’s news about the efficacy of the vaccine that it has developed with BioNTech, a German biotech company. The US equity market rose substantially in early-morning trading, but clawed back some of those gains over the…

Highlights Economy: The Democrats did not sweep the US election, but the Democratic House and Republican Senate will likely find some middle ground on a stimulus deal. This will keep the economic recovery on track. A highly effective COVID vaccine that becomes widely available would supercharge it. Rates: Investors should continue to position for a bear-steepening nominal Treasury curve on a 6-12 month horizon. They should also overweight TIPS versus nominal Treasuries, favor inflation curve flatteners and real yield curve steepeners. Treasury Supply & Fed Demand: The Treasury department will continue to increase coupon issuance at the expense of bills. If current policy remains in place, Fed purchases will decline as a percent of coupon issuance in the coming quarters. But the Fed could take steps to modify its asset purchase strategy during the next few months. Feature We’ve seen enough. After a week of checking and re-checking the numbers, BCA’s US Bond Strategy service has concluded that a moderate bear-steepening of the Treasury curve remains the most likely outcome for the next 6-to-12 months. Of course, the dust has not completely settled on the US election. President Trump has issued several legal challenges and control of the Senate won’t be decided until early January when two run-off elections take place in Georgia. However, it now looks safe to assume that Joe Biden will take over as President next year. We also expect, with slightly less conviction, that the Republican party will keep control of the Senate, as Democrats need to win both Georgia races in order to secure a majority. In this week’s report, we assess the fall-out from the election on different sectors of the US bond market. We also consider how the election result impacts the outlook for fiscal stimulus and provide an update on supply and demand trends in the Treasury market. The Election Fall-Out In Bond Markets Nominal Yields Chart 1A Moderate Bear-Steepening
A Moderate Bear-Steepening
A Moderate Bear-Steepening
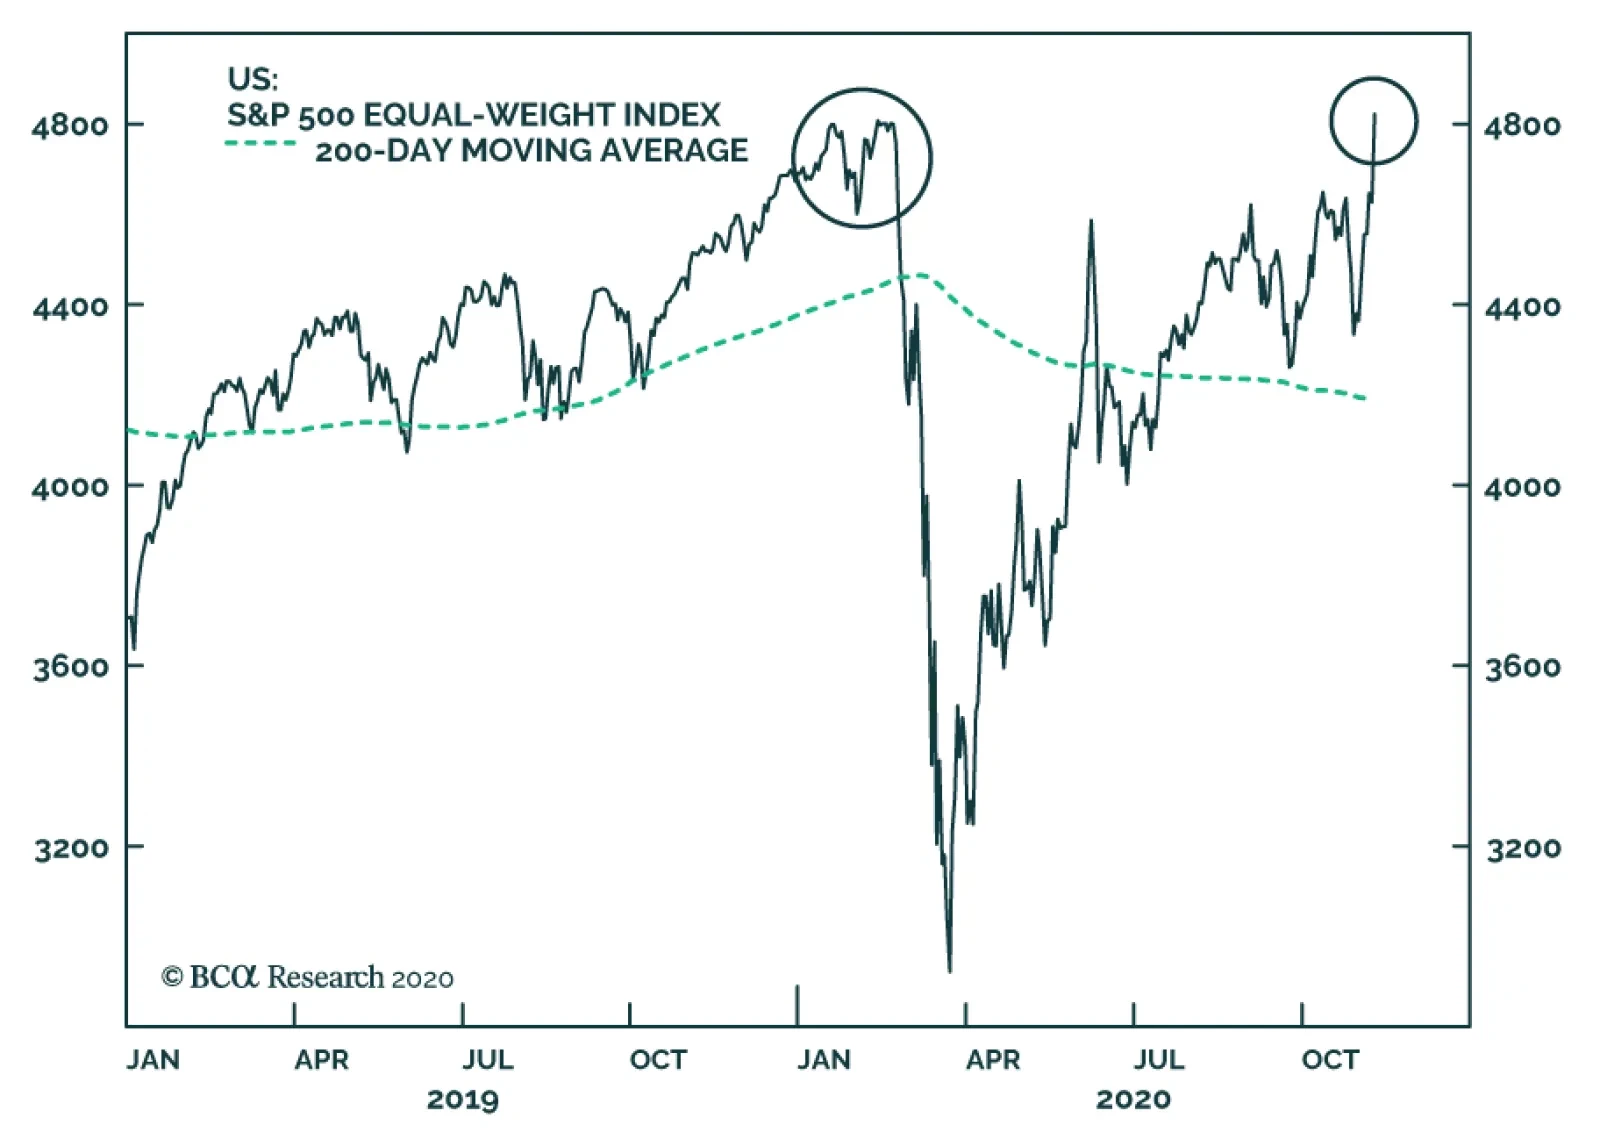
The 10-year Treasury yield got as high as 0.90% in advance of election day, as the market was pricing-in a Democratic sweep that would have led to a substantial increase in government spending. This outcome is still technically possible, but it now looks unlikely. The 10-year Treasury yield fell back to 0.78% as the election results came in but returned to 0.90% yesterday morning on news that Pfizer’s COVID vaccine was 90% effective in phase 3 trials. This market action affirms our recommended positioning. The Bloomberg Barclays Treasury Index has been underperforming cash since August, the uptrend in the 10-year Treasury yield remains intact and the yield curve continues to steepen (Chart 1). All these trends will remain in place as long as the economic recovery continues, and timely distribution of an effective COVID vaccine will certainly speed that process up. The biggest risk to our view is that a Democrat-controlled House and Republican-controlled Senate are unable to agree on a follow-up fiscal stimulus package during the next few months, and that the economic recovery stalls as a result. This is possible, but our base case scenario is that a compromise will be easier to reach now that the election is over. We expect a moderately-sized relief bill to be delivered relatively soon, possibly even before the end of the year. The Inflation Curve Chart 2Own Inflation Curve Flatteners...
Own Inflation Curve Flatteners...
Own Inflation Curve Flatteners...
The 10-year TIPS breakeven inflation rate fell 8 bps immediately after the election, but unlike with nominal yields, the trend in the cost of inflation compensation had been relatively flat heading into election day (Chart 2). It’s not hard to see why. Inflationary pressures in the economy have clearly moderated compared to the summer. The oil price has taken a step down (Chart 2, panel 3) and month-over-month CPI growth has been trending lower (Chart 2, bottom panel). We don’t expect this deceleration in inflation to continue. Global economic recovery will keep commodities well bid, and core inflation will slowly recover back to target. This argues for staying overweight TIPS versus nominal Treasuries. We also recommend owning inflation curve flatteners. The inflation curve has been steepening since August, as the short-dated cost of inflation compensation has fallen by more than the long-dated cost (Chart 2, panel 2). This steepening is typical for periods when TIPS breakeven rates are falling, and it will reverse when breakevens start rising again. Looking further out, the Fed’s commitment to allow a temporary overshoot of its 2% inflation target means that we should expect the inflation curve to invert. This means that inflation curve flatteners have a lot of room to run. Real Yields With almost no volatility in short-maturity nominal yields, short-maturity real yields are simply the mirror image of short-maturity inflation expectations. For this reason, the 2-year real yield has been moving up since August as the 2-year cost of inflation compensation has declined (Chart 3). This dynamic doesn’t hold for long maturities, where nominal yields have been rising as markets price-in eventual Fed tightening (Chart 3, top panel). Inflationary pressures in the economy have clearly moderated compared to the summer. The different behavior of long- and short-maturity real yields gives us high conviction in recommending a real yield curve steepener (Chart 3, bottom panel). A recovery in inflation expectations will push short-maturity real yields lower but will not have the same impact at the long-end where nominal yields will also rise. Chart 3…And Real Yield Curve Steepeners
...And Real Yield Curve Steepeners
...And Real Yield Curve Steepeners
Corporate Credit Chart 4Credit Spreads Welcomed The Election Results
Credit Spreads Welcomed The Election Results
Credit Spreads Welcomed The Election Results
Interestingly, the election result of a Biden presidency and divided House and Senate was viewed positively by both the “risk-free” Treasury market and risky credit spreads (Chart 4). Treasury yields fell on expectations of less fiscal stimulus, but credit spreads also tightened because a Republican Senate will keep corporate tax hikes at bay and a Biden presidency will ratchet down trade tensions with China. We maintain our positive outlook on credit and continue to recommend overweight allocations to corporate bonds rated Ba and higher. We remain underweight low-rated junk bonds (B & below) for now, because those spreads are pricing-in a rapid drop in the default rate. We may soon shift into low-rated junk as well, depending on how quickly an effective vaccine can be distributed. One less discussed risk for corporate spreads is the expiration of the Fed’s emergency lending facilities at the end of the year. The facilities are currently scheduled to expire on December 31st, though Fed Chair Powell seemed to imply last week that he would like to extend them. The one hitch could be that the Treasury department will also have to sign-on to an extension. It is currently unclear whether it is interested in doing so. Municipal Bonds Chart 5Munis Still Very Attractive
Munis Still Very Attractive
Munis Still Very Attractive
The strong relative performance of municipal bonds since election day has been the most confounding market move (Chart 5). All logic tells us that Municipal / Treasury yield spreads should have widened as it became clear that the Republicans will likely keep control of the Senate. A Republican Senate will prevent Joe Biden from raising income taxes, which would have made tax-advantaged munis look more attractive on a relative basis. A Republican Senate has also been staunchly opposed to providing federal aid to cash-strapped state & local governments. But munis have outperformed Treasuries despite these obvious negative catalysts, possibly in part due to Mitch McConnell’s post-election comments that suggested he is open to compromise on a fiscal relief bill and would even be open to including some funds for state & local governments. Despite McConnell’s comments, the prospect of federal funds for state & local governments is uncertain at best. But we nonetheless maintain an overweight allocation to municipal bonds due to continued extraordinary valuations relative to both Treasuries (Chart 5, panel 2) and corporates (Chart 5, bottom panel). The Stimulus Risk As we alluded to above, the biggest risk to our bond-bearish view is that the failure to pass a follow-up to the CARES act results in a spate of negative economic data that spooks investors. This negative data would likely first show up in consumer spending, which so far continues to recover (Chart 6). However, we think the odds are that, in the absence of stimulus, we will see a disappointing consumer spending report within the next few months. How markets react to that news will depend on the status of stimulus talks at that time, as well as news about a potential vaccine roll-out. Disposable personal income was still above pre-COVID levels in September, but it continues to be buttressed by income support from the federal government. Notice that non-transfer income remains below pre-COVID levels (Chart 6, panel 3). Further, the drop in the savings rate during the past few months has outpaced the improvement in consumer sentiment (Chart 6, bottom panel). This suggests that any excess savings that households may have accumulated in the spring are now close to being exhausted. In the absence of stimulus, we will see a disappointing consumer spending report within the next few months. Elsewhere, the labor market continues to make steady improvements, but it could also use some help from policymakers. Excluding temporary census employment, nonfarm payrolls rose 786k in October, slightly above September’s pace but below the rapid gains seen in May and June (Chart 7). Further, initial jobless claims remain above 700k per week and real-time employment data from Homebase has been steady at a low level. All this to say that the labor market is making only modest gains and there remains a gap of 10 million jobs between current nonfarm payrolls and those from February (Chart 7, top panel). Chart 6Keep Monitoring Consumer Spending
Keep Monitoring Consumer Spending
Keep Monitoring Consumer Spending
Chart 7A Slow Recovery In Employment
A Slow Recovery In Employment
A Slow Recovery In Employment
The bottom line is that, without further fiscal stimulus, the odds are high that the economic data will disappoint at some point during the next few months. This will cause bond yields to fall and credit spreads to widen, unless it looks like Congress is close to a deal or like a vaccine will be available in a timely manner. Fortunately, we do think the odds are relatively high that a Republican Senate and Democratic House will be able to reach a compromise stimulus deal, albeit a modest one in the range of $700 billion to $1 trillion. The political incentives against compromise have faded now that the election is over, and we expect a deal either this year or early next year. Treasury Supply And Fed Demand The Treasury department recently released its financing estimates for the next two quarters. A few trends are worth mentioning. First, the Treasury will continue to increase coupon issuance as it seeks to extend the average maturity of the outstanding debt (Chart 8, top panel). Chart 8The Path For Treasury Supply And Fed Demand
Bond Bear Intact
Bond Bear Intact
Second, the Treasury will continue to operate with an historically elevated cash balance, but it will seek to reduce its cash holdings to $800 billion from $1.6 trillion currently (Chart 9). Chart 9Treasury Will Deploy Some Cash
Treasury Will Deploy Some Cash
Treasury Will Deploy Some Cash
Third, the Treasury assumed in its projections that Congress will deliver another $1 trillion of stimulus. The combination of (i) increased coupon issuance, (ii) a falling cash balance and (iii) stimulus projections that may be too high, points to a continued drop in T-bill issuance (Chart 10). In fact, the Treasury acknowledged that bill issuance will likely fall going forward and said that it would be comfortable with a distribution where bills account for 15%-20% of the outstanding debt (Chart 11). Chart 10Expect T-Bill Issuance To ##br##Keep Falling…
Expect T-Bill Issuance To Keep Falling...
Expect T-Bill Issuance To Keep Falling...
Chart 11…And To Settle At Around 15-20% Of Outstanding Debt
...And To Settle At ArouNd 15-20% Of Oustanding Debt
...And To Settle At ArouNd 15-20% Of Oustanding Debt
Fed Chairman Powell also addressed the media last week, after the conclusion of the November FOMC meeting, and announced that the Fed made no changes to its asset purchases. For the time being, the Fed will continue to purchase “at least” $80 billion of Treasuries and $40 billion of MBS per month. However, Powell did indicate that FOMC participants discussed different ways in which they might modify the asset purchase program in the future. Presumably this means that if the Committee feels the need to deliver further monetary stimulus it will do so by either shifting its Treasury purchases to the long-end of the curve – in order to remove more duration risk from the market – or by increasing the outright pace of purchases. Powell made it clear that he sees these sorts of balance sheet moves as viable forms of monetary stimulus, though the tone of the questions he received during the press conference suggests that the consensus increasingly senses that the Fed might be out of ammo. Several questioners noted Powell’s repeated calls for fiscal stimulus and asked directly whether the Fed has done all it can. In conclusion, if the Fed maintains the current pace and distribution of Treasury purchases (Chart 8, panel 2), its asset purchases will continue to trend down compared to gross Treasury issuance (Chart 8, bottom panel). However, we could see the Fed taking a step to mitigate that decline at the long-end of the curve by shifting the maturity distribution of its asset purchases towards longer maturities. This move could occur as early as next month. The Treasury will continue to operate with an historically elevated cash balance, but it will seek to reduce its cash holdings to $800 billion from $1.6 trillion currently. The bar for actually increasing the monthly pace of purchases is likely much higher, and it would require a significant tightening of financial conditions or drop in economic activity to push the Fed into action. The bigger question, however, is whether the market even cares anymore about tweaks to the Fed’s asset purchase program. The tone of questions at last week’s press conference suggests it might not. Appendix: Buy What The Fed Is Buying The Fed rolled out a number of aggressive lending facilities on March 23. These facilities focused on different specific sectors of the US bond market. The fact that the Fed has decided to support some parts of the market and not others has caused some traditional bond market correlations to break down. It has also led us to adopt of a strategy of “Buy What The Fed Is Buying”. That is, we favor those sectors that offer attractive spreads and that benefit from Fed support. The below Table tracks the performance of different bond sectors since the March 23 announcement. We will use this to monitor bond market correlations and evaluate our strategy’s success. TablePerformance Since March 23 Announcement Of Emergency Fed Facilities
Bond Bear Intact
Bond Bear Intact
Ryan Swift US Bond Strategist rswift@bcaresearch.com Fixed Income Sector Performance Recommended Portfolio Specification
In this Monday’s Special Report we introduced our 2021 SPX target of approximately 4,000 and also updated our EPS forecast from $162 to $168. We arrived at these targets by applying our three-scenario approach that we first implemented in our research methodology early in the year. Specifically, our worst-case scenario (with the lowest probability of occurrence) is a recessionary relapse (double-dip recession) in 2021. Our base- and best-case scenarios incorporate bullish recovery dynamics that we forecasted in our Special Report and that Table 1 below also summarizes. Bottom Line: We remain cyclically and structurally bullish on the US equity market with the current end-2021 SPX target of 4,000 and EPS of $168. Table 1
New 2021 EPS & SPX Targets
New 2021 EPS & SPX Targets
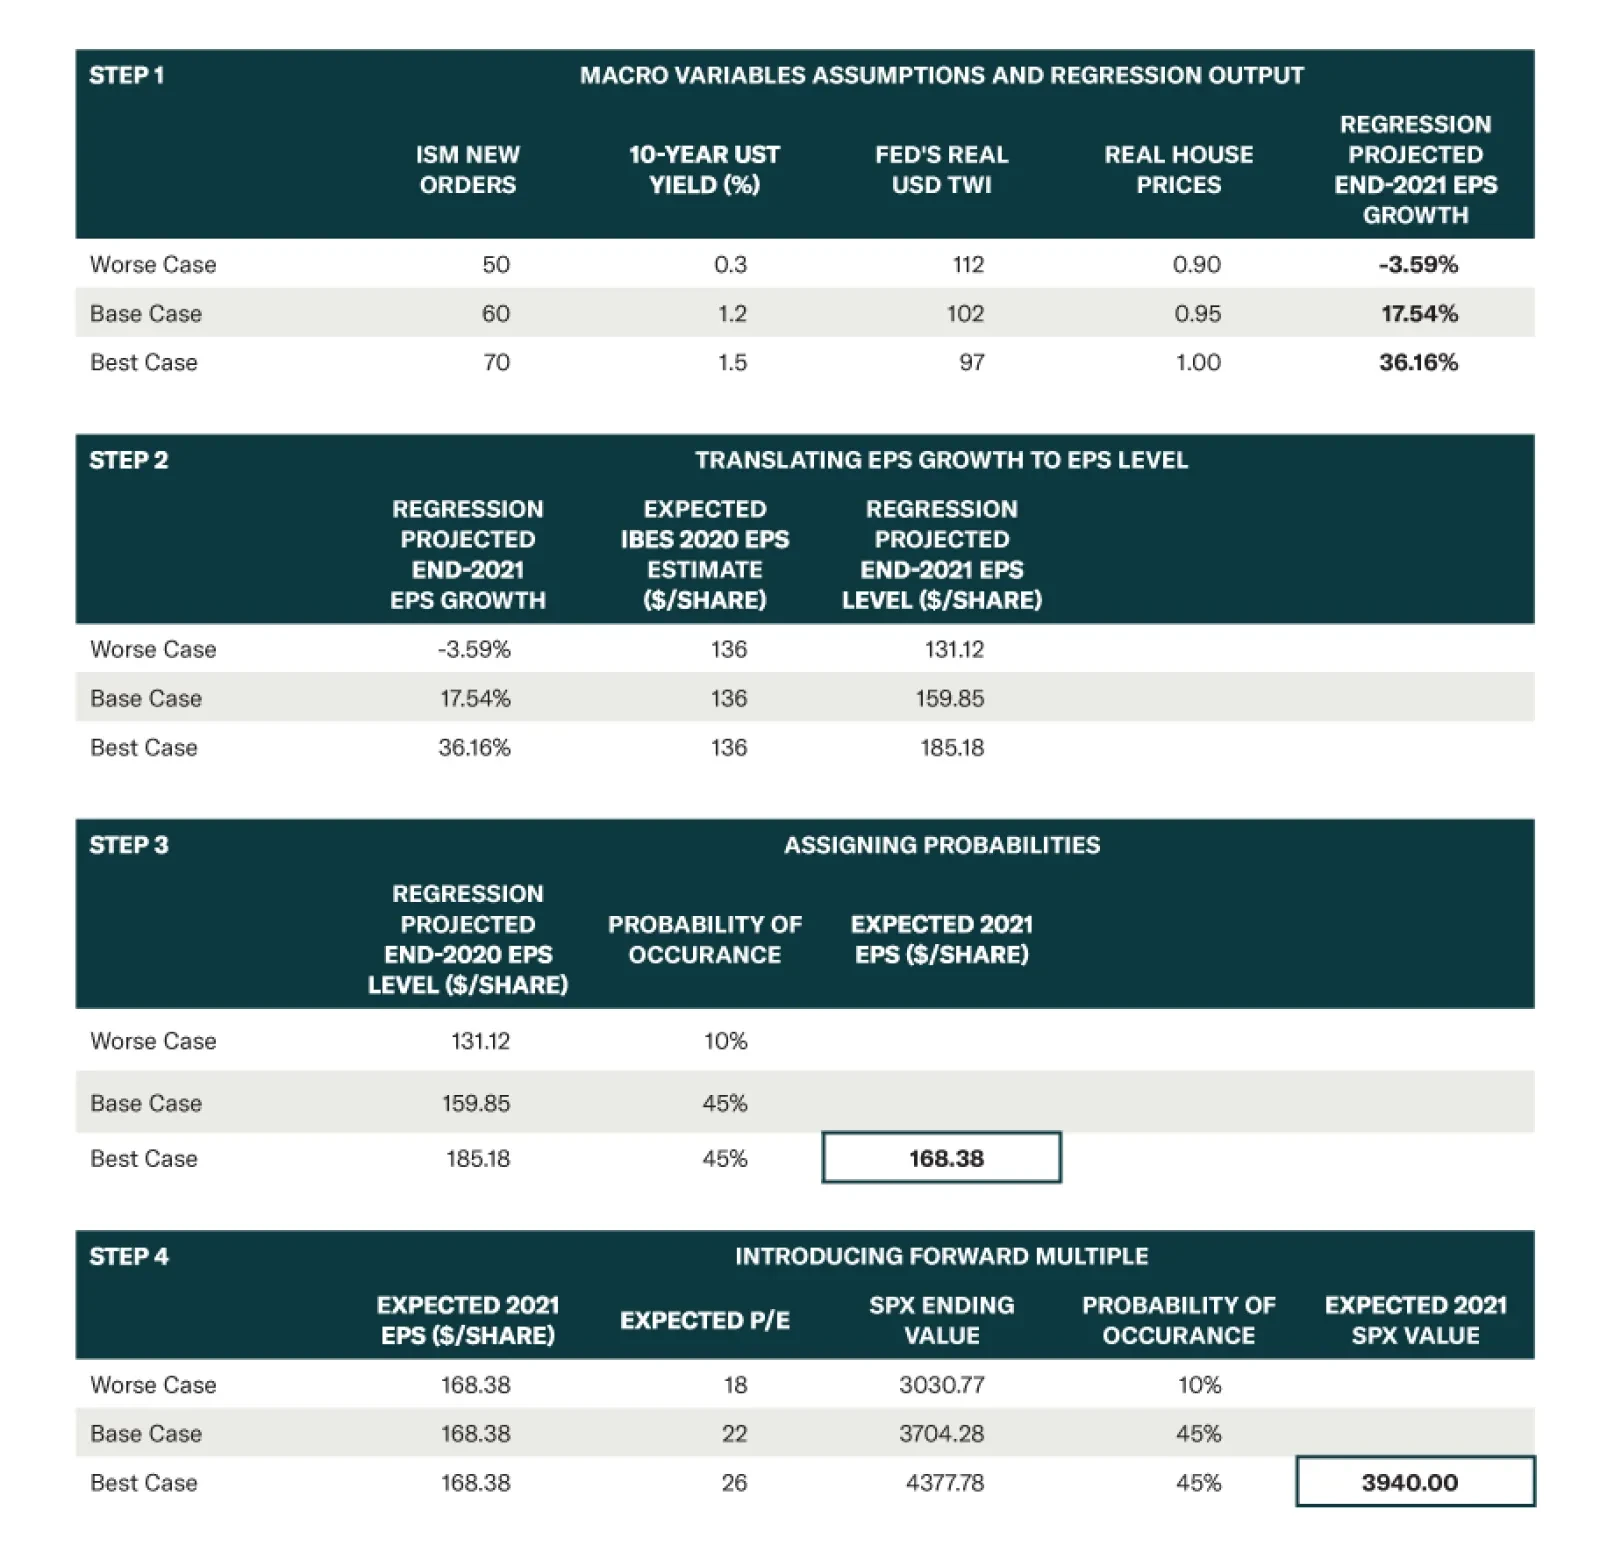
BCA Research's US Equity Strategy service used a multi-step approach to update their S&P 500 EPS estimate for 2021, arriving at $168/share. In Step 1, we plug base, worse, and best case estimates of four macro variables into our model, and apply the…
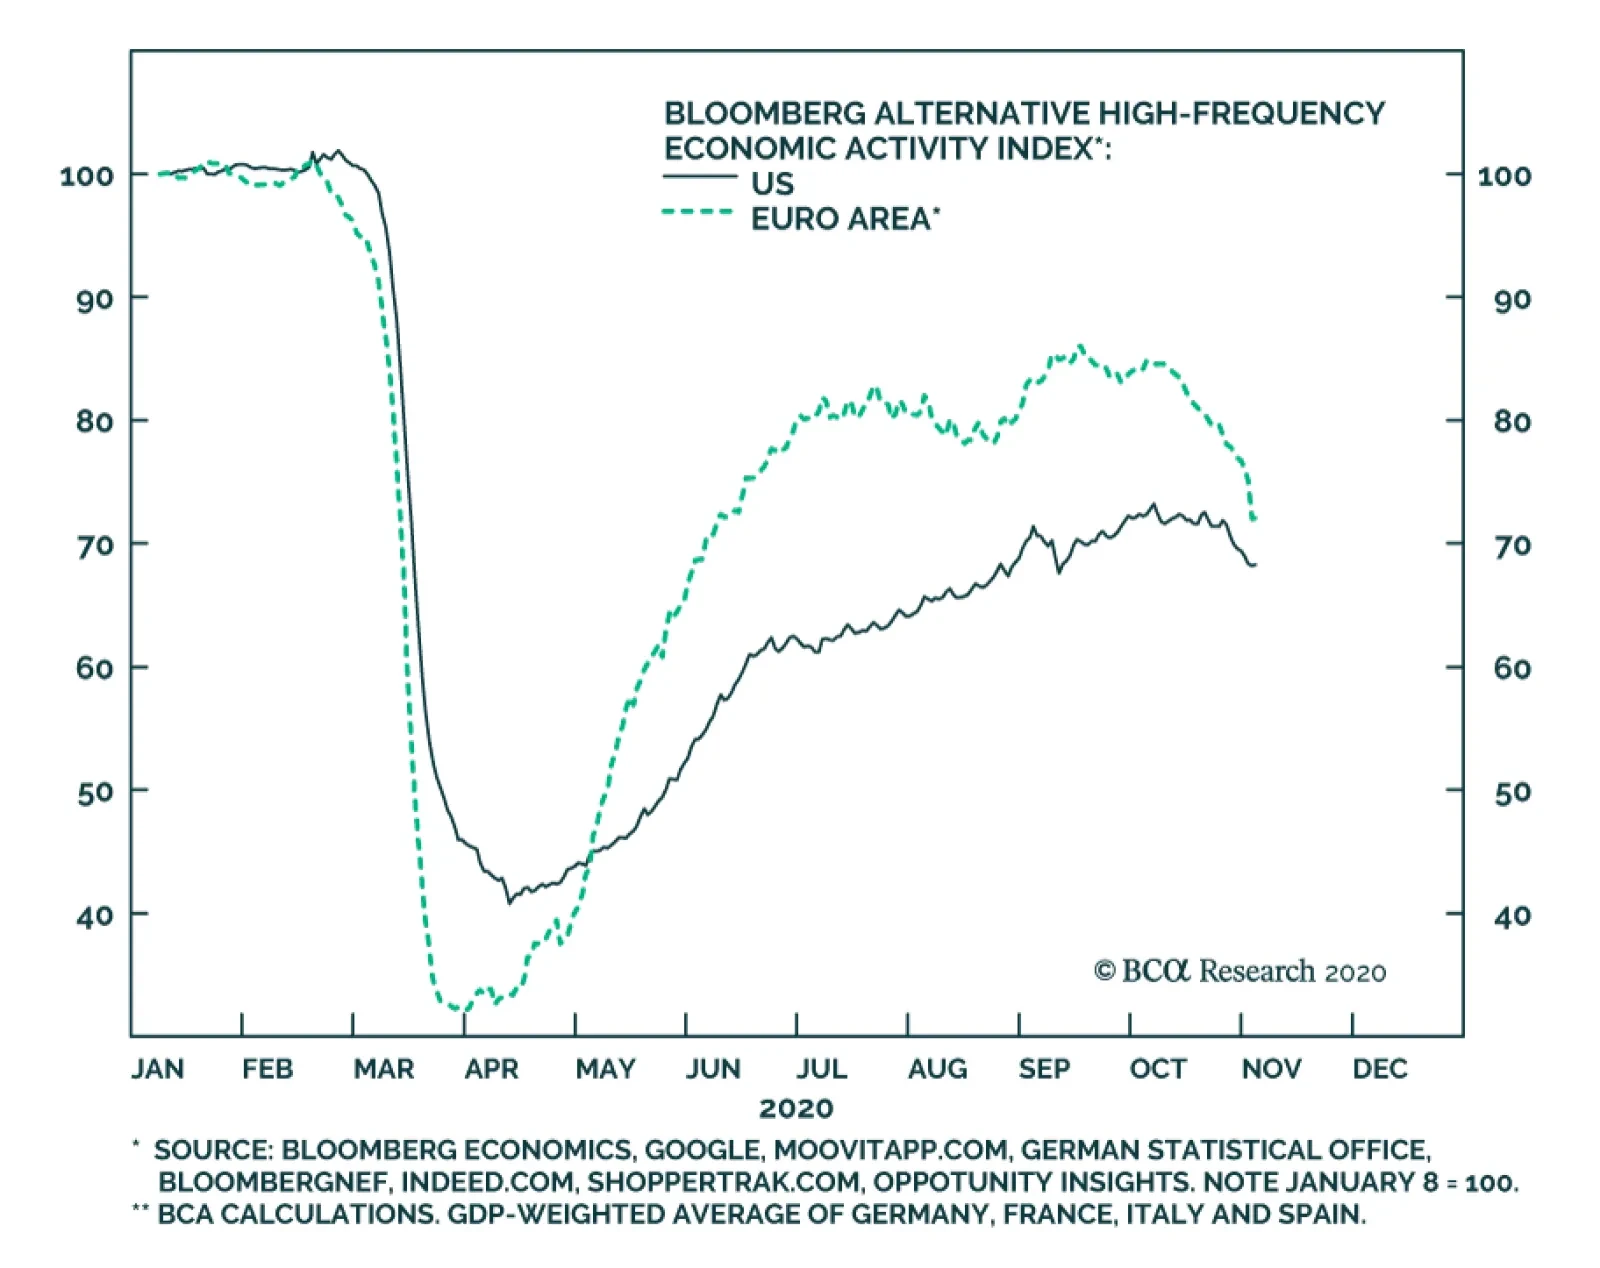
Alternative, high-frequency indicators of economic activity highlight that the US and euro area economies are already slowing in response to a new wave of COVID-19 infections. The chart above highlights Bloomberg's economic activity indexes for the US and…
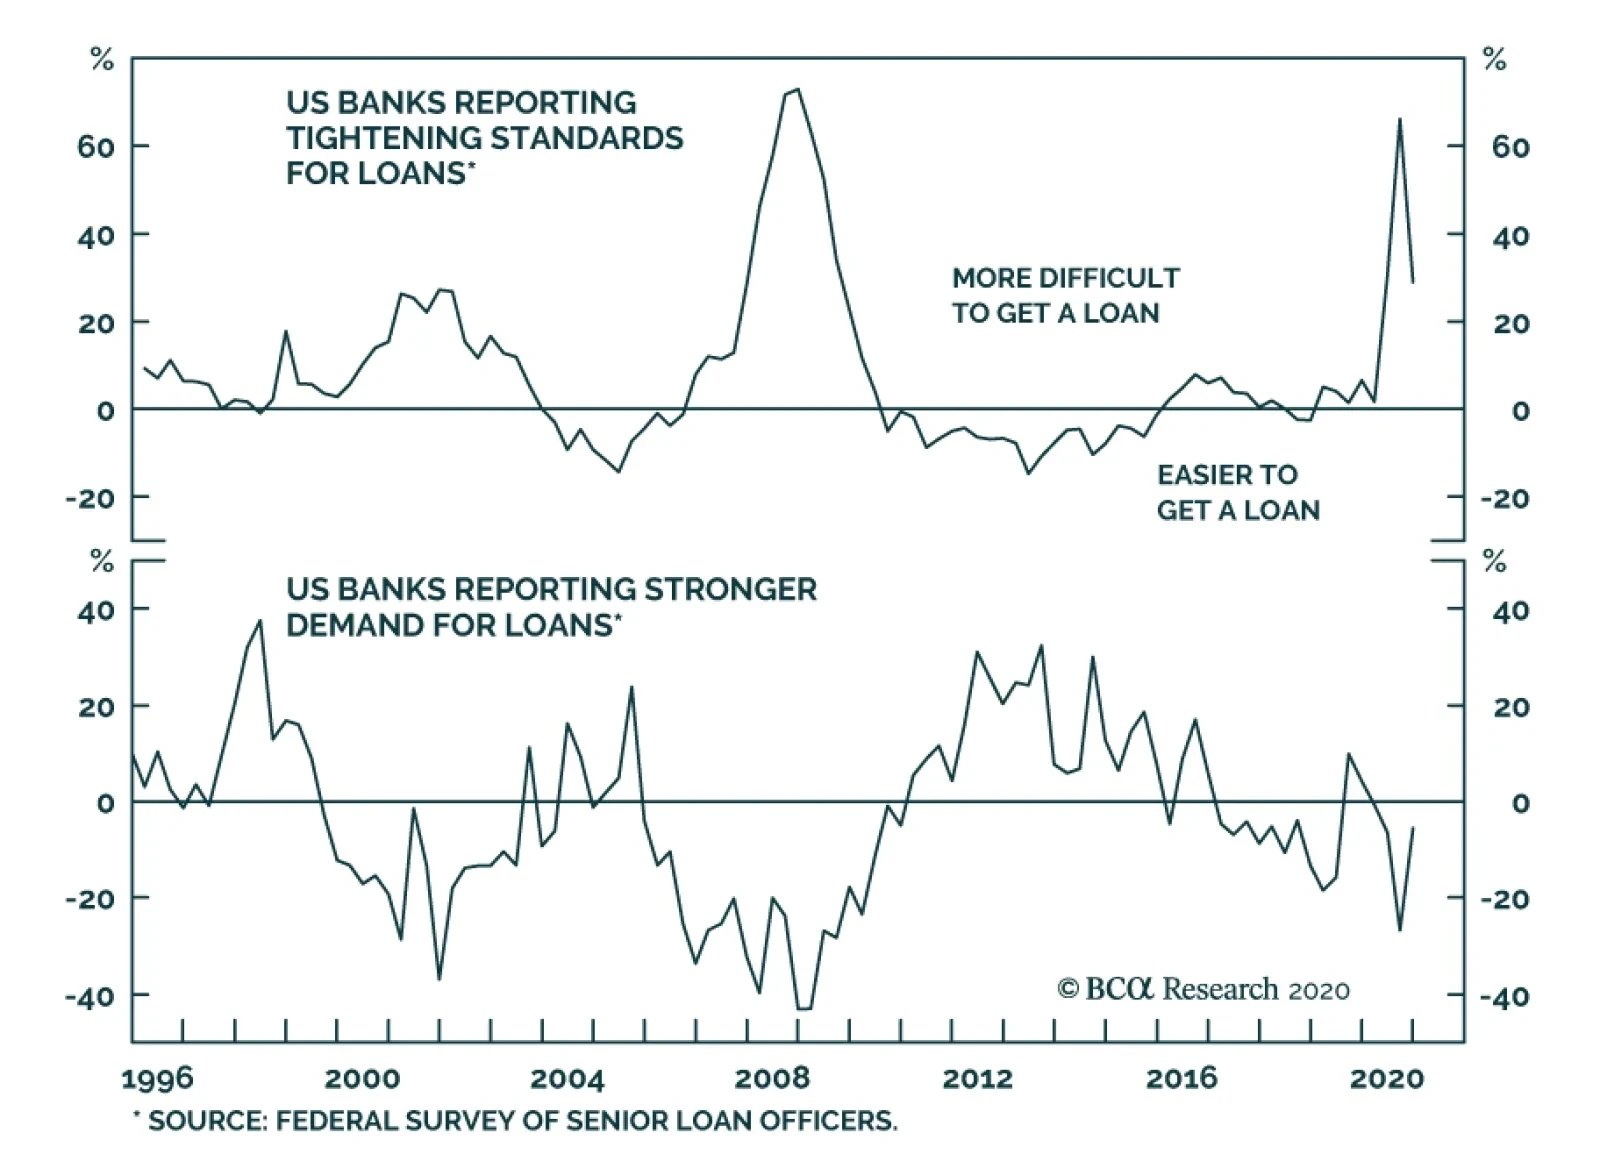
Yesterday’s US October Senior Officer Loan Survey on bank lending practices was modestly positive. The chart above highlights that lending standards became meaningfully less tight, and the net number of banks reporting stronger loan demand is less negative…
Feature In April we first published our view that S&P 500 EPS would return to trend level of $162 in calendar 2021. At the time, it seemed unrealistic as heightened uncertainty was cloaking over 2020 let alone 2021. But fast-forward to today, and analysts have already eclipsed our stale $162 estimate according to I/B/E/S data. In this Special Report, we update our very well-received three SPX EPS scenario analysis that we highlighted in January, validate whether the $162 estimate is still reasonable, and finally introduce our 2021 SPX target. Importantly, our four-factor macro S&P 500 earnings model ticked up recently following a better-than-expected ISM manufacturing release. The profit model’s current projection calls for roughly 20% year-over-year (yoy) growth for the first quarter of 2021 (Chart 1). Understandably, such a bullish outlook might raise some eyebrows. However keep in mind that 20% yoy growth from a recessionary trough is by no means an overly bullish estimate as we have shown in recent research owing largely to base effects. The next step is to put some science behind our forecast and arrive at a robust and quantifiable EPS forecast. Thus, we deconstruct our SPX profit growth model into its components and trace their likely paths over the next 8 months. Our model has four inputs: ISM manufacturing PMI, the greenback, interest rates and house prices. The first three components are responsible for the lion’s share of explanatory power; hence this is where we focus most of our attention. Chart 1One-Way Road To 2021
One-Way Road To 2021
One-Way Road To 2021
Extending The Model: ISM Manufacturing PMI To plot the likely path of PMI data, we introduce US Equity Strategy's FutureCast Indicator, which is based on Michael Howell’s of CrossBoarder Capital D-star (duration*) measure.1 As a brief explanation, D-star measures duration at which curvature of the US Treasury curve is maximized. The interpretation of D-star is that it is a duration boundary after which, economic conditions become uncertain. Consequently, the further away that boundary is, the longer the sanguine macro environment is expected to last. Similarly, as D-star takes smaller values, it signifies that the boundary is getting closer to the present, meaning that the length of the sanguine macro window is contracting. For more details on the D-star measure, please refer to Michael Howell’s original publication.2 While our FutureCast indicator is a slightly modified version of the original D-star measure, it still preserves all of the properties including a lead on the ISM manufacturing PMI data by 15 months (Chart 2). The current message is also enticing: over the course of 2021 the ISM manufacturing PMI will stay perched in the mid-to-high 50s on a three-month moving average basis while dipping into the low-to-mid 50s in 2022. Chart 2Introducing FutureCast Indicator
Introducing FutureCast Indicator
Introducing FutureCast Indicator
The next series that will help us gauge the ISM’s future path is the BCA US Liquidity Indicator (USLI), which is a blend of six variables including credit conditions and “excess money” calculations that quantify how much extra money is available to the financial economy after the real economy takes its share adjusted for inflation. Similar to our FutureCast Indicator, the USLI used to lead the PMI by approximately 18 months prior to the dot-com bubble, but since then the lead has changed to 30 months (Chart 3). This extension likely reflects the growing dependence of the US economy on the financial sector. Chart 3Everyone Gets Liquidity!
Everyone Gets Liquidity!
Everyone Gets Liquidity!
We have entered a brand-new liquidity cycle as the USLI is printing nearly all-time high readings. The reason behind such an aggressive rise is a number of exogenous shocks that were hounding the market over the past several years. Not only was liquidity already contracting in 2018, but the trade war with China exacerbated the manufacturing downturn capping new inflows. As a result, by the time the virus hit, US liquidity canisters were running dry, and policy makers had to open the liquidity spigots in order to belatedly cushion the blow from the trade war and combat this year’s COVID-19 related lockdown. The net result is that today abundant liquidity is sustaining the budding recovery, which will be reflected in upbeat PMI prints going forward. Extending The Model: The US Dollar The US dollar is the second major input in our earnings model as the S&P 500 derives 43% of its sales outside US boarders. Table 1 also highlights that deep cyclical sectors source most of their revenues internationally, further underscoring greenback’s importance. Currently, the US dollar remains range bound likely taking a breather before resuming its downtrend as ours and BCA’s working view remains for a cyclical depreciation in the currency. The bearish USD thesis is multifaceted. Starting from a structural (5-10 years) time horizon, swelling twin deficits as far as the eye can see emit a bearish US dollar signal; in more detail, prior to the pandemic, the US twin deficits were estimated to gradually rise toward the 7.5% mark, but COVID-19 related fiscal largess has pushed the twin deficits into the stratosphere (top panel, Chart 4). Table 1S&P 500 GICS1 Foreign Sales As A Percent Of Total Sales*
Deconstructing Earnings
Deconstructing Earnings
Switching gears from a structural to a medium-term horizon (2-3 years), BCA’s four-factor macro model, is also sending an unambiguous bearish message for the greenback (middle panel, Chart 4). Finally, on a short-term time frame, the USD is lagging the money multiplier by approximately 3 months, and the nosedive in the latter cements the US dollar bearish thesis (bottom panel, Chart 4). Chart 4Bearish Across All Timeframes
Bearish Across All Timeframes
Bearish Across All Timeframes
Since S&P 500 sales and the greenback are inversely correlated, and as the dollar bearish view unfolds, it will serve as a tonic to top- and bottom-line growth. Extending The Model: US 10-Year Treasury Yield Now onto the final piece of the puzzle – the 10-year US Treasury yield. Up until recently, the bond market was dormant refusing to price in the recovery. While the selloff in bonds that commenced in early August took a breather on the back of the GOP retaining the Senate, i.e. implying a smaller than previously expected fiscal stimulus package, the path of least resistance remains higher for yields. As the economy continues to reopen in 2021, a new bear market in bonds is likely. US yields are tightly correlated with the ebbs and flows of global growth, especially G7 industrial production (IP) growth. Global IP is set to recover from the depths of the COVID-19 recession paving the way for higher 10-year US Treasury yields. In fact, our excess demand for goods indicator, which gauges the difference between the total number of goods produced versus consumed, leads industrial production data by 12 months and currently predicts a long overdue V-shaped recovery in global IP (Chart 5). In summary, it is only a question of time until the ten-year catches up with “soft” data and the bullish economic signal from the equity market, both of which have already discounted a V-shaped recovery. The US 10-year Treasury yield has a positive coefficient in our SPX EPS growth regression model, implying that rising yields that reflect an economic rebound boost EPS and vice versa. Chart 5Yields Will Rise
Yields Will Rise
Yields Will Rise
Tying It All Together Adding all the pieces of the puzzle reveals that our previous $162 estimate is slightly pessimistic for calendar 2021. We arrived to this conclusion by applying our three-scenario approach that we first implemented in our research methodology early in the year. Specifically, our worst-case scenario (with the lowest probability of occurrence) is a recessionary relapse (double-dip recession) in 2021. Our base- and best-case scenarios incorporate bullish dynamics that we outlined earlier in the report and we quantify below to arrive at our new probability-weighted $168 EPS estimate. We then deduce our 2021 SPX target through a five-step process outlined in Table 2. Table 2Three Scenarios
Deconstructing Earnings
Deconstructing Earnings
Step 1: We plug into the model our base, worse and best case estimates of the four macro variables into mid-2021, and we get as output the model’s estimate of EPS growth for end-2021 with a range of -3.6% to 36.2% (one important assumption is that the historical correlation of the movement of these variables holds steady). Step 2: Then, we apply these growth rates to the expected IBES 2020 EPS forecast of $136/share and arrive at our end-2021 three scenarios EPS level estimates with a range of $131/share to $185/share. Step 3: We then assign probabilities to those three outcomes resulting in our new 2021 EPS forecast of $168/share. Step 4: In order to get an SPX expected value we need to apply a forward P/E multiple to our EPS estimate. Thus, we introduce our base-, worse- and best- case forward P/Es and multiply them with our $168/share weighted EPS forecast in order to arrive at the SPX 3,940 expected value for end-2021. Concluding Thoughts So what does it all mean? At the onset of the report we mentioned an eyebrow-raising 20% EPS growth estimate. However as it turns out, if we take into account the long overdue economic recovery that started in early-2020, but got short-circuited due to the COVID-19 outbreak, there are reasonable scenarios that can overwhelm our previous $162 2021 EPS target. Moreover, if the looming stimulus lands sometime in early Q1/2021, our best-case scenario may come to fruition. Under such a backdrop the SPX is likely to gallop even higher than our roughly SPX 4,000 target by the end of 2021. Finally, last week Wall Street analysts upgraded their calendar 2021 EPS estimate to $168 following news that the GOP would retain the Senate, which will prevent Biden’s tax increase should he be the winner of the 2020 election. If everything goes according to plan, then there are high odds that sell-side analysts will eventually catch up to our best-case scenario. But by then the market will have likely already discounted such a rosy backdrop, calling for a brand-new earnings analysis. Stay tuned. Arseniy Urazov Research Associate Arseniyu@bcaresearch.com Footnotes 1 Howell, Michael J. 2017. Further Investigations into the Term Structure of Interest Rates. London: University of London. 2 Ibid.
Friday’s jobs report beat consensus expectations and was more positive than what other labor market indicators would have suggested. We noted last week that the momentum in initial claims had waned, and that the employment component of the October ISM and…
Highlights Biden’s chances of winning the US election are rising, but it is still unsettled and could bring negative surprises to financial markets. The fiscal cliff will not subside immediately as the Senate Republicans have been vindicated for their fiscally hawkish approach. We doubt Democrats will win both Senate seats in Georgia to restore the lost “Democratic Sweep” scenario that offered maximum policy reflation. President Trump’s lame duck period, if he loses, lasts for three months and could bring negative surprises on China, the Taiwan Strait, Big Tech, Iran, or North Korea. The US remains at “peak polarization,” though we expect a growing national consensus over the long haul. Go long a basket of Trans-Pacific Partnership countries on a strategic time horizon to capitalize on what we believe will be Biden’s pro-trade-ex-China policy. Feature Chart 1Market Response To US Election
Market Response To US Election
Market Response To US Election
The US presidential election remains undecided despite former Vice President Joe Biden’s increasing likelihood of victory. Votes will be recounted in several states while one potential tipping-point state, Pennsylvania, could easily swing on a Supreme Court decision. The Senate is likely to remain in Republican hands, though there is still a ~20% chance that it will flip if Democrats win both of the likely Georgia runoff elections on January 5. Thus our base case is the same as in our final forecast: Biden plus a Republican Senate. Financial markets first rallied and have now paused (Chart 1). The pause makes sense to us. Ultimately the best-case scenario of this election was always Biden plus a Republican Senate – neither tariffs nor taxes would increase. But this same scenario also always posed the highest risk of near-term fiscal tightening that would undermine the US recovery and global reflation trade. GOP Senators will insist on a smaller fiscal relief bill and may wait too long to enact it. Below we discuss these dynamics and why we maintain a tactically defensive position amid this contested election. We will not go full risk-on until the critical short-run risks subside: the contested election, the fiscal impasse, Trump’s “lame duck” executive orders, and the international response. Biden Not Yet President-Elect Biden is leading the vote tally in Arizona, Georgia, Michigan, Nevada, Pennsylvania, and Wisconsin as we go to press. To all appearances he has reclaimed the “Blue Wall” (MI, PA, WI) and made inroads in the Sun Belt (AZ, GA). We will not go full risk-on until the critical short-run risks subside. Map 1 shows tentative election results. Unsettled states are colored lightly while settled states are solid red or blue. This map points to a Biden victory even if Georgia and Pennsylvania slip back to Trump. The President would need to reclaim the latter two and one other state to reach 270 Electoral College votes. Map 1US 2020 Election Results (Tentative)
Civil War Lite And Peak Polarization
Civil War Lite And Peak Polarization
Chart 2 shows the final prediction of our quantitative model. While our model predicted a Trump victory at 51% odds, we subjectively capped Trump’s odds at 45% because we disagreed that Trump would win Michigan.1 We did not do the same for our Senate model as the results matched with our subjective judgment that Republicans would keep control. Chart 2Our Presidential Quant Model Versus Actual Results
Civil War Lite And Peak Polarization
Civil War Lite And Peak Polarization
Investors cannot yet conclude that the contested election risks have abated. If Biden wins only AZ, NV, MI, and WI, then he will end up with 270 Electoral College votes. This is the minimal vote needed for a victory. It is legitimate, but it means that a net of one faithless elector, or a disqualified elector, could throw the nation into a historic and nearly unprecedented crisis. If the Electoral College becomes indecisive for any reason, the House of Representatives will decide the election. Each state will get one vote. The results of the election suggest Republicans have four-to-ten seat majority of state delegations in the House (Table 1). Trump would win. Polarization and unrest would explode. Not for nothing did we brand this election cycle “Civil War Lite.” Table 1State Delegations In US House Of Representatives
Civil War Lite And Peak Polarization
Civil War Lite And Peak Polarization
The greater the margin of victory in the Electoral College, the less vulnerable the nation is to indecision in the college, or to a result decided in the courts. The Republicans have a strong case in Pennsylvania that votes that arrived after November 3 should not be counted. It is not clear if the Supreme Court will revisit the case, having left it unresolved prior to the election. If Pennsylvania’s 20 electoral votes become the fulcrum of the election, and the Supreme Court rules to exclude votes received after November 3, and if Trump thereby wins the count, a national crisis will erupt. This is not high probability at the moment because Biden can afford to lose Pennsylvania if he wins Nevada or Georgia. But the history of contested elections teaches that investors should not rush to conclusions. Senate Gridlock Will Survive Georgia Runoffs The most likely balance of power is a Democratic president with a Republican Senate and Democratic House, i.e. gridlock. Chart 3 shows the likely balance of power in Congress. Democrats would need to win both runoff elections in Georgia to win 50 seats, which would give them a de facto majority if Biden wins, since Vice President Kamala Harris would become President of the Senate and break any tie votes there. They are unlikely to do so. Chart 3AGridlock In US Government
Civil War Lite And Peak Polarization
Civil War Lite And Peak Polarization
Chart 3BGridlock In US Government
Civil War Lite And Peak Polarization
Civil War Lite And Peak Polarization
Why do we doubt that Democrats will win both Georgia seats, given that Trump is now falling short in the statewide presidential vote? First, Republicans tend to do well in runoffs as Georgia is a conservative-leaning state (Chart 4). Second, the Republican vote was greater than the Democratic vote in both Senate elections, though falling short of 50%. Third, exit polls show that voters leaned Republican in the suburbs and were mostly concerned about the economy, not the coronavirus. Fourth, also clear from exit polls, Republican voters will be more motivated to retain control of the Senate with Trump out, while Democratic voters will be less motivated with Biden in (Chart 5). Voter turnout will drop in the special election as usual. Neither Trump nor the presidency will be on the ballot on January 5. Still, it is possible for Democrats to win both seats and hence de facto control of the Senate. We would say the odds are roughly 20% (0.5 x 0.4 = 0.2). Chart 4GOP Does Well In Georgia Runoffs
Civil War Lite And Peak Polarization
Civil War Lite And Peak Polarization
Chart 5Georgia 2020 Election Results (So Far)
Civil War Lite And Peak Polarization
Civil War Lite And Peak Polarization
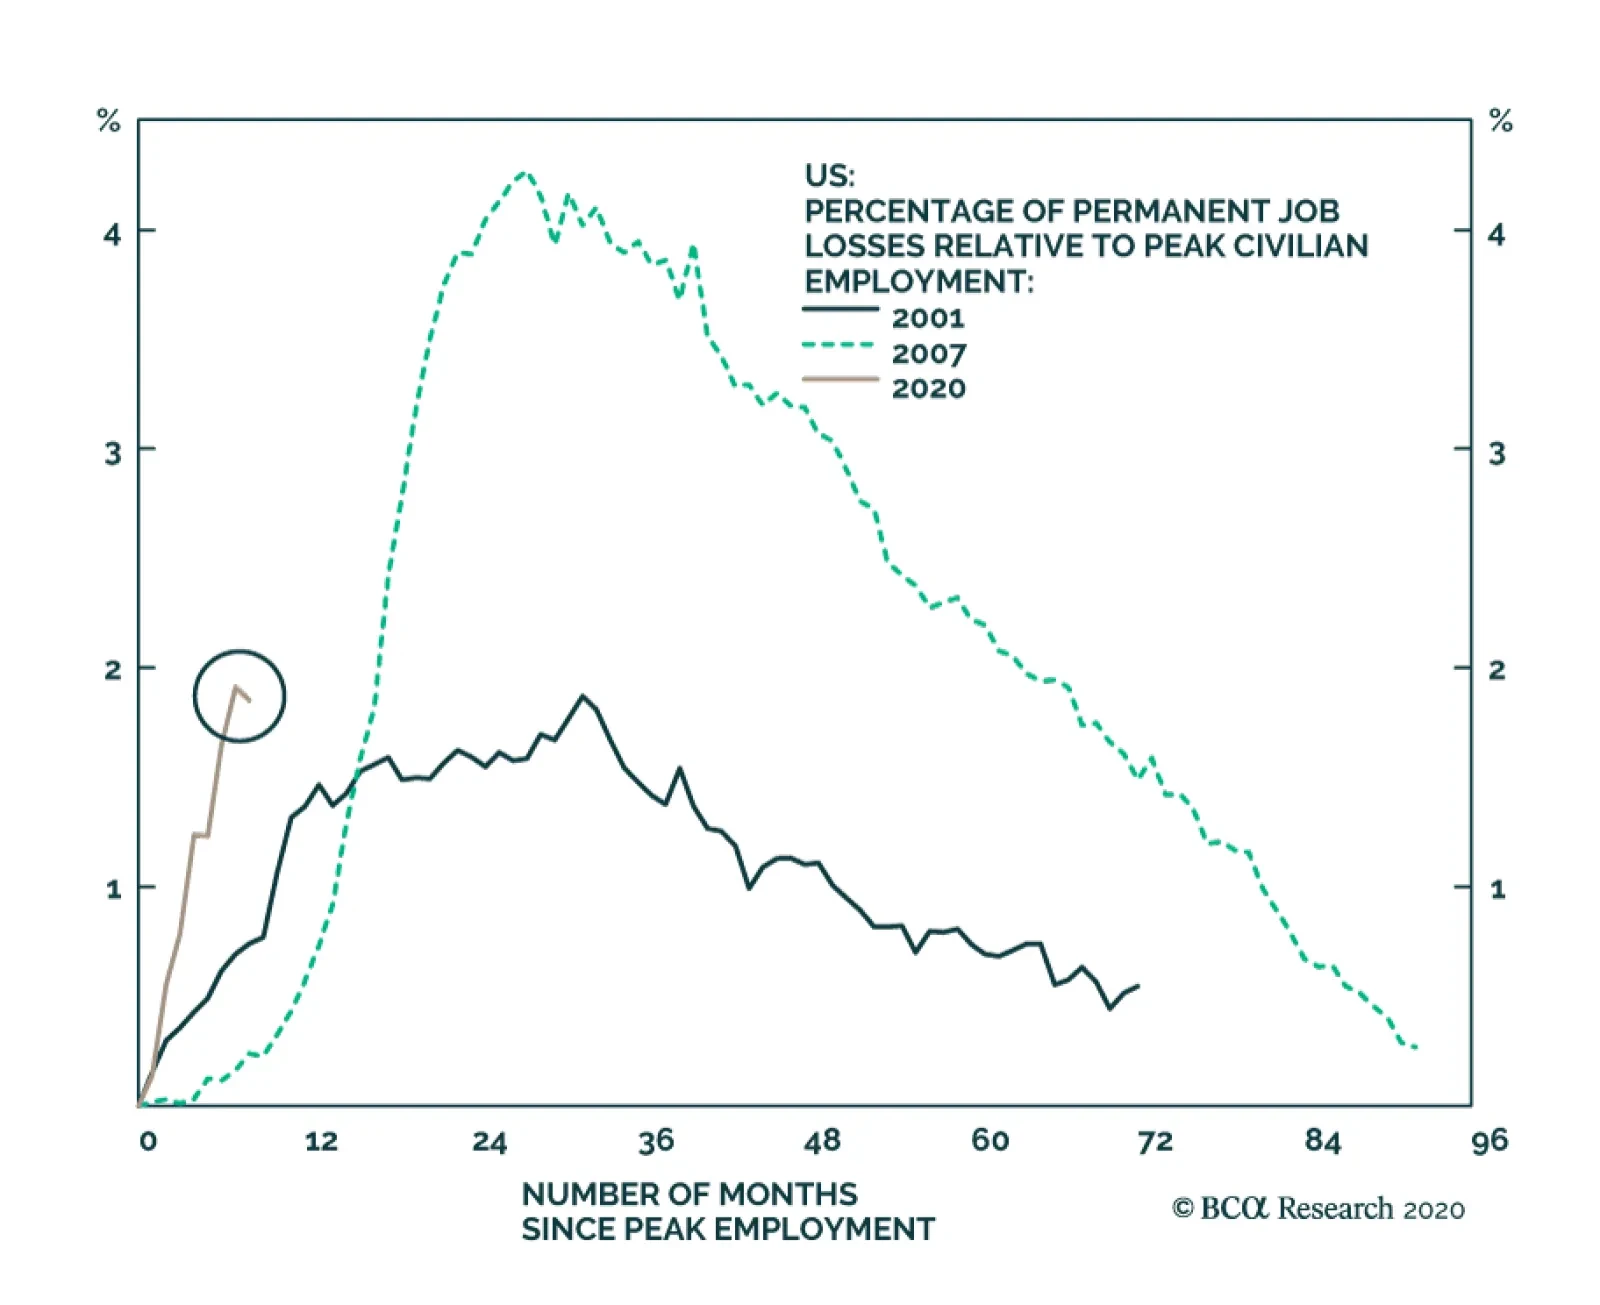
If Democrats pulled off two victories in Georgia, the “Blue Sweep” scenario would be reaffirmed and several legislative proposals that had a 0% chance of passage in a Republican Senate would become at least possible. Certainly taxes would go up – the Democrats would be able to use the reconciliation process to push through reforms to the health care system paid for by partially repealing the Trump Tax Cut and Jobs Act. They would also be able to pass legislation that is popular with moderate Democrats who would then hold the balance in the Senate. The Green New Deal would become possible, if highly improbable. There would be a small chance of removing the filibuster in an exigency, but a vanishingly small chance of other radical structural changes, like creating new seats on the Supreme Court or granting statehood to Washington DC and Puerto Rico. A 50-50 count in the Senate, with Harris breaking the tie, would produce a larger increase in the budget deficit than otherwise. Stocks would have to discount the tax hike but they would recover quickly on the prospect of combined monetary and fiscal ultra-dovishness. Fiscal Impasse Prolonged Biden plus a Republican Senate is positive for the US corporate earnings outlook over the 24 months between now and the 2022 midterm election. It is also positive for the global earnings outlook over the four-year period due to the drastically reduced odds of a global trade war. But it is negative in the near term because it will result in a smaller and delayed fiscal relief package – and sooner than later the market will need a signal that the government will not pull the rug out from under the recovery. Biden plus a GOP Senate is negative in the near term due to fiscal risks but positive beyond that. True, the US economy continues to bounce back rapidly, which is why the Republicans performed so well in this election despite a recession, a pandemic, and a failure to pass another round of stimulus beforehand. In October the unemployment rate fell to 6.9%. Yet previous rounds of fiscal support are drying up. The job market is showing some signs of underlying weakness and these will worsen as long as benefits run out and COVID-19 cases discourage economic activity (Chart 6). Personal income has dropped off from its peak when the first round of stimulus was passed in March. Without the dole it will relapse (Chart 7). Chart 6US Job Market Weakening Sans Stimulus
US Job Market Weakening Sans Stimulus
US Job Market Weakening Sans Stimulus
Chart 7US Personal Income Will Drop Sans Stimulus
US Personal Income Will Drop Sans Stimulus
US Personal Income Will Drop Sans Stimulus
Will Senate Republicans agree to a fiscal deal in the “lame duck” session before the new Congress sits on January 3? We have no basis for a high-conviction view. They might agree to a deal in the range of $500 billion to $1 trillion, but only if the Democrats come down to these levels in the talks. Senate Majority Leader Mitch McConnell is one of the big winners of the election. He held his seat and likely maintained Republican control of the Senate without capitulating to House Speaker Nancy Pelosi’s demands of a $3 trillion-plus relief bill. He wagered that Republicans would do better with voters if they concentrated on reopening the economy (and confirming Amy Coney Barrett to the Supreme Court) while limiting any fiscal bill to targeted COVID response measures. He drew a hawkish line against broad-based social spending and bailouts for state and local governments. The gambit appears to have worked. House Democrats, far from gaining seats, lost five. We would not be surprised if Pelosi were replaced as speaker in 2021. Her plan backfired so badly that if Trump had stayed on message in his campaign, he might even have won. The implication is that unless Pelosi comes down to McConnell’s number, the fiscal impasse will extend into January and February. The American public approves of fiscal relief, but that did not force McConnell’s hand earlier, as the economy was recovering regardless (Table 2). Unless the economy slumps or financial markets selloff drastically, he will likely insist on a skinny deal that includes liability protections for businesses while minimizing bailouts for indebted blue states. Table 2Americans Support Fiscal Stimulus Package
Civil War Lite And Peak Polarization
Civil War Lite And Peak Polarization
Hence investors are likely to get bad news before good news on the US fiscal front. And if other bad news arises, the absence of fiscal support will be sorely felt. This motivates our tactically defensive posture until the fiscal impasse is resolved. Peak Polarization Polarization is at peak levels in the US and the election result suggests it will remain elevated. Whichever party wins will win with a narrow margin. There is simply no commanding mandate for either party, as has been the case this century, so the struggle will continue (Chart 8). Chart 8Polarization Will Continue With Narrow Margins Of Victory
Civil War Lite And Peak Polarization
Civil War Lite And Peak Polarization
Of course, polarization may subside temporarily, assuming Trump loses. At least under Biden the Electoral College vote will coincide with the popular vote, improving popular consent. Biden will have a lower disapproval rating, probably throughout his term. High disapproval tends to coincide with crises in modern US history, but in 2021, after the dust clears from this election, the country may catch its breath (Chart 9). Chart 9Presidential Disapproval Will Fall
Civil War Lite And Peak Polarization
Civil War Lite And Peak Polarization
Much will depend on whether the presumed Biden administration is willing to sideline the left-wing of the Democratic Party to court the median voter. Exit polling in the swing states strongly suggests that the Biden administration won the election (if indeed it did) by improving Democratic support among the majority white population, non-college educated voters, and senior citizens, all groups that delivered Trump the victory in 2016. The Democrats had mixed results among ethnic minorities and suburban voters. Their biggest liability was their focus on issues other than the economy (Chart 10). Chart 10Exit Polls Say Focus On Bread And Butter
Civil War Lite And Peak Polarization
Civil War Lite And Peak Polarization
Over the coming decade we think the combination of (1) cold war with China and (2) generational change on fiscal policy will produce a new national consensus. But we are not there yet. The contested election is not guaranteed to end amicably. If Trump wins on a technicality, the country will erupt into mass protests; if he loses and keeps crying stolen election, isolated domestic terrorist incidents are entirely possible. Moreover the battle over the 2020 census and redistricting process will be fierce. Democrats will be hungry to take the Senate in 2022, failing Georgia in January, to achieve major legislative objectives while Biden is in office. And the 2024 election will be vulnerable to the fact that Biden may have to bow out due to old age, depriving the Democrats of an incumbent advantage. The bottom line is that Republicans outperformed and will not be inclined to help the Biden administration start off on strong footing. The implication is the fiscal battle will extend into the New Year unless a stock market selloff forces Republicans to compromise. Fiscal cliffs will be a recurring theme until at least the 2022 election. A deflationary tail risk will persist. Obama’s Legacy Secured? The sole significance of a gridlocked Biden presidency will lie in regulatory affairs, foreign policy, and trade policy. These are the policy areas where presidents have unilateral authority and Biden can act without the Senate’s approval. In this context, Biden’s sole focus will be to consolidate the legacy of the Barack Obama administration, in which he served. 1. Obamacare (ACA): Republicans failed to repeal and replace this bill despite a red sweep in 2016. Biden’s election ensures that Obamacare will be implemented, if not expanded, as he will have the power to enforce the law at the executive level. The risk is that the conservative-leaning Supreme Court could strike it down. Based on past experience, the health care sector will benefit from the drop in uncertainty once the court’s decision is known (Chart 11). For investors the lesson of the past four election cycles is that Obamacare is here to stay, but Americans will not adopt a single-payer system until 2025 at the earliest conceivable date. We are long health equipment and see this outcome as beneficial to the health sector in general, particularly health insurance companies. Big Pharma, however, will suffer from bipartisan populist pressures to cap prices. 2. Iran Nuclear Deal (JCPA): Biden will seek to restore Obama’s signature foreign policy accomplishment, the Joint Comprehensive Plan of Action, i.e. the Iran nuclear deal of 2015. The purpose of the deal was to establish a modus vivendi in the Middle East so that the US could “pivot to Asia” and focus its energy on the existential strategic challenge posed by China. Biden will stick with this plan. The Iranians also want to restore the deal but will play hard to get at first. Israel and Saudi Arabia could act to thwart Iran and tie Biden’s hands in the final three months of Trump’s presidency while they have unmitigated American backing. Chart 11Obamacare Preserved
Obamacare Preserved
Obamacare Preserved
The implication is that Iranian oil production will return to oil markets (Chart 12), but that conflict could cause production outages, and Saudi Arabia could increase production to seize market share. Hence price volatility is the outcome, which makes sense amid fiscal risks and COVID risks to demand as well. 3. The Trans-Pacific Partnership (CPTPP): Biden claims he will “renegotiate” the Trans-Pacific Partnership, which was the Obama administration’s key trade initiative. The idea was to group like-minded Pacific Rim countries into an advanced trade deal that addressed services, the digital economy, labor and environmental standards, and pointedly excluded China. Trump withdrew from the deal out of pique despite the fact that it served the purpose of diversifying the American supply chain away from China. The impact of rejoining is miniscule from an economic point of view (Chart 13), but it will be a boon for small emerging markets like Mexico, Chile, Vietnam, and Malaysia. Chart 12Restoring The Iran Nuclear Deal
Restoring The Iran Nuclear Deal
Restoring The Iran Nuclear Deal
Chart 13Rejoining The Trans-Pacific Partnership
Civil War Lite And Peak Polarization
Civil War Lite And Peak Polarization
The bigger takeaway is that Biden will continue the US grand strategic shift toward confronting China, which will be a headwind toward Chinese manufacturing and a tailwind for India, Latin America, Southeast Asia. The US will cultivate relations with the Association of Southeast Asian Nations (ASEAN) as a more coherent economic bloc and a manufacturing counterweight to China (Chart 14). A lame duck Trump will attempt to cement his legacy by targeting China/Taiwan, Iran, North Korea, or Big Tech. When it comes to on-shoring, Biden’s focus will be reducing dependency on China and improving the US’s supply security in sensitive areas like health and defense. Trade and strategic tensions with China will persist, but a global trade war is not in the cards. Manufacturing economies ex-China stand to benefit. 4. The Paris Climate Accord: Biden will not be able to pass his own version of the Green New Deal without the Senate, so investor excitement over a government-backed surge in green investment will subside for the time being (Chart 15). He will also moderate his stance on the energy sector after his pledge to phase out oil and gas nearly cost him the election. He was never likely to ban fracking comprehensively anyway. Chart 14ASEAN's Moment
ASEAN's Moment
ASEAN's Moment
Biden will be able to rejoin the international Paris Agreement and reverse President Trump’s deregulation of the energy sector. He will re-regulate the economy to lift clean air, water, environment, and sustainability standards. This is a headwind for the energy sector, but stocks are already heavily discounted and congressional gridlock is a positive surprise. Chart 15Returning To The Paris Climate Accord
Returning To The Paris Climate Accord
Returning To The Paris Climate Accord
There may be some room for compromise with Senate Republicans when it comes to renewables in a likely infrastructure package next year. Post-Trump Republicans may also be interested in Biden’s idea of a “carbon adjustment fee” on imports, which is another way of saying tariffs on Chinese-made goods. Like the health care sector, the election is tentatively positive for US energy stocks – especially once fiscal risks are surmounted. Investment Takeaways Chart 16Lame Duck Trump Risk: Taiwan Strait
Civil War Lite And Peak Polarization
Civil War Lite And Peak Polarization
Three near-term risks prevent us from taking a tactically risk-on investment stance. First, the contested election, which could still throw up surprises. Second, the fiscal stimulus impasse, which could persist into January or February and will reduce the market’s margin of safety in the event of other negative surprises. Third, a lame duck Trump will attempt to cement his legacy via executive orders. He could target China/Taiwan, Iran, North Korea, or even Big Tech. On China, Trump is already tightening export controls on China and selling a large arms package to Taiwan (Chart 16). The lame duck period of any presidency is a useful time for the US to advance strategic objectives. Trump will also blame China and the coronavirus for his defeat. He could seek reparations for the virus, restrictions on Chinese manufacturing and immigration to the US, export controls or sanctions on tech companies, secondary sanctions over Iran or North Korea, delisting of Chinese companies listed in the US, sanctions over human rights violations in China’s autonomous regions, or travel bans on Communist Party members. During these three months, Big Tech will face crosswinds – risks from Trump, but opportunities from gridlock. Polarization has helped support US equity and tech outperformance over the past decade. Frequent hold-ups over the budget in Congress weigh on growth and inflation expectations, thus favoring growth stocks and tech. Internal divisions have prompted the US to lash out abroad, increasing risks to international stocks and driving safe-haven demand into the dollar and tech. More broadly the second wave of the pandemic is a boon for tech earnings and Biden will restore the Obama administration’s alliance with Silicon Valley. But tech is already priced for perfection and this favorable trend will be cut short when COVID restrictions ease and Biden works out a compromise with the Senate GOP over stimulus and the budget (Chart 17). Beyond these near-term risks, we have a constructive outlook for risk assets over the next 12 months. Chart 17Biden, Peak Polarization, And Big Tech
Biden, Peak Polarization, And Big Tech
Biden, Peak Polarization, And Big Tech
Chart 18Global Stocks, Cyclicals Benefit When US Fiscal Impasse Resolved
Global Stocks, Cyclicals Benefit When US Fiscal Impasse Resolved
Global Stocks, Cyclicals Benefit When US Fiscal Impasse Resolved
Insofar as Biden seeks to restore US commitment to global free trade, and more stable and cooperative relations with allies and partners ex-China, global policy uncertainty should fall relative to the United States. Once near-term fiscal hurdles are cleared, the dollar’s strength can subside and global stocks and global cyclicals can start to outperform (Chart 18). Chart 19Trump An Exclusively Commercial President
Trump An Exclusively Commercial President
Trump An Exclusively Commercial President
We also favor stocks over bonds on a strategic horizon. Trump was an exclusively commercial president whose approval rating had a tight correlation with the stock-to-bond ratio (Chart 19). A surge in stocks would help power Trump’s approval. This relationship is not standard across presidents. But it does make sense during periods of policy change that affect earnings. Trump’s tax cuts are the best example. Equities outpaced bonds in anticipation of tax cuts in 2017. Trump’s approval rating recovered once the bill was passed. President Obama’s approval rating also correlated somewhat with the stock-to-bond ratio during the critical fiscal cliff negotiations under gridlock from 2010-12. Once Biden works out a compromise with GOP Senators, bond yields will rise and stocks will power upward. The takeaway from these points is that volatility can remain elevated over the next 0-3 months (Chart 20). We would not expect it to go as high as in 2000, when the dotcom bubble burst, but Trump’s lame duck maneuvers against China could generate a massive selloff. But this cannot be ruled out. Indeed, Trump’s constraints have almost entirely fallen away regardless of whether he loses or wins. Investors should take a phased and conservative approach to adding risk in the near term. The outlook will brighten up when the president is known, a fiscal deal is reached, and President Trump’s legacy as the Man Who Confronted China is complete. Chart 20Volatility Will Stay Elevated In Short Run
Volatility Will Stay Elevated In Short Run
Volatility Will Stay Elevated In Short Run
Chart 21Go Long Trans-Pacific Partnership
Go Long Trans-Pacific Partnership
Go Long Trans-Pacific Partnership
Given our view that Biden will be hawkish on China, especially amid gridlock at home, we are maintaining our short CNY-USD trade. We also recommend buying a basket of Trans-Pacific Partnership bourses, weighted by global stock market capitalization, on a strategic time-frame to capture what we expect will be Biden’s pro-trade-ex-China policy (Chart 21). Finally, to capture the views expressed above regarding Biden’s likely market impacts, over the short and long run, we will go long US health care relative to the broad market on a tactical basis and long US energy on a strategic basis. Matt Gertken Vice President Geopolitical Strategy mattg@bcaresearch.com Footnotes 1 As things stand, the model overrated the Republicans in Arizona and Georgia as well, though really Georgia looks to be the only state Democrats won that the model gave high odds of staying Republican. If we had used the level rather than the range of Trump’s approval rating – or if we had neglected opinion polling altogether – the model would have called a Biden win.
Highlights We agree with the market consensus that the long-term dollar outlook is bearish, but caution against chasing the dollar lower in the short term. While the election results remain uncertain, currency markets also continue to ignore risks of a no-deal Brexit and significant escalation in Covid-19 infections. As such, pro-cyclical currencies remain vulnerable to a countertrend reversal, especially as the greenback remains oversold. The Japanese yen stands as a viable portfolio hedge. For longer-term currency investors, a more robust portfolio of US and Chinese paper and precious metals should do better than a pro-cyclical basket. The Bank of England delivered significant stimulus this week. As we argue below, EUR/GBP remains a sell, but we will wait to buy sterling at 1.25. Look to rebuy a basket of Scandinavian currencies versus the USD and EUR at a trailing trigger point of -2%. New trade idea: Go long EUR/CHF. Feature The US election outcome has taken many investors by surprise. Going into election night, former Vice President Joe Biden was widely expected to win in a “blue wave.” This implied that the former Vice President wins the White House while Democrats gain control of the Senate and retain the House. This was not the BCA view. What has become evident is that similar to 2016, the polls have been offside. What we now know is that Republicans will likely keep control of the Senate. In short, the real prospect of a contested election and/or political gridlock in Washington is coming to fruition. President Donald Trump has been telegraphing that he views the results as fraudulent, triggered by some news agencies calling Arizona a Democratic win on Wednesday before all votes were counted. Some legal action is now becoming a real possibility, with Trump threatening to take matters to the Supreme Court and already filing lawsuits contesting the results in Michigan, Georgia and Pennsylvania. Democratic legal teams are surely preparing for retaliation. Cleaner risk-on/risk-off currency measures such as the AUD/JPY exchange rate were tracking 10-year Treasury yields tick-for-tick. The dollar price action has been consistent with our forecast of additional volatility, with wild swings in both the AUD/JPY exchange rate and the Chinese RMB. However, the direction of the DXY has been surprising, simply on the basis that the dollar is seasonally strong in November and, since the Great Financial crisis, the dollar has tended to rally into year-end (Chart I-1). In fact, given the political “certainty” going into elections, one would have expected the dollar to soar on Wednesday on a safe-haven bid. Chart I-1The Dollar Move This Week Was Unusual
The Dollar Move This Week Was Unusual
The Dollar Move This Week Was Unusual
Chart I-2The Market Made A Shift
The Dollar Conundrum And Protection
The Dollar Conundrum And Protection
Cleaner risk-on/risk-off currency measures such as the AUD/JPY exchange rate were tracking 10-year Treasury yields tick-for-tick, consistent with a safe-haven bid, as the election was becoming uncertain. Once it became clear that fiscal gridlock would be a reality, the market focus shifted from fiscal policy to the prospect that the Federal Reserve is likely to deliver additional stimulus (Chart I-2). US real rates have fallen relative to its trading partners. This is also consistent with the surge in technology equities and positive market action. In a recent piece, we also argued that historically, the dollar has not really benefitted from uncertainty when the US is the source of political risk (Chart I-3). We had been, however, cautioning investors against other tail risks that we expect to continue to dominate the FX market narrative: Brexit and the new wave of Covid-19 infections.1 As such, even as the US election uncertainty gets resolved, markets remain vulnerable, and the dollar could still benefit from safe-haven flows. As we have argued, it will be a countertrend bounce rather than a renewed bull market. Chart I-3US Policy Uncertainty And The Dollar
US Policy Uncertainty And The Dollar
US Policy Uncertainty And The Dollar
An Election “Post-Mortem” It is impossible to tell for sure when we will know the definitive election results, as the political theater is likely to continue in the coming days. What is clear is that the polls were widely offside in this election (Chart I-4). Chart I-4The Polls Were Offside
The Dollar Conundrum And Protection
The Dollar Conundrum And Protection
Nevada will continue to accept ballots until November 10 and North Carolina until November 12 if they are postmarked by election day. A decision will have to be made in Pennsylvania, where Trump is still ahead in the polls, if ballots received after November 3 will be valid. As our geopolitical strategists argue,2 it would not be surprising if the Supreme Court ruled that ballots received after election day cannot be accepted, as the original deadline was changed to November 6 by a lower court decision. The two likely outcomes as we go to press are a GOP Senate and Democratic House, with either Biden or Trump in the White House. Betting markets are pricing in the former outcome. Our contention is that both are neutral-to-dollar bullish. Chart I-5The Dollar And Real Yields
The Dollar And Real Yields
The Dollar And Real Yields
Democratic leaders have been more aggressive in their demands for a greater government role in the economy. What is clear is that Senate Republicans will block very aggressive stimulus, but will still agree to some spending. However, smaller stimulus may be offset by policies favorable for markets, such as lower taxes3 and lower regulation, remaining in place. This is a bullish outcome for the dollar since on the one hand, US equities continue to enjoy a higher rate of return, and on the other hand, real bond yields are likely to be higher with less-than-expected fiscal stimulus. Should Trump win the White House, the biggest risk down the road is a renewed trade war, not only with China but even with Europe. This was evident in RMB overnight trading, as Trump started to positively surprise in the polls with Florida. Economically, a trade war will lift the price of foreign goods and services. Foreign currencies should depreciate, as demand for their goods adjusts lower to a higher tariff. This will boost the dollar. That said, it is possible that market focus has rapidly shifted from the government to the Fed. For one, foreign policy is unlikely to be the focus in the near term, given the immediate need for fiscal stimulus and a pandemic. Meanwhile, US real rates have been falling relative to its trading partners this week (Chart I-5). Ten-year TIPS yields have also declined relative to similar real rates in Germany or the UK. In short, the bond market may be pricing in that the Fed will offset any decline in inflation expectations by more stimulus later. For now, they remain on hold. The Real Risk To Dollar Short Positions What is becoming clear to market participants is that the US Treasury market continues to maintain its safe-haven properties. This was evident both in the March drawdown and in recent trading sessions. So, the big risk to dollar short positions is economic uncertainty that drives inflows into the US dollar. Chart I-6Japan Has Been Buying Treasurys
Japan Has Been Buying Treasurys
Japan Has Been Buying Treasurys
Chart I-7Capital Outflows From Japan
Capital Outflows From Japan
Capital Outflows From Japan
Chart I-6 shows that Japanese investors and officials have remained very active buyers of US Treasurys, despite real rates being higher in Japan. This partly explains why the yen has not been a particularly potent safe haven compared to the dollar this year. In a nutshell, the huge pool of Japanese external assets has not been repatriated home during times of market stress. Japan is the biggest holder of US Treasurys in the world, and looking at portfolio investment, it remains deeply negative in 2020. In short, income receipts have been rapidly re-invested abroad (Chart I-7). Japanese investors and officials have remained very active buyers of US Treasurys, despite real rates being higher in Japan. Overall, the Japanese yen still remains a safe-haven asset. The yen did outperform from the September drawdown in markets, and has proven to be a better hedge than the Swiss franc or the US dollar over the longer term (Chart I-8). Chart I-8The Yen Remains The Perfect Hedge
The Yen Remains The Perfect Hedge
The Yen Remains The Perfect Hedge
Chart I-9An Explosion In Covid-19 Cases
An Explosion In Covid-19 Cases
An Explosion In Covid-19 Cases
The need for a portfolio hedge is particularly important, since the US presidential elections are not the only source of uncertainty. As we approach the winter season in the northern hemisphere, a new wave of infections is taking hold. Norway and Switzerland, small countries that were able to manage infection rates over the summer, are seeing a resurgence in cases. Even Sweden, where infection rates had dropped significantly, is going through a very severe second wave (Chart I-9). In the case of Sweden, this is seriously questioning the theory of “herd immunity,” since the economy never really shut down. The key variable for the dollar will be global and relative growth. For much of the summer months, the US was under siege from a second wave while the Eurozone and many other countries were well into their reopening phases. Now the reverse is happening, where the reacceleration in cases is somewhat faster outside the US, triggering temporary lockdowns. If this threatens the improvement in relative economic growth between G10 economies and the US, this could catalyze a dollar rally (Chart I-10). Chart I-10The Dollar And Relative Growth
The Dollar And Relative Growth
The Dollar And Relative Growth
Our longer-term bias remains that the potential economic impact from Covid-19 is likely to be much less than what many economies endured for the first half of 2020. The virus is less deadly, as mortality rates across many countries have come down, and there is a potential for a vaccine soon. As global economies recover, the dollar will decline, with portfolio rotation into cheaper markets. That may be the story for 2021. As we argued last week, the market remains due for a reset in the short term, which should benefit the dollar. The BoE, Brexit And The Case For The Pound As both the pandemic and US election risks remain at the fore of investors’ concerns, Brexit uncertainty continues to brew in the background. UK Prime Minister Boris Johnson has been forced to relock the economy as the number of new cases surge. At the same time, negotiations between the EU and the UK continue in their stop-and-go pattern. Both sides failed to reach an agreement this week, and talks should resume on Sunday or Monday. More importantly, key issues such as the treatment of Northern Ireland remain unresolved, with political bickering over other concerns such as fishing access rights, “level playing field” conditions for businesses and energy cooperation. The Bank of England decided today to front-run the impending economic slowdown by aggressively increasing its target for government bond purchases by £150 billion to £875 billion. This was bigger than expected. The target for corporate bond purchases stays at £20 billion. This will balloon the BoE’s balance sheet to over 40% of GDP. This will be at par with the Fed, but still lower than the European Central Bank or the Bank of Japan. With lower estimates for Q3 GDP growth and a double-dip recession baked in the cake for Q4, additional stimulus was warranted. The BoE also expects UK GDP to only return to pre-pandemic levels in 2022, rather than 2021. The reaction in the gilt market was muted, with rates back to yesterday’s levels, and the pound was slightly up on broad-based dollar weakness. Such action is warranted, given the already very low levels of UK interest rates, especially relative to the US. And with the Fed effectively signaling unlimited quantitative easing, the efficacy of other central bank actions on relative monetary policy trends has dramatically fallen. We saw the same reaction from the Aussie dollar earlier this week, even though the Reserve Bank of Australia cut interest rates and expanded its QE program. The UK budget deficit has tended to move in lockstep with central bank purchases. Domestically, the shift by the BoE was important. The UK budget deficit has tended to move in lockstep with central bank purchases (Chart I-11). When domestic demand is low, the right policy is for government to step in and prevent a negative feedback loop of falling prices, rising real rates and higher savings. We, therefore, commend the Chancellor of the Exchequer, Rishi Sunak's, push to extend the furlough scheme and relief to businesses until the end of next March. This should cushion the blow from the lockdown on the economy. The important takeaway is that the BoE’s QE program opens the door for more fiscal stimulus, since the government can issue debt that will be purchased by the central bank. And given the UK borrows in its own currency, this is not a threat to the pound, especially given extremely low financing costs (Chart I-12) and the lack of inflationary pressures in the UK. In fact, this is a key distinction from the prior warfare episodes, where soaring deficits were met with higher inflation that pushed up interest rates and triggered massive devaluations in the currency. Today, the problem is deficient rather than excess demand. Chart I-11UK Debt And Central Bank QE
UK Debt And Central Bank QE
UK Debt And Central Bank QE
Chart I-12Cheap Debt Financing Costs
Cheap Debt Financing Costs
Cheap Debt Financing Costs
The key risk for the pound, therefore, remains a “no-deal” Brexit. This possibility is probably higher with a Trump presidency, since former Vice President Joe Biden has opposed Brexit. This limits the potential for a favorable trade deal with the US, should Democrats gain control of the White House. On the positive side, we have noted before that the pound is in an “ugly contest” with all fiat currencies. For example, even though speculators are short the pound today, positioning is much less extreme than in 2016 or 2019, when the Brexit referendum and the election of Prime Minister Johnson led to “maximum pessimism” on cable. Moreover, the pound is cheap. The cheapness of a currency can be measured by the trade balance, since a cheap currency will stimulate exports while imports will be relatively expensive. On this metric, the UK trade balance has violently swung to near balance (Chart I-13). Chart I-13The UK Trade Balance Is Improving
The UK Trade Balance Is Improving
The UK Trade Balance Is Improving
As a strategy, we are short EUR/GBP for now as a play on cable strength. Interest rates still favor the UK relative to Germany or France, and the dollar could receive a bid over the next one-to-three months, as we have argued above. We also have a limit-buy on GBP/USD at 1.25. In terms of targets, cable will be between 1.35-1.40 over the next six months. In an optimistic scenario, the pound could go 20-25% higher. Concluding Thoughts We continue to advocate for a prudent strategy when trading foreign exchange markets over the next few weeks: Hold some portfolio protection. Our preferred vehicle is the Japanese yen, as argued above. Longer-term, as the dollar declines, the Chinese yuan will benefit. The Chinese bond market could be becoming the safe-haven in Asia. A basket of Chinese bonds and silver has provided less volatility than procyclical currencies (Chart I-14). Focus on trades at the crosses. An interesting divergence has opened between EUR/CHF and EUR/USD. Either the euro is too high or the franc is too high (Chart I-15). Given more pervasive deflation in Switzerland, our bias is the latter. Go long EUR/CHF for a trade. Buy Scandinavian currencies if they drop another 2% versus an equal weighted basket of the euro and USD. Go short the gold/silver ratio at 80. Chart I-14An Alternative To US Treasurys
An Alternative To US Treasurys
An Alternative To US Treasurys
Chart I-15Buy EUR/CHF
Buy EUR/CHF
Buy EUR/CHF
Chester Ntonifor Foreign Exchange Strategist chestern@bcaresearch.com Footnotes 1 Please see Foreign Exchange Strategy Weekly Report, "Tail Risks In FX Markets," dated October 2, 2020. 2 Please see Geopolitical Strategy Special Report, "Gridlock," dated November 4, 2020. 3 Our Chief Strategist, Peter Berezin, argues that the Trump tax cuts could become permanent. Currencies U.S. Dollar Chart II-1USD Technicals 1
USD Technicals 1
USD Technicals 1
Chart II-2USD Technicals 2
USD Technicals 2
USD Technicals 2
Recent data from the US have been mostly positive: The ISM Manufacturing PMI increased from 55.4 to 59.3 in October, while the ISM Services PMI declined from 57.8 to 56.6. Headline PCE increased by 1.4% year-on-year in September. Nonfarm productivity increased by 4.9% quarter-on-quarter in Q3. Initial jobless claims increased by 751K for the week ending on October 30. The DXY index fell by 1.5% this week. The Fed stood on hold as widely expected, but the dollar still witnessed tremendous volatility this week. While we believe that the US dollar will depreciate in the long term, especially in the post-COVID world, we do see near-term volatilities amid the election and rising COVID numbers. Report Links: The Dollar In A Market Reset - October 30, 2020 A Few Market Observations - October 23, 2020 Does The US Save Too Much Or Too Little? - October 16, 2020 The Euro Chart II-3EUR Technicals 1
EUR Technicals 1
EUR Technicals 1
Chart II-4EUR Technicals 2
EUR Technicals 2
EUR Technicals 2
Recent data from the euro area have been positive: GDP recovered by 12.7% quarter-on-quarter in Q3, well above the 9.4% expansion as expected. Headline inflation was unchanged at -0.3% year-on-year in Q3. Core inflation was also unchanged at 0.2% year-on-year. The unemployment rate was unchanged at 8.3% in September. PPI fell by 2.4% year-on-year in September. Retail sales increased by 2.2% year-on-year in September. The euro increased by 0.7% against the US dollar this week. Rising COVID cases in Europe and re-implemented lockdown measures continue to spur worries for the recovery. In a speech on Wednesday, ECB Board Member Isabel Schnabel said that further monetary policy support is required to safeguard favorable financial conditions and underpin economic activity. Report Links: Addressing Client Questions - September 4, 2020 On The DXY Breakout, Euro, And Swiss Franc - February 21, 2020 Updating Our Balance Of Payments Monitor - November 29, 2019 Japanese Yen Chart II-5JPY Technicals 1
JPY Technicals 1
JPY Technicals 1
Chart II-6JPY Technicals 2
JPY Technicals 2
JPY Technicals 2
Recent data in Japan have been mostly negative: Construction orders fell by 10.6% year-on-year in September. Housing starts dropped by 9.9% year-on-year in September. The Jibun Bank Services PMI increased from 46.9 to 47.7 in October. The Japanese yen appreciated by 1% against the US dollar this week amid market volatilities. The BoJ meeting minutes released this week showed divergences among BoJ members. While most members agree that maintaining the existing monetary policy should be sufficient in current conditions, other members mentioned it would be necessary to reconsider the strategy towards achieving price targets. Report Links: The Near-Term Bull Case For The Dollar - February 28, 2020 Building A Protector Currency Portfolio - February 7, 2020 Currency Market Signals From Gold, Equities And Flows - January 31, 2020 British Pound Chart II-7GBP Technicals 1
GBP Technicals 1
GBP Technicals 1
Chart II-8GBP Technicals 2
GBP Technicals 2
GBP Technicals 2
Recent data from the UK have been positive: Nationwide housing prices increased by 5.8% year-on-year in October. The British pound increased by 0.8% against the US dollar this week. On Thursday, the BoE kept key interest rates unchanged at 0.1%. However, the Bank increased its bond-buying program by another £150 billion, much larger than expected, bringing the total amount to £895 billion. The increased stimulus plan will help weather further deterioration as the crisis continues to strike the UK’s services sector. Report Links: Revisiting Our High-Conviction Trades - September 11, 2020 Updating Our Balance Of Payments Monitor - November 29, 2019 A Few Trade Ideas - Sept. 27, 2019 Australian Dollar Chart II-9AUD Technicals 1
AUD Technicals 1
AUD Technicals 1
Chart II-10AUD Technicals 2
AUD Technicals 2
AUD Technicals 2
Recent data from Australia have been positive: Building permits increased by 8.8% year-on-year in September. Exports continued to grow by 3.9% month-on-month in September, while imports fell by 5.9% month-on-month. The trade balance jumped to A$5.6 billion in September from A$2.6 billion in the previous month. The Australian dollar surged by nearly 3% against the US dollar this week. The RBA lowered its interest rate from 0.25% to 0.1% this week to provide further support for job creation and economic recovery. Moreover, the Bank will increase the size of its QE program by purchasing A$100 billion of government bonds over the next six months. Accommodative policies, lower COVID cases and elevated current account surplus all underpin the Aussie dollar. Report Links: An Update On The Australian Dollar - September 18, 2020 On AUD And CNY - January 17, 2020 Updating Our Balance Of Payments Monitor - November 29, 2019 New Zealand Dollar Chart II-11NZD Technicals 1
NZD Technicals 1
NZD Technicals 1
Chart II-12NZD Technicals 2
NZD Technicals 2
NZD Technicals 2
Recent data from New Zealand have been mixed: Building permits increased by 3.6% month-on-month in September. The participation rate marginally increased from 69.9% to 70.1% in Q3, while the unemployment rate ticked up from 4% to 5.3% in Q3. The ANZ Activity Outlook Index was little changed at 4.6% in November. The New Zealand dollar increased by 1.5% against the US dollar this week. The latest ANZ Business Outlook report showed that New Zealand’s business outlook data remained stable. Investment intentions dropped, while employment intentions increased. Following the RBA’s action this week, the RBNZ is likely to carry out more stimulus in its policy meeting next week. Report Links: Currencies And The Value-Versus-Growth Debate - July 10, 2020 Updating Our Balance Of Payments Monitor - November 29, 2019 Place A Limit Sell On DXY At 100 - November 15, 2019 Canadian Dollar Chart II-13CAD Technicals 1
CAD Technicals 1
CAD Technicals 1
Chart II-14CAD Technicals 2
CAD Technicals 2
CAD Technicals 2
Recent data from Canada have been positive: GDP increased by 1.2% month-on-month in August. Exports marginally increased from C$44.9 billion to C$45.5 billion in September, led by higher exports of lumber and aircraft. Imports also slightly increased from C$48.1 billion to C$48.8 billion, mainly on higher crude oil imports. The Canadian dollar increased by 2.4% against the US dollar this week. On a quarter-on-quarter basis, Canada’s exports were up 26.9% in the third quarter, showing a strong recovery over the summer. However, it’s still down 7.5% compared with the same quarter last year. Report Links: Currencies And The Value-Versus-Growth Debate - July 10, 2020 More On Competitive Devaluations, The CAD And The SEK - May 1, 2020 A New Paradigm For Petrocurrencies - April 10, 2020 Swiss Franc Chart II-15CHF Technicals 1
CHF Technicals 1
CHF Technicals 1
Chart II-16CHF Technicals 2
CHF Technicals 2
CHF Technicals 2
Recent data from Switzerland have been mostly positive: Real retail sales increased by 0.3% year-on-year in September. The KOF Leading Indicator declined from 110.1 to 106.6 in October. Headline inflation increased from -0.8% to -0.6% year-on-year in October. The Swiss franc appreciated by 1.2% against the US dollar this week. The recent SECO survey showed no further recovery of consumer sentiment since the summer. As downside risks continue to loom, the SNB is likely to fight appreciation in the franc. Go long EUR/CHF as trade. Report Links: On The DXY Breakout, Euro, And Swiss Franc - February 21, 2020 Currency Market Signals From Gold, Equities And Flows - January 31, 2020 Portfolio Tweaks Before The Chinese New Year - January 24, 2020 Norwegian Krone Chart II-17NOK Technicals 1
NOK Technicals 1
NOK Technicals 1
Chart II-18NOK Technicals 2
NOK Technicals 2
NOK Technicals 2
There have been no significant data from Norway this week. The Norwegian krone soared by 4% this week, recouping the recent loss. On Thursday, the Norges Bank kept its key interest rate on hold at a record low 0%, as expected, and said that they would maintain policy accommodative until they see clear signs of a recovery. Report Links: Revisiting Our High-Conviction Trades - September 11, 2020 A New Paradigm For Petrocurrencies - April 10, 2020 Building A Protector Currency Portfolio - February 7, 2020 Swedish Krona Chart II-19SEK Technicals 1
SEK Technicals 1
SEK Technicals 1
Chart II-20SEK Technicals 2
SEK Technicals 2
SEK Technicals 2
Recent data from Sweden have been mixed: Manufacturing PMI increased from 55.9 to 58.2 in October. Industrial production declined by 2.6% year-on-year in September. Manufacturing new orders fell by 0.3% year-on-year in September. The Swedish krona increased by 2.8% against the US dollar this week. Statistics Sweden showed that GDP increased by 4.3% quarter-on-quarter in the third quarter in 2020, following an 8% drop in the second quarter. Exports and imports have recovered close to pre-pandemic levels. The labor market has also shown strength. The services industry, however, is still negatively affected by the crisis, although they make up a relatively smaller share in the GDP. Kelly Zhong Research Analyst Report Links: Revisiting Our High-Conviction Trades - September 11, 2020 Updating Our Balance Of Payments Monitor - November 29, 2019 Where To Next For The US Dollar? - June 7, 2019 Trades & Forecasts Forecast Summary Core Portfolio Tactical Trades Limit Orders Closed Trades