United States
The focus of financial markets in recent days has been squarely on the US election and its aftermath. But in the interim, the global pandemic continues to rage, and evidence of waning US labor market momentum continues to mount. In a previous Insight, we…
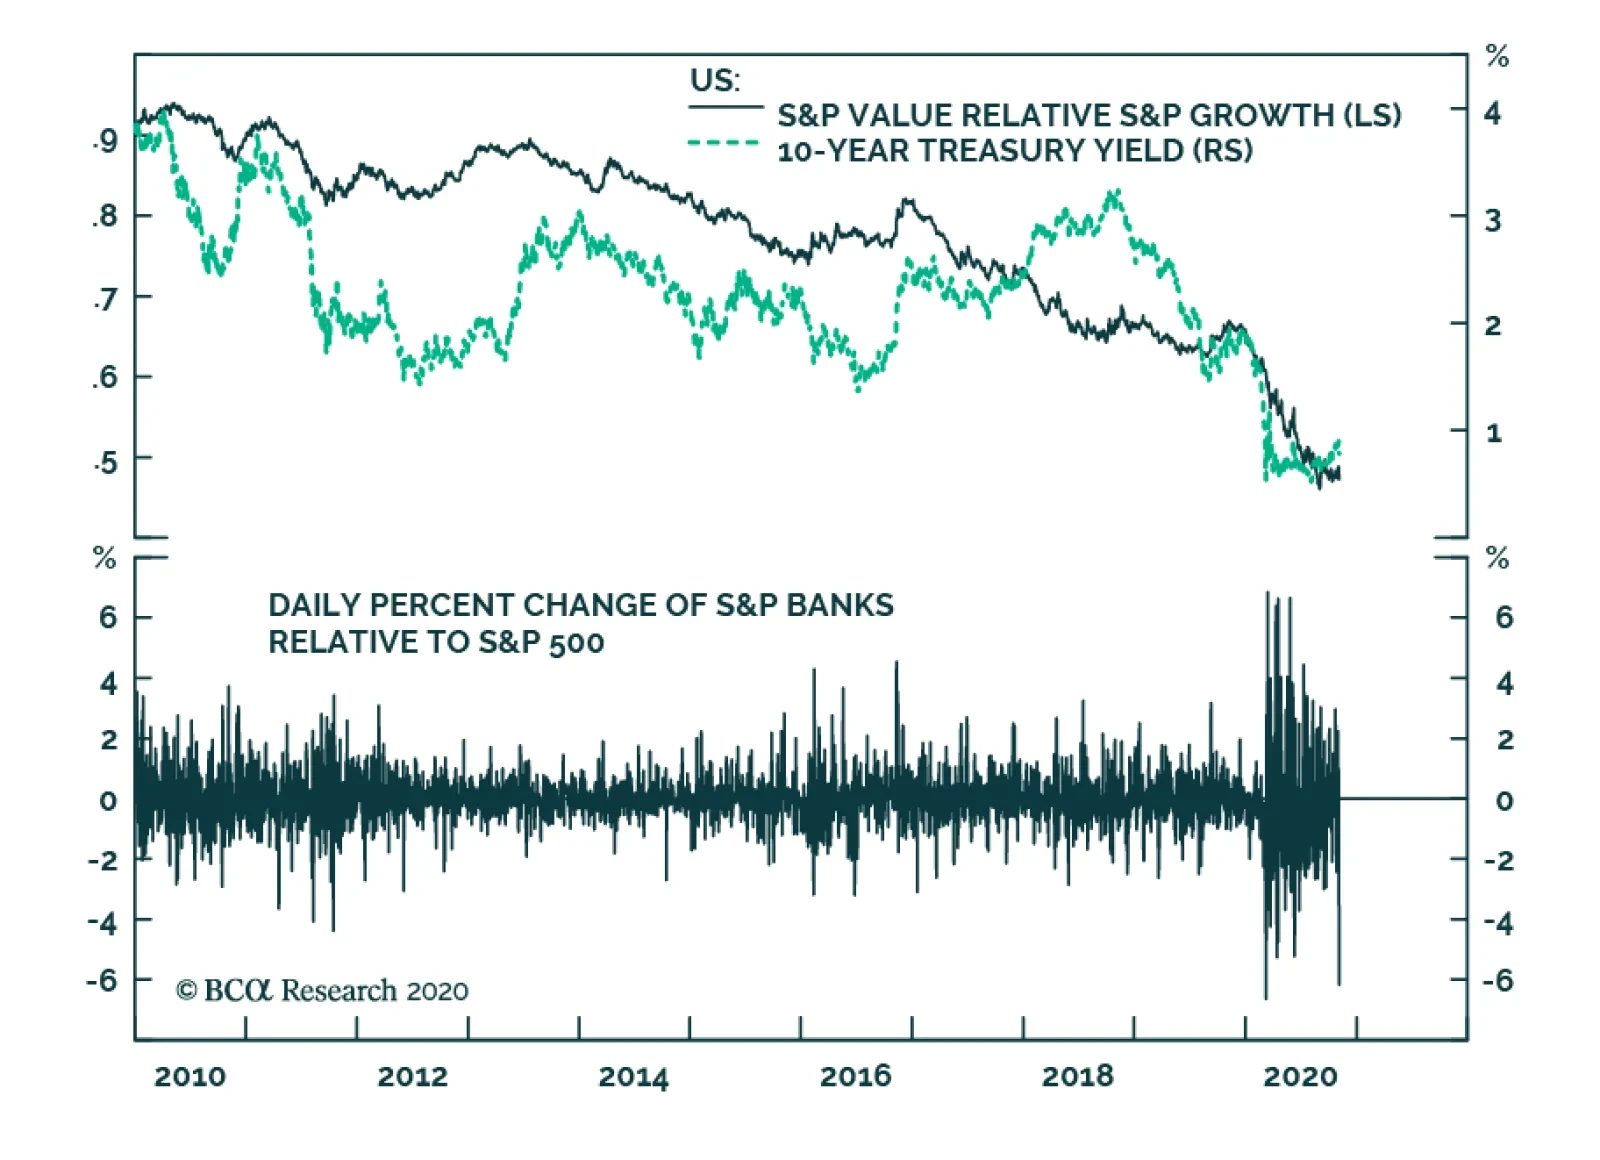
10-year Treasury yields declined significantly following Tuesday’s US election, peaking at 0.934% on Tuesday night and falling as low as 0.723% yesterday morning. The collapse in 10-year Treasury yields had knock-on effects for US banks, as banks have…

Dear client, Instead of our regular Daily Sector Insight, tomorrow we will be sending you our sister’s Geopolitical Strategy service Weekly Report with a post mortem on the US election. On Monday our regular service resumes with a Special Report on SPX earnings penned by my colleague Arseniy Urazov. Kind Regards, Anastasios
Stick With Cyclicals vs. Defensives
Stick With Cyclicals vs. Defensives
Today we reiterate our cyclicals over defensives portfolio bent that we instituted in late July. Not only is the slingshot recovery in the ISM manufacturing survey underpinning cyclicals at the expense of defensives (top panel), but also relative debt dynamics will further cement cyclicals’ reign over their defensive peers. The deep cyclicals (tech, industrials, materials and energy) net debt-to-EBITDA ratio has stabilized near 1.5x during the recession on the back of cash flow ails (second panel). In fact, cyclicals have been paying down net debt in absolute terms during the pandemic. In marked contrast, the defensives (health care, consumer staples, utilities and telecom services) net debt-to-EBITDA ratio is hovering near 3x, as these debt saddled sectors have not been able to pay down net debt. Not only is net debt roughly $2tn (bottom panel), but it also comprises 50% of the broad market’s net debt at a time when their market cap weight is close to 30%. Taken together, the relative debt profile clearly favors cyclicals at the expense of defensives. Bottom Line: We continue to recommend a cyclicals versus defensives portfolio bent. For more details, please refer to this Monday’s Weekly Report.
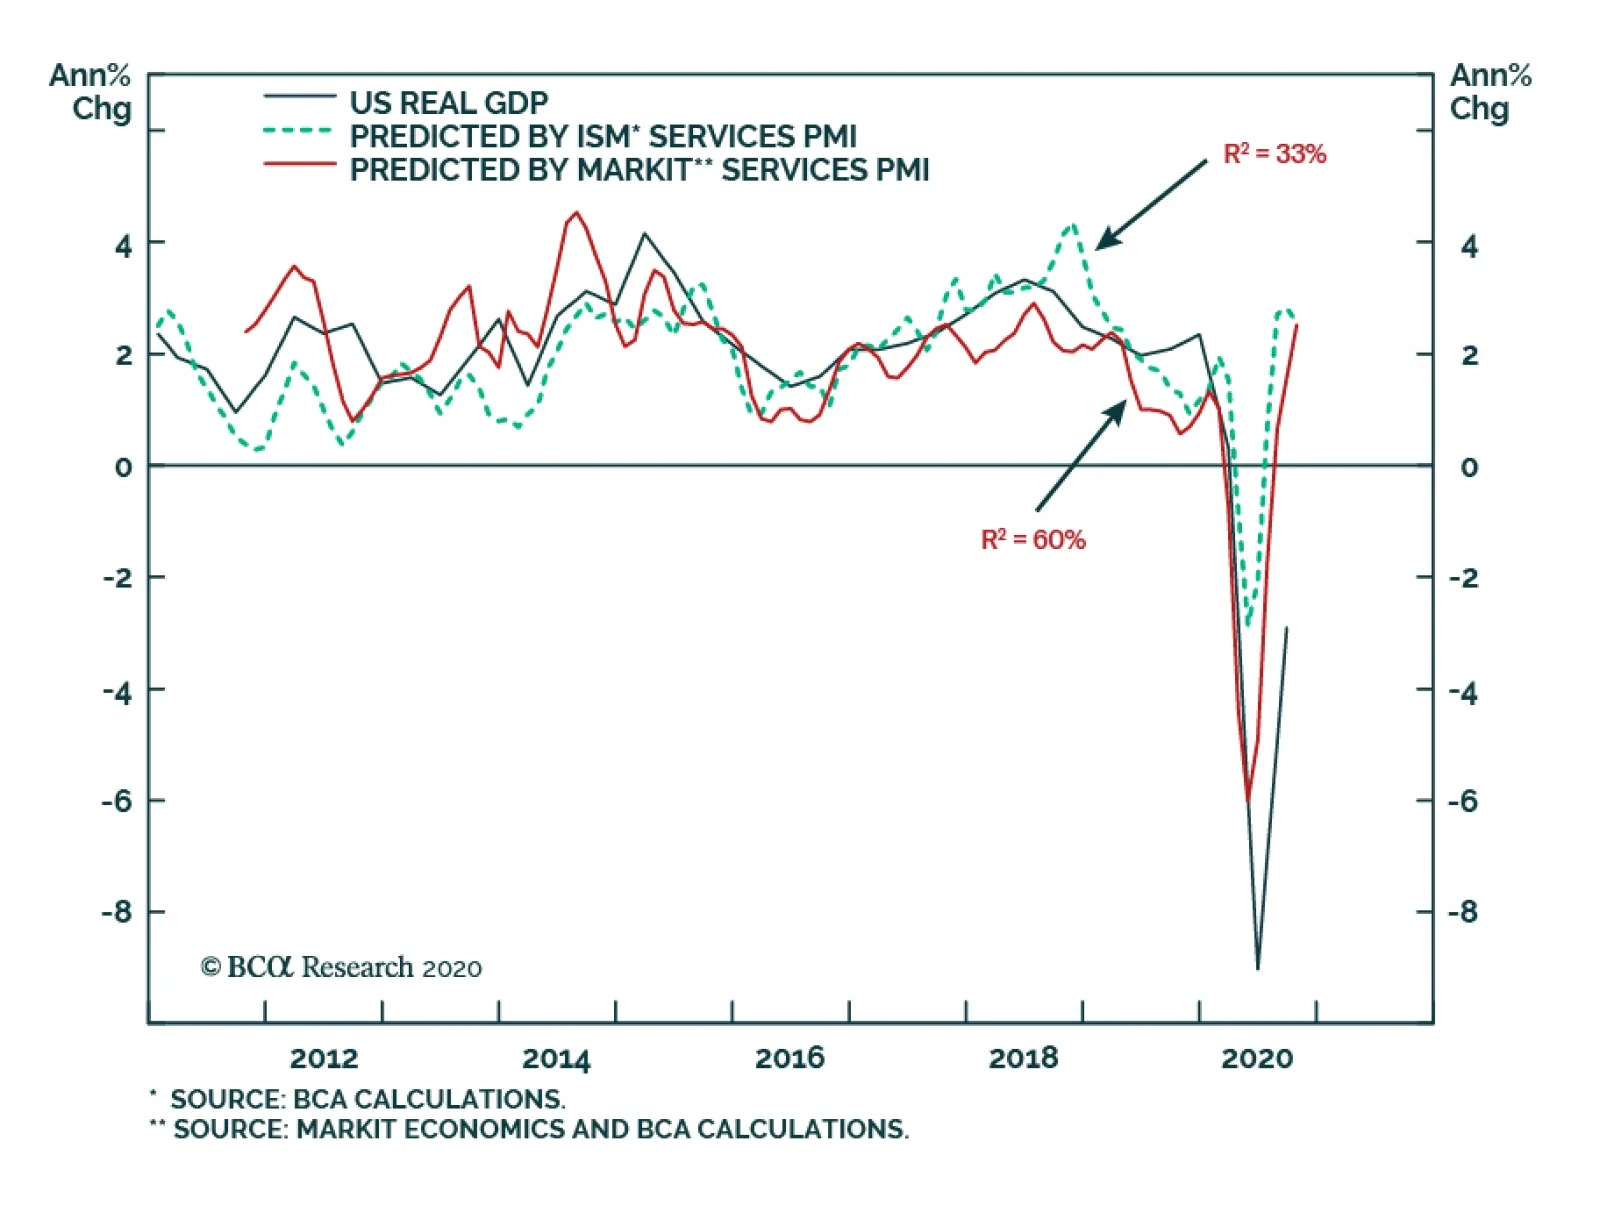
As discussed in the previous Insight, the October ISM Services PMI fell, but the Markit US Services PMI rose. Which index should investors trust, and what is the implication for US economic growth? The chart above shows the predicted value for US real GDP…
As we go to press, the outcome of the US presidential election remains unresolved. BCA Research's Geopolitical Strategy service's base case of a Biden win combined with a GOP Senate may come to pass, and was the most probable scenario according to prediction…
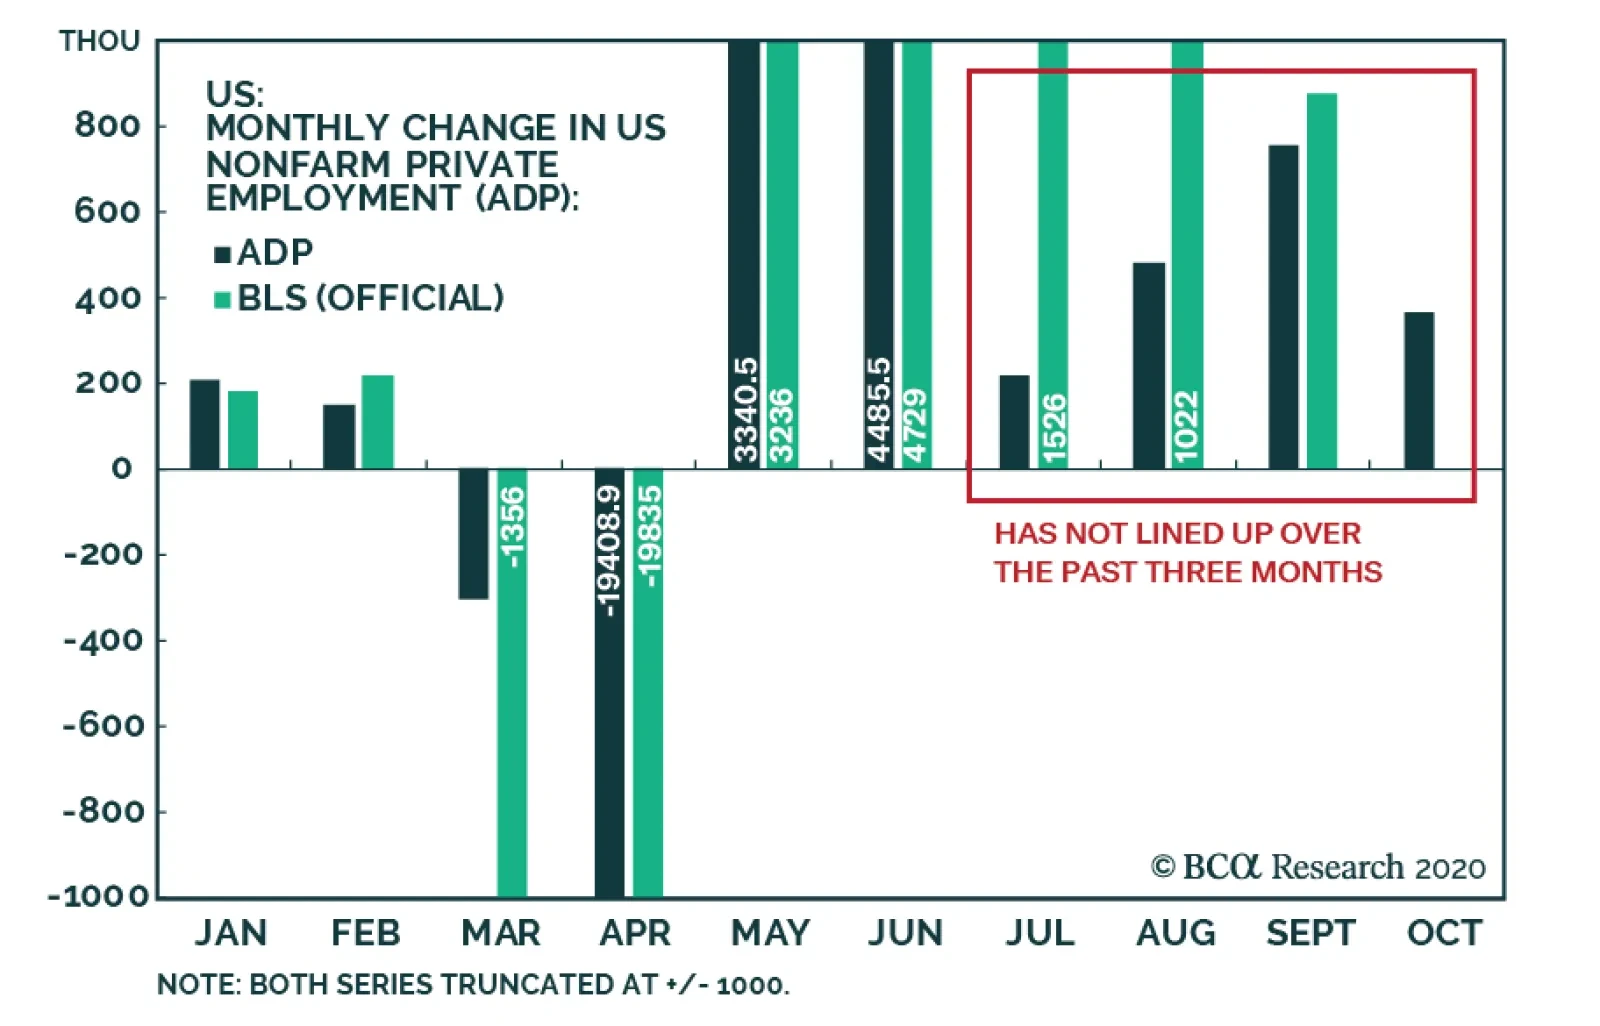
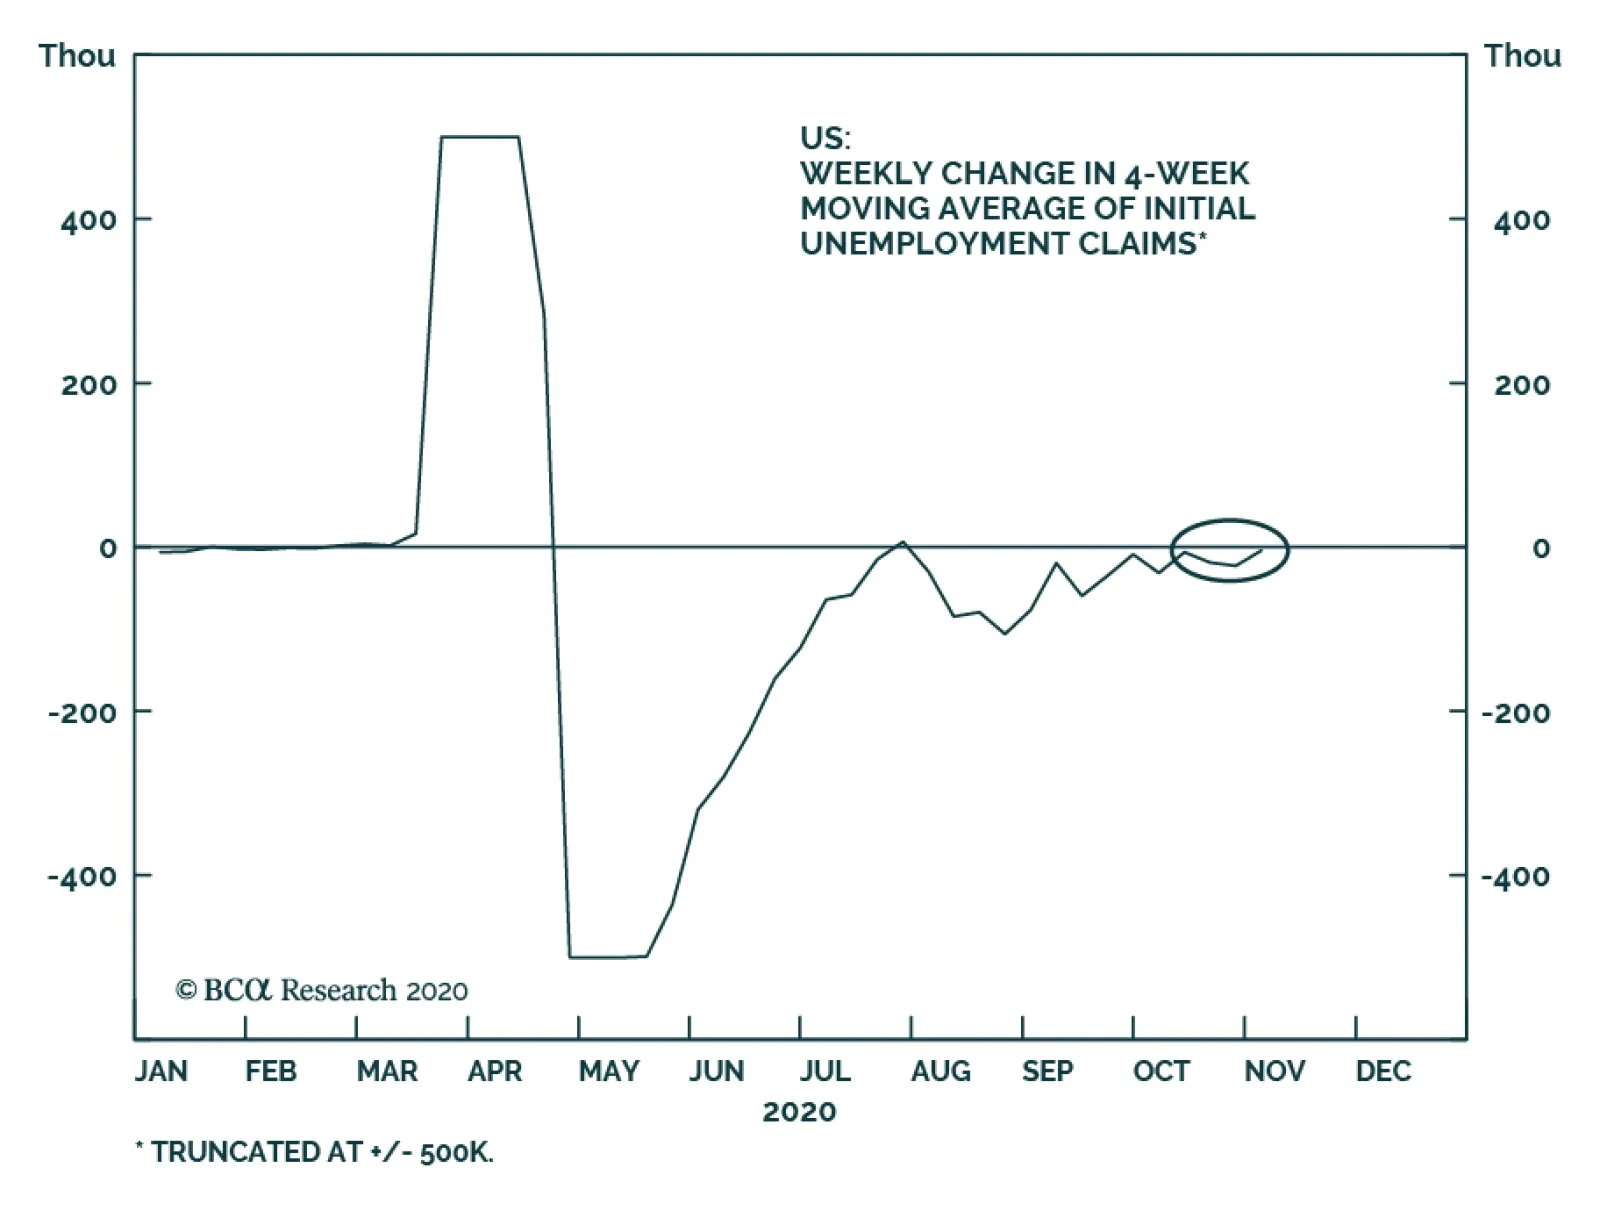
Yesterday’s ADP national employment report suggested that US nonfarm private sector employment grew by 365,000 jobs in October. Separately, the October ISM Services PMI fell by more than expected, from 57.8 in September to 57.5 in October. The employment…

Highlights Our base case of a Biden win with a GOP Senate may come to pass. But the US election is not over yet. Trump still has a chance of victory by winning Pennsylvania and one other state. If the vote count does not settle the outcome clearly this week, a full-fledged contested election will emerge that may not be settled until just before December 14 (or even January). Risk-off sentiment will prevail in the interim, given the importance of the executive-legislative configuration for the pandemic response and the fiscal policy outlook. What we know is that Republicans kept the Senate, in line with our final forecast last week. This means gridlock is assured – which is positive for US stocks beyond near-term fiscal risks. Stay long JPY-USD, short CNY-USD, long stocks over bonds, long health care equipment, and long infrastructure plays. Keep dry powder for the presidential outcome, as global trade hangs in the balance. Feature The US presidential election is unsettled as we go to press, but we know that Republicans will keep control of the Senate and hence that American government will be divided or “gridlocked” for the next two years. As things stand, Democrats picked up two senate seats, Arizona and Colorado, but fell short everywhere else. They may even have lost a seat in Michigan. This leaves the balance of power at ~52-48 in favor of Republicans – which is one seat better than our final 51-49 forecast in their favor (Chart 1).1 Chart 1Our Senate Election Model Correctly Predicted Republican Control
Gridlock
Gridlock
Table 1Gridlock Is Inevitable Regardless Of Presidential Outcome
Gridlock
Gridlock
Gridlock is the inevitable consequence. If President Trump pulls off a victory in any two of the upper Midwestern states (Michigan, Pennsylvania, Wisconsin), then he will still face a Democrat-controlled House of Representatives. If former Vice President Joe Biden pulls off a victory in two of these states, then he will face a Republican controlled Senate (Table 1). Chart 2Gridlock More Favorable Than Sweep For Wall Street, But Fiscal Risks Abound In Short Run
Gridlock More Favorable Than Sweep For Wall Street, But Fiscal Risks Abound In Short Run
Gridlock More Favorable Than Sweep For Wall Street, But Fiscal Risks Abound In Short Run
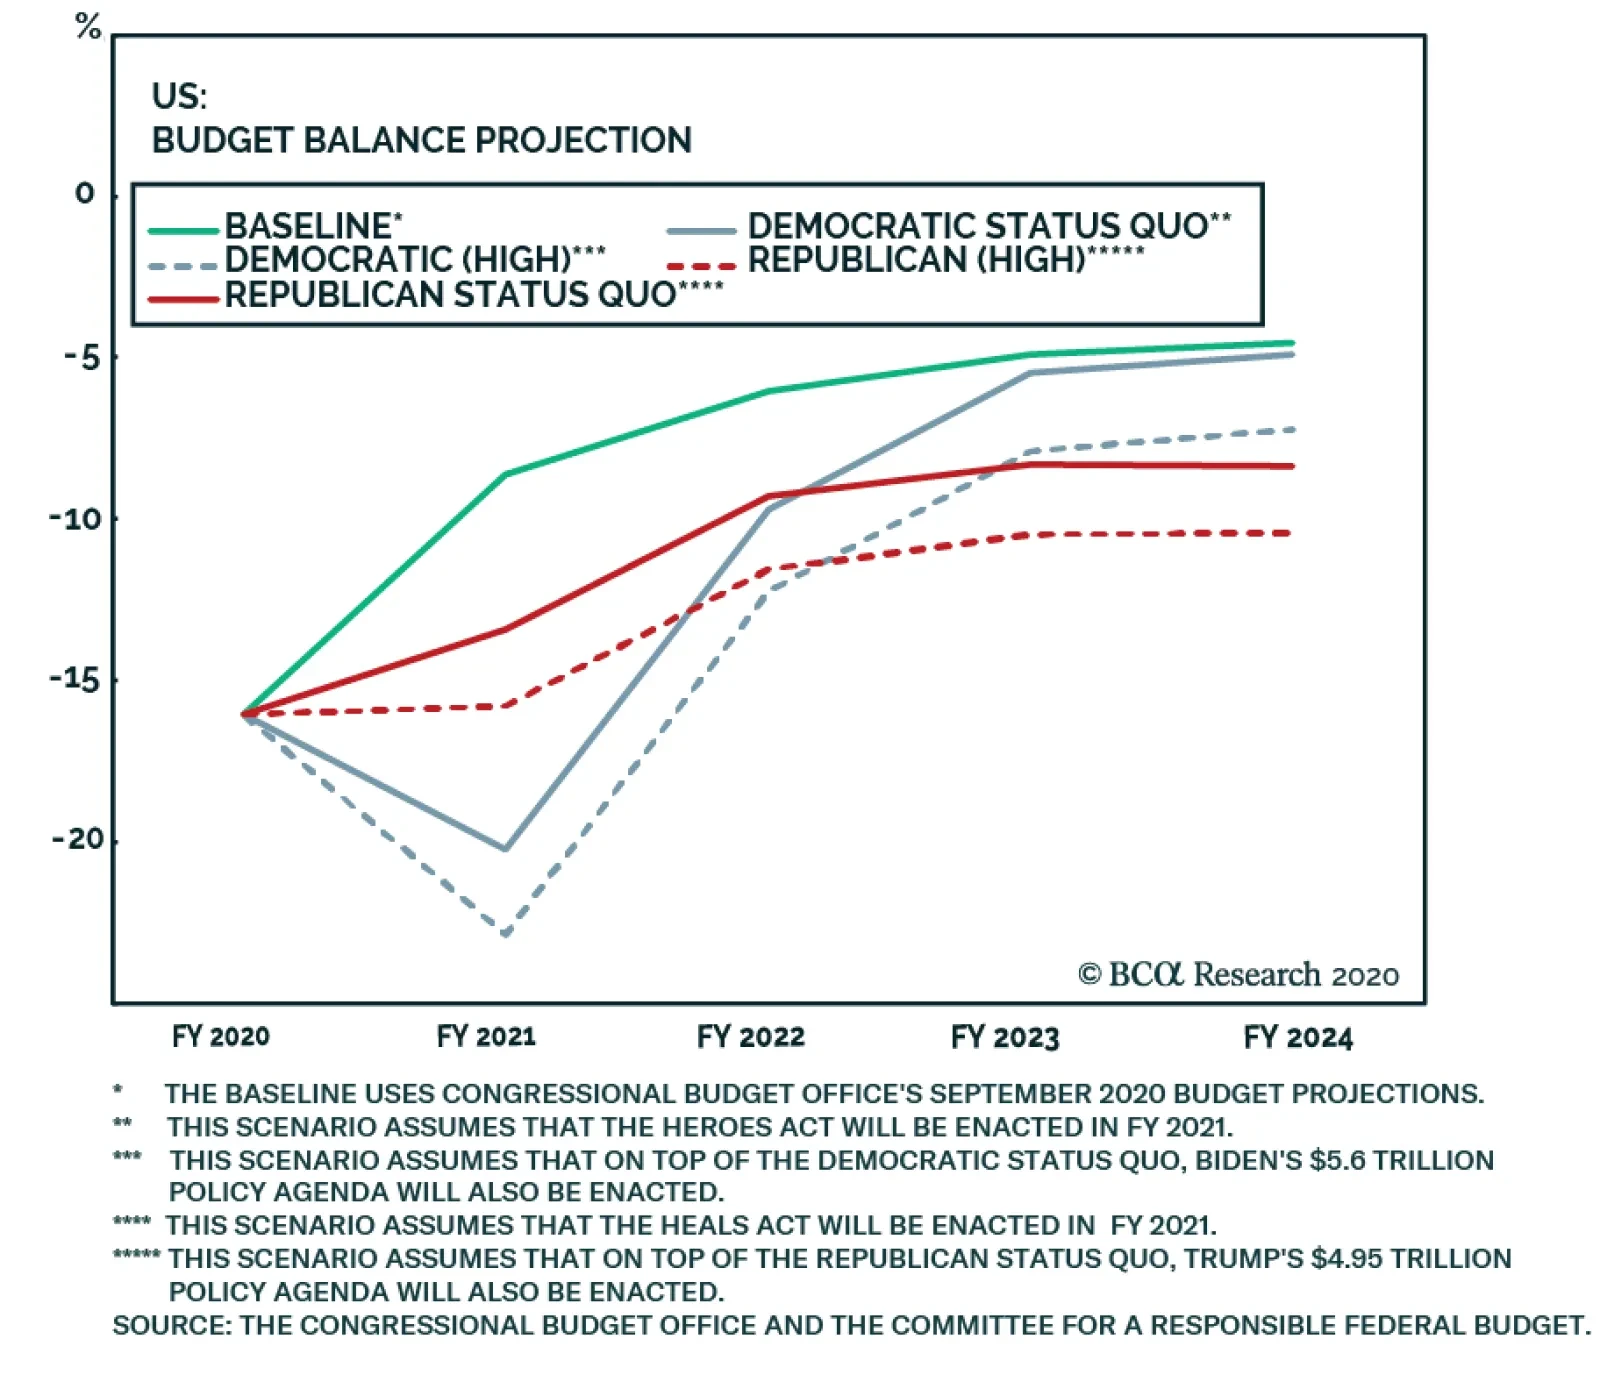
Historically gridlock offers more upside for the S&P 500 than a single-party sweep (Chart 2), and we agree with this expectation when it comes to the long-run impact of this election. However, we have also warned against the fiscal risks of a Biden win with a Republican Senate in the short run. The status quo Trump gridlock is reflationary at first but later problematic due to trade war. The Biden gridlock is deflationary at first but the best outcome for investors over the long run. Consider the following: Trump with Senate Republicans: Trump is a spendthrift and he and his party joined the House Democrats in blowing out the budget deficit from 2018-20. Trump’s victory will force House Speaker Nancy Pelosi to concede to a Republican-drafted ~$1-$1.5 trillion new COVID-19 fiscal relief bill right away. For the second term, Trump will push an infrastructure bill, border security, and make his tax cuts permanent. The fiscal thrust in 2021 will be flat-to-up. The budget deficit will probably end up somewhere between the Republican “high spending” scenario and the Democratic “low spending” scenario in our budget deficit projections (Chart 3). This is positive for US growth and especially corporate earnings, but it comes with a catch: Trump will be emboldened in his trade wars, which could expand beyond China to Europe or others. Tariffs and currency depreciation will weigh on global growth. Still, Trump’s second term will occur in the early stages of the business cycle and the Fed is committed not to hike rates until 2023, so the overall picture is reflationary. Chart 3Trump Gridlock Reflationary, Biden Gridlock Deflationary Over Short Run
Gridlock
Gridlock
Biden with Senate Republicans: Since Senate Republicans did not capitulate to large Democratic spending demands prior to the election, when their seats were at risk, they will have less incentive to do so afterwards when the president hails from the opposing party. The only way they will agree to a new fiscal stimulus in the “lame duck” session (November-December) is if the Democrats concede to their skinny proposals for the time being. But Democrats will probably insist on their demands having made electoral gains. In this case, either financial markets will sell off, forcing Republicans to capitulate, or investors will have to wait until early 2021 to receive a new fiscal bill that is uncertain in size and timing. The first battle of Biden’s presidency will be with the GOP Senate. The Republican “low spending” scenario in Chart 3 is most likely. It is not realistic that Congress will allow the baseline scenario, in which the budget deficit contracts by ~7.4% of GDP. Republican senators today are not the Tea Party House Republicans of 2010, who were rabid fiscal hawks. Still, uncertainty will weigh heavily and markets will have to fall before GOP senators wake up to the underlying risk to the economic recovery. The consolation is that beyond this 3-6 month period of negative sentiment and deflationary fiscal risk, the outlook will be fairly positive. Biden will not use broad-based unilateral tariffs the way Trump did, with the possible exception of China later in his term. And the Republican Senate will not agree to tax hikes at any point, making taxes a concern for 2023 or thereafter. This is the best of both worlds for US business sentiment and the corporate earnings outlook over the two-year period. Risk-off sentiment will prevail until the election is decided. This could be in a couple of days if the vote count is clear in Michigan, Pennsylvania, and Wisconsin. Or it could extend until just before December 14, when the Electoral College votes, if the litigation and court rulings in these critical states drag on, which we discuss below. The reason risk-off sentiment will prevail is that the US economy is burning through its remaining stimulus funds rapidly, the fiscal trajectory is unclear until the presidency is decided, Europe is going into partial lockdowns over the pandemic, and a Biden victory would imply more US lockdowns. Diagram 1 outlines the macro and market implications as we see them, depending on the presidential outcome. We never took the view that a Democratic sweep of White House and Senate would be the best outcome for the overall investment outlook, though we conceded that it was the most reflationary and bullish in the short term. But now this point is moot. Investors will have to wait another two years at minimum for the full smorgasbord of Democratic spending proposals to have a chance at passage. Diagram 1Gridlock Rules Out Massive Fiscal Boost
Gridlock
Gridlock
Bottom Line: The presidency is indeterminate as we go to press. What is clear is that Republicans retained the Senate. Therefore gridlock will prevail. This is generally market positive, though a Biden win would weigh on risk assets in the near term until financial markets force Republican senators to capitulate to a new fiscal bill. A Controversial Election Or A Contested Election? The critical battleground states are undecided as we go to press. Trump needs to win any two of Michigan, Pennsylvania, and Wisconsin to retain the White House. The vote count will last through Wednesday and possibly beyond. The Republican and Democratic legal teams are preparing for trench warfare. Major legal challenges are highly likely and will delay the final outcome into December or even January. The first thing is to finish counting the absentee and mail-in ballots. Georgia, Michigan, Wisconsin, and Arizona are not accepting ballots after election day, so they will finish counting soon. Then all that remains is to see if any legal disputes arise that prevent the Electoral College members from being settled in these states, which is still possible. For example, Wisconsin is within a percentage point. Nevada will accept ballots by November 10 and North Carolina by November 12 as long as they are postmarked by election day. It is likely but not certain that Democrats will keep Nevada (~75% counted) while Republicans will keep North Carolina (~100% counted). Thus Pennsylvania poses the biggest risk of a contested result – and this was anticipated. The deadline to receive mailed ballots is Friday, November 6, but a legal dispute is already underway as to whether the original November 3 deadline should be reinstated.2 We will not pretend to predict the final court verdict on Pennsylvania, but it would not be surprising at all if the Supreme Court ruled that ballots received after election day cannot be accepted. The constitution grants state legislatures the sole power of choosing a state’s electors. Each state passes its own election laws. The Pennsylvania state legislature clearly stated that ballots must be returned by election day. It was a court decision that extended the deadline. The Supreme Court could easily determine that a lower court does not have the power to change the deadline. But nobody will know until the court rules. The fact that Trump appointed several of the judges has little bearing on their decisions because they serve lifetime appointments. Once election disputes rise above state vote-counting to the federal level, Trump gets a lifeline. First, the two-seat conservative leaning on the Supreme Court should produce strict readings of the law that could favor his bid. Second, the GOP’s victory in the Senate means that Democrats cannot unilaterally settle disputed electoral votes in their own favor at the joint session of Congress on January 6, which they could have done with a united Congress. Third, the Republicans are likely to have maintained a one or two-state majority of state delegations in the House of Representatives (based on results as we go to press), which means that Trump would win if the candidates failed to reach a 270-vote majority on the Electoral College or tied at 269. Note that an Electoral College tie is a distinct possibility in this election. Right now, if Trump loses in Michigan and Wisconsin, but wins Pennsylvania, and nothing else changes, then an Electoral College tie could result at 269-269 electoral votes.3 Polls … And Exit Polls Before condemning the entire profession of opinion pollsters to death it will be important to receive the verified results of the election and compare them with the final polling averages. It is clear that Trump was widely underrated yet again, but it is not yet clear that this was primarily or exclusively the fault of pollsters. Right now Trump is down by 1.8% in the nationwide popular vote, whereas he lagged by 7.2% in the average of the national polls and 2.3% in the battleground average on election day. This is a big 5.4% gap in the national poll, but in the battleground poll it is a minor 0.5% polling gap and as such merely confirms what many observers knew, that the battleground polls were the ones that really mattered due to the Electoral College. Trump’s battleground support average was 46.6% and his approval rating was 45.9% on election day, which respectively is 1.8% and 2.5% below his tentative share of the national vote at 48.4%. These gaps are within the average 3% margin of error – and normally sitting presidents outperform their polling by around 1%. State opinion polling had huge errors like the national poll. Charts 4 and 4B shows the final election polling in the critical swing states along with a “T” or “B” to mark Trump’s and Biden’s tentative vote share as we go to press. Swing state polls showed Trump staging a major rally in the final weeks of the campaign, which is what prompted us to upgrade his odds to 45%. Neither major pundits nor the mainstream media paid enough attention to this shift. Several prominent outlets denied that there was any real tightening in the polls even in late October. Chart 4APundits Overlooked Trump’s Rally In Swing State Polls In Final Weeks
Pundits Overlooked Trump's Rally In Swing State Polls In Final Weeks
Pundits Overlooked Trump's Rally In Swing State Polls In Final Weeks
Chart 4BPundits Overlooked Trump’s Rally In Swing State Polls In Final Weeks
Pundits Overlooked Trump's Rally In Swing State Polls In Final Weeks
Pundits Overlooked Trump's Rally In Swing State Polls In Final Weeks
What this demonstrates to us is the power of momentum in opinion polling, especially in the final week before an election when people’s attitudes harden and they bare more of their true opinions. It does not tell us that opinion polling is dead. What about the exit polls? Biden cut into Trump’s lead in key demographic groups just as the Democratic Party machinery anticipated, but it is not clear if it was enough to win the election. Trump lost ground and Democrats gained ground, relative to 2016, with white voters, old folks, and non-college-educated voters. But Trump improved his support among blacks and Hispanics, a signal point that gives the lie to much of this year’s media hype (Charts 5A and 5B). Chart 5ADemocrats Gained Ground With White, Elderly, And Non-College-Educated Voters; GOP Gained Among Blacks And Hispanics
Gridlock
Gridlock
Chart 5BDemocrats Gained Ground With White, Elderly, And Non-College-Educated Voters; GOP Gained Among Blacks And Hispanics
Gridlock
Gridlock
By far voters cared most about the issues, not personalities, and the biggest issue was the economy (35% of voters versus 20% on racial inequality and 17% on the coronavirus, which was apparently overrated as an issue by Democrats). The economic focus is the only explanation for Trump’s outperformance – the law and order narrative was less popular. Trump’s vote share may end up exactly equal to the number of respondents who said the economy was “good” or “excellent” (48%). Otherwise Trump’s base is well known: it consists predominantly of white people, rural people, those in the Midwest and South, those who have been fairly successful in income, and those who think America needs a “strong leader” more than a unifier with good judgment who seems to care about the average person. If Trump is defeated, the clear implication is that he failed to expand his base. If he wins, the clear implication is that Democrats suffered in the key regions for their aggressive approach to COVID lockdowns, their condoning of lawlessness, and their divisive handling of racial inequality and police brutality. With such a close vote for the White House, sweeping narratives are questionable. It is not clear yet whether liberalism or nationalism won, and at any rate the margin was thin. What is clear is that Democrats substantially disappointed in the Senate and they might even have failed to gain the White House. Given that this year witnessed a recession, pandemic, and widespread social unrest – well-attested historical signs that point to the failure of the incumbent party and recession – Democrats apparently failed to capitalize. National exit polls suggest the fault lay in their relative neglect of bread and butter in favor of the coronavirus or left-wing social theory. This is true not so much in the House of Representatives but in the presidential and senate races. If Trump wins – especially through a contested election – then US political polarization will rise due to the continued divergence of popular opinion and the constitutional system. “Peak polarization” will last another four years at least. But if Trump loses, given that Republicans held the Senate, there is room for compromise that would reduce polarization. But it is too early to say. Investment Takeaways Trade and foreign policy hinge on the presidency. Trump is favored in several of the key states at the moment and he is especially favored in a contested election process, but it is too soon to make investment recommendations on the executive branch other than that US equity outperformance is likely to continue on both of the scenarios at hand. Table 2Earnings Shock From Partial Repeal Of Trump Tax Cuts Has Been Averted
Gridlock
Gridlock
For now we recommend investors stay long JPY-USD, short CNY-USD, long health care equipment, and overweight stocks relative to bonds. On the Senate, the key takeaway is that Biden and the Democrats will not be able to raise taxes. This is a big benefit to the sectors that faced the greatest earnings shock from a partial repeal of Trump’s Tax Cuts and Jobs Act – namely real estate, tech, health care, utilities, consumer discretionary, and financials (Table 2). A simple play on these sectoral benefits courtesy of Anastasios Avgeriou, our US equity strategist, would be to go long small caps versus large caps, i.e. S&P 600 relative to the S&P 500, but wait till the fiscal hurdle is cleared. The BCA infrastructure basket should benefit regardless, as infrastructure is one of the few areas of bipartisan agreement, especially amid a large output gap. Matt Gertken Vice President Geopolitical Strategy mattg@bcaresearch.com Footnotes 1 We upgraded the Republicans to favored status last week based on our quantitative Senate election model, which showed a 51% chance that Republicans would maintain control, with 51-49 votes. Our presidential model also showed Trump winning with a 51% chance, but we subjectively capped his odds at 45% due to our doubts about his ability to win Michigan given Biden’s 4% lead in head-to-head public opinion polls there. 2 It is possible that Nevada’s November 10 deadline or North Carolina’s November 12 deadline could become relevant, but we doubt it. 3 Precise Electoral College outcomes cannot be predicted due to faithless electors, i.e. electoral college members who vote differently than required based on their state’s popular vote. In 2016 there were seven faithless electors and in 2020 there could be several and they could make the difference. Material punishments may not prevent an elector from making a conscientious decision to stray from his or her state’s results in an election viewed as having historic importance.
Mushrooming Green Shoots?
Mushrooming Green Shoots?
The reopening of the economy remains on track, and this week’s blow out ISM manufacturing PMI print signals that the cyclical part of the economy is firing on all cylinders. Drilling deeper beneath the surface is revealing. First, the utmost important new orders-to-inventories ratio reaccelerated and it corroborates our thesis that the SPX correction is likely drawing to a close (middle panel). Second, the survey’s new orders subcomponent in isolation has vaulted to a level last seen in the aftermath of the 1980s double dip and post the 9/11 induced recessions. The implication is that an earnings driven advance in the SPX is in the cards in 2021, after the election dust settles and investors begin to focus on profit growth anew (bottom panel). Bottom Line: As the election-related uncertainty lifts, we expect the cyclical equity bull market to resume.
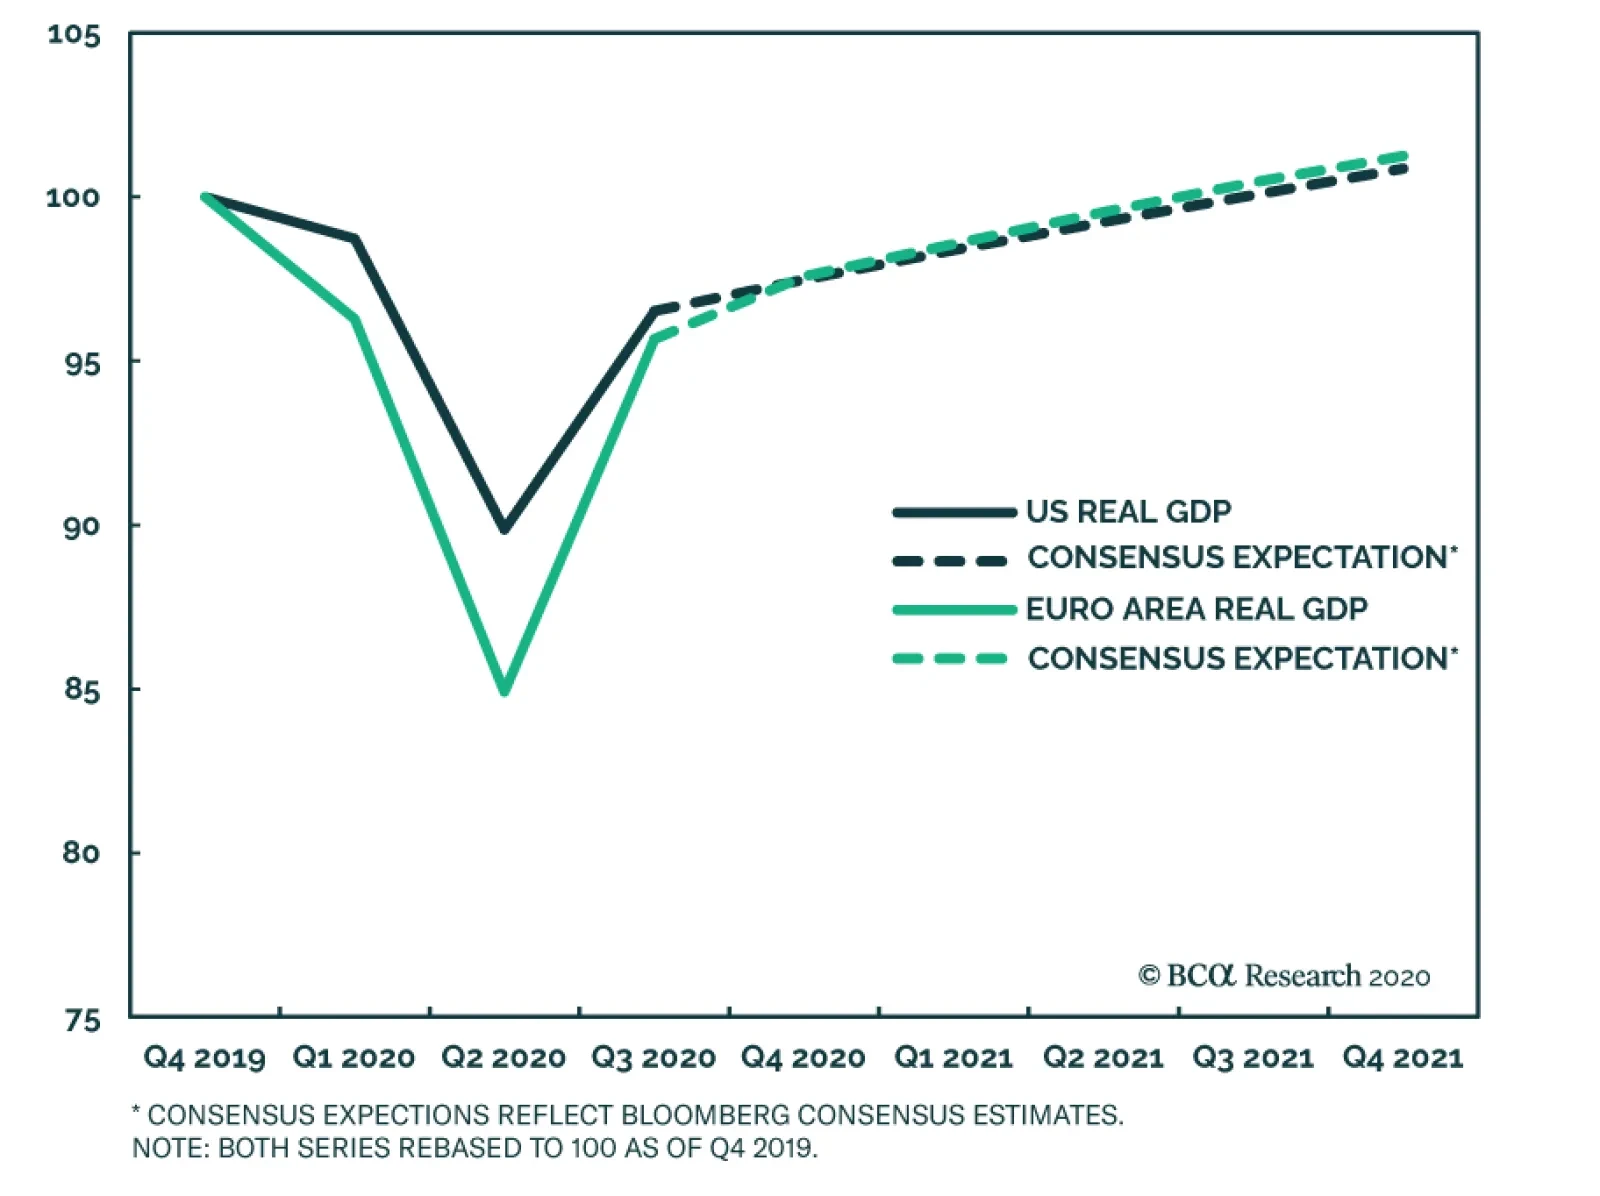
In a previous Insight, we noted that the October euro area services PMI showed the region was at risk of a relative growth disappointment. The October survey was taken before the region re-imposed COVID-19 suppression measures of various intensity, from…
Highlights Chart 1Bond Yields Have Upside In A Blue Sweep
Bond Yields Have Upside In A Blue Sweep
Bond Yields Have Upside In A Blue Sweep
Today’s US election has important implications for the near-term path of bond yields. In particular, a “blue sweep” outcome where the Democrats win control of the House, Senate and White House will probably cause yields to jump (Chart 1), as such an outcome virtually guarantees a large fiscal relief package early next year. Fiscal negotiations will be more contentious if the Republicans maintain control of the Senate, and yields could decline this evening if that occurs. However, no matter the election outcome, our 6-12 month below-benchmark portfolio duration recommendation will not change tomorrow. The economic recovery appears to be on track and some further fiscal stimulus is likely next year no matter who prevails tonight. The stimulus will just be smaller if a divided government necessitates compromise. In any case, bond investors should keep portfolio duration below-benchmark and stay overweight TIPS versus nominal Treasuries. They should also maintain positions in nominal and real yield curve steepeners and inflation curve flatteners. Feature Investment Grade: Overweight Chart 2Investment Grade Market Overview
Investment Grade Market Overview
Investment Grade Market Overview
Investment grade corporate bonds outperformed the duration-equivalent Treasury index by 99 basis points in October, bringing year-to-date excess returns up to -300 bps. Corporate bonds are certainly not as cheap as they were back in March, but we still see acceptable value in the sector. The corporate index’s 12-month breakeven spread is at its 20th percentile since 1995 and the equivalent Baa spread is at its 28th percentile (Chart 2). Both levels appear somewhat expensive at first blush. However, considering the strong tailwinds from the Fed’s extraordinarily accommodative interest rate policy and emergency lending facilities, we see a lot of room for further tightening. Corporate bond issuance increased in September, though it remains well below the extreme levels seen in the spring (panel 4). The fact that the Financing Gap – the difference between capital expenditures and retained earnings – turned negative in the second quarter suggests that firms have enough cash to cover their investment needs (bottom panel). This will keep issuance low in the coming months. At the sector level, we continue to recommend overweight allocations to subordinate bank bonds,1 Healthcare and Energy bonds.2 We also advise underweight allocations to Technology3 and Pharmaceutical bonds.4 Table 3ACorporate Sector Relative Valuation And Recommended Allocation*
A Big Night For The Bond Market
A Big Night For The Bond Market
Table 3BCorporate Sector Risk Vs. Reward*
A Big Night For The Bond Market
A Big Night For The Bond Market
High-Yield: Neutral Chart 3High-Yield Market Overview
High-Yield Market Overview
High-Yield Market Overview
High-Yield outperformed the duration-equivalent Treasury index by 86 basis points in October, bringing year-to-date excess returns up to -373 bps. Ba-rated bonds outperformed lower-rated credits in October, and they remain the best performing corporate credit tier since the March 23 peak in spreads (See Appendix A). In terms of value, if we assume a 25% recovery rate on defaulted debt and a minimum required spread of 150 bps in excess of default losses, then the High-Yield index is priced for a default rate of 4.8% during the next 12 months (Chart 3). Such a large drop in the default rate cannot be ruled out completely, but it would necessitate a rapid pace of economic recovery. We are not yet confident enough in the recovery to position for such a fast drop-off in defaults, especially with Job Cut Announcements still well above pre-COVID levels (bottom panel). We therefore continue to recommend an overweight allocation to the Ba-rated credit tier – where access to the Fed’s emergency lending facilities is broadly available – and an underweight allocation to bonds rated B and below. At the sector level, we advise overweight allocations to high-yield Technology5 and Energy bonds.6 We are underweight the Healthcare and Pharmaceutical sectors.7 MBS: Underweight Chart 4MBS Market Overview
MBS Market Overview
MBS Market Overview
Mortgage-Backed Securities outperformed the duration-equivalent Treasury index by 12 basis points in October, bringing year-to-date excess returns up to -39 bps. The conventional 30-year MBS index option-adjusted spread (OAS) tightened 11 bps on the month to land at 72 bps. This is now slightly below the 76 basis point spread offered by Aa-rated corporate bonds but well above the 62 bps offered by Agency CMBS and the 29 bps offered by Aaa-rated consumer ABS. Despite the relatively attractive OAS, we remain concerned that the elevated primary mortgage spread is a warning that refinancing risk is greater than what is currently being priced in the market (Chart 4). Yes, the mortgage spread has tightened during the past few months, but it remains 35 bps above its average 2019 level. This suggests that the mortgage rate could fall another 35 bps due to spread compression alone, even if Treasury yields are unchanged. Such a move would lead to a significant increase in prepayment losses. The recent spike in the mortgage delinquency rate does not pose a near-term risk to spreads as it is being driven by households that have been granted forbearance from the federal government (panel 4). The risk for MBS holders only comes into play if many households are unable to resume their regular mortgage payments when the forbearance period expires early next year. But even in that case, further government intervention to either support household incomes or extend the forbearance period would mitigate the risk. Government-Related: Underweight Chart 5Government-Related Market Overview
Government-Related Market Overview
Government-Related Market Overview
The Government-Related index outperformed the duration-equivalent Treasury index by 30 basis points in October, bringing year-to-date excess returns up to -284 bps. Sovereign debt outperformed duration-equivalent Treasuries by 151 bps on the month, bringing year-to-date excess returns up to -420 bps. Foreign Agencies outperformed the Treasury benchmark by 18 bps in October, bringing year-to-date excess returns up to -690 bps. Local Authority debt underperformed Treasuries by 21 bps in October, dragging year-to-date excess returns down to -362 bps. Domestic Agency bonds outperformed by 7 bps, bringing year-to-date excess returns up to -33 bps. Supranationals outperformed by 5 bps, bringing year-to-date excess returns up to -7 bps. US dollar weakness is usually a boon for Emerging Market (EM) Sovereign and Foreign Agency returns. However, this year’s dollar weakness has been relative to other Developed Market currencies. In recent months, the dollar has actually strengthened versus EM currencies (Chart 5). Value also remains poor for EM Sovereigns, which continue to offer a lower spread than Baa-rated corporate debt (panel 4). We looked at EM Sovereign valuation on a country-by-country basis in a recent report.8 We concluded that Mexican and Russian bonds offer the most compelling risk/reward trade-offs relative to the US corporate sector. Of those two countries, Mexican debt offers the best opportunity as US politics remain a concern for the Russian currency. Municipal Bonds: Overweight Chart 6Municipal Market Overview
Municipal Market Overview
Municipal Market Overview
Municipal bonds outperformed the duration-equivalent Treasury index by 41 basis points in October, bringing year-to-date excess returns up to -464 bps (before adjusting for the tax advantage). Municipal bond spreads versus Treasuries tightened in October, but value remains exceptional with most maturities trading at a positive before-tax spread. As we showed in a recent report, municipal bonds are also attractively priced relative to corporate bonds across the entire investment grade credit spectrum.9 On a duration-matched basis, the Bloomberg Barclays General Obligation and Revenue Bond indexes trade at before-tax premiums relative to corporate bonds of the same credit rating, an extremely rare occurrence (Chart 6). Extraordinary valuation is the main reason for our recommendation to overweight municipal bonds. The severe ongoing state & local government credit crunch is a concern, but it is a risk we are willing to take. If the Democrats win the House, Senate and White House this evening – a fairly likely scenario – federal aid for state & local governments will be delivered in January. This would alleviate a lot of concern. But even in the absence of federal assistance, the combination of austerity measures (bottom panel) and all-time high State Rainy Day Fund balances should help stave off a wave of municipal downgrades. Treasury Curve: Buy 5-Year Bullet Versus 2/10 Barbell Chart 7Treasury Yield Curve Overview
Treasury Yield Curve Overview
Treasury Yield Curve Overview
The Treasury curve bear-steepened in October, largely due to rising expectations of a “blue sweep” election outcome. The 2/10 and 5/30 Treasury slopes steepened 18 bps and 9 bps, respectively, to reach 74 bps and 127 bps. Our expectation is that continued economic recovery will cause investors to price-in eventual monetary tightening at the long-end of the Treasury curve. With the Fed maintaining a firm grip on the front end, this will lead to Treasury curve bear steepening. More bear steepening is likely if the Democrats win the House, Senate and White House tonight, as this would mean that a large amount of fiscal stimulus is coming early next year. But we will stick with our curve steepening recommendation regardless of the election outcome. No matter who wins the election, some further fiscal stimulus is likely on a 6-12 month horizon. We recommend positioning for a steeper curve by owning the 5-year Treasury note and shorting a duration-matched barbell consisting of the 2-year and 10-year notes. This position is designed to profit from 2/10 curve steepening. Valuation is a concern with our recommended steepener, as the 5-year yield is below the yield on the duration-matched 2/10 barbell (Chart 7). However, the 5-year looked much more expensive during the last zero-lower-bound period between 2010 and 2013 (bottom 2 panels). We anticipate a return to similar valuation levels. TIPS: Overweight Chart 8TIPS Market Overview
TIPS Market Overview
TIPS Market Overview
TIPS outperformed the duration-equivalent nominal Treasury index by 38 basis points in October, bringing year-to-date excess returns up to -93 bps. The 10-year and 5-year/5-year forward TIPS breakeven inflation rates rose 7 bps and 5 bps on the month. They currently sit at 1.71% and 1.82%, respectively. Core CPI rose 0.19% in September and the year-over-year rate held steady at 1.73%. The 12-month trimmed mean CPI ticked down from 2.48% to 2.37%, so the gap between core and trimmed mean continued to narrow (Chart 8). We anticipate further narrowing in the months ahead, and therefore expect core CPI to come in relatively hot. For this reason, we recommend maintaining an overweight allocation to TIPS versus nominal Treasuries for the time being, even though the 10-year TIPS breakeven rate is no longer cheap according to our Adaptive Expectations Model (panel 2).10 Inflation pressures may moderate once core and trimmed mean inflation measures converge, and this could give us an opportunity to tactically reduce TIPS exposure sometime next year. We also recommend holding real yield curve steepeners and inflation curve flatteners. With the Fed now officially targeting an overshoot of its 2% inflation goal, we would expect the cost of 2-year inflation protection to rise above the cost of 10-year inflation protection (panel 4). With the Fed also exerting more control over short-dated nominal yields than over long-term ones, we expect that short-maturity real yields will come under downward pressure relative to the long end (bottom panel). ABS: Overweight Chart 9ABS Market Overview
ABS Market Overview
ABS Market Overview
Asset-Backed Securities outperformed the duration-equivalent Treasury index by 9 basis points in October, bringing year-to-date excess returns up to +72 bps. Aaa-rated ABS outperformed the Treasury benchmark by 6 bps on the month, bringing year-to-date excess returns up to +59 bps. Non-Aaa ABS outperformed by 29 bps, bringing year-to-date excess returns up to +157 bps. Aaa ABS are a high conviction overweight, given that spreads remain elevated compared to historical levels and that the sector benefits from Fed support through the Term Asset-Backed Loan Facility (TALF). However, spreads are even more attractive in non-Aaa ABS (Chart 9) and we recommend owning those securities as well. This is despite the fact that only Aaa-rated bonds are eligible for TALF. We explained our rationale for owning non-Aaa consumer ABS in a June report.11 We noted that stimulus received from the CARES act caused disposable income to increase significantly since February. Then, faced with fewer spending opportunities, households used much of that windfall to pay down consumer debt (panel 4). Granted, further income support from fiscal policymakers is needed now that the CARES act’s enhanced unemployment benefits have expired. But given the substantial boost to savings that has already occurred, we are confident that more stimulus will arrive in time to prevent a wave of consumer bankruptcies. Non-Agency CMBS: Neutral Chart 10CMBS Market Overview
CMBS Market Overview
CMBS Market Overview
Non-Agency Commercial Mortgage-Backed Securities outperformed the duration-equivalent Treasury index by 9 basis points in October, bringing year-to-date excess returns up to -250 bps. Aaa Non-Agency CMBS underperformed Treasuries by 10 bps on the month, dragging year-to-date excess returns down to -73 bps. Non-Aaa Non-Agency CMBS outperformed by 72 bps, bringing year-to-date excess returns up to -738 bps (Chart 10). We continue to recommend an overweight allocation to Aaa Non-Agency CMBS and an underweight allocation to non-Aaa CMBS. Our reasoning is simple. Aaa CMBS are eligible for TALF, meaning that spreads can still tighten even as the hardship in commercial real estate (CRE) continues. Without Fed support, non-Aaa CMBS will struggle to deal with tightening CRE lending standards and falling demand (panels 3 & 4). Agency CMBS: Overweight Agency CMBS outperformed the duration-equivalent Treasury index by 29 basis points in October, bringing year-to-date excess returns up to +17 bps. The average index spread tightened 6 bps on the month. It currently sits at 62 bps, well above typical historical levels (bottom panel). At its last meeting, the Fed decided to slow its pace of Agency CMBS purchases. It will no longer seek to increase its Agency CMBS holdings, but will instead purchase only what is “needed to sustain smooth market functioning”. This is nonetheless a Fed back-stop of the market, and it does not change our overweight recommendation. Appendix A: Buy What The Fed Is Buying The Fed rolled out a number of aggressive lending facilities on March 23. These facilities focused on different specific sectors of the US bond market. The fact that the Fed has decided to support some parts of the market and not others has caused some traditional bond market correlations to break down. It has also led us to adopt of a strategy of “Buy What The Fed Is Buying”. That is, we favor those sectors that offer attractive spreads and that benefit from Fed support. The below Table tracks the performance of different bond sectors since the March 23 announcement. We will use this to monitor bond market correlations and evaluate our strategy’s success. TablePerformance Since March 23 Announcement Of Emergency Fed Facilities
A Big Night For The Bond Market
A Big Night For The Bond Market
Appendix B: Butterfly Strategy Valuations The following tables present the current read-outs from our butterfly spread models. We use these models to identify opportunities to take duration-neutral positions across the Treasury curve. The following two Special Reports explain the models in more detail: US Bond Strategy Special Report, “Bullets, Barbells And Butterflies”, dated July 25, 2017, available at usbs.bcaresearch.com US Bond Strategy Special Report, “More Bullets, Barbells And Butterflies”, dated May 15, 2018, available at usbs.bcaresearch.com Table 4 shows the raw residuals from each model. A positive value indicates that the bullet is cheap relative to the duration-matched barbell. A negative value indicates that the barbell is cheap relative to the bullet. Table 4Butterfly Strategy Valuation: Raw Residuals In Basis Points (As Of October 30TH, 2020)
A Big Night For The Bond Market
A Big Night For The Bond Market
Table 5 scales the raw residuals in Table 4 by their historical means and standard deviations. This facilitates comparison between the different butterfly spreads. Table 5Butterfly Strategy Valuation: Standardized Residuals (As Of October 30TH, 2020)
A Big Night For The Bond Market
A Big Night For The Bond Market
Table 6 flips the models on their heads. It shows the change in the slope between the two barbell maturities that must be realized during the next six months to make returns between the bullet and barbell equal. For example, a reading of 63 bps in the 5 over 2/10 cell means that we would only expect the 5-year to outperform the 2/10 if the 2/10 slope steepens by more than 63 bps during the next six months. Otherwise, we would expect the 2/10 barbell to outperform the 5-year bullet. Table 6Discounted Slope Change During Next 6 Months (BPs)
A Big Night For The Bond Market
A Big Night For The Bond Market
Appendix C: Excess Return Bond Map The Excess Return Bond Map is used to assess the relative risk/reward trade-off between different sectors of the US bond market. It is a purely computational exercise and does not impose any macroeconomic view. The Map’s vertical axis shows 12-month expected excess returns. These are proxied by each sector’s option-adjusted spread. Sectors plotting further toward the top of the Map have higher expected returns and vice-versa. Our novel risk measure called the “Risk Of Losing 100 bps” is shown on the Map’s horizontal axis. To calculate it, we first compute the spread widening required on a 12-month horizon for each sector to lose 100 bps or more relative to a duration-matched position in Treasury securities. Then, we divide that amount of spread widening by each sector’s historical spread volatility. The end result is the number of standard deviations of 12-month spread widening required for each sector to lose 100 bps or more versus a position in Treasuries. Lower risk sectors plot further to the right of the Map, and higher risk sectors plot further to the left. Chart 11Excess Return Bond Map (As Of October 30TH, 2020)
A Big Night For The Bond Market
A Big Night For The Bond Market
Ryan Swift US Bond Strategist rswift@bcaresearch.com Footnotes 1 Please see US Bond Strategy Weekly Report, “The Case Against The Money Supply”, dated June 30, 2020, available at usbs.bcaresearch.com 2 Please see US Bond Strategy Special Report, “The Outlook For Energy Bonds Part 1: A Model Of Energy Bond Excess Returns”, dated July 14, 2020 and US Bond Strategy Special Report, “The Outlook For Energy Bonds Part 2: Buy The Dip In High-Yield Energy”, dated July 21, 2020, available at usbs.bcaresearch.com 3 Please see US Bond Strategy Weekly Report, “Take A Look At High-Yield Technology Bonds”, dated June 23, 2020, available at usbs.bcaresearch.com 4 Please see US Bond Strategy Weekly Report, “Assessing Healthcare & Pharma Bonds In A Pandemic”, dated June 9, 2020, available at usbs.bcaresearch.com 5 Please see US Bond Strategy Weekly Report, “Take A Look At High-Yield Technology Bonds”, dated June 23, 2020, available at usbs.bcaresearch.com 6 Please see US Bond Strategy Special Report, “The Outlook For Energy Bonds Part 1: A Model Of Energy Bond Excess Returns”, dated July 14, 2020 and US Bond Strategy Special Report, “The Outlook For Energy Bonds Part 2: Buy The Dip In High-Yield Energy”, dated July 21, 2020, available at usbs.bcaresearch.com 7 Please see US Bond Strategy Weekly Report, “Assessing Healthcare & Pharma Bonds In A Pandemic”, dated June 9, 2020, available at usbs.bcaresearch.com 8 Please see US Bond Strategy Weekly Report, “Trading Bonds In A Dollar Bear Market”, dated September 22, 2020, available at usbs.bcaresearch.com 9 Please see US Bond Strategy Weekly Report, “Political Risk Will Dominate In A Pivotal Month For The Bond Market”, dated October 13, 2020, available at usbs.bcaresearch.com 10 For more details on our model please see US Bond Strategy Weekly Report, “How Are Inflation Expectations Adapting?”, dated February 11, 2020, available at usbs.bcaresearch.com 11 Please see US Bond Strategy Weekly Report, “No Holding Back”, dated June 16, 2020, available at usbs.bcaresearch.com Fixed Income Sector Performance Recommended Portfolio Specification Corporate Sector Relative Valuation And Recommended Allocation