United States

Green Light From The Equity Put/Call Ratio?
Green Light From The Equity Put/Call Ratio?
In mid-September, we highlighted the CBOE equity put/call (EPC) ratio that warned investors were complacent. Our goal was to attempt to quantify when the correction would end, and we noted that since the early-2018 “Volmageddon” episode, SPX drawdowns corresponded to higher EPC ratio readings (EPC shown inverted, see chart). As a reminder in the past 10 iterations, the EPC ratio has averaged 0.93 with a 0.86 median, and ranged from 0.74 to 1.28. The price action last Friday finally pushed the EPC ratio to 0.77 signaling that the correction is long in the tooth and some of the speculative fervor was wrung out of the market. Bottom Line: As the election-related uncertainty lifts, we expect the cyclical bull market to resume. Stay tuned.
According to BCA Research's Global Investment Strategy service, stocks would likely rise if Trump won and the Democrats took over the Senate. If re-elected, President Trump would block any efforts to raise taxes or tighten business regulations. However,…
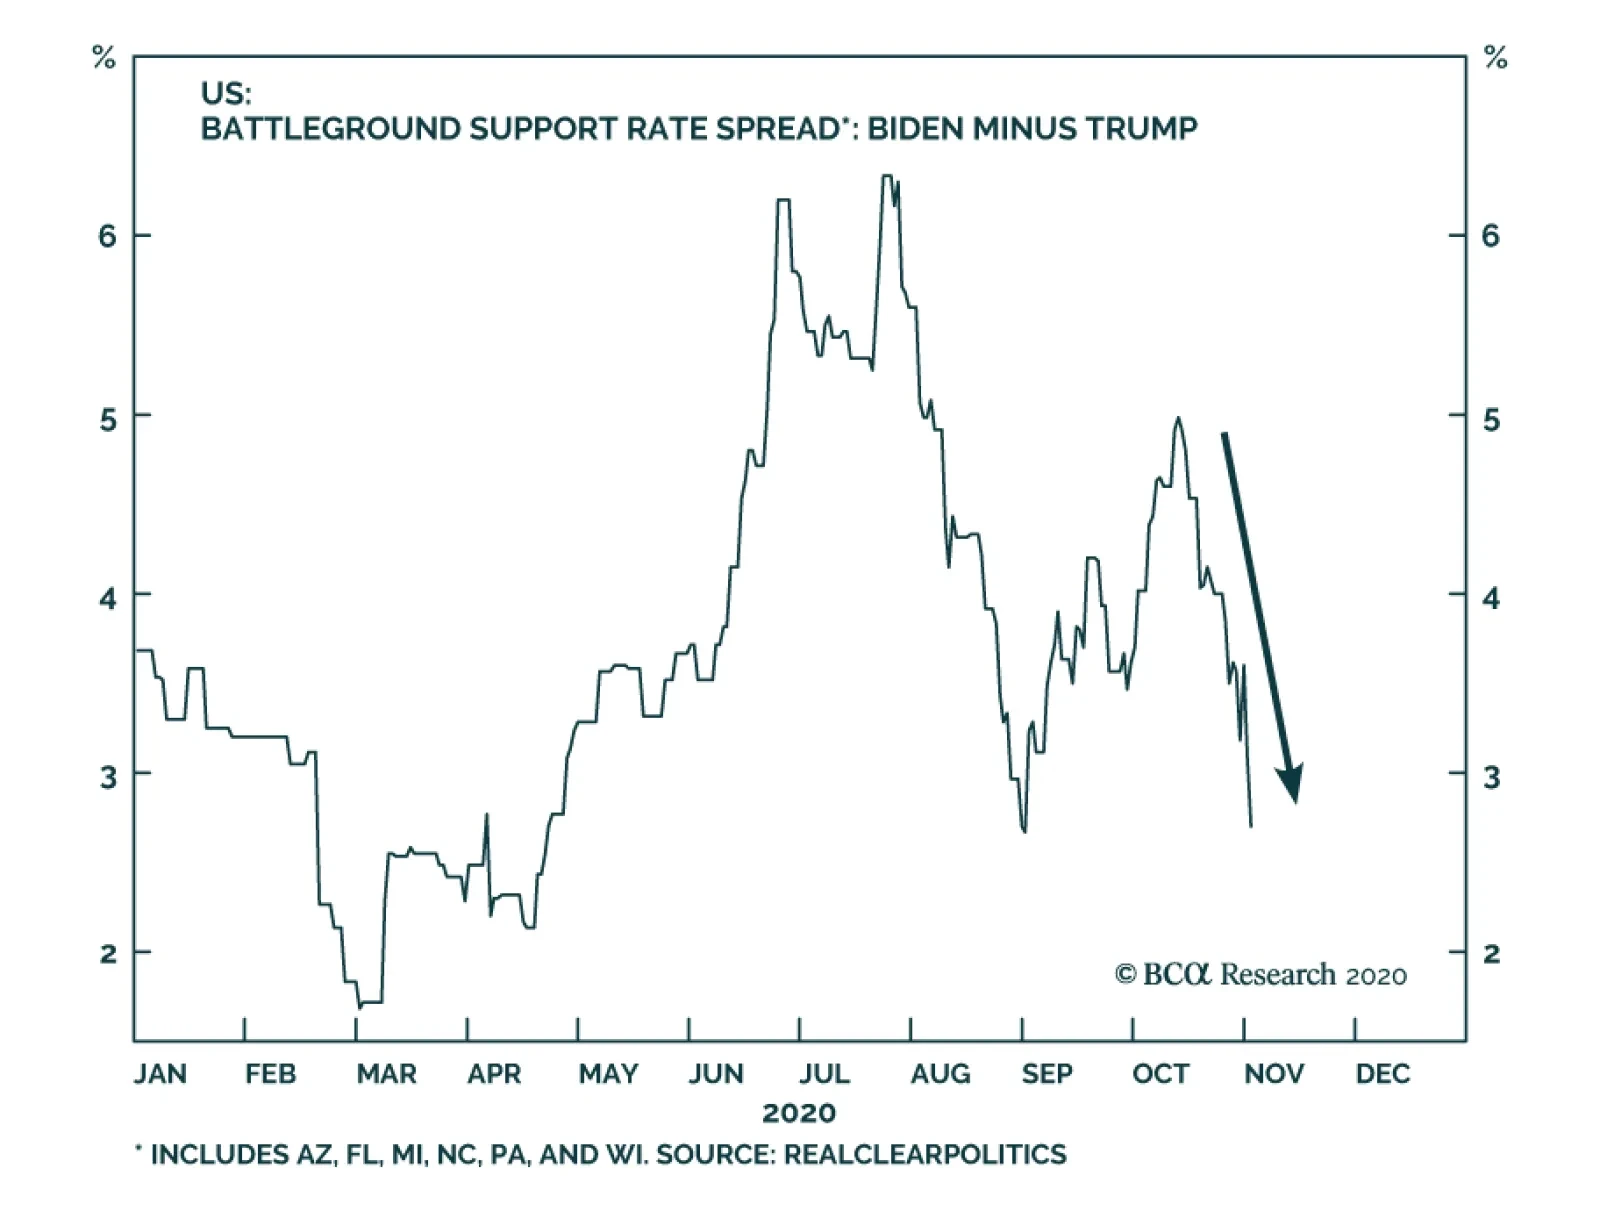
Joe Biden leads Donald Trump sizably in national polling, suggesting that the latter is likely to lose the popular vote in today’s election. But the US presidency is decided by the electoral college, not the popular vote, and on this basis, Biden’s lead is…
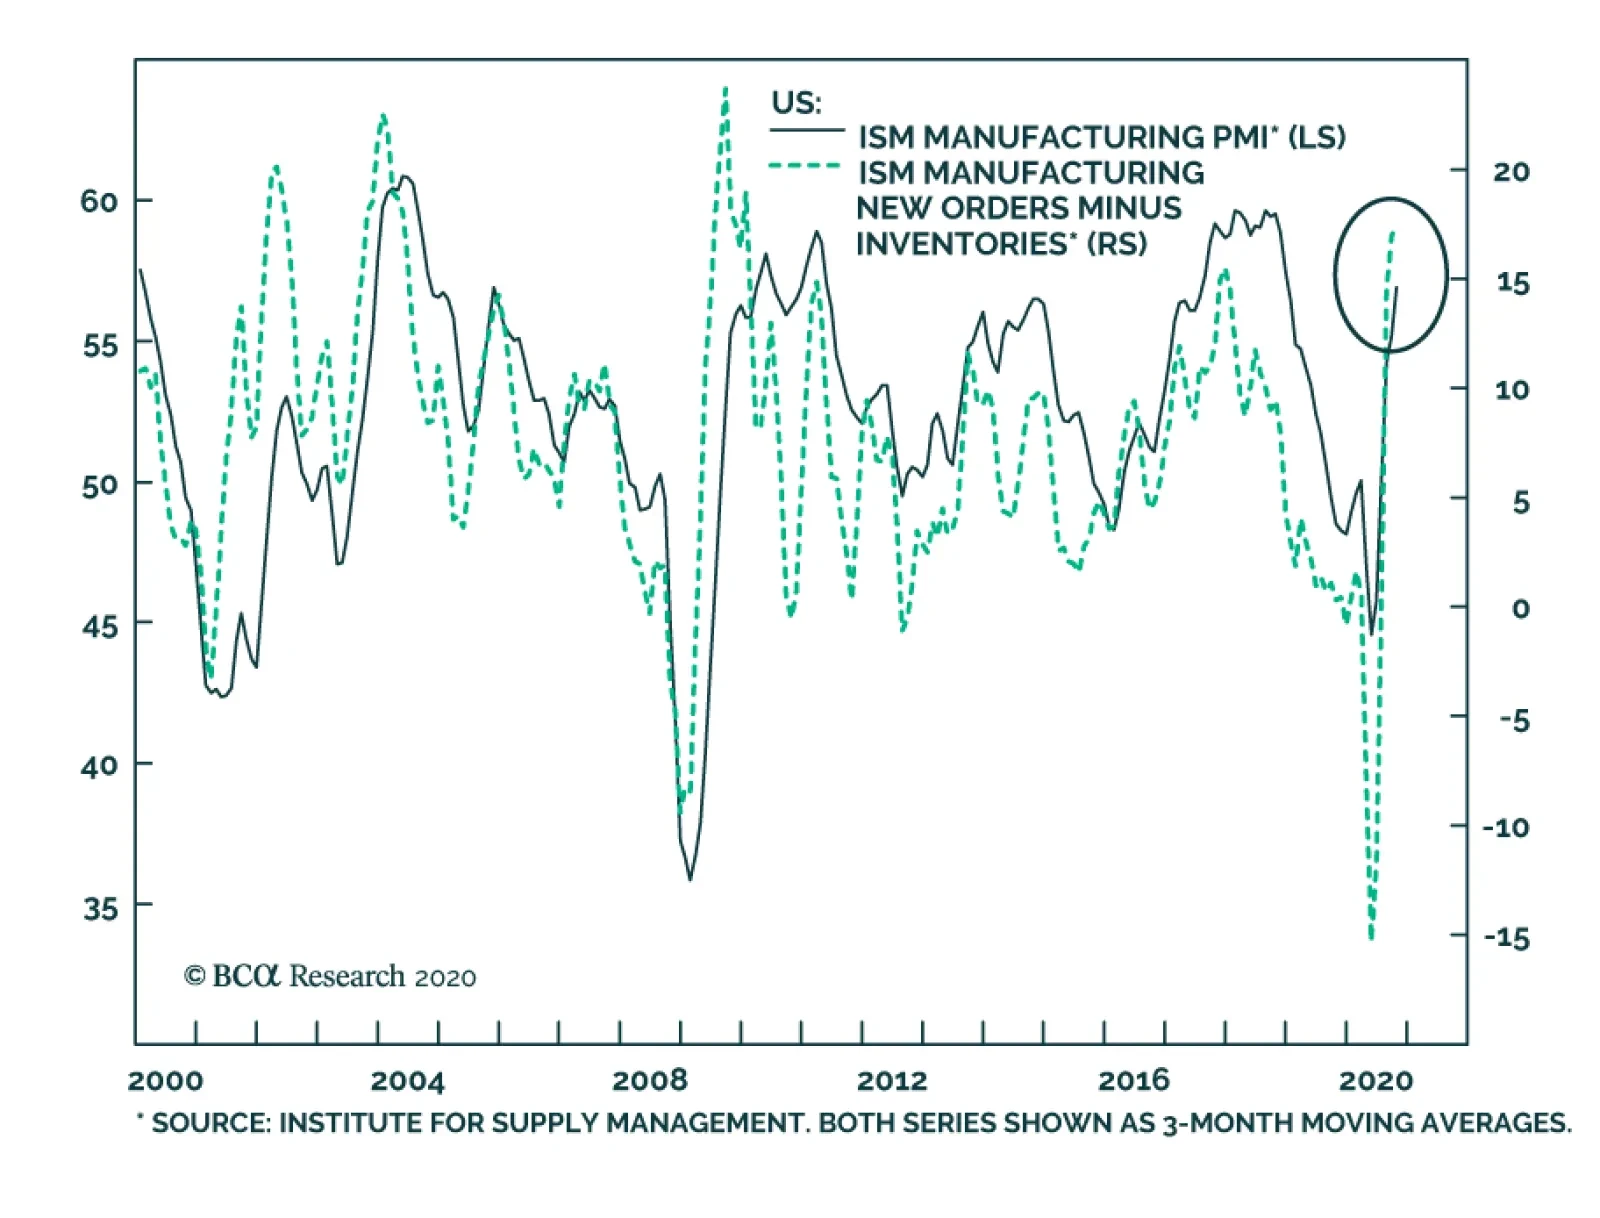
Yesterday’s October update to the ISM manufacturing index was encouraging for the US economic outlook. The overall index rose to 59.3 (from 55.4), easily beating consensus expectations of 56. While every subcomponent of the index improved in October, it…
Your feedback is important to us. Please take our client survey today Highlights Portfolio Strategy An easy Fed, the drubbing in the US dollar, the opening up of the global economy, poor pharma operating metrics and the specter of a “Blue Wave” more than offset the likelihood of a COVID-19 vaccine and oversold technicals, and compel us to cut pharma exposure below benchmark. This downgrade of the heavyweight pharma index also pushes the S&P health care sector down to a neutral position. Recent Changes Downgrade the S&P pharmaceuticals index to underweight, today. Trim the S&P health care sector down to a benchmark allocation, today. Table 1
Peering Across The Election Valley
Peering Across The Election Valley
Feature On the eve of the election, the SPX oscillated violently last week as it became evident that there will be no agreement on a bipartisan fiscal package. Thus, the odds are rising of a mega fiscal package next year irrespective of the election outcome. The longer politicians wait the larger the stimulus bill will end up being. Realistically now a fresh fiscal impulse is pushed out to late-January at the earliest, casting a dark cloud over the current quarter’s economic and profit growth prospects. In mid-October we highlighted that positioning remained stretched in both VIX and S&P 500 e-mini futures, which warned that investors were prematurely betting on subsiding volatility. Similarly, we cautioned that VIX options activity corroborated the stretched positioning message as investors were piling into VIX puts and neglecting to buy any election protection in the form of VIX calls. The final blow came early last week when the equity vol curve inverted with the VIX spiking north of 40 and implying that the SPX would move by +/- 12% in the next 30 days. Given so much fear priced in the VIX, last Thursday we decided to close our election protection in the form of VIX December 16, 2020 expiry futures that we held since our July 27 Special Report we penned with our sister Geopolitical Strategy on the rising odds of a contested US election. Our view remains that the SPX could glide lower into the November election before rallying into year-end courtesy of receding election and fiscal policy uncertainties. Nevertheless, at the risk of getting overly bearish a few offsetting observations are in order. While there is a chance that the VIX will continue to roar as it did early in the year and push the equity vol curve deeper in backwardation, our sense is that the correction that commenced in early September is close to running its course. Historically, Chart 1 shows that the VIX curve inversion is typically short-lived and more often than not serves as a launchpad for the SPX. Chart 1Correction Enters Third Month
Correction Enters Third Month
Correction Enters Third Month
With regard to market internals, a flurry of M&A activity has propelled the Philly SOX index to all-time highs in absolute terms and to nineteen-year highs versus the SPX. IPO activity has also resumed and the Renaissance IPO exchange trade fund is on a tear breaking out recently to uncharted territory. Moreover, the SPX advance/decline line is also probing all-time highs and signaling increased participation beyond the top 5 tech titans (Chart 2). While the Fed has been a bystander of late – trying to exert some pressure on Congress to pass a fresh stimulus package – and the fiscal circus continues unabated in Washington D.C., both the money supply release and the American Association on Individual Investors confirm that a lot of dry powder remains on the sidelines. The implication is that as election uncertainty recedes then this idle cash courtesy of the sloshing liquidity will make its way through the markets. In other words decreasing cash balances push the SPX higher and vice versa (Chart 3). Chart 2Market Internals: A Few Rays Of Light
Market Internals: A Few Rays Of Light
Market Internals: A Few Rays Of Light
Chart 3Lots Of Dry Powder
Lots Of Dry Powder
Lots Of Dry Powder
Meanwhile, following up from last week’s debt discussion we delve deeper into the non-financial corporate sector’s debt profile. The pandemic has pushed non-financial business debt to an extreme almost on a par with nominal GDP (top panel, Chart 4). The big difference this cycle is that, according to Moody’s, subordinated debt that has defaulted sports a recovery rate in the teens, a far cry from previous recessionary troughs (second panel, Chart 4). The overall junk bond recovery rate is near 25 cents on the dollar plumbing historical lows (a recent Bloomberg article highlighted that COVID-19 has ushered in this “new era of US bankruptcies” with ultra-low recovery rates).1 The risk remains that the default rate will continue to rise (bottom panel, Chart 4): the longer the fiscal stimulus package takes to arrive the higher the bankruptcies will be. Importantly, the deep cyclicals (tech, industrials, materials and energy) net debt-to-EBITDA ratio has crossed above 1.5x during the recession on the back of cash flow ails. In fact cyclicals have been paying down net debt in absolute terms during the pandemic (bottom panel, Chart 5). Chart 4Beware Low Recovery Rates
Beware Low Recovery Rates
Beware Low Recovery Rates
Chart 5Debt Saddled Defensives
Debt Saddled Defensives
Debt Saddled Defensives
In marked contrast, the defensives (health care, consumer staples, utilities and telecom services) net debt-to-EBITDA ratio is hovering near 3x, as these debt saddled sectors have not been able to pay down net debt. Not only is net debt roughly $2tn, but it also comprises 50% of the broad market’s net debt at a time when the market cap weight is close to 30% (Chart 5). Taken together, the relative debt profile clearly favors cyclicals at the expense of defensives and we continue to recommend a cyclicals versus defensives portfolio bent. One neglected part of the Baker, Bloom and Davis policy uncertainty has been the trade-related uncertainty. The pandemic has put the trade dispute in the back burner. Moreover, the odds remain high of a Biden win; at the margin, a Democratic President will be less hawkish on trade and will try to deescalate global trade tensions. This backdrop is a de facto positive for cyclicals/defensives, especially given our view of a reopening of the global economy in 2021 (Chart 6). This week we continue to augment the cyclical/defensive bent of our portfolio by taking a defensive sector down a notch. Chart 6Cyclicals Benefit From Dwindling Trade Uncertainty
Cyclicals Benefit From Dwindling Trade Uncertainty
Cyclicals Benefit From Dwindling Trade Uncertainty
Comatose Big Pharma shares broke down recently and we are compelled to downgrade exposure to underweight on the eve of the US election. While a short term reflex bounce may be in the cards, we would sell that strength as relative share prices are teetering and are on the verge of giving up 25 years of relative returns (top panel, Chart 7). Stiff macro headwinds, tough operating metrics and hawkish political rhetoric more than offset positive COVID-19 vaccine-related news. On the macro front, the Fed’s ZIRP bodes ill for defensive pharma equities. The Fed was uncharacteristically quick this recession to drop rates to the lower zero bound to reflate the economy. As a result, safe haven equities, Big Pharma included, typically trail the broad market as the economy gets out of the ER and into the recovery room (middle & bottom panels, Chart 7). Importantly, relative pharmaceutical profits are highly counter cyclical: they rise with the onset of recession and collapse as the economy stands back on its own two feet. Currently, as the COVID-19 hit to the world economy has transitioned to a V-shaped recovery, the reopening of the economy into the New Year will continue to knock the wind out of relative pharma profitability (global manufacturing PMI shown inverted, middle panel, Chart 8). Chart 7A Tough Pill To Swallow
A Tough Pill To Swallow
A Tough Pill To Swallow
Chart 8Sell The Pharma Counter-Cyclicality
Sell The Pharma Counter-Cyclicality
Sell The Pharma Counter-Cyclicality
Similarly, an appreciating greenback has historically been synonymous with pharma outperformance and vice versa (third panel, Chart 8). Keep in mind, Big Pharma make the lion’s share of their profits domestically further cementing the positive correlation with the US dollar. This local profit sourcing represents one of the main reasons why politicians on both sides of the aisle are after domestic pharma profits (more on this below). Worrisomely and likely tied to the domestic nature of the industry’s profit extraction, the debasing of the US dollar fails to provide any export relief. In fact, exports have been historically positively correlated with the greenback (bottom panel, Chart 8). Pharma prices are on the cusp of contracting. Importantly, President Trump’s late-July executive order “to allow importation of certain prescription drugs from Canada”2 among other provisions is a direct blow to the profit prospects of Big Pharma (second panel, Chart 9). Other operating factors also weigh on pharma earnings. Industry shipments have risen to a level that has marked prior peak growth rates. Any letdown on the demand side coupled with the recent inventory build, will lead to pricing power losses. Tack on accelerating productivity losses despite recovering pharma industrial production and factors are falling into place for a relative profit driven underperformance phase (Chart 9). With regard to the election outcome, a Biden win accompanied by a Senate flip to the Democrats would be the worst possible outcome for the pharmaceutical industry, as we posited in our recent Special Report penned with our sister Geopolitical Strategy services on sector implication of a “Blue Trifecta”, and reiterate today (Chart 10). Chart 9Pricing Power Blues
Pricing Power Blues
Pricing Power Blues
Nevertheless, we are cognizant that definitive news of a COVID-19 vaccine will likely lift Big Pharma, but only temporarily, as cyclical forces will more than offset the positive vaccine news. Finally, with regard to valuations and technicals, pharma is not offering compelling value but rather is a value trap and we would use any reflex rebound to lighten up exposure to this defensive industry (Chart 11). Chart 10Heightened “Blue Sweep” Risk
Heightened “Blue Sweep” Risk
Heightened “Blue Sweep” Risk
Chart 11Value Trap
Value Trap
Value Trap
Netting it all out, an easy Fed, the drubbing in the US dollar, the opening up of the global economy, poor pharma operating metrics and the specter of a “Blue Wave” more than offset the benefits of a COVID-19 vaccine and oversold technicals. Bottom Line: Downgrade the S&P pharmaceuticals index to underweight today. The ticker symbols for the stocks in this index are: BLBG – S5PHARX, JNJ, PFE, MRK, LLY, BMY, ZTS, CTLT, MYL, PRGO. A Few Words On Health Care The Big Phama downgrade to underweight also pushes the S&P health care sector to a benchmark allocation from a previously modest overweight stance. This leaves the S&P medical equipment index as the sole overweight in this defensive sector that enjoys cyclical and structural tailwinds (especially in emerging markets that are instituting the health care safety nets the developed markets already enjoy) more than offsetting the safe haven characteristics that typically overshadow health care outfits (second panel, Chart 12). Moreover, we are putting the S&P health care sector on downgrade alert as we reckon most of the positive profit drivers are already reflected in cycle high relative profit growth figures and are at major risk of deflating if our thesis of a global reopening of the economy takes shape in the New Year. Our relative macro driven EPS growth models corroborate that earnings are at heightened risk of major disappointment next year (Chart 13). Chart 12Stick With Health Equipment
Stick With Health Equipment
Stick With Health Equipment
Chart 13Put The S&P Health Care Sector On Downgrade Alert
Put The S&P Health Care Sector On Downgrade Alert
Put The S&P Health Care Sector On Downgrade Alert
Bottom Line: Trim the S&P health care sector to neutral today and also put it on downgrade watch. Anastasios Avgeriou US Equity Strategist anastasios@bcaresearch.com Footnotes 1 https://www.bloomberg.com/news/articles/2020-10-26/bond-defaults-deliver-99-losses-in-new-era-of-u-s-bankruptcies 2 https://www.whitehouse.gov/presidential-actions/executive-order-increasing-drug-importation-lower-prices-american-patients/ Current Recommendations Current Trades Strategic (10-Year) Trade Recommendations
Drilling Deeper Into Earnings
Drilling Deeper Into Earnings
Size And Style Views October 26, 2020 Favor small over large caps July 27, 2020 Overweight cyclicals over defensives June 11, 2018 Long the BCA Millennial basket The ticker symbols are: (AAPL, AMZN, UBER, HD, LEN, MSFT, NFLX, SPOT, TSLA, V). January 22, 2018 Favor value over growth
Highlights Outsized daily moves were the rule for the S&P 500 last week as surging COVID-19 infections and tightening election polls highlighted the uncertain road ahead: Stocks sold off and the VIX spiked as the US set new daily infection records, European countries imposed a new round of strict lockdowns and narrowing polls pointed to increasing odds of a messy election outcome. We continue to believe more fiscal stimulus is needed, but households are doing just fine in the aggregate, … : Apartment rent collections and consumer credit performance have yet to betray any signs of post-CARES Act weakness, and the personal income report showed that aggregate household financial positions improved for a sixth straight month in September. … and studies focusing on households at the lower end of the income and wealth distributions do not reveal signs of distress: Payday loan transaction volumes have collapsed despite the recession and an analysis of Chase Bank customer activity showed that the unemployed received enough aid to double their savings and increase consumption while the CARES Act taps were open. Feature We will be holding a webcast next Monday, November 9th at 10:00 a.m. Eastern time in lieu of publishing a Strategy Report. Please join us with your questions to make it a fully interactive event. We will resume our regular publication schedule on the 16th. Markets sold off worldwide last week as surging COVID-19 infections in Europe and the US raised the specter of a new round of lockdowns. As French President Macron put it while announcing France’s new limits, “[The] virus is circulating … at a speed that even the most pessimistic forecast didn’t foresee. The measures we’ve taken have turned out to be insufficient to counter a wave that’s affecting all Europe.” Until December 1st, barring a dramatic reversal in new infections, bars, restaurants and non-essential retailers will close, and domestic travel and public gatherings will be banned, though schools will remain open. Germany implemented similar measures, albeit with gentler limits on retailers. Though the seven-day average of US cases made a new high last week as the third wave accelerated (Chart 1), we do not expect lockdowns on a par with spring’s draconian measures. We also were not fazed as pre-election stimulus hopes were snuffed out for good. We think last week’s slide simply reflected the considerable uncertainty surrounding the pandemic and the size, composition and timing of the next round of fiscal stimulus intended to combat it. We have been more cautious over the tactical 0-to-3-month timeframe than the cyclical 3-to-12-month timeframe because we expected that stocks would eventually stumble while the outcome of the policymakers-versus-the-virus contest appeared to be in doubt. Chart 1Daily New COVID-19 Infections: United States
The Post-Election Valley
The Post-Election Valley
We continue to believe that policymakers have the capacity to stave off the virus’ economic impacts for all of 2021, if need be, and that they will eventually rediscover the will to use it. The path from here to there could be contentious and drawn-out, however, depending on the election results. A blue wave that puts the Democrats in control of the White House and the Senate would be the most stimulus-friendly outcome, but it became less likely last week as the universe of polls tracked by our geopolitical strategists showed the president rallying in several key battleground states. They argue that the president’s re-election chances are better than the pundits realize and that the joint probability of a Biden White House and a Republican Senate is rising. We could easily see stimulus negotiations becoming protracted and bitter under that scenario, with no agreement being reached until after the economy sustains some heavy blows. Households Are Still Holding On, In The Aggregate … According to several key data series we’ve been monitoring to track households’ financial health, the big blows have not yet begun to land. Through the week ended October 27th, apartment rent collections were a good bit better than they were in August and September, and were within one-and-a-half percentage points of their year-ago level, where they have remained since May (Table 1). Investors and economy watchers are rightly concerned about households’ ability to meet their financial obligations three full months after the weekly $600 unemployment insurance (UI) benefit supplement expired, but the National Multifamily Housing Council’s rent tracker shows that they are continuing to keep up with their single largest expense. Although their stocks sold off last week on rent declines of as much as 20% at properties in coastal cities, the six apartment REITs in the S&P 500 all reported third quarter rent collections well above the landlords in the NMHC’s sample (Table 2). The end of the weekly $600 supplemental unemployment benefit checks does not appear to have been a watershed event, ... Table 1Apartment Tenants Are Still Paying Their Rent
The Post-Election Valley
The Post-Election Valley
Table 2S&P 500 Residential REIT Rent Collections
The Post-Election Valley
The Post-Election Valley
Consumer credit performance held up through September, updated TransUnion data showed, confirming the signal from the SIFI banks’ third quarter earnings reports. September delinquencies in auto loans and unsecured personal loans ticked up from their August level, but all categories, ex-autos, are well below their September 2019 delinquency rates and auto delinquencies are only five basis points above their year-ago level (Table 3). While it is possible that September marked the beginning of some erosion, consumer credit has performed far better than expected given double-digit unemployment across April, May and June; leading 30-day delinquency series are not sending worrisome signals (Chart 2); average credit card balances keep coming down and the share of borrowers in forbearance programs is falling across all four loan categories. ... as the broad mass of American households are still paying their rent and servicing their debt. Table 3TransUnion Consumer Loan Delinquency Data
The Post-Election Valley
The Post-Election Valley
Chart 2A Slight Pickup Is Coming
The Post-Election Valley
The Post-Election Valley
… And In The Lower Reaches Of The Distribution Widely available data series reflect aggregate consumer health, but are not granular enough to provide insight into the condition of household finances across the entire wealth and income distribution. Such insight could be useful: the most vulnerable households have the highest marginal propensity to consume, and a real-time read on how they’re faring would shed some light on pending changes in economic activity at the margin. Several internal discussions about the robustness of the recovery have come down to how much longer households in the lower quintiles might be able to hold on. Their plight will figure heavily into how soon the next round of fiscal aid is needed and how large it will have to be. Veritec Solutions creates databases that allow states to monitor payday lenders to ensure that loans comply with laws and regulations. It recently released data showing that weekly payday loan transactions across seven states have cratered relative to year-ago transactions, bottoming around -65% in the second week of May before recovering to -46% through the second week of October.1 In the two years preceding the onset of the pandemic, payday transaction volumes had been trending downward at an annual rate of about 5%, consistent with what one might expect nine and ten years into an expansion, as accelerating wage gains allowed lower-income households to share some of the spoils. If those households were suffering, as one would expect in a recession that has disproportionately wiped out lower-skilled services jobs, an inferior-good industry like payday lending should be thriving. Given that payday loan transaction activity has not picked up meaningfully since the federal UI benefit supplement ran out at the end of July (transactions were down just under 50% year-over-year in the week ended August 1st), lower-income households do not yet appear to be under any particular duress. A separate study analyzing checking account and credit card data from Chase Bank customers focused on the impact of CARES Act measures on unemployed households. The median unemployed checking account balance roughly doubled between the end of March and the end of July, as inflows exceeded outflows in all four of the intervening months, consistent with the aggregate personal income data. Unemployed Chase customers used up nearly two-thirds of their pandemic savings in the month of August, however, raising some questions over how far their CARES Act support can stretch. That support boosted consumption while the transfers were flowing, with unemployed households' spending outpacing spending by households that kept their jobs, reversing the typical pattern. Spending by the unemployed tumbled in August once the $600 federal supplement expired and further declines are likely in store as savings dwindle and the stopgap weekly $400 joint federal/state supplement disappears, but the ranks of the unemployed are shrinking and fewer households will need help going forward. What Comes In And What Goes Out September Personal Income bounced a little bit after declining in August, modestly topping estimates and exceeding February’s pre-pandemic level for a sixth consecutive month. In the aggregate, households socked away close to another $100 billion over and above the baseline savings they might have amassed in the absence of the pandemic. (To calculate the baseline, we assume 4% annual nominal disposable income growth since February and a constant 8.3% savings rate (Table 4).) Looking ahead, the bottom line is that, with $1.2 trillion of excess savings, households are in a position to serve as a bridge to the next round of fiscal aid if they so choose. Table 4Excess Savings Keep Piling Up
The Post-Election Valley
The Post-Election Valley
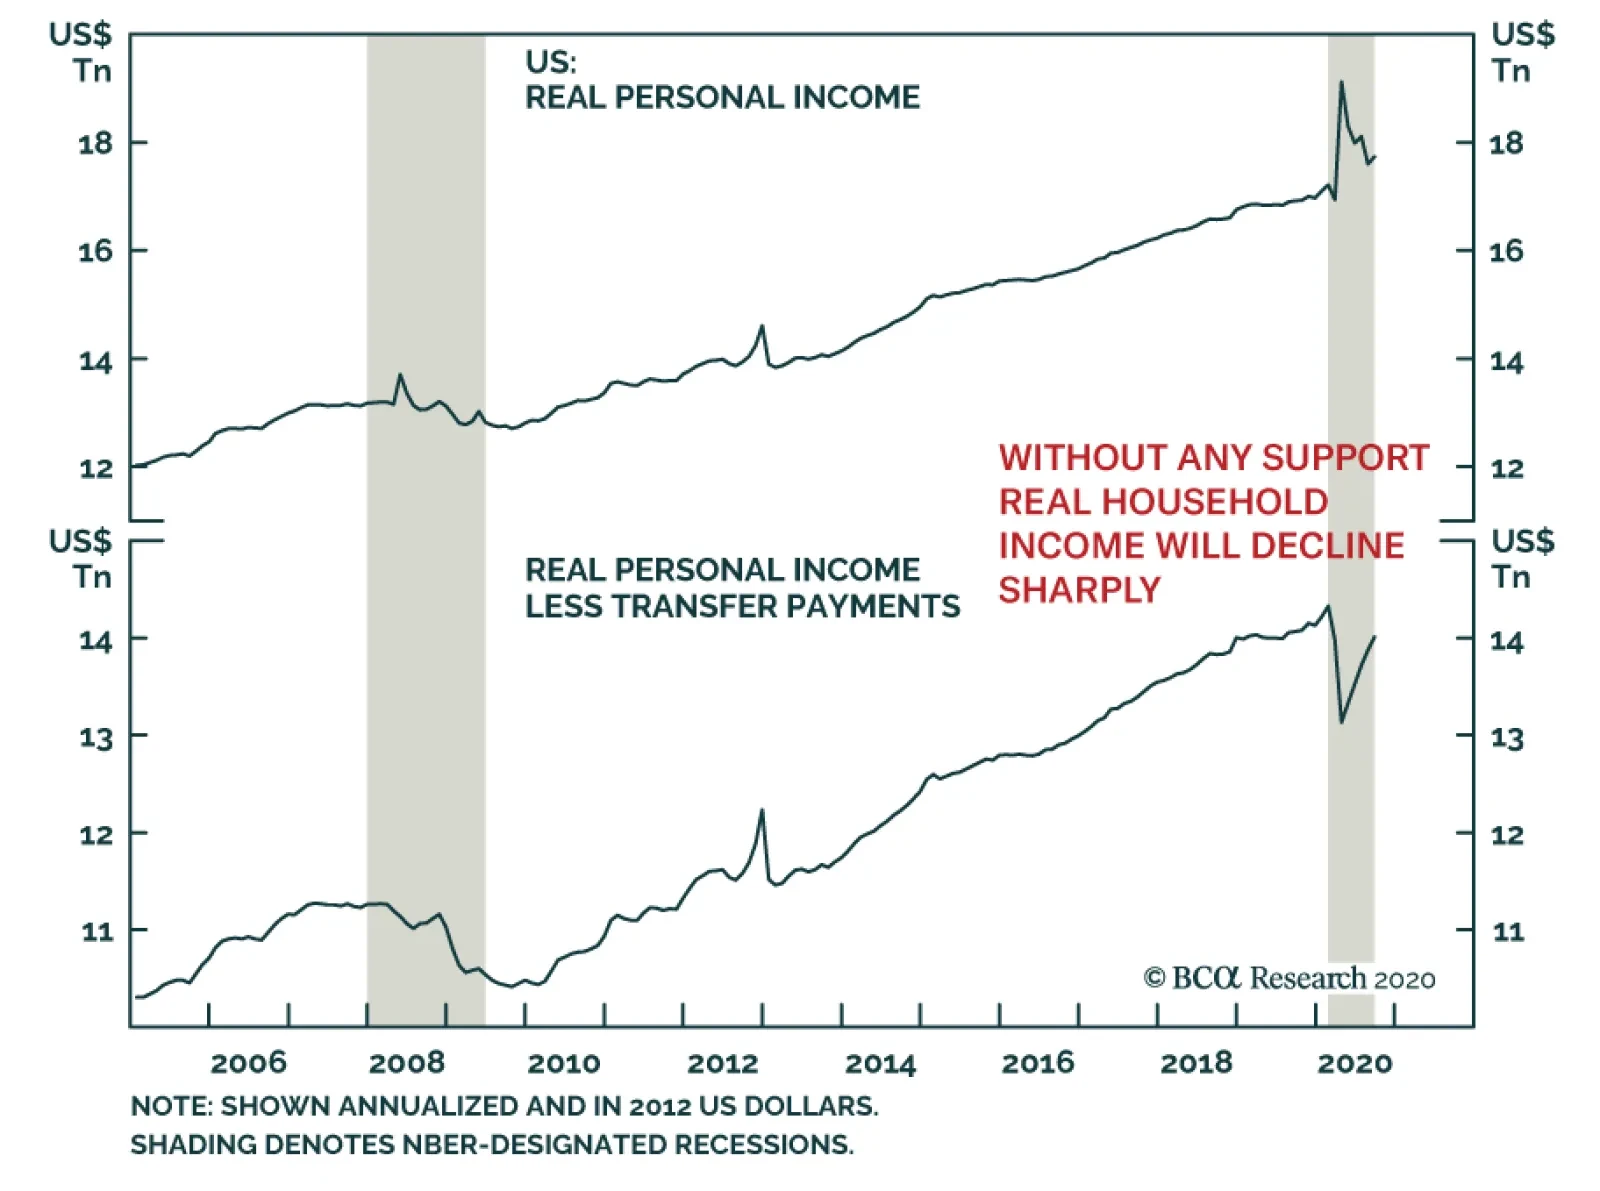
Chart 3Huge Fiscal Transfers And Sharply Reduced Spending Have Put Households On A Sounder Footing
Huge Fiscal Transfers And Sharply Reduced Spending Have Put Households On A Sounder Footing
Huge Fiscal Transfers And Sharply Reduced Spending Have Put Households On A Sounder Footing
With COVID-19 infections surging even before the clocks were turned back and the bulk of the country had yet to contend with wintry temperatures, a consumption surge is unlikely. Holiday travel, to highlight one seasonal component of spending, will likely be very weak. When the personal income data came out Friday morning, however, we could not help but think that households’ need for the next round of stimulus may not be quite so pressing (Chart 3). Fiscal support from Washington is desperately needed at the state and local government level, however, and the longer it is withheld, the greater the likelihood that public employee layoffs will erode many households’ savings cushion. While the flow of fiscal aid has slowed and will continue to slow once funding for the $400 weekly UI supplement patch is exhausted, CARES Act assistance also had a stock effect that has not yet played out. Households built a war chest of savings that may be able to tide them over for longer than the consensus of observers assume. Investors have benefited from betting on policymakers so far this year, and we will continue to do so. We expect that the next round of stimulus, whenever it arrives, will turn out to be bigger than it needs to be. That may not be ideal for markets and the economy in the long run, but we expect it will be very good for the former over the next year or two. Investment Implications The available data paint an encouraging portrait of aggregate household financial conditions through the end of September. Solid October apartment rent collections support the view that nothing changed too much last month, and the personal income release showed that households continued to add to their formidable war chest of pandemic savings through September. Aggregate data can mask isolated soft patches, and it is possible that unemployed households are nearing the end of their rope three months after receiving the last of their supplemental benefit checks. From that perspective, it was encouraging to learn that pawn shop owners and other small-dollar lenders have been as lonely as the Maytag repairman. They represent lower-income households’ last resort for making ends meet and the 50% year-over-year falloff in their business suggests that the beneficial effects of the CARES Act’s support for the highest marginal-propensity-to-consume households have not run out. It's been a lousy recession for pawn brokers, debt collectors and repo men so far, and it won't get any better if Washington delivers a new round of aid soon after Election Day or Inauguration Day, as we expect. With COVID-19 gathering fresh momentum in the US and Europe, the policymakers-versus-the-virus framework that has guided our thinking since the spring remains as relevant as ever. The Fed has done nearly all it can, leaving the fight from here to fiscal policymakers. While the January makeup of Congress and the White House is highly uncertain, most Senate/White House combinations point to a sizable fiscal package soon after the election or the inauguration. We therefore remain sanguine about the prospects for risk assets over our cyclical twelve-month timeframe, even if there are some near-term bumps before the election dust settles and an effective vaccine can be developed. We reiterate our tactical (equal weight equities, underweight fixed income and overweight cash) and cyclical recommendations (overweight equities, underweight fixed income and equal weight cash), along with our below-benchmark duration recommendation within bond portfolios. Doug Peta, CFA Chief US Investment Strategist dougp@bcaresearch.com Footnotes 1 The study with the data, "Update: COVID-19 Impact Study on Small-Dollar Lending," is available at https://www.veritecs.com/update-covid-19-impact-study-on-small-dollar-lending/. Accessed October 27, 2020.
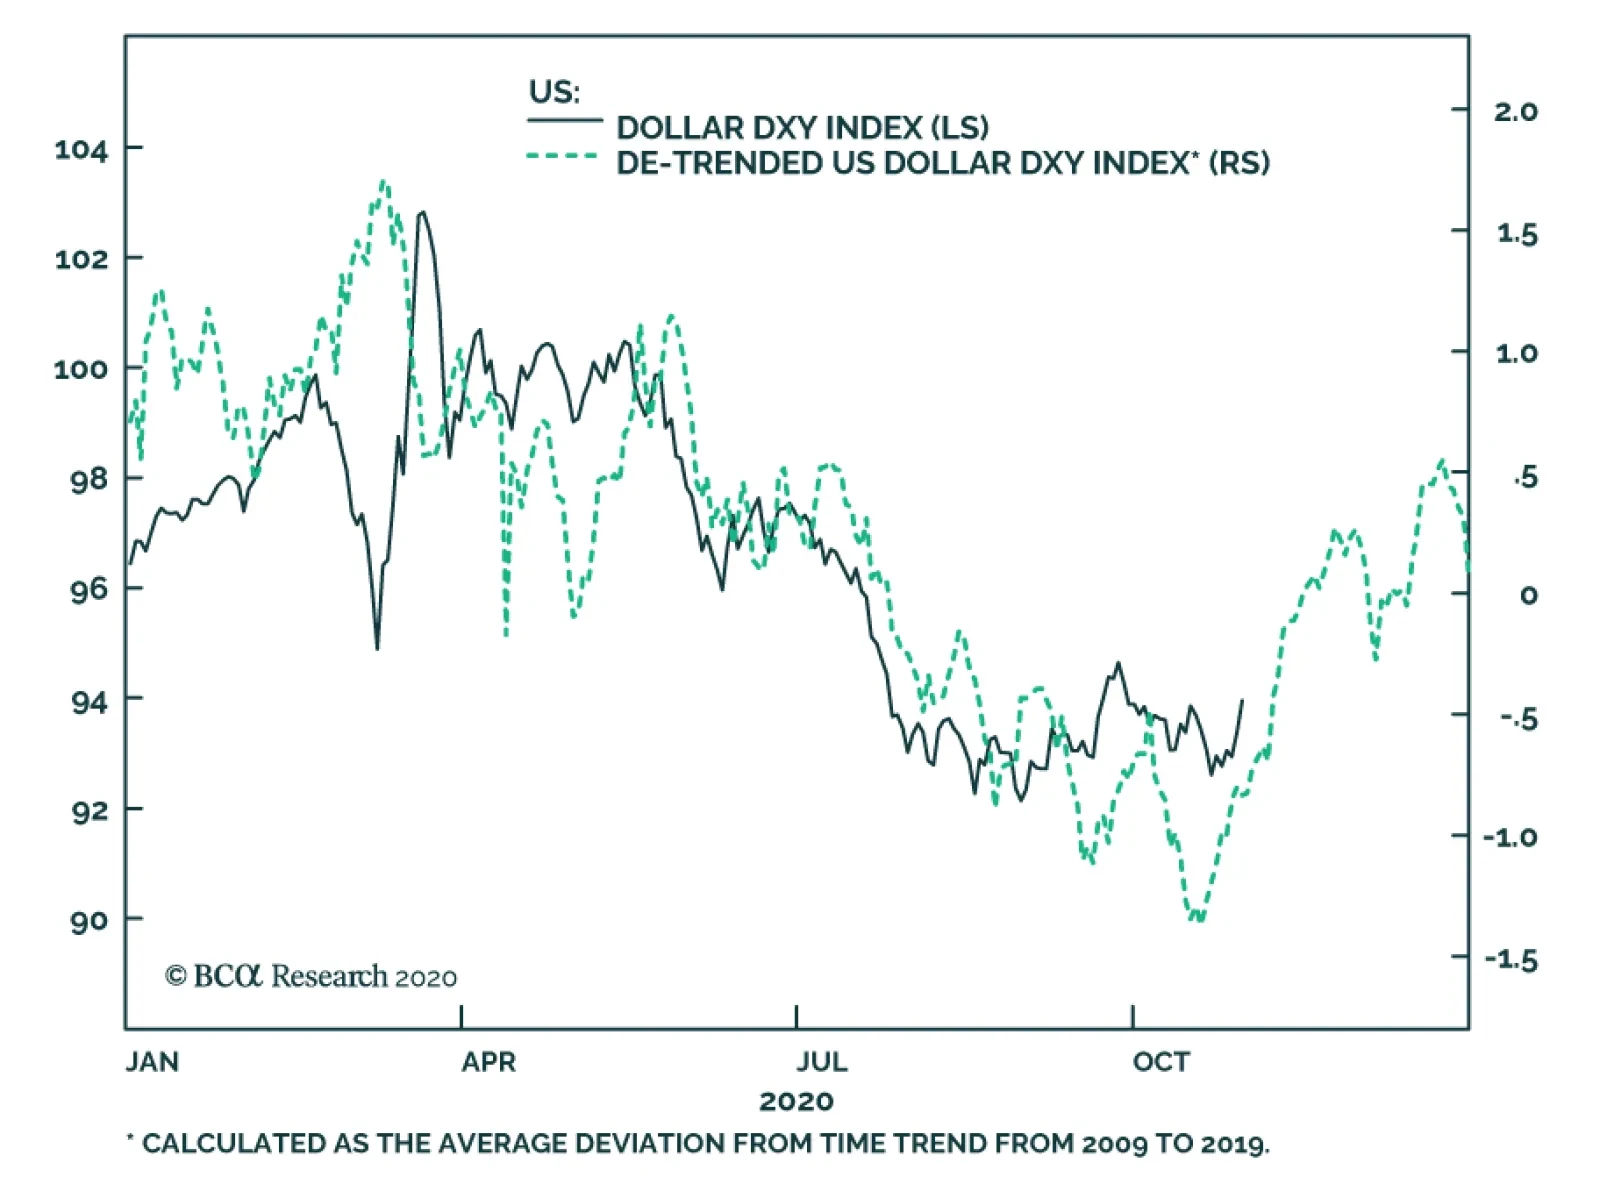
Your feedback is important to us. Please take our client survey today. Highlights The long-term outlook for the dollar is bearish, but fresh shorts could be offside over the next one to three months. An uptick in US political uncertainty adds to our bullish dollar view over the next month. Stay short USD/JPY as a core holding for now. Beyond the near term, the Scandinavian currencies are best positioned for outperformance over the next 12 months. Silver is selling off relative to gold. Being long silver is a long-term bet that will pay handsome returns, but stand aside for now. Feature November is seasonally a good month for the dollar, and this year could well prove no exception (Chart I-1). Just a few days ago, the market consensus was that the dollar would decline irrespective of who sits in the Oval Office next year. A few days later and the market woke up to the realization that such a “heads I win, tails I win” bet rarely pans out smoothly. We have been very sympathetic to a dollar-bearish view over the long term, but as we highlighted last week, a few indicators have not passed our smell test, setting up the potential for a knee-jerk dollar rally. To add to this thesis, the rise in the greenback this week (and bloodbath in financial markets) has eerie historical echoes with the recent past. Remarkably, since the 2009 global financial crisis and the ensuing 2011 dollar bull market, the greenback has tended to stage its most powerful rallies into year-end. Chart I-2 shows that even after adjusting for the dollar uptrend over the last decade, November to January have proven to be very good months for dollar-long positions. This was particularly notable in 2009, 2011, 2014 and 2017 (Chart I-3). Chart I-1The Dollar Loves November
The Dollar In A Market Reset
The Dollar In A Market Reset
Chart I-2The Dollar Since GFC
The Dollar Since GFC
The Dollar Since GFC
Chart I-3The Dollar Is Oversold
The Dollar Is Oversold
The Dollar Is Oversold
We are no technical experts, but could this time be different, especially given so many uncertainties clouding the investment outlook? And if so, what are other catalysts for a dollar bounce, other than those penned in report last week? What Could Be Different? Chart I-4The Dollar Rally Occurs In Two Phases
The Dollar Rally Occurs In Two Phases
The Dollar Rally Occurs In Two Phases
Crises are rarely solved with one silver bullet. Historians can try to justify this over the last several centuries, but for the dollar call, it is instructive to simply re-examine the significant events we have lived through since the Great Financial Crisis. Enter 2008. The dollar rally occurred in two phases. The first phase prompted the US authorities to act by dropping interest rates, which dampened the rally and stimulated reflation. When the crisis proved bigger than the authorities expected, indiscriminate liquidation by financial market participants eventually prompted more action (Chart I-4). To be specific, the US first introduced swap lines with a select few central banks in December 2007 in response to the dollar crisis following the collapse of the housing market. These swap lines allowed foreign central banks to draw on dollar liquidity directly from the Federal Reserve and use this to provide credit to domestic concerns. However, from March to October 2008, the dollar soared by about 25%, since the swap lines did not include emerging markets. This prompted the Fed to expand its swap lines to include more developed-market participants and some emerging market countries. When the crisis proved bigger than the authorities expected, indiscriminate liquidation by financial market participants eventually prompted more action. If we consider the situation today, we can all agree that the nature of the crisis is quite different from 2008, but the severity is as important, if not greater. However, similar to 2008, the Fed only has swap lines with 14 central banks. Moreover, the six-month original window is expiring. Granted, cross-currency basis swaps do not suggest any imminent danger (Chart I-5). Nevertheless, emerging market countries like South Africa, Turkey, India, Indonesia, and Russia do not have direct access to dollar liquidity from the Fed and are at risk to torpedo the dollar decline. Chart I-5No Funding Stresses For Now
No Funding Stresses For Now
No Funding Stresses For Now
In short, many emerging market central banks do not have swap agreements with the US. These are countries with huge dollar liabilities that could continue to see their currencies fall, pushing up the aggregate dollar index. Developed market commodity currencies tend to be highly correlated with emerging market currencies, so this dynamic is very important for the US dollar call (Chart I-6). Meanwhile, there is a huge pool within the financial architecture unable to access funding through central bank swap lines. To be exact, around 60% of outstanding foreign exchange swaps/forwards are among non-bank financial and other institutions. Hedge funds are included in this group, and they entail a lot more credit risk than any central bank would be willing to bear. Then there is the Fed’s FIMA facility. This is a temporary repo facility for foreign and international monetary authorities (FIMA) that allows account holders to temporarily exchange their Treasury securities held with the Fed for US dollars. However, the pool of Treasury securities available to swap for US dollars has shrunk significantly. This has been on the back of slowing global trade and conscious diversification of reserves by offshore concerns (Chart I-7). Chart I-6EM And DM Currencies
EM And DM Currencies
EM And DM Currencies
Chart I-7A Smaller Pool Of Treasurys To Sell
A Smaller Pool Of Treasurys To Sell
A Smaller Pool Of Treasurys To Sell
The bottom line is that there is a window between a crisis and action by the Fed that could exacerbate the knee-jerk rally in the US dollar, as we have been highlighting in recent weeks. For now, there remains ample room for foreign central banks to draw on dollar liquidity (Chart I-8). As such, the dollar bounce will be an opportunity to establish fresh short positions rather than signal a renewed bull market. Chart I-8Ample Swap Liquidity
Ample Swap Liquidity
Ample Swap Liquidity
Currency Positions US Dollar: A temporary dip in inflation expectations in the US will boost real rates and encourage flows back into US fixed-income assets. The drop in oil prices, which has been moving neck in neck with US inflation expectations, corroborates this view (Chart I-9). The DXY could easily touch 96 before consolidating gains. Chart I-9US Inflation Expectations Could Drop
US Inflation Expectations Could Drop
US Inflation Expectations Could Drop
Euro: It remains unclear the disbursement of the funds from the pandemic emergency purchase program (PEPP). In the meantime, the European Central Bank stood pat today, confirming the narrative that Europe might be out of monetary bullets and fiscal policy is needed to revive animal spirits. This could cause air pocket for EUR/USD, which could touch 1.15 before rebounding. Yen: The yen is a perfect “heads I win, tails I don’t lose much bet.” Japan is one of the few countries offering positive real rates (Chart I-10). Switzerland also falls in that category. In a world that can temporarily dip into deflation, one might prefer to be in US dollars, but the yen and Swiss franc will also hold up nicely. Chart I-10Only In Japan And Switzerland
The Dollar In A Market Reset
The Dollar In A Market Reset
Loonie: Our colleagues at the Daily Insights summarized the Bank Of Canada’s actions this week as technical and not fundamental (Chart I-11). With no real change in monetary policy, Canadian asset prices will remain dominated by global trends. The CAD has cyclical upside versus the USD, as we wrote about, but the current period of market tumult should push the loonie lower in the coming month or two. Chart I-11Canada Versus US
Canada Versus US
Canada Versus US
Scandinavian currencies: The NOK and SEK have borne the brunt of the dollar decline so far and will bounce the most once reflation is back in play. We have a limit buy order on Nordic currencies should they decline further (Chart I-12). Chart I-12Dollar Seasonality
The Dollar In A Market Reset
The Dollar In A Market Reset
Relative Value: Focus on relative value at the crosses rather than outright dollar bets. We are short the NZD/CAD, CAD/NOK and EUR/GBP as plays on relative fundamentals. EUR/GBP remains at risk of a significant selloff if we get a Brexit deal. Oil currencies: Remain long petrocurrencies versus the euro, but we are looking to use the tactical bounce in the dollar to shift to USD shorts. Silver: Short-term investors should stand aside on silver for now. The bullish thesis remains intact but volatility will rise in the short term. Chester Ntonifor Foreign Exchange Strategist chestern@bcaresearch.com Currencies U.S. Dollar Chart II-1USD Technicals 1
USD Technicals 1
USD Technicals 1
Chart II-2USD Technicals 2
USD Technicals 2
USD Technicals 2
Recent data from the US have been positive: GDP recovered by 33.1% quarter-on-quarter on an annualized basis in Q3. The Markit Manufacturing PMI marginally increased from 53.2 to 53.3 in October. The services PMI also increased, from 54.6 to 56. The Chicago Fed National Activity Index declined from 1.11 to 0.27 in September. Initial jobless claims increased by 751K for the week ending on October 23rd. The DXY index increased by 1% this week alongside the equity market correction, impacted by the looming US elections and increasing number of COVID-19 cases. Our Geopolitical strategists have upgraded Trump’s odds of winning from 35% to 45%, though major opinion polls still favor a Biden victory. Our bias is that a Biden win will likely increase fiscal stimulus and decrease economic and trade policy uncertainties, which is bearish for the US dollar. Report Links: A Few Market Observations - October 23, 2020 Does The US Save Too Much Or Too Little? - October 16, 2020 Tail Risks In FX Markets - October 2, 2020 The Euro Chart II-3EUR Technicals 1
EUR Technicals 1
EUR Technicals 1
Chart II-4EUR Technicals 2
EUR Technicals 2
EUR Technicals 2
Recent data from the euro area have been mixed: The Markit Manufacturing PMI increased from 53.7 to 54.4 in October. However, the Services PMI declined from 48 to 46.2. M3 money supply surged by 10.4% year-on-year in September. The Economic Sentiment Indicator was unchanged at 90.9 in October. The euro plunged by 1.4% against the US dollar this week. On Thursday, the ECB held its key interest rate unchanged at -0.5% despite re-imposed lockdown measures against surging COVID cases in Europe. However, it also hinted that there could be additional policy action and more stimulus in December should conditions worsen. Report Links: Addressing Client Questions - September 4, 2020 On The DXY Breakout, Euro, And Swiss Franc - February 21, 2020 Updating Our Balance Of Payments Monitor - November 29, 2019 Japanese Yen Chart II-5JPY Technicals 1
JPY Technicals 1
JPY Technicals 1
Chart II-6JPY Technicals 2
JPY Technicals 2
JPY Technicals 2
Recent data from Japan have been positive: The Jibun Manufacturing PMI increased from 47.7 to 48 in October. The Coincident Index rose from 78.3 to 79.2 in August. The Leading Economic Index also ticked up from 86.7 to 88.4. Retail trade fell by 8.7% year-on-year in September. The Japanese yen depreciated by 0.3% against the US dollar this week amid market volatilities. With relatively higher real interest rates, a current account surplus and cheaper valuation, the Japanese yen is our favorite safe-haven currency. We continue to recommend holding the Japanese yen as a portfolio hedge for surfing election and COVID waves. On a separate note, the BoJ kept its interest rate on hold this Thursday. The Bank also weakened its economic forecast for this year but upgraded the economic recovery outlook. Report Links: The Near-Term Bull Case For The Dollar - February 28, 2020 Building A Protector Currency Portfolio - February 7, 2020 Currency Market Signals From Gold, Equities And Flows - January 31, 2020 British Pound Chart II-7GBP Technicals 1
GBP Technicals 1
GBP Technicals 1
Chart II-8GBP Technicals 2
GBP Technicals 2
GBP Technicals 2
Recent data from the UK have been mixed: Retail sales increased by 4.7% year-on-year in September. The Markit Manufacturing PMI declined from 54.1 to 53.3 in October. The services PMI fell from 56.1 to 52.3 in October. The British pound plunged by 1.5% against the US dollar this week amid broad USD strength. The latest PMI releases saw a steeper decline in the services industry. As UK’s services account for more than half of total economic output, it suggests that the pound is more exposed to second infection risks than other manufacturing-oriented economies. Report Links: Revisiting Our High-Conviction Trades - September 11, 2020 Updating Our Balance Of Payments Monitor - November 29, 2019 A Few Trade Ideas - Sept. 27, 2019 Australian Dollar Chart II-9AUD Technicals 1
AUD Technicals 1
AUD Technicals 1
Chart II-10AUD Technicals 2
AUD Technicals 2
AUD Technicals 2
Recent data from Australia have been positive: Imports fell by 1% month-on-month in September. Exports, however, increased by 3% month-on-month. The trade surplus widened from A$2.6 billion to A$5.1 billion. Headline CPI increased by 0.7% year-on-year in Q3, up from -0.3% the previous quarter. The Australian dollar fell by 1.5% against the US dollar this week. The pickup in inflation eased the RBA’s pressure to further ease monetary policy further. The expansion in the trade account surplus also bodes well for the Australian dollar in a reflationary environment. Report Links: An Update On The Australian Dollar - September 18, 2020 On AUD And CNY - January 17, 2020 Updating Our Balance Of Payments Monitor - November 29, 2019 New Zealand Dollar Chart II-11NZD Technicals 1
NZD Technicals 1
NZD Technicals 1
Chart II-12NZD Technicals 2
NZD Technicals 2
NZD Technicals 2
Recent data from New Zealand have been negative: Exports fell from NZ$4.4 billion to NZ$4 billion in September while imports expanded from NZ$4.7 billion to NZ$5 billion. The trade deficit therefore widened from NZ$282 million to NZ$1,013 million. The ANZ Business Confidence Index rose to -15.7 from -28.5 in October. The New Zealand dollar fell by 1.2% against the US dollar this week. The ANZ Activity Outlook Report said that “there was a mix of ups and downs” in recent developments and warned against higher economic and unemployment risks once the cushioning impact of the wage subsidy fades. Report Links: Currencies And The Value-Versus-Growth Debate - July 10, 2020 Updating Our Balance Of Payments Monitor - November 29, 2019 Place A Limit Sell On DXY At 100 - November 15, 2019 Canadian Dollar Chart II-13CAD Technicals 1
CAD Technicals 1
CAD Technicals 1
Chart II-14CAD Technicals 2
CAD Technicals 2
CAD Technicals 2
Recent data from Canada have been positive: Building permits increased by 17% month-on-month in September. The Canadian dollar plunged by 1.7% against the US dollar this week. Crude oil prices dropped by 12% this week amid worries about the second infection wave and prolonged travel restrictions, which represent a headwind for the Canadian dollar. On Wednesday, the Bank of Canada announced that it would keep interest rates on hold at 0.25% and maintain such low policy rates until the inflation objective is achieved. Moreover, the Bank is recalibrating the QE program to shift purchases towards longer-term bonds, which have a more direct influence on the borrowing rates for household and businesses. Report Links: Currencies And The Value-Versus-Growth Debate - July 10, 2020 More On Competitive Devaluations, The CAD And The SEK - May 1, 2020 A New Paradigm For Petrocurrencies - April 10, 2020 Swiss Franc Chart II-15CHF Technicals 1
CHF Technicals 1
CHF Technicals 1
Chart II-16CHF Technicals 2
CHF Technicals 2
CHF Technicals 2
Recent data from Switzerland have been negative: The ZEW Expectations Index plunged from 26.2 to 2.3 in October. Total sight deposits increased from CHF 705.1 billion to CHF 706.9 billion for the week ending on October 23rd. While the Swiss franc depreciated by 1% against the US dollar this week, it increased by 0.5% against the euro, which brings it close to our limit buy price of 1.06. An expensive currency is likely to impede growth for a small open economy like Switzerland, suggesting the SNB will step up its currency intervention. Prepare to go long EUR/CHF. Report Links: On The DXY Breakout, Euro, And Swiss Franc - February 21, 2020 Currency Market Signals From Gold, Equities And Flows - January 31, 2020 Portfolio Tweaks Before The Chinese New Year - January 24, 2020 Norwegian Krone Chart II-17NOK Technicals 1
NOK Technicals 1
NOK Technicals 1
Chart II-18NOK Technicals 2
NOK Technicals 2
NOK Technicals 2
Recent data from Norway have been positive: Retail sales increased by 0.3% month-on-month in September. The Norwegian krone plunged by 3.4% against the US dollar this week, making it the worst performing G10 currency. Despite recent market volatilities, we continue to favor the Norwegian krone in the long run based on its cheap valuation and a brighter energy outlook in the post-vaccine world. We are looking to rebuy the Nordic currencies on weakness. Report Links: Revisiting Our High-Conviction Trades - September 11, 2020 A New Paradigm For Petrocurrencies - April 10, 2020 Building A Protector Currency Portfolio - February 7, 2020 Swedish Krona Chart II-19SEK Technicals 1
SEK Technicals 1
SEK Technicals 1
Chart II-20SEK Technicals 2
SEK Technicals 2
SEK Technicals 2
Recent data from Sweden have been positive: The trade balance shifted from a deficit of SEK 2.1 billion to a surplus of SEK 2.6 billion in September. Consumer confidence increased from 88.4 to 90 in October. Retail sales increased by 3.9% year-on-year in September. PPI fell by 4.2% year-on-year in September. The Swedish krona decreased by 1.9% against the US dollar this week. While COVID cases have been resurging in Sweden, Sweden’s services is lower, as a % of GDP, than other major euro area countries and therefore less exposed to the risk of a second wave. We continue to recommend the Swedish krona from a cyclical perspective. Kelly Zhong Research Analyst Report Links: Revisiting Our High-Conviction Trades - September 11, 2020 Updating Our Balance Of Payments Monitor - November 29, 2019 Where To Next For The US Dollar? - June 7, 2019 Trades & Forecasts Forecast Summary Core Portfolio Tactical Trades Limit Orders Closed Trades
According to BCA Research's Foreign Exchange Strategy service, the long-term outlook for the dollar is bearish, but the next one to three months do not offer an appropriate reward-to-risk ratio to deploy fresh shorts. An uptick in US political uncertainty…
The US personal income and outlays report for September highlighted that consumption continues to improve, but government help remains essential to support expenditures over the coming quarters. In September, spending increased 1.2% on a monthly…
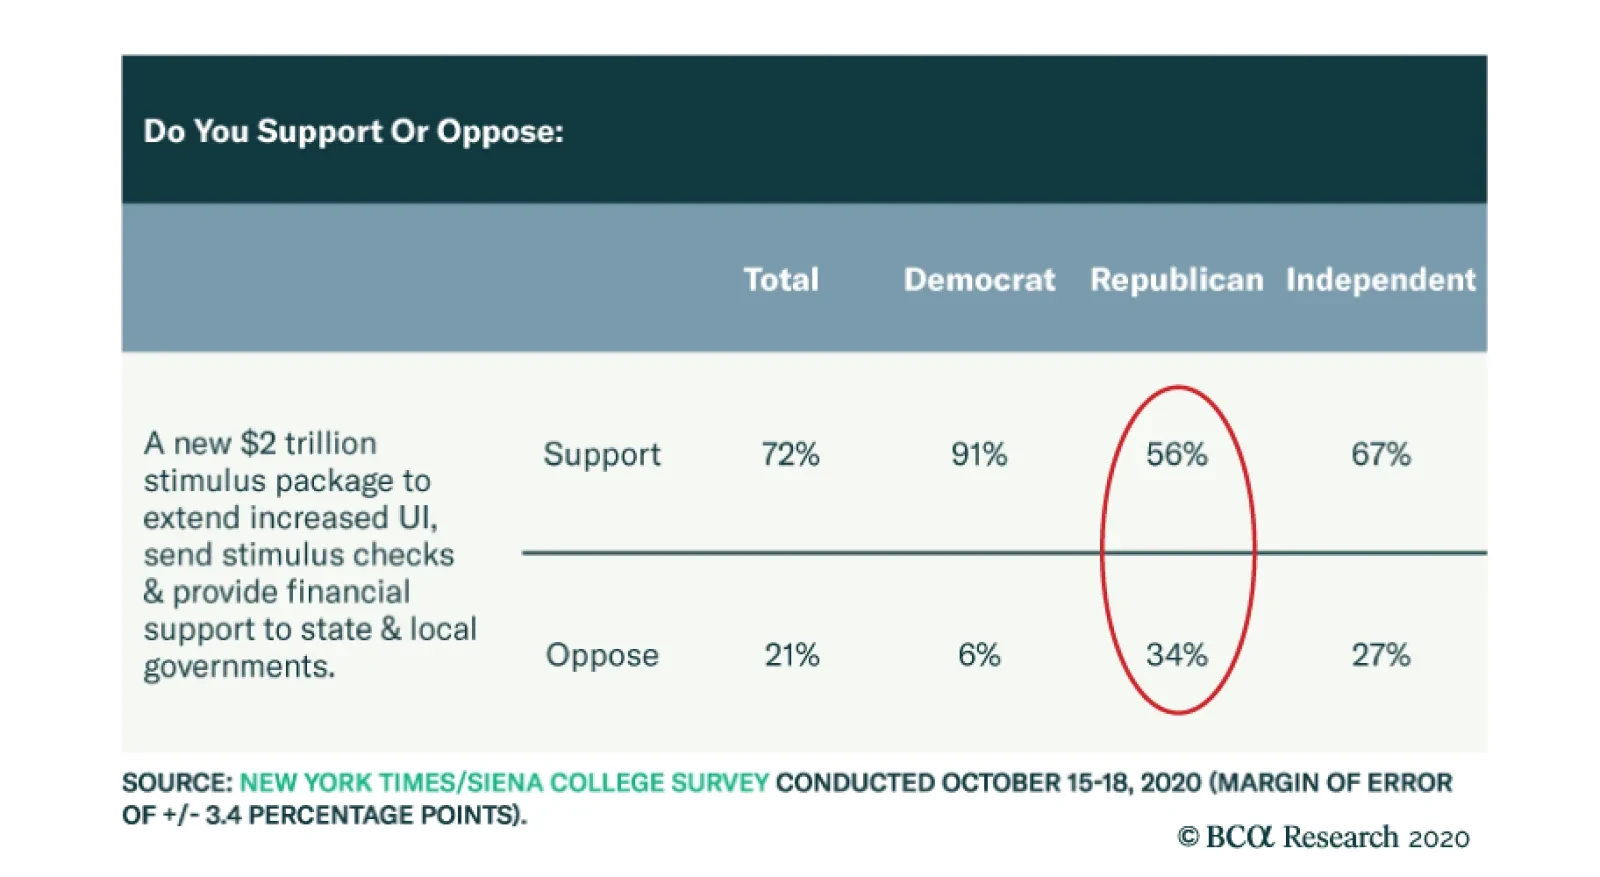
The US election is upon us and the political uncertainty is extremely elevated. Our geopolitical strategist assigns a mere 27% probability to a Blue Sweep and a 28% probability of a Biden White House with a GOP senate. Meanwhile, the odds of a Trump win are…