United States

One-Way Ticket For Staples Stocks
One-Way Ticket For Staples Stocks
Your feedback is important to us. Please take our client survey today. Underweight In yesterday’s US Equity Sector Insight we highlighted why investors should stay on the sidelines when it comes to the defensive S&P household products index. But, with regard to the broader S&P consumer staples sector, our view remains that over the next 9-12 months this safe haven sector, which peaked in the depths of the COVID-19 recession, will continue to underperform. As the pandemic-induced recession disappears from the rear-view window, it no longer pays to favor stable cashflow growth staples companies. In fact, our relative macro earnings model paints a dark picture for this GICS1 sector (middle panel). Among other reasons, one of the factors that will drive relative earnings lower is the weaker US dollar. As a reminder, the S&P consumer staples sector derives approximately 32% of its sales from abroad, which is 10 percentage points lower than the S&P 500. As a consequence, on a relative basis staples stocks cannot benefit from positive currency tailwinds to the same extent as the overall market can. Bottom Line: We remain underweight the S&P consumer staples sector.
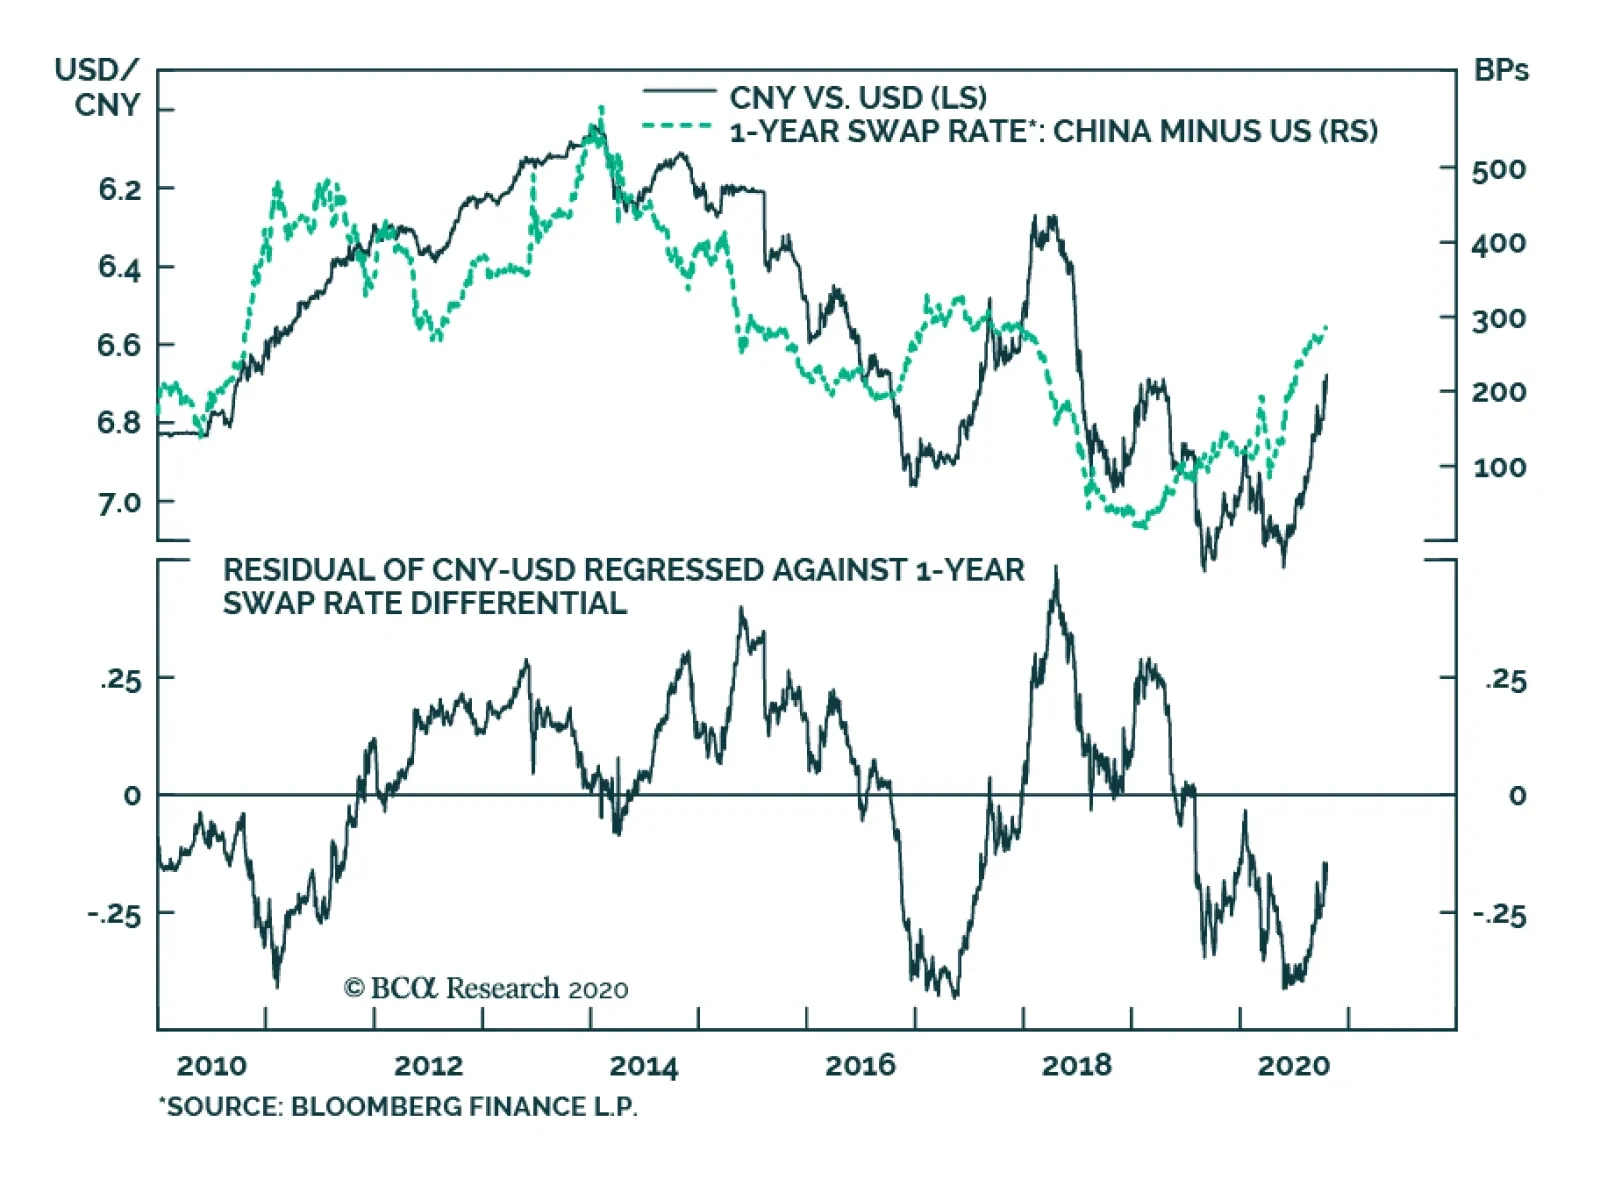
Adjusted for volatility, the rise in CNY-USD over the past month has been among the largest moves in global financial markets. While some of this can be attributed to a decline in the US dollar, the RMB is also up meaningfully against the euro and an…
Caught In The Crosscurrents
Caught In The Crosscurrents
Neutral We remain neutral the S&P household products index. A V-shaped economic recovery following a recession has historically been synonymous with this defensive industry underperforming (top panel). However, the uniqueness of the current recession must be taken into account. The US consumer continues to binge on household products, which are currently outpacing overall retail sales growth by 13% year-over-year (middle panel, relative consumer spending shown truncated). This trend is slated to continue until a vaccine arrives as the second wave of infections emerges. The same story holds for foreign consumers who also have an incentive to keep up their spending on US household products: a softer US dollar. A weaker US dollar will boost competitiveness of US exporters, which will translate into robust top line growth (bottom panel). Bottom Line: Given the strangeness of the current recession, we remain neutral the S&P household products index. The ticker symbols for the stocks in this index are: BLBG: S5HOPR – PG, CL, KMB, CLX, CHD.
BCA Research's Global Fixed Income Strategy & US Bond Strategy services estimate that the combined probability of scenarios that will put upward pressure on US Treasury yields is 80%, versus a 20% probability of a more bond-neutral outcome. That is a…
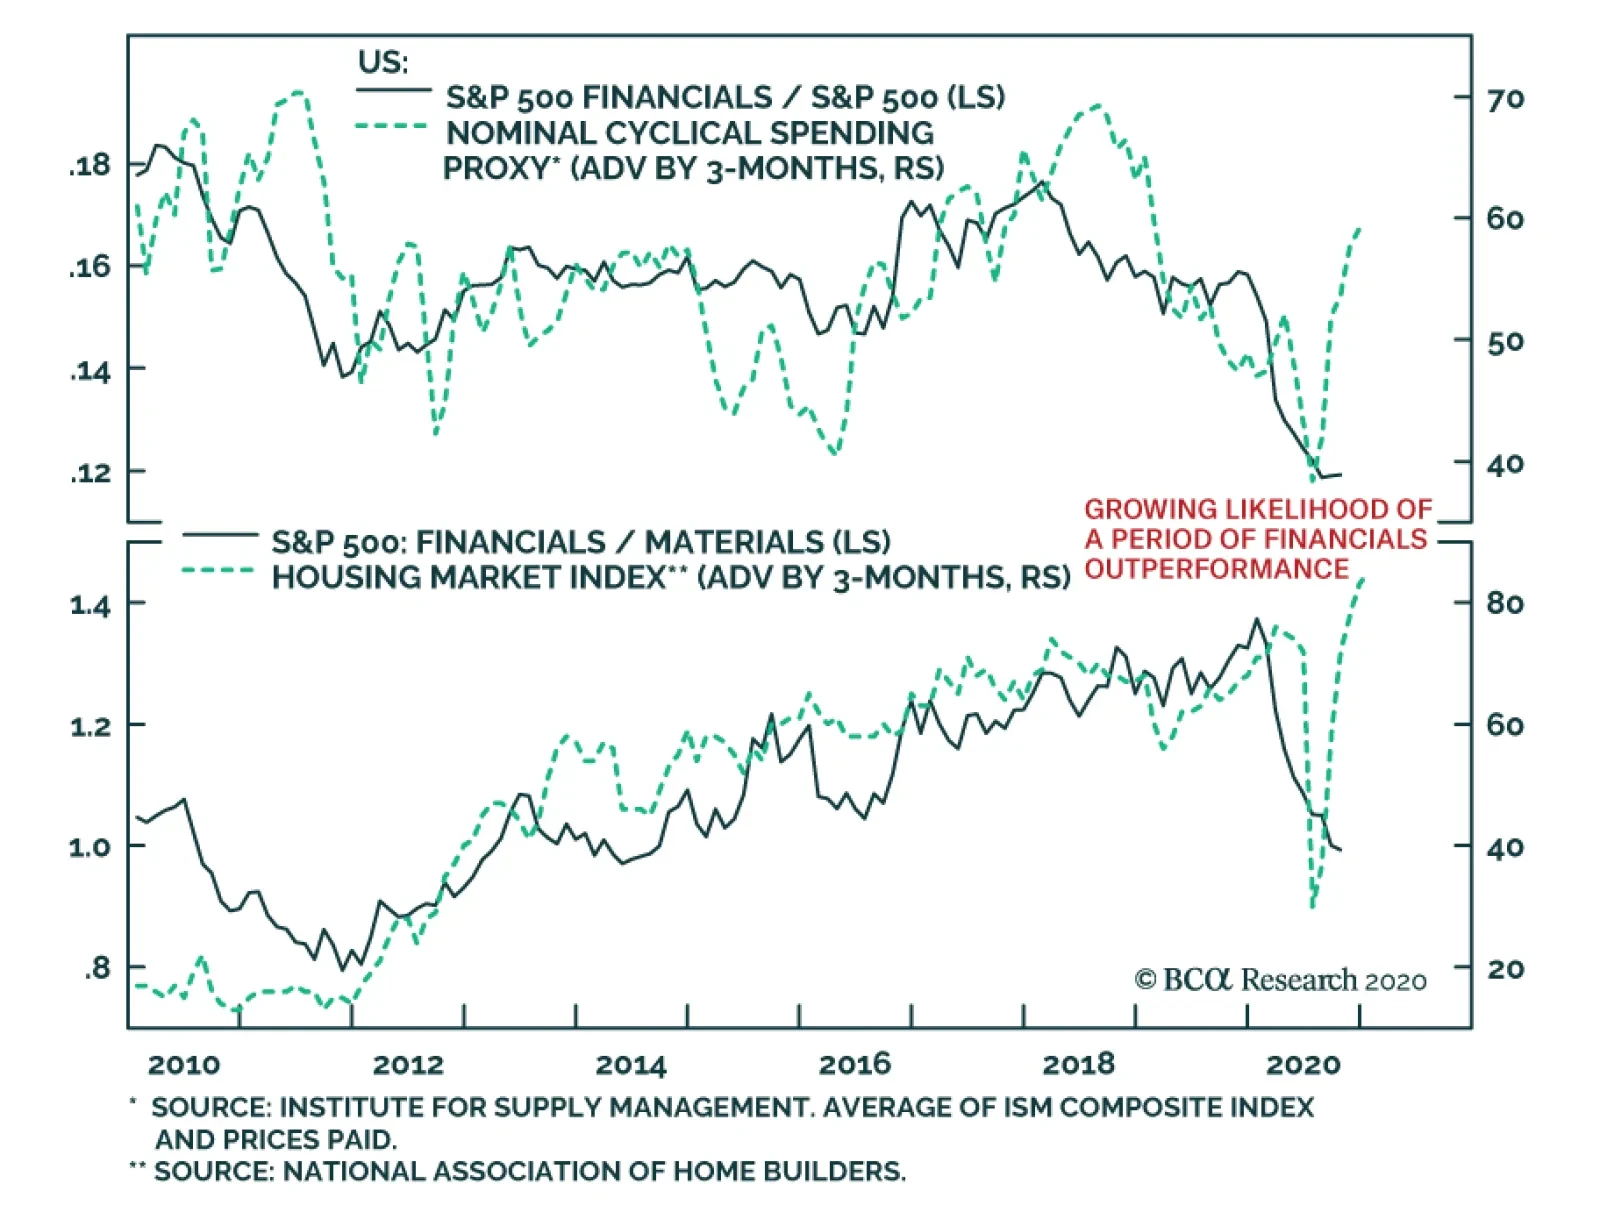
Financials have been the most lagging cyclical sector during the recovery. Low yields, rising loss provisions, dividend cuts and fears surrounding the future loan growth have all conspired to hurt this important sector. Is there some light at the end of the…
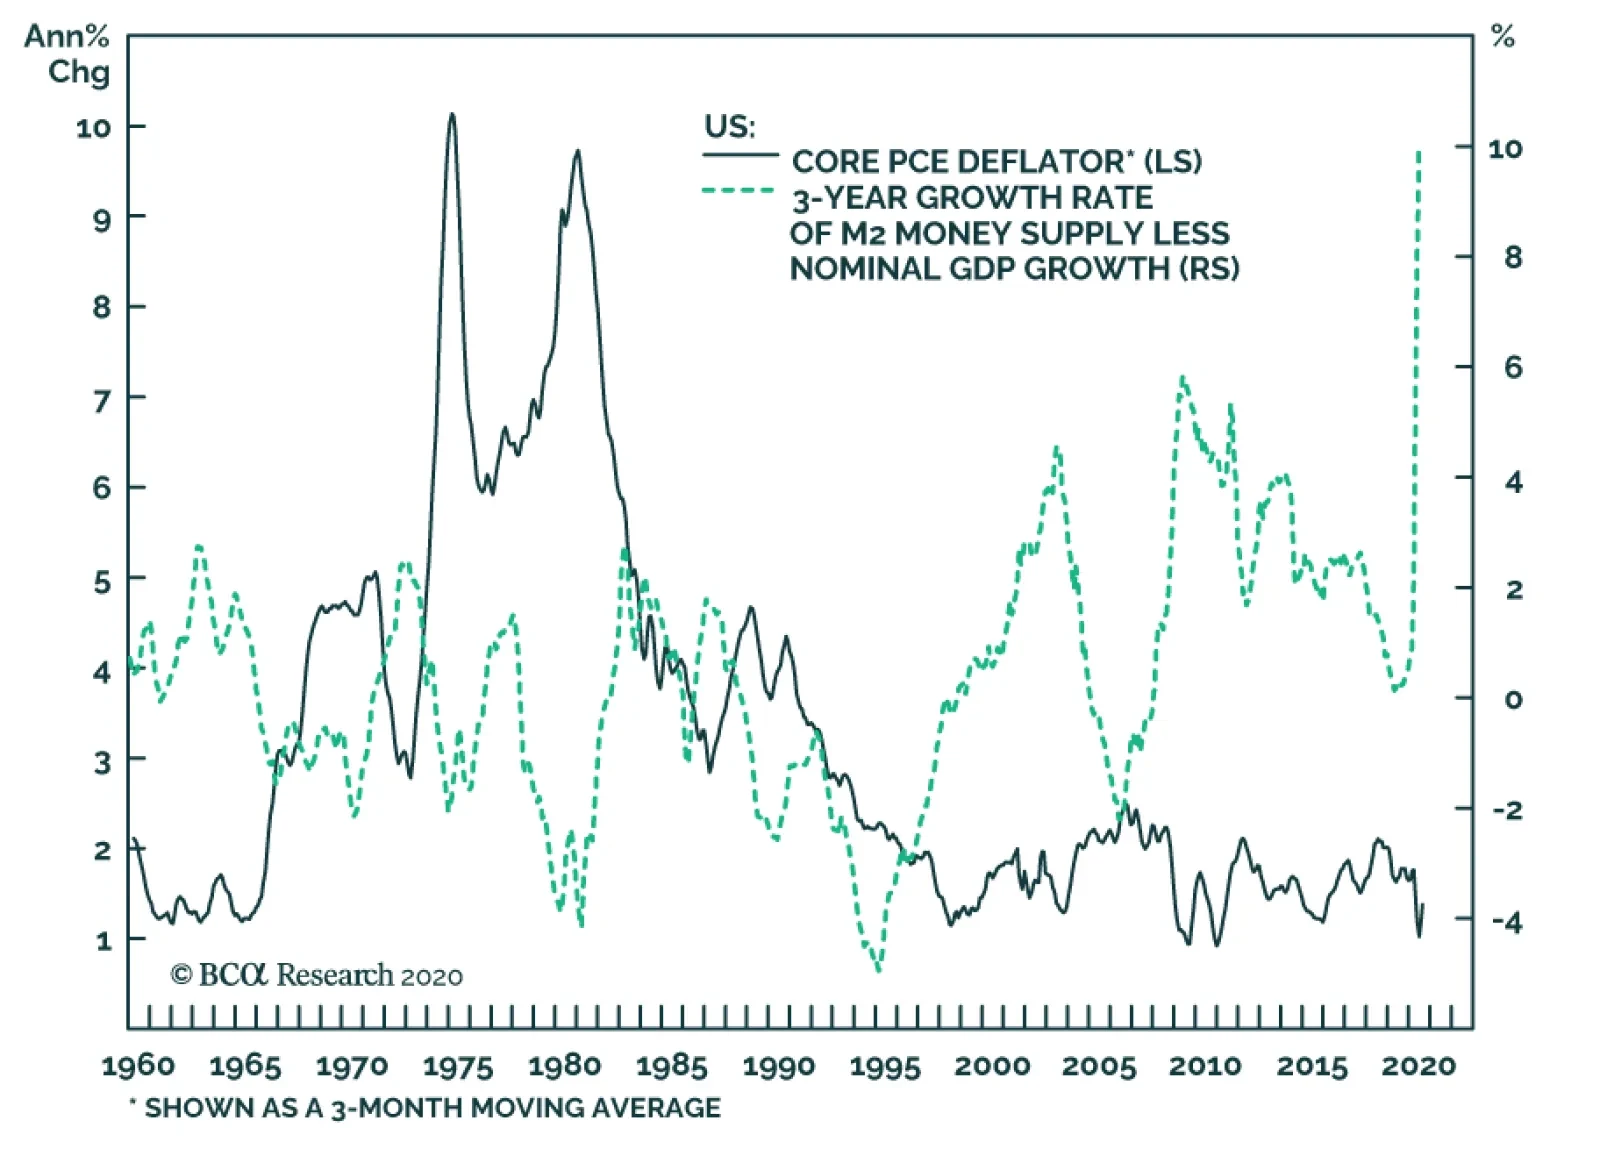
Investor concerns about the potential for inflation have increased significantly over the past several months, in response to large increases in government debt-to-GDP ratios in countries around the world. In addition, the very sharp rise in M2 growth in the…
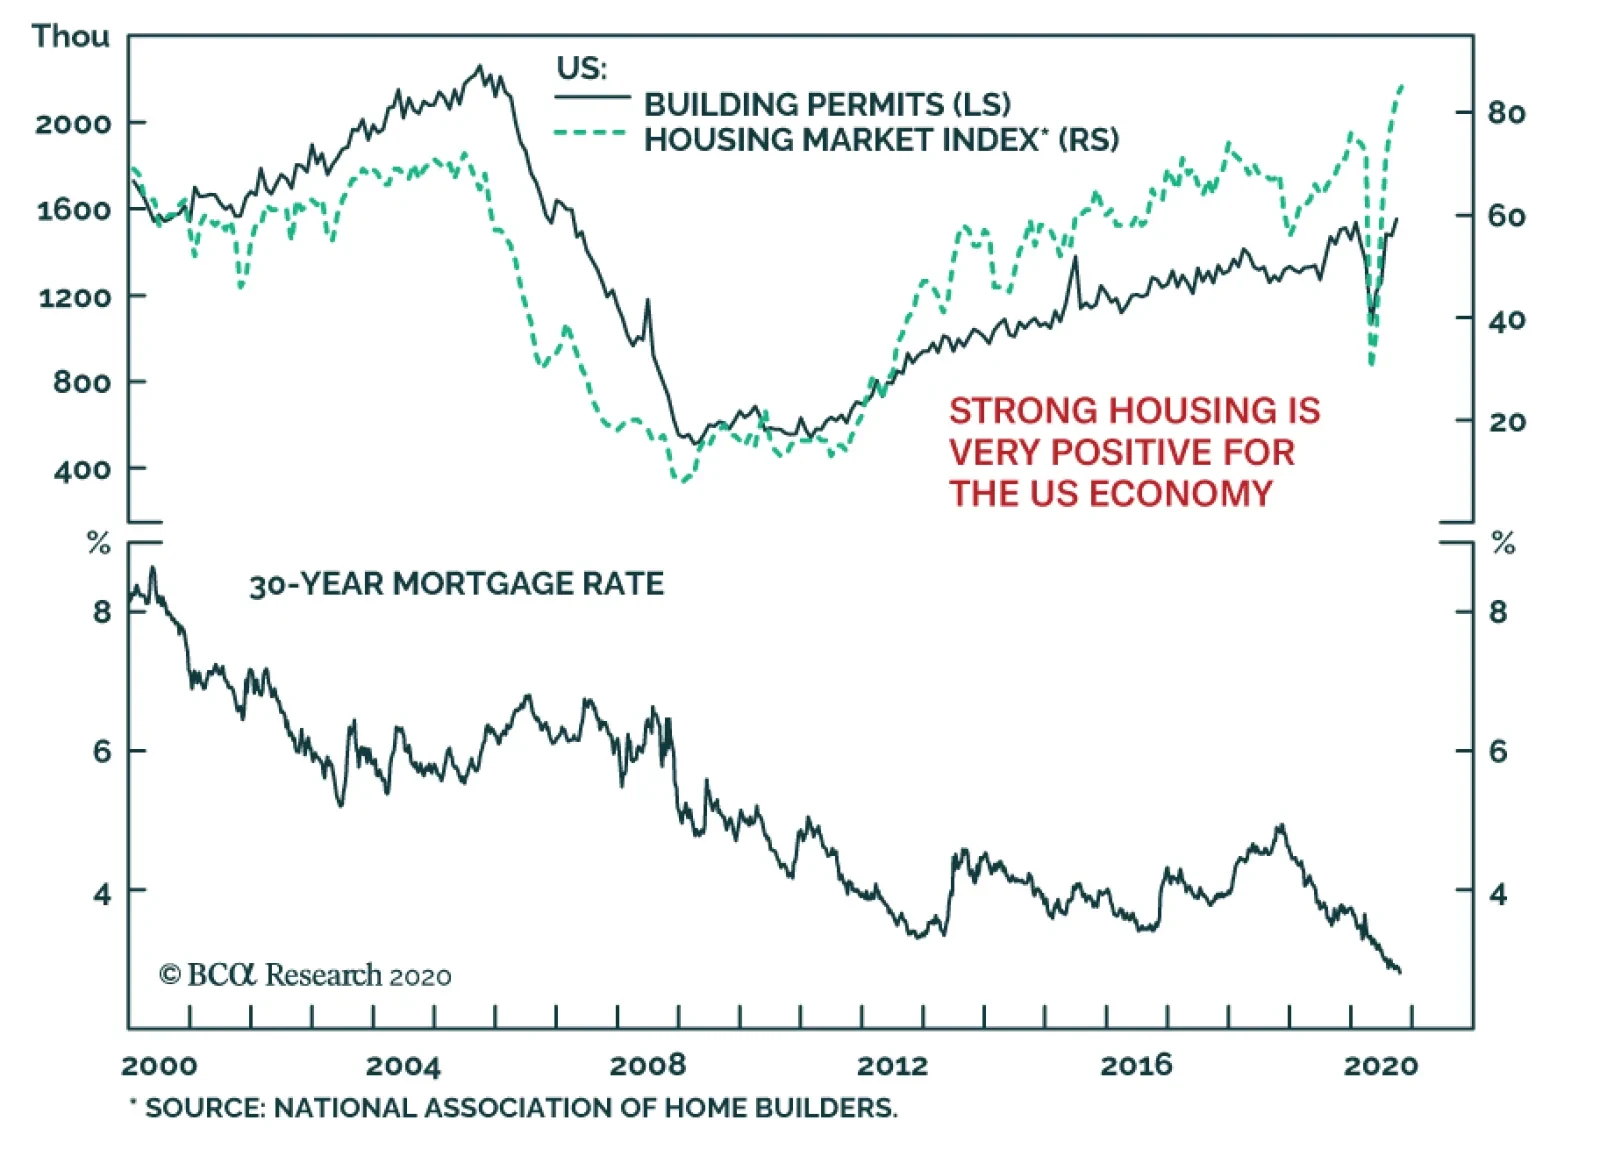
The housing recovery remains a key locomotive of the US economy. While the September housing starts fell short of expectations of 1.47 million units, they nonetheless grew 1.9% on a monthly basis. Moreover, the leading building permits series rose to 1.55…
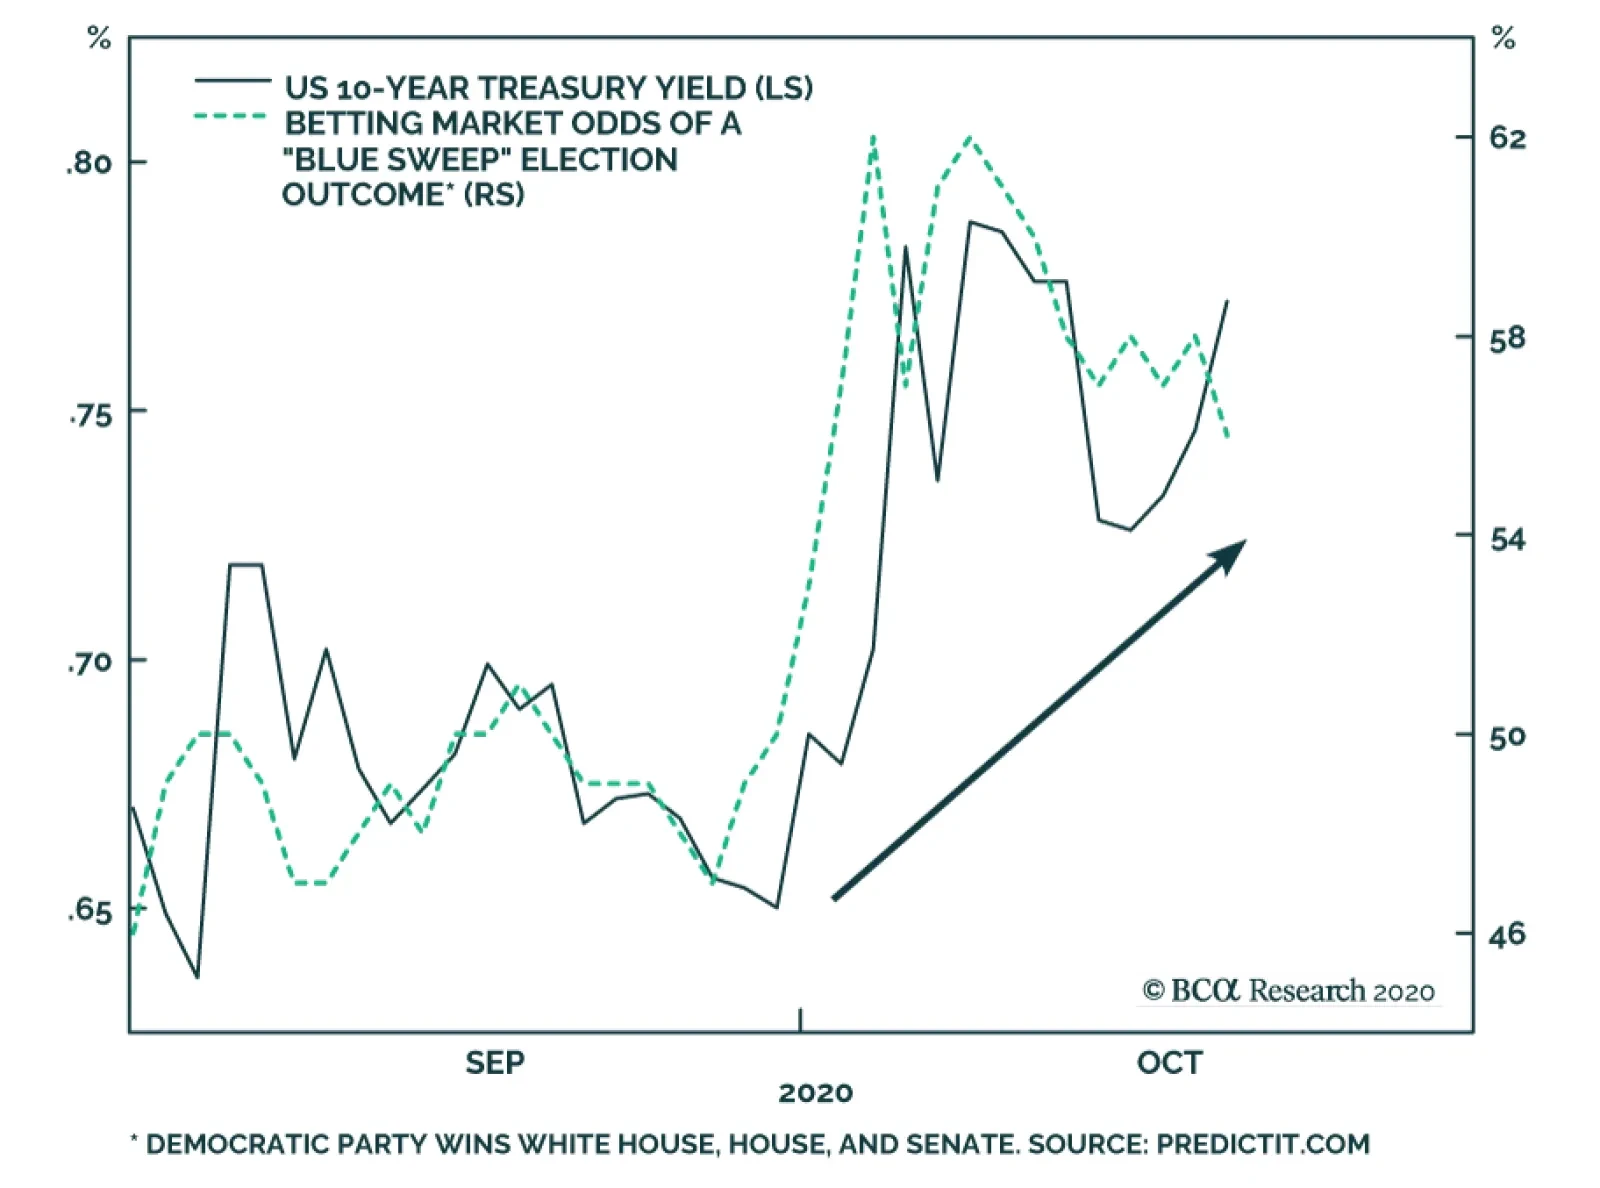
Highlights US Election & Duration: We estimate that there is an 80% probability of a US election result that will give a lift to US Treasury yields via increased fiscal stimulus. Those are strong enough odds to justify a move to a below-benchmark cyclical US duration stance on a 6-12 month horizon. US Treasuries: We anticipate a moderate bear market in US Treasuries to unfold during the next 6-12 months. In addition to below-benchmark portfolio duration, investors should overweight TIPS versus nominal Treasuries, hold nominal and real yield curve steepeners, and hold inflation curve flatteners. Non-US Country Allocation: Within global government bond portfolios, downgrade the US to underweight. Favor countries that have lower sensitivity to rising US Treasury yields with central banks that are likely to be more dovish than the Fed in the next few years. That means increasing allocations to core Europe and Japan, while reducing exposure to Canada and Australia. Stay neutral on the UK given the near-term uncertainties over the final Brexit outcome. Feature With the US presidential election just two weeks away, public opinion polls continue to show that Joe Biden is the favorite to win the White House. However, the odds of a “Blue Sweep” - combining a Biden victory with the Democratic Party winning control of both the US Senate and House of Representatives - have increased since the end of September according to online prediction markets. US Treasury yields have also moved higher over that same period (Chart 1), which we interpret as the bond market becoming more sensitive to the likelihood of a major increase in US government spending under single-party Democratic control. Chart 1A Blue Sweep Is Bond Bearish
A Blue Sweep Is Bond Bearish
A Blue Sweep Is Bond Bearish
According to a recent analysis done by the Committee for a Responsible Federal Budget, President Trump’s formal policy proposals would increase US federal debt by $4.95 trillion between 2021 and 2030, while Biden’s plan would increase the debt by $5.60 trillion (Table 1).1 While those are both massive fiscal stimulus plans, there is a stark difference in the policy mix of their proposals that matters for the future path of US bond yields. Table 1A Comparison Of The Candidates' Budget Proposals
Beware The Bond-Bearish Blue Sweep
Beware The Bond-Bearish Blue Sweep
Under Biden, spending is projected to increase by a cumulative $11.1 trillion, partially offset by $5.8 trillion in revenue increases and savings with the former vice-president calling for tax hikes on corporations and high-income earners. On the other hand, Trump’s plan includes $5.45 trillion of spending increases and tax cuts over the next decade, offset by $0.75 trillion in savings. Conclusion: Biden would increase spending by over twice that of a re-elected Trump, with much of that spending expected to be front-loaded in the early part of his first term. Outright spending is more reflationary than tax cuts because it puts more money in the pockets of consumers (spenders) relative to producers (savers). The Biden plan would be more stimulating for overall activity even if the increase in debt is about the same. Another analysis of the Biden and Trump platforms was conducted by Moody’s in September, based on estimates of how much of each candidate’s promises could be successfully implemented under different combinations of White House and Congressional control.2 The stimulus figures were run through the Moody’s US economic model, which is similar to the budget scoring model of the US Congressional Budget Office, to produce a year-by-year path for the US economy over the next decade (Chart 2). Chart 2The Biden Platform Is Highly Stimulative
The Biden Platform Is Highly Stimulative
The Biden Platform Is Highly Stimulative
Moody’s concluded that the US economy would return to full employment in the second half of 2022 under a President Biden – especially if the Democrats win the Senate - compared to the first half of 2024 under a re-elected President Trump. Such a rapid closing of the deep US output gap that opened up because of the COVID-19 recession would likely trigger a reassessment of the Fed’s current highly dovish policy stance. The US output gap would close more rapidly under a President Biden, likely triggering a reassessment of the Fed’s current highly dovish policy stance. At the moment, the US overnight index swap (OIS) curve discounts one full 25bp Fed hike by late 2023/early 2024, and two full hikes by late 2024/early 2025 (Chart 3). This pricing of the future path of interest rates has occurred even with the Fed promising to keep the funds rate anchored near 0% until at least the end of 2023. The likelihood of some form of increased fiscal spending after the election will cause the bond market to challenge the Fed’s current forward guidance even more, putting upward pressure on Treasury yields. Chart 3US Fiscal Stimulus Will Pull Forward Fed Liftoff
US Fiscal Stimulus Will Pull Forward Fed Liftoff
US Fiscal Stimulus Will Pull Forward Fed Liftoff
Our colleagues at BCA Geopolitical Strategy see a Blue Sweep as the most likely outcome of the US election, although their forecasting models suggest that the race for control of the Senate will be much closer than the Biden vs Trump battle (there is little chance that control of the House of Representatives would switch back to the Republicans).3 Their scenarios for each of the White House/Senate combinations, along with their own estimated probability for each, are the following: Biden wins in a Democratic sweep: BCA probability = 45%. The US economy will benefit from higher odds of unfettered fiscal stimulus in 2021, although financial markets will simultaneously have to adjust for the negative shock to US corporate earnings from higher taxes and regulation. Government bond yields should rise on the generally reflationary agenda. Trump wins with a Republican Senate: BCA probability = 30%. In this status quo scenario, a re-elected President Trump would still face opposition from House Democrats on most domestic economic issues, forcing him to tilt towards more protectionist foreign and trade policies in his second term. Fiscal stimulus would be easy to agree, though not as large as under a Democratic sweep. US Treasury yields would rise, but would later prove volatile due to the risk to the cyclical recovery from a global trade war, as Trump’s tariffs will not be limited to China and could even affect the European Union. Biden wins with the Senate staying Republican: BCA probability = 20%. This is ultimately the most positive outcome for financial markets - reduced odds of a full-blown trade war with China, combined with no new tax hikes. Bond yields would drift upward over time, but not during the occasional fiscal battles that would ensue between the Democratic president and Republican senators. The first such battle would start right after the election. Treasuries would remain well bid until financial market pressures forced a Senate compromise with the new president sometime in H1 2021. Trump wins with a Democratic Senate: BCA probability = 5%. This is the least likely scenario but one that could produce a big positive fiscal impulse. Trump is a big spender and will veto tax hikes, but will approve populist spending on areas where he agrees. The Democratic Senate would not resist Trump’s tough stance on China, however, thus keeping the risk of US-China trade skirmishes elevated. This is neutral-to-bearish for US Treasuries, depending on the size of any bipartisan stimulus measures and Trump’s trade actions. The key takeaway is that the combined probability of scenarios that will put upward pressure on US Treasury yields is 80%, versus a 20% probability of a more bond-neutral outcome. That is a bond-bearish skew worth positioning for by reducing US duration exposure now, ahead of the November 3 election. Of this 80%, 35 percentage points come from scenarios in which President Trump would remain in power. Hence his trade wars would eventually undercut his reflationary fiscal policy. This would become the key risk to the short duration view after the initial market response. Bottom Line: The most likely scenarios for the US election will give a cyclical lift to US Treasury yields via increased fiscal stimulus. This justifies a move to a below-benchmark US duration stance on a 6-12 month horizon. If Trump is re-elected, the timing of Trump’s likely return to using broad-based tariffs will have to be monitored closely. A Moderate Bear Market Chart 4Less Election-Day Upside Than In 2016
Less Election-Day Upside Than In 2016
Less Election-Day Upside Than In 2016
While our anticipated Blue Sweep election outcome will lead to a large amount of fiscal spending in 2021 and beyond, we anticipate only a modest increase in bond yields during the next 6-12 months. In terms of strategy, our recommended reduction in portfolio duration reflects the fact that fiscal largesse meaningfully reduces the risk of another significant downleg in bond yields and strengthens our conviction in a moderate bear market scenario for bonds. This does raise the question of how large an increase in US Treasury yields we expect during the next 6-12 months. We turn to this question now. Not Like 2016 First, we do not expect a massive election night bond rout like we saw in 2016 (Chart 4). For one thing, the Fed was much more eager to tighten policy in 2016 than it is today, and it did deliver a rate hike one month after the Republicans won the House, Senate and White House (Chart 4, bottom panel). This time around, the Fed has made it clear that it will wait until inflation is running above its 2% target before lifting rates off the zero bound and will not respond directly to expectations for greater fiscal stimulus. A complete re-convergence to long-run fed funds rate estimates would impart 80 – 100 bps of upward pressure to the 5-year/5-year forward Treasury yield. Second, 2016’s election result was mostly unanticipated. This led to a dramatic adjustment in market prices once the results came in. The PredictIt betting market odds of a “Red Sweep” by the Republicans in 2016 were only 16% the night before the election. As of today, the betting markets are priced for a 58% chance of a Blue Sweep in 2020. Unlike in 2016, bonds are presumably already partially priced for the most bond-bearish election outcome. A Slow Return To Equilibrium To more directly answer the question of how high bond yields can rise, survey estimates of the long-run (or equilibrium) federal funds rate provide a useful starting point. In a world where the economy is growing at an above-trend pace and inflation is expected to move towards the Fed’s target, it is logical for long-maturity Treasury yields to settle near estimates of the long-run fed funds rate. Indeed, this theory is borne out empirically. During the last two periods of robust global economic growth (2017/18 & 2013/14), the 5-year/5-year forward Treasury yield peaked around levels consistent with long-run fed funds rate estimates (Chart 5). As of today, the median estimates of the long-run fed funds rate from the New York Fed’s Survey of Market Participants and Survey of Primary Dealers are 2% and 2.25%, respectively. In other words, a complete re-convergence to these equilibrium levels would impart 80 – 100 bps of upward pressure to the 5-year/5-year forward Treasury yield. We expect this re-convergence to play out eventually, but probably not within the next 6-12 months. In both prior periods when the 5-year/5-year forward Treasury yield reached these equilibrium levels, the Fed’s reaction function was much more hawkish. The Fed was hiking rates throughout 2017 & 2018 (Chart 5, panel 4), and the market moved quickly to price in rate hikes in 2013 (Chart 5, bottom panel). The Fed’s new dovish messaging will ensure that the market reacts less quickly this time around. Also, continued curve steepening will mean that the 5-year/5-year forward yield’s 80 – 100 bps of upside will translate into significantly less upside for the benchmark 10-year yield. The 10-year yield and 5-year/5-year forward yield peaked at similar levels in 2017/18 when the Fed was lifting rates and the yield curve was flat (Chart 6). But, the 10-year peaked far below the 5-year/5-year yield in 2013/14 when the Fed stayed on hold and the curve steepened. Chart 5How High For Treasury Yields?
How High For Treasury Yields?
How High For Treasury Yields?
Chart 6Less Upside In 10yr Than In 5y5y
Less Upside In 10yr Than In 5y5y
Less Upside In 10yr Than In 5y5y
The next bear move in bonds will look much more like 2013/14. The Fed will keep a firm grip over the front-end of the curve, leading to curve steepening and less upside in the 10-year Treasury yield than in the 5-year/5-year forward. In addition to shifting to a below-benchmark duration stance, investors should maintain exposure to nominal yield curve steepeners. Specifically, we recommend buying the 5-year note versus a duration-matched barbell consisting of the 2-year and 10-year notes (Chart 6, bottom panel).4 TIPS Versus Nominals We have seen that a full re-convergence to “equilibrium” implies 80 – 100 bps of upside in the 5-year/5-year forward nominal Treasury yield. Bringing TIPS into the equation, we have also observed that long-maturity (5-year/5-year forward and 10-year) TIPS breakeven inflation rates tend to settle into a range of 2.3 – 2.5 percent when inflation is well-anchored and close to the Fed’s target (Chart 7). The additional fiscal stimulus that will follow a Blue Sweep election makes it much more likely that the economic recovery will stay on course, leading to an eventual return of inflation to target and of long-maturity TIPS breakeven inflation rates to a 2.3 – 2.5 percent range. However, as with nominal yields, this re-convergence will be a long process whose pace will be dictated by the actual inflation data. To underscore that point, consider that our Adaptive Expectations Model of the 10-year TIPS breakeven inflation rate – a model that is driven by trends in the actual inflation data – has the 10-year breakeven rate as close to fair value (Chart 8).5 This fair value will rise only slowly over time, alongside increases in actual inflation. Chart 7Overweight TIPS Versus Nominals
Overweight TIPS Versus Nominals
Overweight TIPS Versus Nominals
Chart 8Real Yields Have Likely Bottomed
Real Yields Have Likely Bottomed
Real Yields Have Likely Bottomed
All in all, we continue to recommend an overweight allocation to TIPS versus nominal Treasuries. TIPS breakeven inflation rates will move higher during the next 6-12 months, but are unlikely to reach our 2.3 – 2.5 percent target range within that timeframe. TIPS In Absolute Terms As stated above, we expect nominal yields to increase more than real yields during the next 6-12 months, but what about the absolute direction of real (aka TIPS) yields? Here, our sense is that real yields have also bottomed. If we consider the extreme scenario where the 5-year/5-year forward nominal yield returns to its equilibrium level and where long-maturity TIPS breakeven inflation rates return to our target range, it implies about 80 bps of upside in the nominal yield and 40 bps of upside in the breakeven. This means that the 5-year/5-year real yield has about 40 bps of upside in a complete “return to equilibrium” scenario. While we don’t expect this “return to equilibrium” to be completed within the next 6-12 months, the process is probably underway. The only way for real yields to keep falling in this reflationary world is for the Fed to become increasingly dovish, even as growth improves and inflation rises. After its recent shift to an average inflation target, our best guess is that Fed rate guidance won’t get any more dovish from here. Real yields fell sharply this year as the market priced in this change in the Fed’s reaction function, but the late-August announcement of the Fed’s new framework will probably mark the bottom in real yields (Chart 8, bottom panel).6 Two More Curve Trades Chart 9Own Inflation Curve Flatteners And Real Curve Steepeners
Own Inflation Curve Flatteners And Real Curve Steepeners
Own Inflation Curve Flatteners And Real Curve Steepeners
In addition to moving to below-benchmark duration, maintaining nominal yield curve steepeners and staying overweight TIPS versus nominal Treasuries, there are two additional trades that investors should consider in order to profit from the reflationary economic environment. The first is inflation curve flatteners. The cost of short-maturity inflation protection is below the cost of long-maturity inflation protection, meaning that it has further to run as inflation returns to the Fed’s target (Chart 9). In addition, if the Fed eventually succeeds in achieving a temporary overshoot of its inflation target, then we should expect the inflation curve to invert. Real yield curve steepeners are in some ways the mirror image of inflation curve flatteners. Assuming no change in nominal yields, the real yield curve will steepen as the inflation curve flattens. But what makes real yield curve steepeners look even more attractive is that increases in nominal yields during the next 6-12 months will be concentrated in long-maturities. This will impart even more steepening pressure to the real yield curve. Investors should continue to hold inflation curve flatteners and real yield curve steepeners. Bottom Line: We anticipate a moderate bear market in US Treasuries to unfold during the next 6-12 months. In addition to below-benchmark portfolio duration, investors should overweight TIPS versus nominal Treasuries, hold nominal and real yield curve steepeners, and hold inflation curve flatteners. Non-US Government Bonds: Reduce Exposure To US Treasuries The mildly bearish case for US Treasuries that we have laid out above not only matters for our recommended duration stance, but also for our suggested country allocation within global government bond portfolios. Simply put, the risk of rising bond yields is much higher in the US than elsewhere, both for the immediate post-election period but also over the medium-term. Thus, the immediate obvious portfolio decision is to downgrade US Treasuries to underweight. The move higher in US Treasury yields that we expect is strictly related to spillovers from likely US fiscal stimulus. While other countries in the developed world are contemplating the need for additional fiscal measures, particularly in Europe where there is a renewed surge in coronavirus infections and growing economic restrictions, no country is facing as sharp a policy choice as the US with its upcoming election. The Fed has purchased 57% of all US Treasuries issued since late February of this year, in sharp contrast to the ECB and Bank of Japan that have purchased over 70% of euro area government bonds and JGBs issued. We can say with a fair degree of certainty that the US will have a relatively more stimulative fiscal policy stance than other developed economies over at least the next couple of years. This implies a higher relative growth trajectory for the US that hurts Treasuries more on the margin than non-US government debt. Chart 10The Fed Will Gladly Trade Less QE For More Fiscal Stimulus
Beware The Bond-Bearish Blue Sweep
Beware The Bond-Bearish Blue Sweep
In addition, the likely path of relative monetary policy responses are more bearish for US Treasuries. As described above, the scope of the US stimulus will cause bond investors to further question the Fed’s commitment to keeping the funds rate unchanged for the next few years. That also applies to the Fed’s other policy tools, like asset purchases. The Fed is far less likely to continue buying US Treasuries at the same aggressive pace it has for the past eight months if there is less need for monetary stimulus because of more fiscal stimulus. According to the IMF, the Fed has purchased 57% of all US Treasuries issued since late February of this year, in sharp contrast to the ECB and Bank of Japan that have purchased over 70% of euro area government bonds and JGBs issued (Chart 10). If US Treasury yields are rising because of improving US growth expectations, fueled by fiscal stimulus, the Fed will likely tolerate such a move and buy an even lower share of Treasuries issued – particularly if the higher bond yields do not cause a selloff in US equity markets that can tighten financial conditions and threaten the growth outlook. The fact that US equities have ignored the rise in Treasury yields seen since the end of September may be a sign that both bond and stock investors are starting to focus on a faster trajectory for US growth. In terms of country allocation, beyond downgrading US Treasuries to underweight, we recommend upgrading exposure to countries that are less sensitive to changes in US Treasury yields (i.e. countries with a lower yield beta to changes in US yields). In Chart 11, we show the rolling beta of changes in 10-year government bond yields outside the US to changes in 10-year US Treasury yields. This is a variation of the “global yield beta” concept that we have discussed in the BCA Research bond publications in recent years. Here, we modify the idea to look at which countries are more or less correlated to US yields, specifically. A few points stand out from the chart: Chart 11Reduce Exposure To Bond Markets More Correlated To UST Yields
Reduce Exposure To Bond Markets More Correlated To UST Yields
Reduce Exposure To Bond Markets More Correlated To UST Yields
All countries have a “US yield beta” of less than 1, suggesting that Treasuries are a consistent outperformer when US yields fall and vice versa. This suggests moving to underweight the US when US yields are rising is typically a winning strategy in a portfolio context. The list of higher beta countries includes Canada, Australia, New Zealand, the UK and Germany; although Canada stands out as having the highest yield beta in this group. The list of lower beta countries includes France, Italy, Spain, and Japan. In Chart 12, we show what we call the “upside yield beta” that is estimated only using data for periods when Treasury yields are rising. This gives a sense of which countries are more likely to outperform or underperform during a period of rising Treasury yields, as we expect to unfold after the election. From this perspective, the “safer” lower US upside yield beta group includes the UK, France, Germany and Japan. The riskier higher US upside yield beta group includes Canada, Australia, New Zealand, Italy and Spain. Chart 12Favor Bond Markets Less Correlated to RISING UST Yields
Favor Bond Markets Less Correlated to RISING UST Yields
Favor Bond Markets Less Correlated to RISING UST Yields
Spain and Italy are less likely to behave like typical high-beta countries as US yields rise, however, because the ECB is likely to remain an aggressive buyer of their government bonds as part of their asset purchase programs over the next 6-12 months. We also do not recommend trading UK Gilts off their yield beta to US Treasuries in the immediate future, given the uncertainties over the negotiations over a final Brexit deal. Both sets of US yield betas suggest higher-beta Canada, Australia and New Zealand are more at risk of relative underperformance versus lower-beta France, Germany and Japan. In terms of government bond country allocation, we recommend reducing exposure to the former group and increasing allocations to the latter group. Bottom Line: Within global government bond portfolios, downgrade the US to underweight. Favor countries that have lower sensitivity to rising US Treasury yields, especially those with central banks that are likely to be more dovish than the Fed in the next few years. That means increasing allocations to core Europe and Japan, while reducing exposure to “higher-beta” Canada and Australia. Robert Robis, CFA Chief Fixed Income Strategist rrobis@bcaresearch.com Ryan Swift US Bond Strategist rswift@bcaresearch.com Footnotes 1 http://www.crfb.org/papers/cost-trump-and-biden-campaign-plans 2 https://www.moodysanalytics.com/-/media/article/2020/the-macroeconomic-consequences-trump-vs-biden.pdf 3 Please see BCA Research Geopolitical Strategy Special Report, “Introducing Our Quantitative US Senate Election Model”, dated October 16, 2020, available at gps.bcaresearch.com 4 For more details on this recommended steepener trade please see US Bond Strategy Weekly Report, “Positioning For Reflation And Avoiding Deflation”, dated August 11, 2020, available at usbs.bcaresearch.com 5 For more details on our Adaptive Expectations Model please see US Bond Strategy Weekly Report, “How Are Inflation Expectations Adapting?”, dated February 11, 2020, available at usbs.bcaresearch.com 6 For a detailed look at the implications of the Fed’s policy shift please see US Bond Strategy / Global Fixed Income Strategy Special Report, “A New Dawn For US Monetary Policy”, dated September 1, 2020, available at usbs.bcaresearch.com
Too Much Homebuilding Euphoria
Too Much Homebuilding Euphoria
Neutral – Downgrade Alert It no longer pays to chase the S&P homebuilding index higher; it is now on our downgrade alert watch-list. The recent pandemic-induced drubbing in interest rates boosted housing affordability and caused a knee jerk reaction in the mortgage application purchase index, which in turn served as a catalyst for the recent rally (top & middle panels). However, as the economy continues to open up, interest rates will reverse course and flip from a tailwind into a headwind. Sell-side analysts are also upgrading their earnings forecasts at the highest pace since the GFC, and we would lean against this extreme bullishness (bottom panel). Bottom Line: We are neutral the S&P homebuilders index, but it is now on our downgrade watch-list. The ticker symbols for the stocks in this index are: BLBG: S5HOME – LEN, PHM, DHI, NVR. For more details, please refer to the recent Weekly Report.
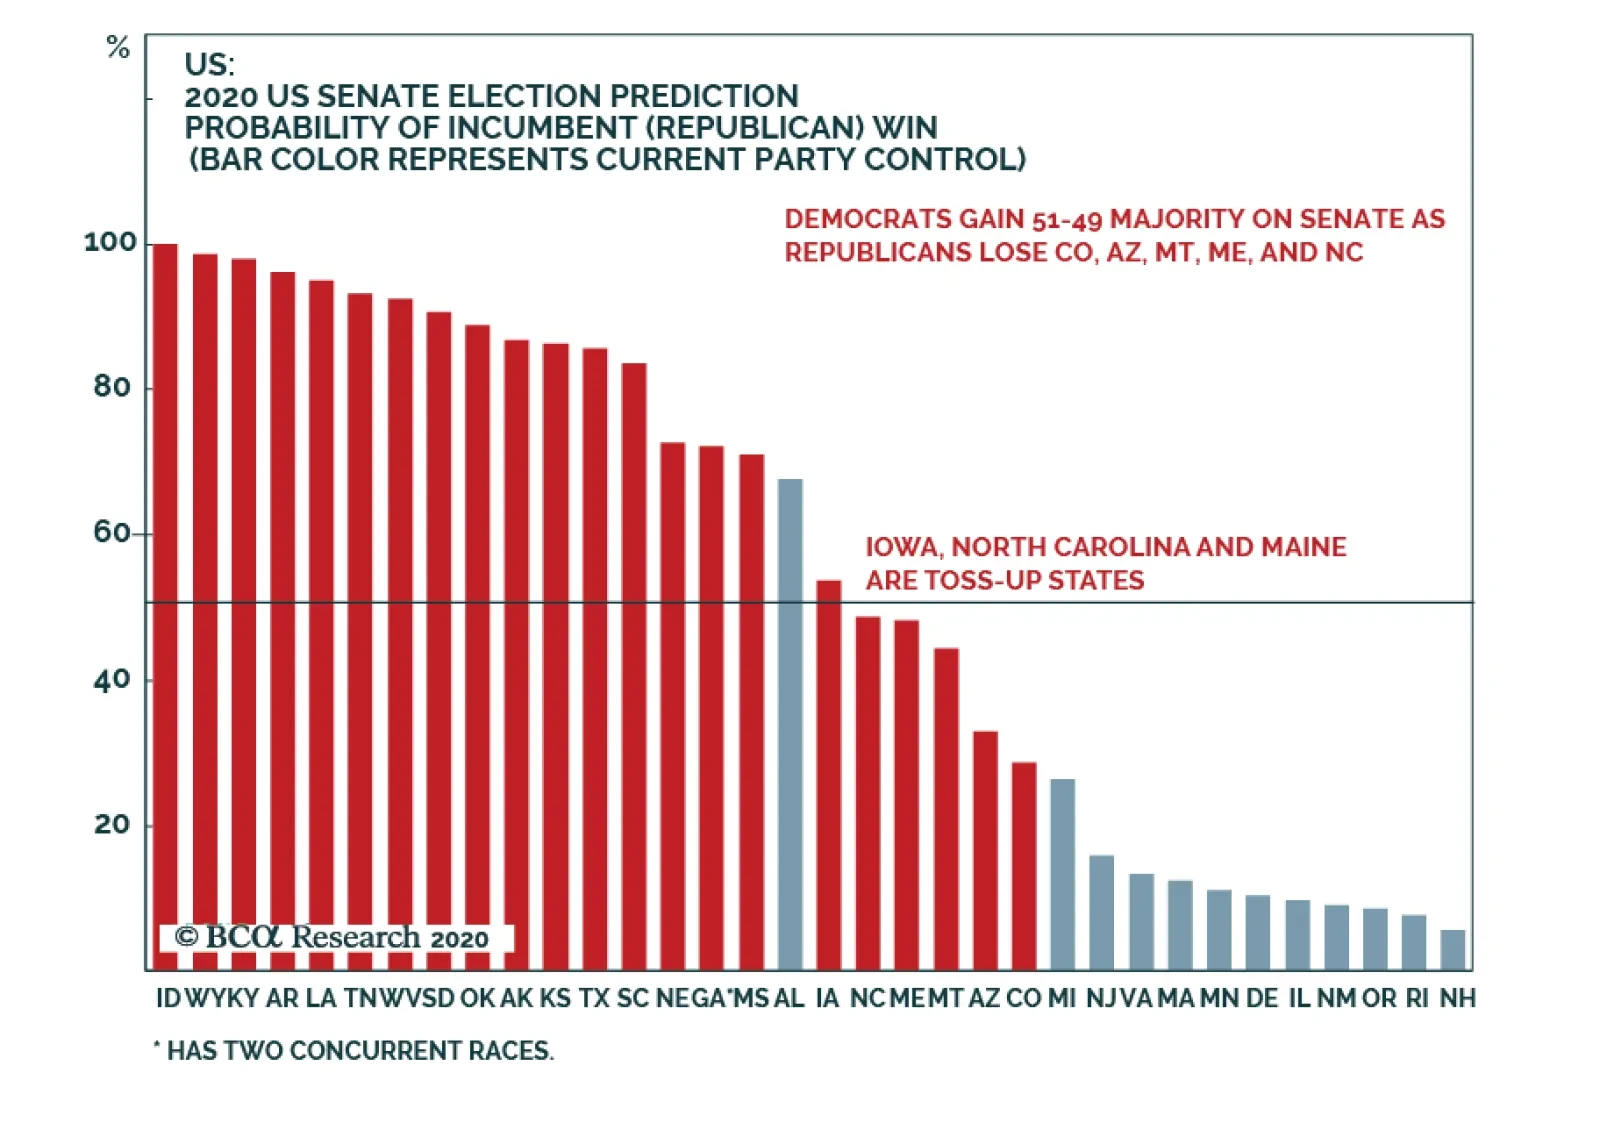
As we have previously argued, BCA Research's Geopolitical Strategy service's quantitative Senate election model suggests Democrats will win control, but there is a chance greater than the consensus believes that Republicans will keep the Senate. …