United States
In an Insight published last week, we noted that some indicators suggest that a significant selloff in risky asset prices over the coming weeks in response to flagging economic momentum may be less likely so long as polls continue to suggest that a divided…
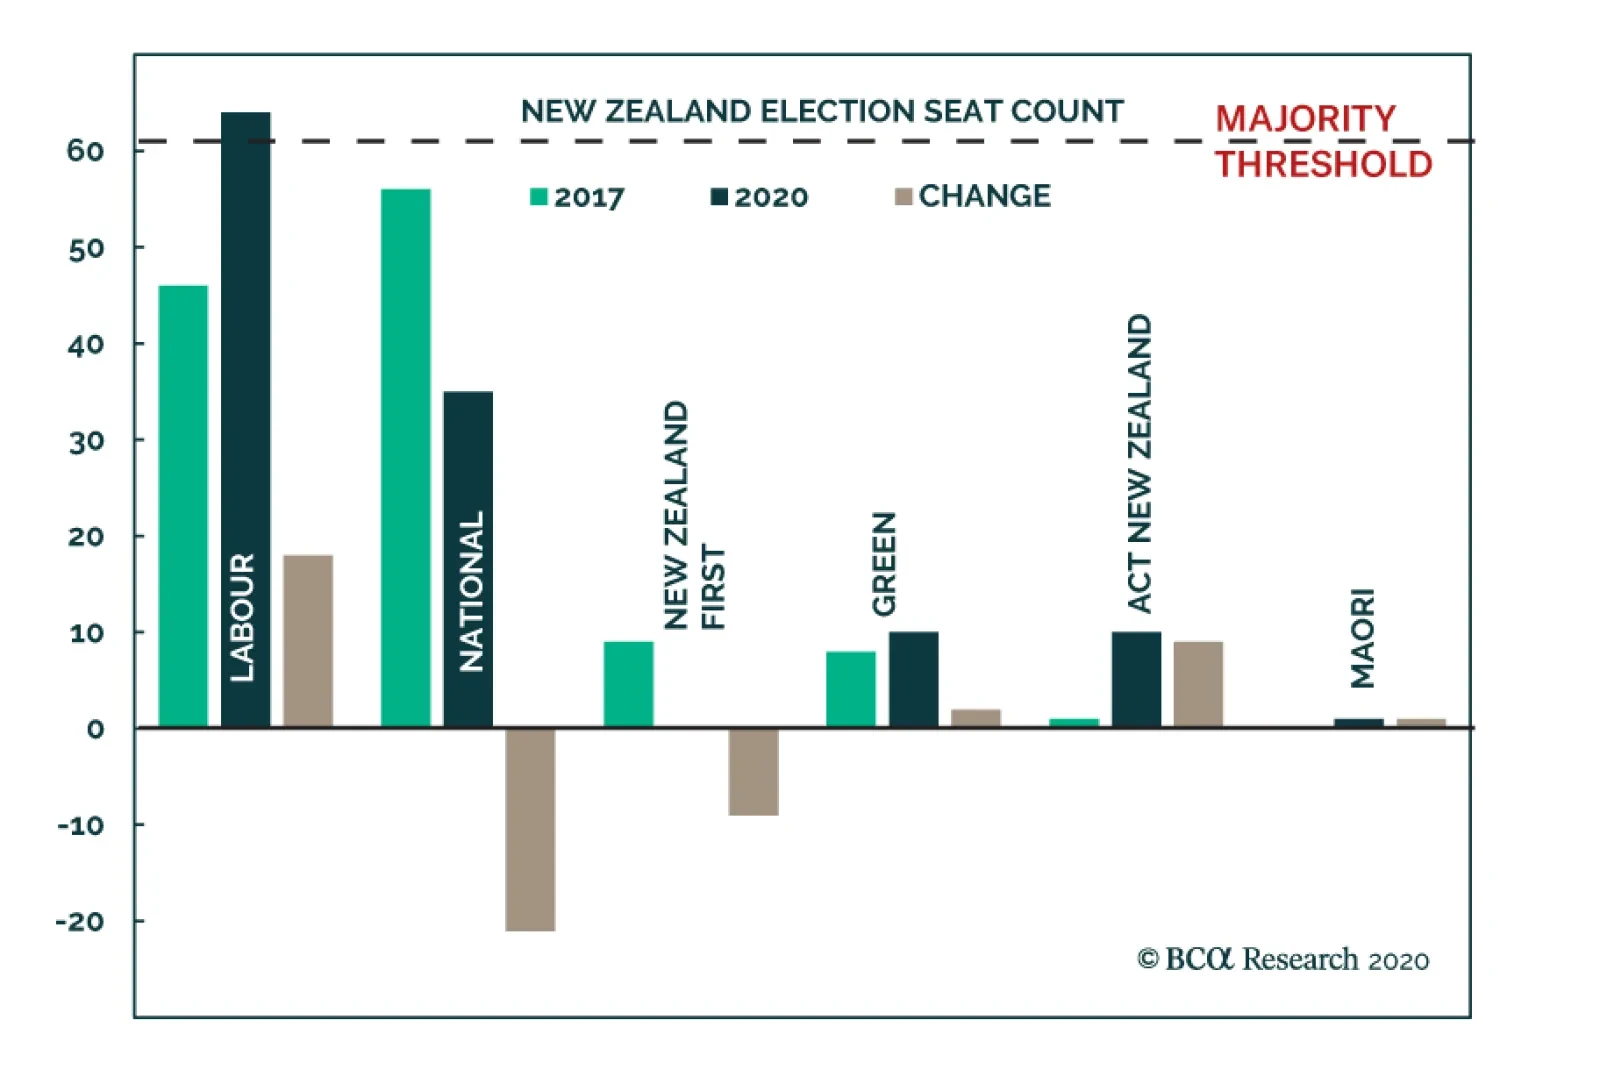
Jacinda Ardern’s Labor Party won a landslide victory in New Zealand’s Saturday election. In the 2017 election, Ardern’s Labor failed to win the most seats but formed a government with coalition support from the NZ First and Green parties. This time around,…
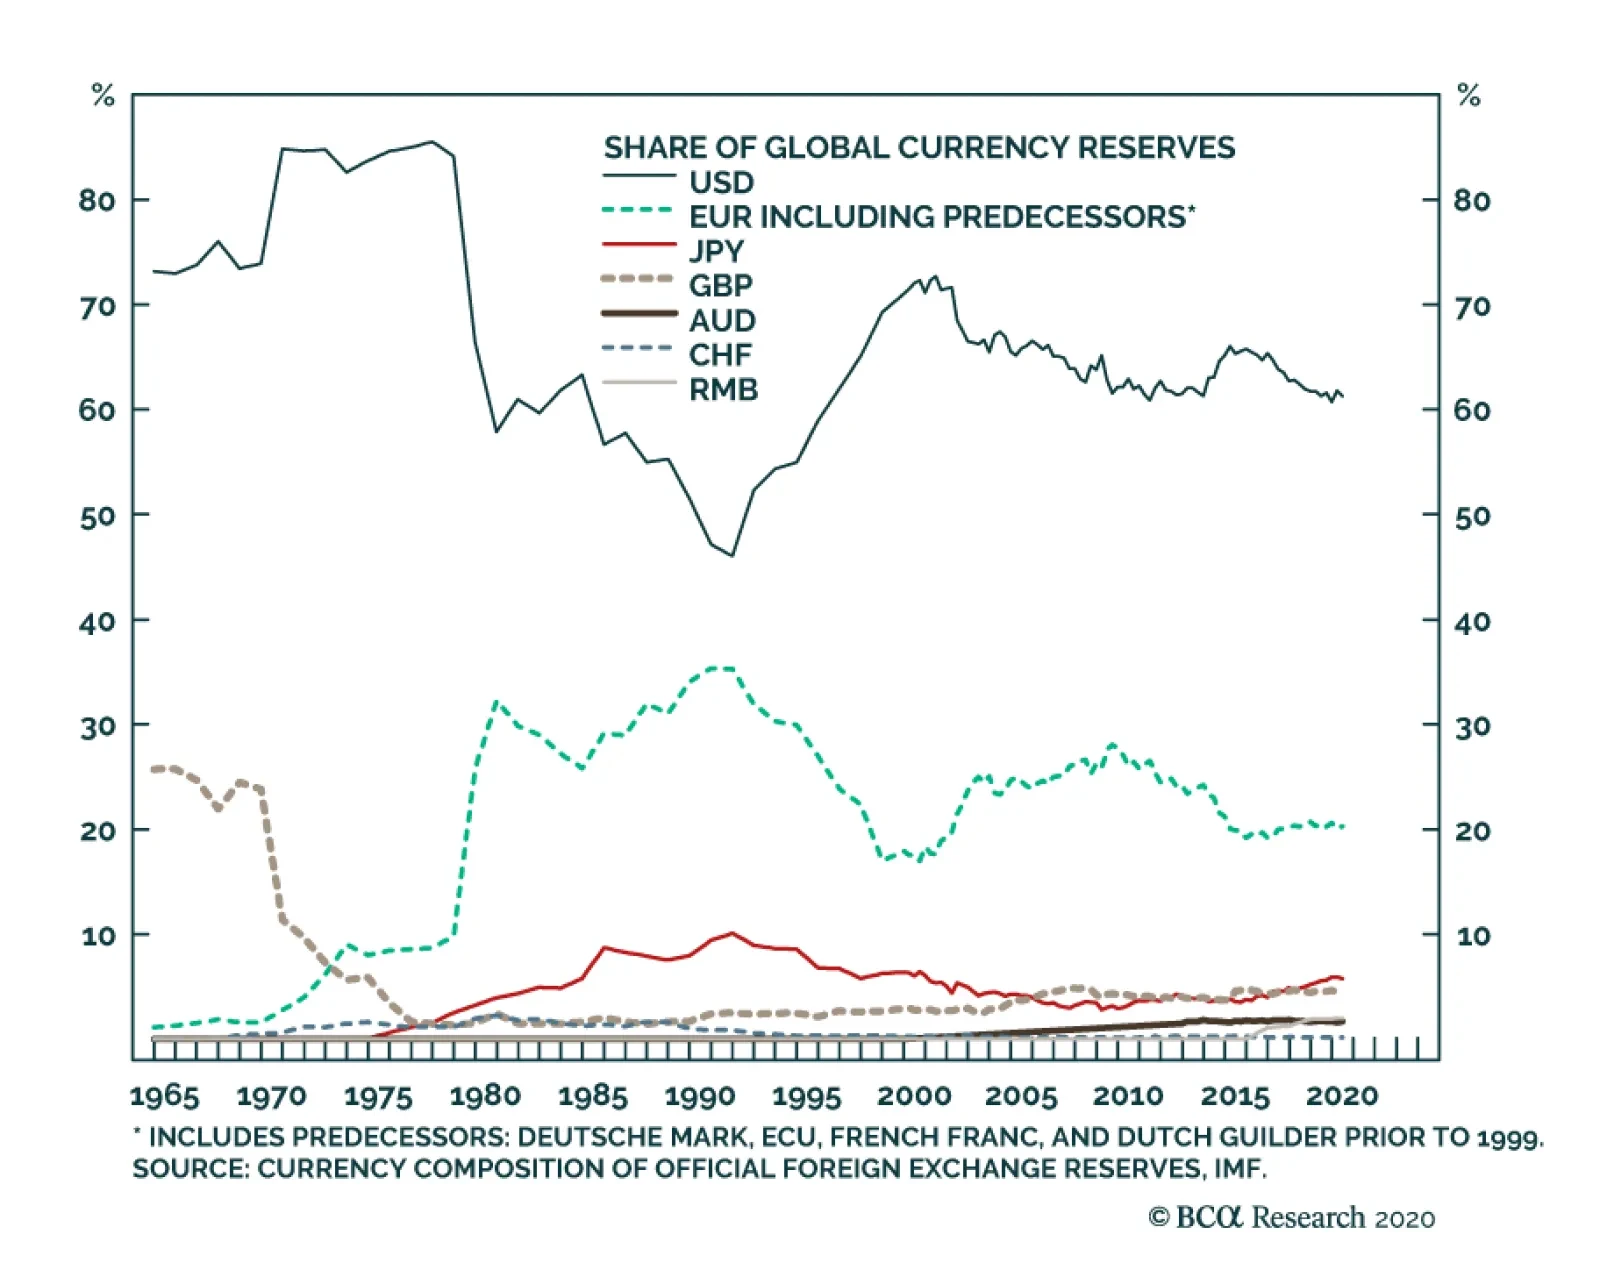
According to BCA Research's Foreign Exchange Strategy & Global Investment Strategy services, the US dollar reserve currency status is not in imminent danger. The US dollar’s share of global central bank reserves stood at 61.3% in the second quarter of…
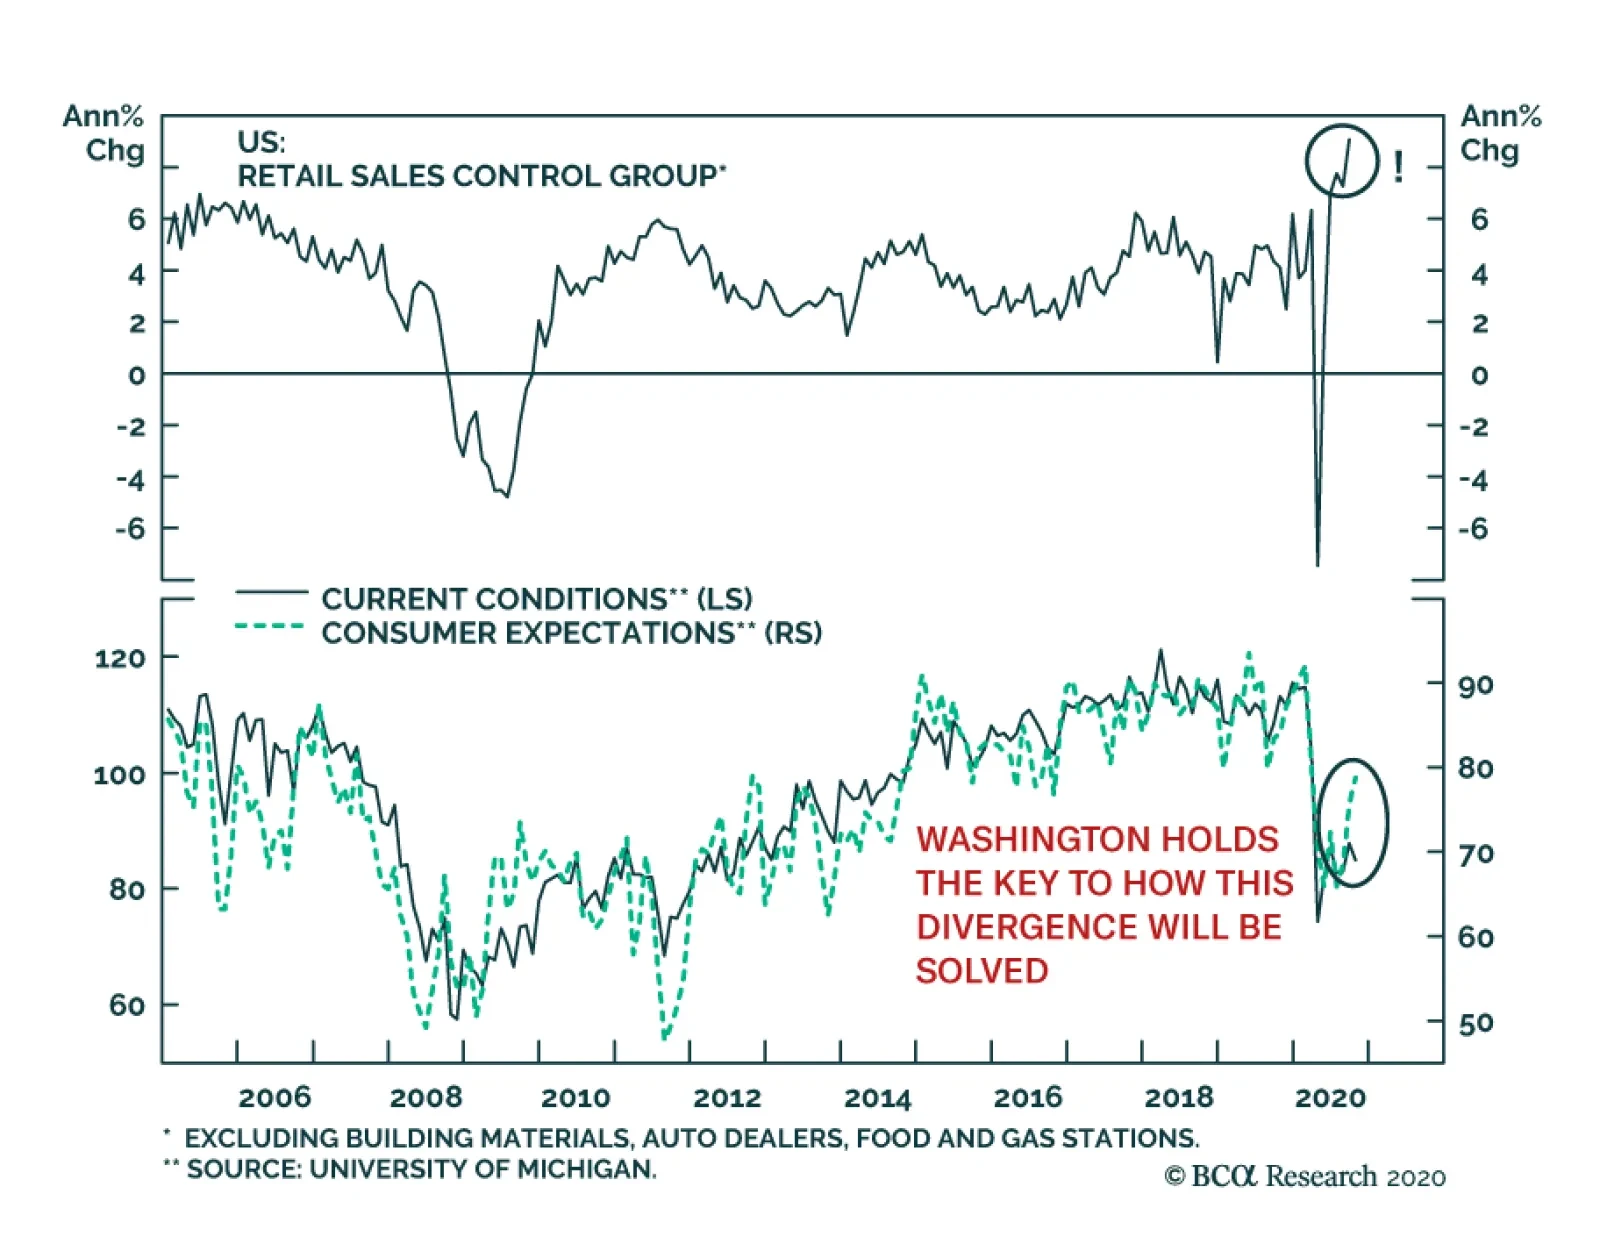
The resilience of US retail is impressive. In September, overall retail sales grew at 1.9% on a monthly basis. On a similar basis, the retail sales control group, which excludes building materials, auto dealers, food and gas stations, rose by 1.4%. In fact,…
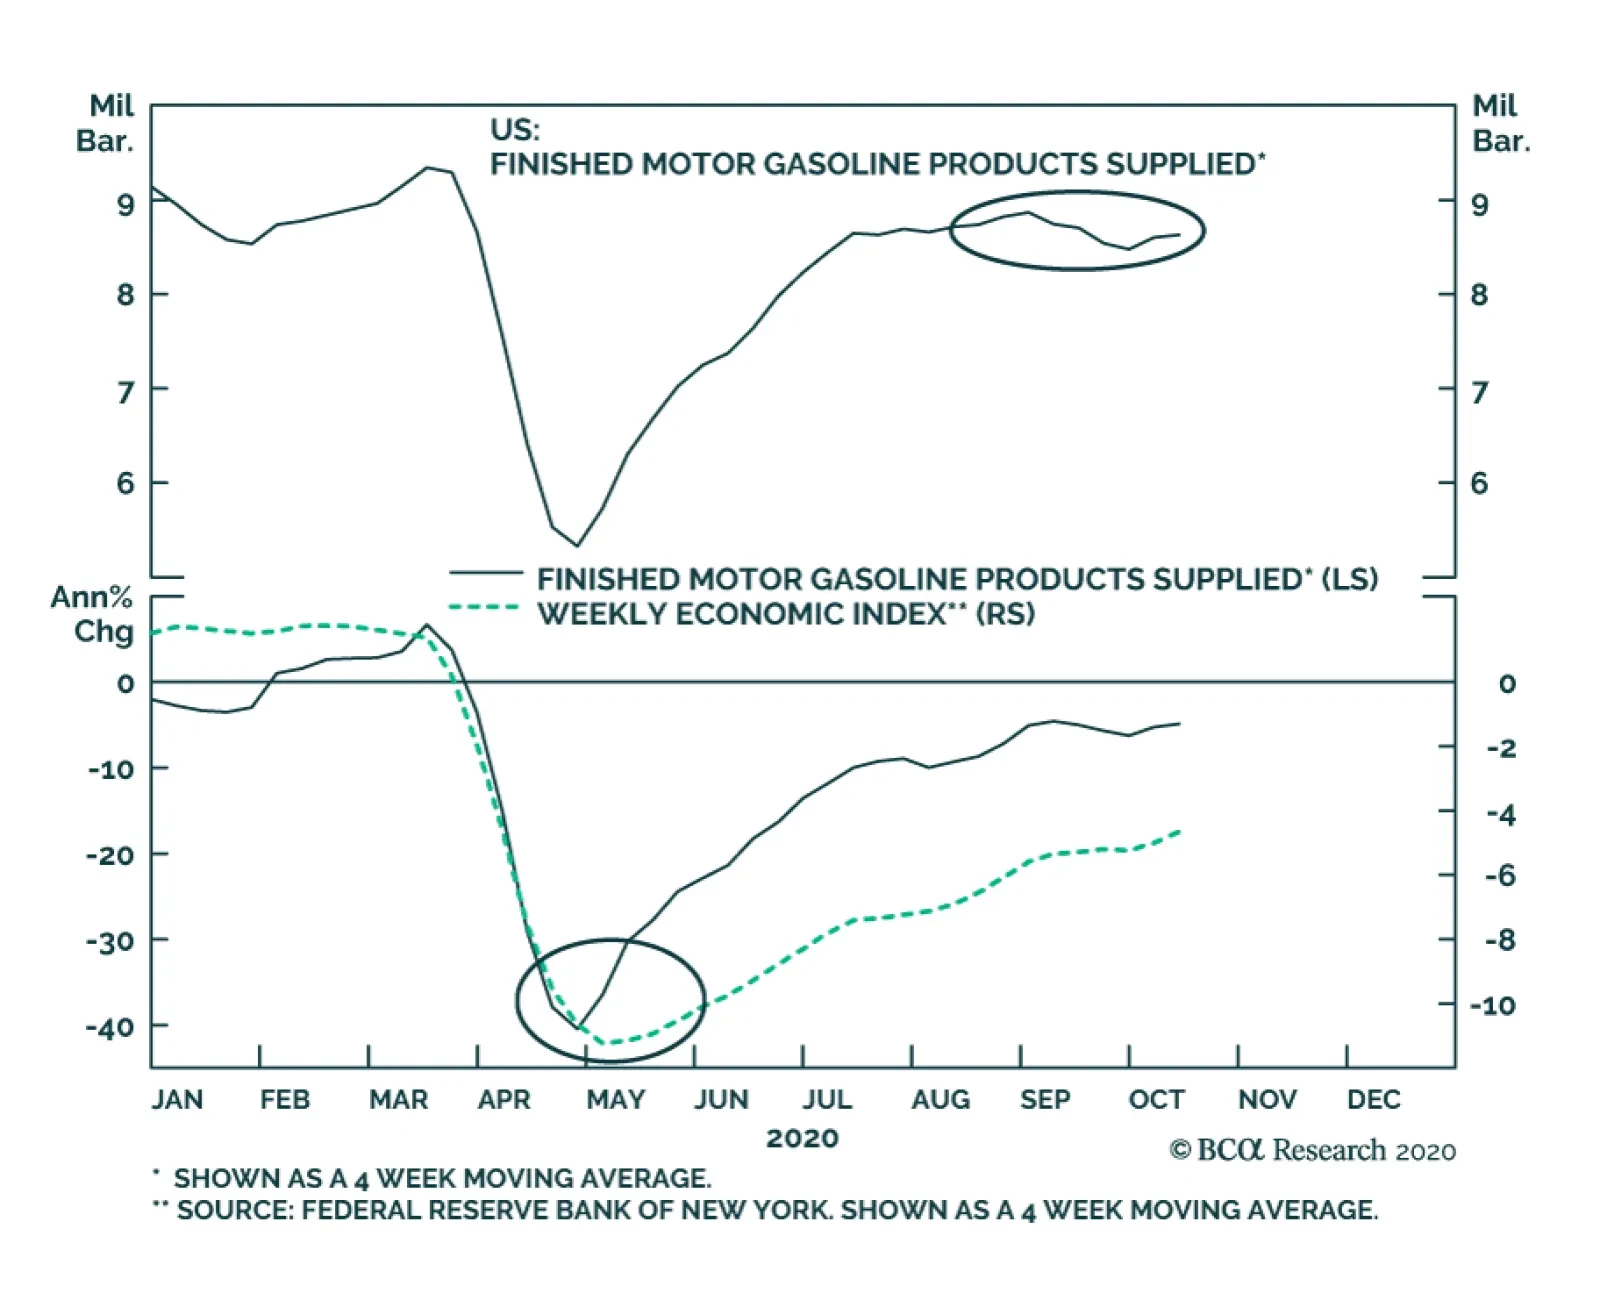
Commodity-focused investors are likely aware of the tendency for some financial market participants to refer to “Dr. Copper”, a humorous reference to the red metal’s historical importance as an indicator of economic activity. In the US, “Dr. Petrol” has also…

No Love For Banks
No Love For Banks
Neutral – Downgrade Alert Banks hit all-time lows again this week on the back of mixed profit results. While Q3 loan loss reserves will rise albeit at a slower pace than H1/2020, net interest income ails and difficulty in growing revenues are significant offsets. This backdrop makes banks hostage to the 10-year US Treasury yield (top panel). With regard to fiscal stimulus and economic uncertainty, Jamie Dimon recently warned that “If the double-dip (recession) happens, we would be under-reserved by $20 billion.” Worrisomely, the longer the new stimulus checks take to arrive, the longer it will take banks to rebound. Banks have been semi-sheltered from the recession courtesy of eviction/foreclosure moratorium as well as mortgage forbearance agreements. Absent a fresh stimulus package, the unemployment rate will remain elevated, warning that lagging non-performing loans will skyrocket. Bottom Line: Stay neutral the S&P banks index, but keep it on the downgrade watchlist. The ticker symbols for the stocks in this index are: BLBG: S5BANKX – JPM, BAC, C, WFC, USB, TFC, PNC, FRC, FITB, MTB, KEY, SIVB, RF, CFG, HBAN, ZION, CMA, PBCT. For more details, please refer to this Monday’s Weekly Report.
Highlights The US Senate election is as important as the presidency for US politics and markets. Our quantitative Senate election model suggests Democrats will win control – as we have long argued – but there is a 49% chance that they do not, which is higher than consensus. A Republican Senate under a Biden presidency is positive for US stocks relative to global. Corporate taxes will stay put. However, fiscal reflation will have to be earned through tough budget battles, which will raise hurdles for markets. The Democratic sweep scenario is generating excessive enthusiasm in the media, as taxes will rise, but it is ultimately reflationary. It will benefit global stocks more than US stocks. Feature Chart 1Democratic Sweep Favors Global Stocks Versus US
Democratic Sweep Favors Global Stocks Versus US
Democratic Sweep Favors Global Stocks Versus US
Throughout the year we have argued that, as a base case for the US election, investors should expect that the pandemic, recession, and widespread social unrest in the United States would culminate in an anti-incumbent movement among voters. President Trump and the Republicans would lose the White House and Senate in a Democratic sweep. The implication for markets was that, after election volatility, global equities would rally in expectation of less hawkish US foreign and trade policy, while US equities would underperform on the expectation of higher taxes and regulation at home. This view has now become the market consensus (Chart 1). However, our quantitative US election model – which does not rely on head-to-head opinion polling – has recently given President Trump a 49% chance of winning in the latest reading. It is flagging a Biden victory but is essentially “too close to call” (Chart 2). The rapid snapback in the economy provides a basis for Trump to make an eleventh-hour comeback, contrary to optics. Chart 2Quant Model Shows Trump Loss, But 49% Odds Of Winning
Introducing Our Quantitative US Senate Election Model
Introducing Our Quantitative US Senate Election Model
In this report we present our quant model for the US Senate election, updated for the 2020 cycle. The Senate model is constructed with similar variables, though not exactly the same, and the result is that Democrats are favored to win control but only slightly. The implication is that Democrats are currently overrated by markets and that the election could still go either way. Uncertainty will go up for the remainder of the month. Ultimately we are sticking with our original forecast unless Trump and the Republicans regain momentum in opinion polling, but our models are flagging major risk. Investors should expect volatility to rise in the short term. We will maintain our tactical risk-off trades, since the risk of a contested election and/or a Trump re-election (and hence renewed global trade war) is rising. The Foundations Of Our Senate Model BCA Geopolitical Strategy developed a US Senate election model in September 2018 which quantified the margin of victory for the GOP among several Senate races during the 2018 mid-term election. The beta model focused on modeling individual Senate races, those deemed competitive by BCA’s Geopolitical Strategy at the time, by combining state and national level economic and political variables as well as the latest polling data applicable to each race.1 We are now re-introducing this model, but with a twist: this time we are adopting the same methodology as per our US presidential election model. The result is a state-by-state model that predicts the number of seats the incumbent party will win in the Senate election on November 3, 2020. Like our US election model, our Senate model is based off a probit model that produces a probability that each state will remain under the control of the incumbent party. The dependent variable (classified as “elected”) is stated as 1 = incumbent party wins the Senate election in each state; or 0 = incumbent party does not win the Senate election in each state. This method allows us to measure the probability that a state with certain characteristics will fall into one of these two categories. Therefore we can predict the probability of the incumbent party winning all the Senate seats in each of the 50 states (though, of course, this is only relevant to the one-third of the states that have a Senate seat up for election in 2020). Our model would have predicted the past five Senate election outcomes correctly on an in-sample basis and the past four Senate elections on an out-sample basis. Unlike our presidential election model, which sampled nine elections (1984 to 2016), our sample size for the Senate model is notably larger. That is, our sample consists of 18 Senate elections (1984 to 2018), across 50 states, amounting to 900 observations. While midterm Senate elections are different from those held during a presidential election year, we would not want to exclude the information they provide. The 2018 Senate race has a bearing on our 2020 prediction and this is appropriate. The Senate Model’s Variables Our Senate model includes six explanatory variables: 1. The Federal Reserve Bank of Philadelphia State Coincident Index. The coincident index for each state combines four of the state’s indicators to summarize current economic conditions in a single statistic. The four indicators are nonfarm payroll employment; average hours worked in manufacturing by production workers; the unemployment rate; and wage and salary disbursements plus proprietors' income deflated by the consumer price index (U.S. city average). Like in our US Presidential model, we applied several transformations to the data to obtain meaningful results in the modeling process. We found that using a three-month change of the state coincident index in our Senate model provided the most statistically significant result. Our Senate model suggests that Republican odds of winning are underrated by online betting markets, as with our presidential model. The three-month change of all the monthly state coincident indexes are given heavier weight as we approach the Senate election early in November. However, we only include the preceding year of a Senate election up until September of the election year (i.e. the last data release in October prior to the election itself). Senate elections occur every two years, and we excluded data that has been accounted for in previous elections. As we highlighted in the update of our US Election model we assume that prevailing economic conditions matter most to voters (as future expectations inevitably affect people’s assessment of their current situation), and this bolsters our rationale in using a 3-month change of the state coincident index. 2. The incumbent party’s margin of victory in previous Senate elections in each state Senate race. This is measured as the incumbent party’s share of the popular vote minus the non-incumbent party’s share. If the incumbent party failed to secure a solid win in each state in the previous Senate election, the probability of securing a solid win in the current election becomes smaller. Moreover, the larger the margin of victory in a previous Senate election race, the more likely that incumbent party will win re-election in said state. 3. Net average approval level of the incumbent president in a Senate election year. This is the difference between the incumbent president’s approval and disapproval levels in a Senate election year, from the start of the year up until the end of October of that year – taken as an average. 4. Generic congressional ballot (net support rate). The generic congressional ballot asks people which party they are likely to vote for in Congress. We take the average net support rate in a Senate election year (that being whichever party leads the other in congressional ballot polling). Democrats are usually favored in congressional generic ballot voting, so the net rate is more predictive than the gross rate 5. Dummy variable for congressional ballot. A dummy variable is assigned to variable number four. For example, dummy takes the value of 1 when Democrats have a positive net support rate in generic congressional ballot voting, and 0 when Republicans have a net positive support rate. We assign only one dummy variable to avoid a dummy variable trap.2 6. A “time for change” variable, a categorical variable indicating whether the incumbent party has controlled the Senate for three or more terms (six or more years). If the Senate has been controlled by the incumbent party for three or more terms, the model will “punish” the incumbent party, as we would expect to see a change in control of the Senate the longer one incumbent party controls it. Estimating The Model Since this is a probit model, the coefficients cannot be directly interpreted like in an ordinary regression.3 In Table 1, the sign of the coefficient corresponds to the direction of change in probability. An increase in the State Coincident Index, the incumbent’s margin of victory in previous Senate races, net approval of the incumbent president and generic congressional support ballot, all increase the probability of the incumbent winning a Senate election in a state. Table 1Senate Model Regression Coefficients
Introducing Our Quantitative US Senate Election Model
Introducing Our Quantitative US Senate Election Model
Meanwhile occupying the Senate for more than three terms serves as a “punishment” and would decrease the probability of winning a Senate election in a state. The output of our model is the probability of an incumbent win in each state. As in our US Presidential election model, there are two ways of aggregating these probabilities to produce a national-level outcome: Proportional: Allocate the number of Senate seats won by the incumbent proportionally to their probability of victory in each state, and then sum them up across all states. Winner Takes All: As we do in our US Presidential election model, assume a probability threshold of 50%: any state with an incumbent win that is at least 50% likely is fully assigned to the incumbent. The latter, winner takes all, is the aggregation method we base our Senate prediction on. Senate Election Model Prediction Table 2 shows our 2020 prediction. Overall, the Republican Party is expected to win 49 Senate seats, a decrease of four seats from its current 53-seat majority. This means that the Democrats are expected to control the Senate with 51 seats (this includes Independents that caucus with Democrats). Moreover, the model suggests that Republicans have a 49% chance of retaining Senate control. Table 2Predicted 2020 Senate Balance Of Power
Introducing Our Quantitative US Senate Election Model
Introducing Our Quantitative US Senate Election Model
This is substantially higher than consensus, which has put Republicans at 42% throughout the past month and currently has them at 37% (Chart 3). As with our presidential model, the rapid recovery in the state economic indicators is providing the Republicans with a last-minute boost that contradicts the gloomier picture painted by opinion polls. We do not think they will retain the Senate, but our conviction level is now lower. Chart 3Betting Market Overrates Democratic Odds Of Winning Senate
Introducing Our Quantitative US Senate Election Model
Introducing Our Quantitative US Senate Election Model
In terms of Senate seats, our model expects Republicans to lose Arizona, Colorado, Maine, Montana, and North Carolina. This is enough for Democrats to obtain 51 seats, a majority, assuming that they lose Alabama. The full list of states that have Senate races in 2020 and the probabilities of a Republican win according to the model are shown in Chart 4. Chart 4Quant Model Shows Democrats Win Senate, But GOP Odds 49%
Introducing Our Quantitative US Senate Election Model
Introducing Our Quantitative US Senate Election Model
Three Senate races are classified as toss-ups, which we define as having a probability between 45% and 55% according to the model. These states are Iowa (54%), Maine (48%) and North Carolina (49%). Montana is close to a toss-up, with a 44% chance of a Republican win. We expect Democrats to win control of the Senate with 51 votes. They need 50, plus the White House, to have a majority. Of these states, if Republicans retain any two, then they will retain their majority, so control of the Senate is on a knife’s edge. Chart 5 shows the odds for each of the 12 swing states in this election. Chart 5Our Senate Odds Compared With The Bookies
Introducing Our Quantitative US Senate Election Model
Introducing Our Quantitative US Senate Election Model
Bear in mind that only 50 seats are needed for the party that wins the White House, since the Vice President is also the President of the Senate and casts the tiebreaking vote. Senate Races Of Interest Our results show that the consensus is underestimating the Republicans, except in Michigan and Montana. The latter could affect overall control of the Senate. The same can be said for Maine, where the Republican challenger may be underrated (Chart 6). The trend of opinion polling in Chart 6 generally shows closer races than the betting markets expect. Our model supports the betting markets on the unlikelihood that Democrats will prevail in several deep red states. Chart 6US Senate Polling And The Betting Odds
Introducing Our Quantitative US Senate Election Model
Introducing Our Quantitative US Senate Election Model
The presidential race should be the decisive factor. If voters in swing states are sufficiently motivated to vote out the sitting president that they chose only four years ago, which is uncommon in modern US history, then they will likely repudiate the senators who carried that president’s water through a whirlwind of scandals and controversies. Yet with the races so precariously balanced, small or local factors could also decide the outcome. This is an important limitation on our macro method. For example, it is not at all clear that Democrats will win Maine. Our model gives Republicans a 48% chance, while online gamblers put it at 27%. Susan Collins is well-entrenched, having survived again and again since 1996. If Democrats do poach Maine, it is still not clear that they will carry Iowa and Montana, which are more conservative yet saw Democratic victories in 2018. Our model suggests Montana will go Democratic and Iowa will stay Republican. Democrats must win one of these two states (or North Carolina) or they will not take the Senate. A feather could tip the scales. A feather may already be doing that in North Carolina, the other key toss-up state. Democratic candidate Cal Cunningham’s sex scandal has roiled the race. It is not yet clear that voters will abandon Cunningham (see Chart 6, panel 1), but that is likely unless there is an unstoppable Democratic wave.4 If North Carolina stays Republican as a result, then, according to our model, the US Senate would tie at 50-50 and the winner of the White House would turn the balance. Some Democrats have argued that deeper red states may be in contention, such as Georgia, South Carolina, Alaska, Kansas, or Kentucky. Of these, Kansas is notable since no candidate has an incumbent advantage. However, our model rules these races out of play and we tend to agree. Bottom Line: Our model suggests that Democrats will narrowly win control of the Senate as things stand today. With several races extremely close, a trivial event in a single state could turn the balance of power in the US Senate and hence the policy consequences of the entire US election. However, the close contest implies that the party that wins the White House will also win the Senate. Back Testing Our Model Our Senate model performs at an acceptable level during in-sample and out-sample back testing. For in-sample testing, we test our model over our entire sample period (1984 – 2018) and find that 72% of Senate elections (control of the Senate) are correctly predicted, with the model predicting the outcome of the last five Senate elections correctly (Chart 7). Chart 7In-Sample Back Testing Results
Introducing Our Quantitative US Senate Election Model
Introducing Our Quantitative US Senate Election Model
During out-sample back testing, we look at a sample period of 2000 – 2018, comprising of ten Senate elections, where our model correctly predicts 69% of actual outcomes. The previous four Senate elections are predicted correctly (Chart 8). There is still a roughly 50/50 chance of divided US government in 2021-22. Chart 8Out-Sample Back Testing Results
Introducing Our Quantitative US Senate Election Model
Introducing Our Quantitative US Senate Election Model
Investment Takeaways Our US Senate model is based off a similar methodology as our US Presidential election model. There are however some minor differences. First, we use a weighted maximum likelihood estimate as opposed to a traditional maximum likelihood estimate. This is because of unbalanced binary outcomes in our dependent variable (see Appendix). Chart 9Fair Chance Of Divided Government Still
Introducing Our Quantitative US Senate Election Model
Introducing Our Quantitative US Senate Election Model
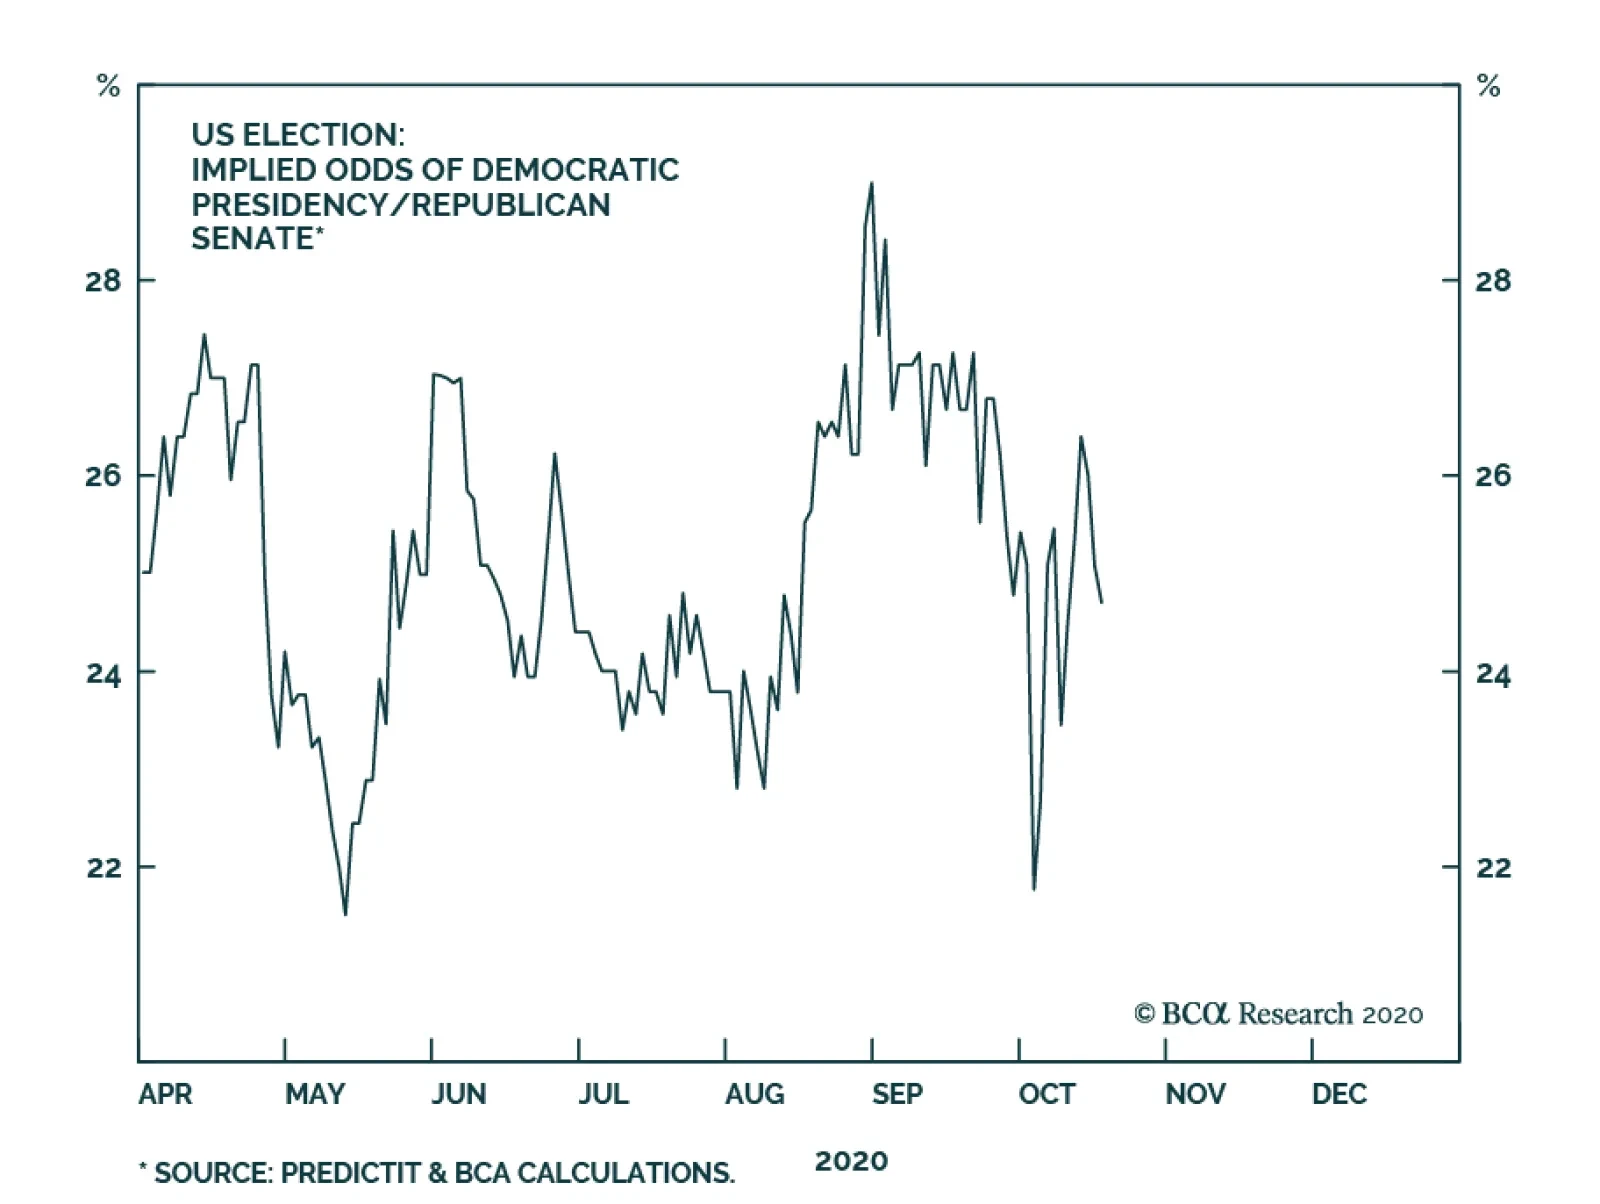
Secondly, not all our explanatory variables are the same. While we maintain using the State Coincident Index as our one and only economic variable, our suite of political variables has changed to be more geared towards predicting the Senate outcome. Our Senate model predicts Republicans will retain only 49 seats and lose control of the Senate. The Democrats will take control with 51 seats. And yet Republicans have a 49% chance of retaining Senate control. This is equivalent to saying that the race is “too close to call” – which is similar to our presidential model results. The reason is the rapid snapback in the economy. Subjectively, the risk is to the downside for Republicans given the President’s poor polling, particularly on his handling of the pandemic, and the high unemployment rate. The Senate outcome should be determined by the White House race, but obviously there is a fair chance that the winner of the White House still loses control of the Senate (Chart 9). Chart 10Wall Street Expects Divided Government
Wall Street Expects Divided Government
Wall Street Expects Divided Government
Chart 11Trump Protectionism Good For The Dollar
Trump Protectionism Good For The Dollar
Trump Protectionism Good For The Dollar
The stock market is behaving like it expects gridlock, rather than a Democratic sweep – the latter offering greater downside and lesser upside, at least judging by history (Chart 10). So let’s boil this all down to what we know with reasonable certainty: If Trump wins with a Republican Senate, he will still face opposition from House Democrats, so he will be driven to foreign and trade policy in his second term. Protectionism will affect not only China but also Europe and other economies. This is broadly positive for the dollar and US equities relative to global stocks and commodities (Chart 11). Government bond yields would be volatile due to the risk to the cyclical recovery from global trade war. If Biden wins in a Democratic sweep, economies other than China will benefit from lower trade risk and the US will benefit from higher odds of unfettered fiscal stimulus in 2021. But financial markets will simultaneously have to adjust for the negative shock to US corporate earnings from higher taxes and regulation. This outcome is broadly negative for the dollar and US equities relative to global equities and commodities. Government bond yields would rise on the generally reflationary agenda. If Biden wins without the Senate, the market has the most positive outcome of all: less trade war yet no new tax hikes. Both US and global equities would benefit. Bond prices and the dollar would trend downward over time, but not during the occasional fiscal battles that would ensue between the Democratic president and Republican senators. Guy Russell Research Analyst GuyR@bcaresearch.com Matt Gertken Vice President Geopolitical Strategy mattg@bcaresearch.com Statistical Appendix A notable property in our dependent variable data requires a brief discussion. Our dependent variable classified as “elected” takes the form of a binary outcome. This data, however, is what’s called “unbalanced,” since incumbent Senators are re-elected approximately 80% of the time. This means that most outcomes in our dependent variable are coded as “1,” with fewer “0’s” because of the strong incumbency effect in Senate races. There are many data sets that exhibit this type of property, such as events like wars, vetoes, cases of political activism, or epidemiological infections, where non-events occur rarely. To alleviate this statistical property in the data, we estimate our model using a weighted maximum likelihood estimate as opposed to the ordinary maximum likelihood estimate usually used in a probit regression.5 This method assigns more weighting to the unbalanced data, or what is known theoretically as “rare event” data, to aid the probit regression in assigning higher probabilities to “0” outcomes. Through this process, we effectively deal with our unbalanced dependent variable data. That said, in developing our quantitative US Senate Election Model, we estimated a suite of probit regressions with several other variables that were theoretically assumed to be relevant and subsequently tested empirically. In Appendix Table 1 below, we only include variables 1, 2, 3 and 6 from our listed variables (we excluded the generic congressional ballot and its corresponding dummy variable). This model suggests that Republicans will hold control of the Senate with 51 seats. Back testing this model revealed that 71% of past Senate elections were correctly predicted, while 67% were correctly predicted in out-sample testing. This is only slightly worse of a track record than our final model. If this model proves more accurate in the event, the implication is that the generic congressional ballot is an unreliable poll. Americans could be shy about stating their support for the Republican Party in the era of Trump. For this outcome, Republicans would only lose Arizona and Colorado. Critical swing states here are Montana (53%) and Arizona (45%). Appendix Table 1Alternative Senate Model Predictions
Introducing Our Quantitative US Senate Election Model
Introducing Our Quantitative US Senate Election Model
A re-work of the above model, but with a variable that punishes Republicans for holding the Senate for six years or more on average, suggests that Republicans will only win 47 seats in the Senate, giving up six seats (Appendix Table 2). Forecast accuracy is slightly worse off, giving just 68% and 67% predictive accuracy during in and out-sample forecasting of previous Senate elections, respectively. Compared to our primary model, Republicans would lose Arizona, Colorado, Iowa, Maine, Montana, North Carolina and Alabama. Alabama (45%) is the only critical swing state. Appendix Table 2Alternative Senate Model Predictions
Introducing Our Quantitative US Senate Election Model
Introducing Our Quantitative US Senate Election Model
Note: This report has been corrected since publication due to errors in charting. Charts 7 and 8 showed the correct majority party in historical Senate elections but mistakenly attributed to that party the minority party’s number of seats. The changes do not affect the text or the substance of the report: our quantitative model’s accuracy levels remain unchanged, as does the model’s performance relative to historical election results. Footnotes 1 The model was able to predict 14 out of 18 (77%) Senate races flagged as competitive by BCA’s Geopolitical Strategy. Florida, North Dakota, Indiana and Missouri were flagged as Democratic by our model but were won by Republican candidates. 2 A dummy variable trap is a scenario in which the independent variables are multicollinear — a scenario in which two or more variables are highly correlated; or, in simple terms, in which one variable can be predicted from the others. To avoid such a trap, we must exclude one of the categorical variables. Since there are two categorical variables that can be represented here (Republican or Democrat), we use k-1 (where k = the number of categorical variables). 3 The coefficients in a probit regression model measure the change in the Z-score associated to each independent variable for a one-unit change in that variable. 4 See Evie Fordham, "NC Democrat Cal Cunningham faces FEC complaint over California trip amid affair," Fox News, October 13, 2020, foxnews.com. 5 Weighted maximum likelihood estimation is a reasonable approach in dealing with dependent variables that show significant imbalance in their data set. See: King, G. and Zeng, L., 2001. Logistic regression in rare events data. Political analysis, 9(2), pp.137-163.
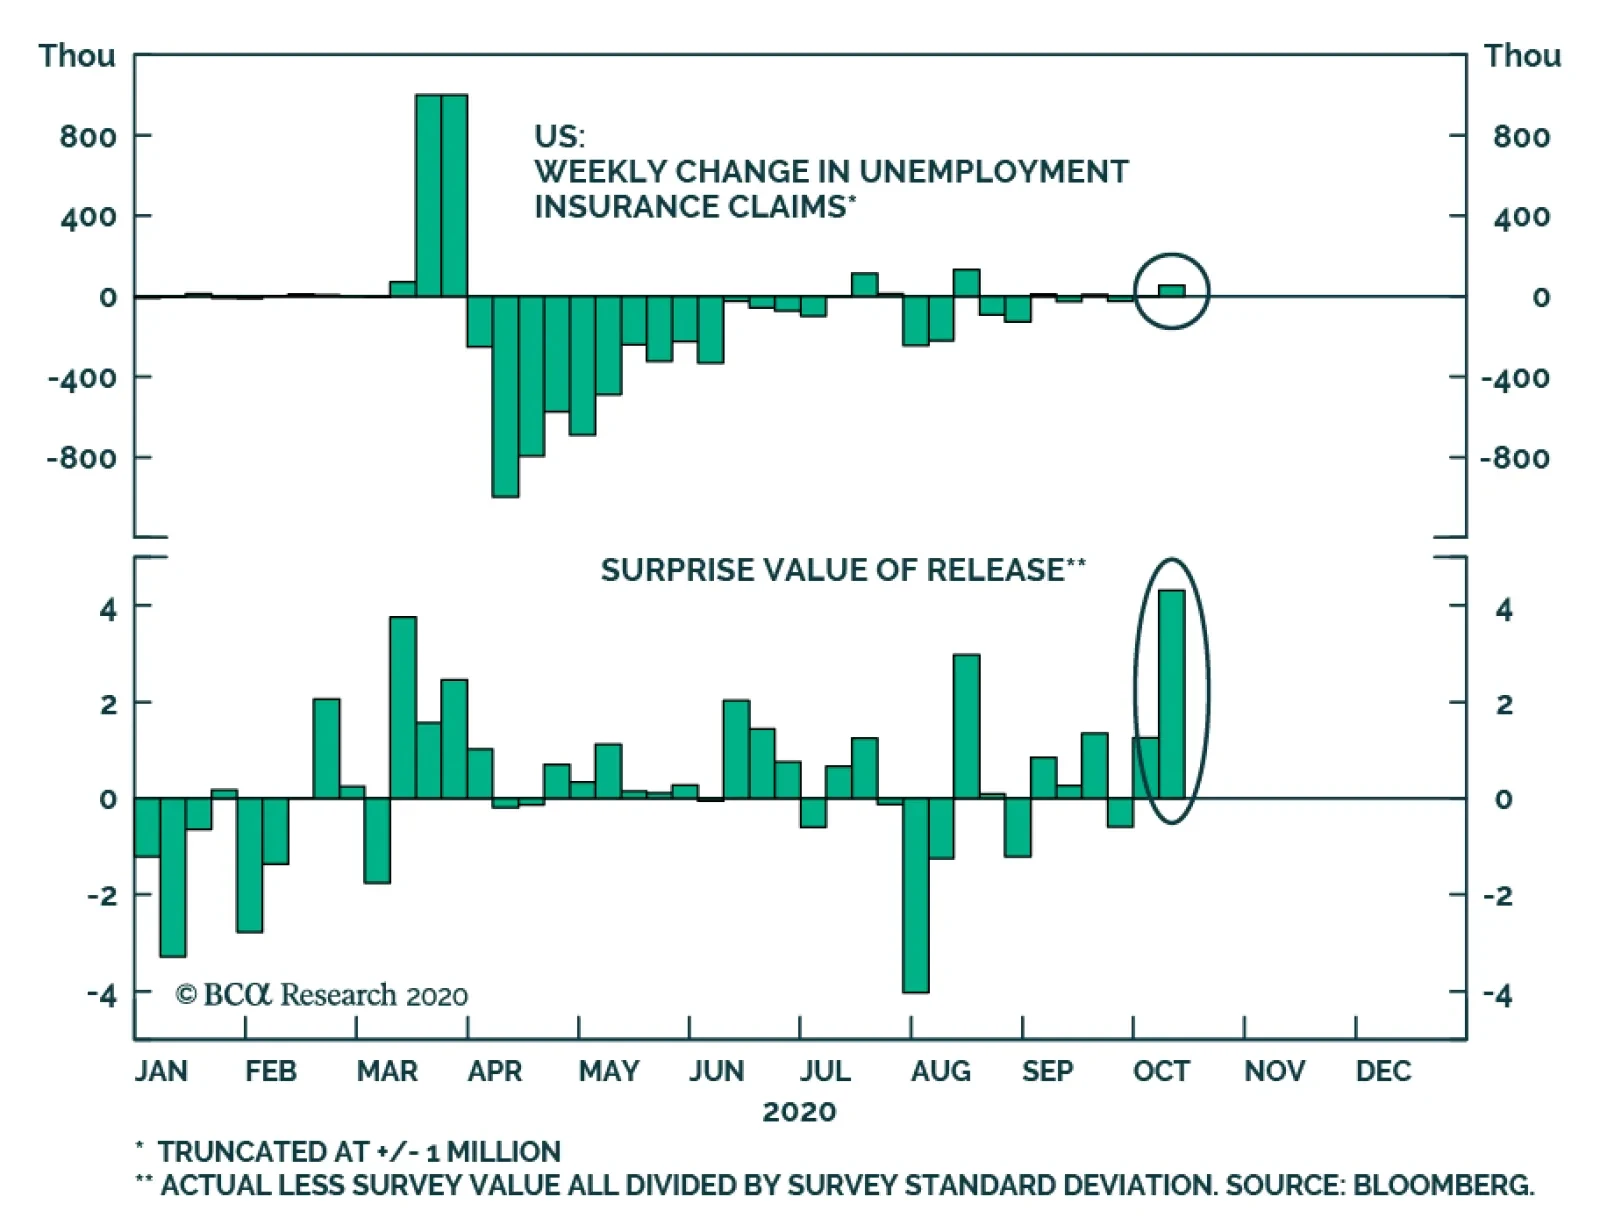
Yesterday’s US unemployment insurance (UI) claims release was negatively received by investors, as it showed an unexpected rise in weekly UI claims. Claims rose from 840k to 898k, compared with a consensus expectation of 825k. The chart above shows that…
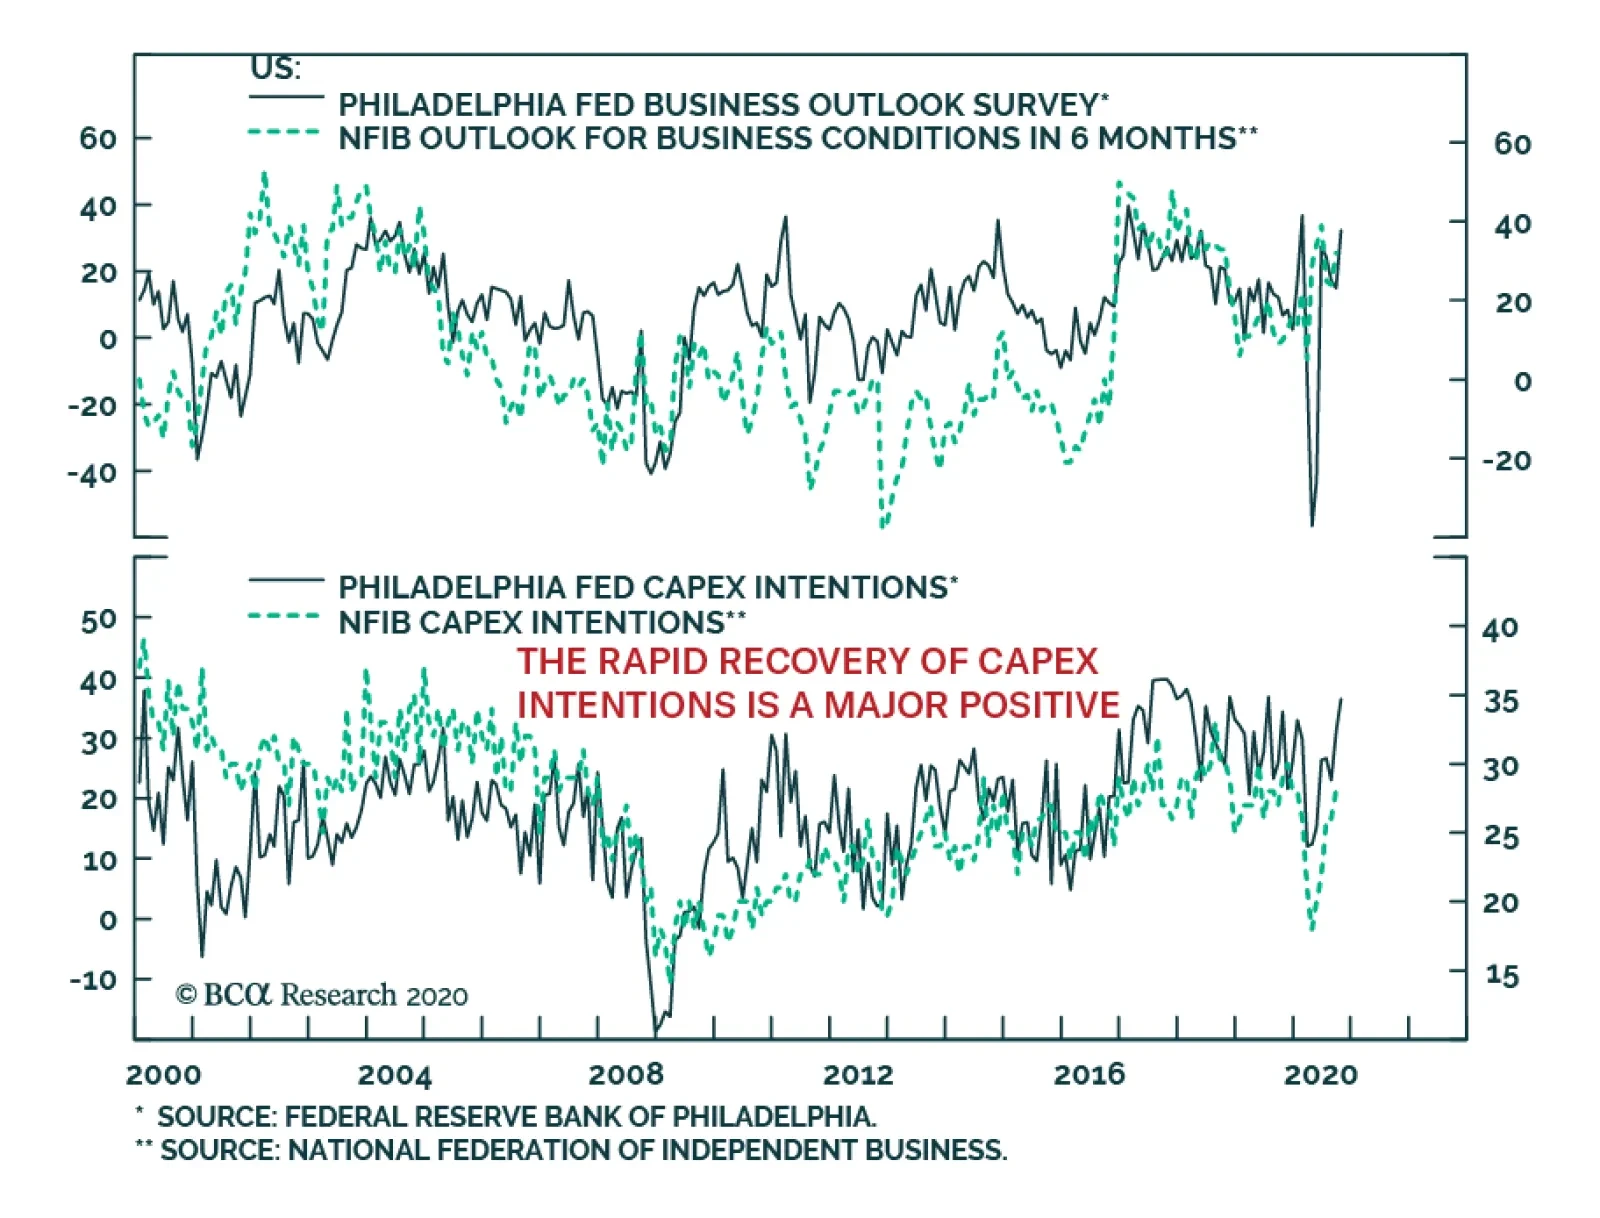
Small business and large manufacturers alike continue to show rising optimism, despite the growing US third wave of infections and the absence of additional stimulus ahead of the US elections. The strength of the manufacturing sector is one of the backbones…
Stretched Positioning
Stretched Positioning
Following up from yesterday’s US Equity Strategy’s sector insight, today we take a closer look at VIX and e-mini futures positioning, again from a contrarian perspective. Using CFTC weekly data, VIX non-commercial speculative positions are net short. In fact, as a percentage of total open interest, net shorts are more extended than the months both prior to “Volmageddon” and to the Q4/2018 20% SPX drawdown. With regard to this year’s equity market carnage, net shorts are almost as extended as in late-2019/early 2020 (VIX net positioning shown inverted, top panel). Similarly, non-commercial speculative positions in S&P 500 e-mini futures are net long on a par with readings recorded in early 2020 (bottom panel). The implication is that speculators are betting on a dying down in volatility and fresh SPX all-time highs. While this will likely materialize post the November election, in the near-term our fear is that speculators will get caught offside, as elevated election and fiscal policy uncertainties will sustain downward pressure on stocks. Bottom Line: Our view remains that the SPX could glide lower into the November election before rallying into year-end.