United States

Chart Of The WeekInvestor Consensus Is Bearish On Dollar
Investor Consensus Is Bearish On Dollar
Investor Consensus Is Bearish On Dollar
Today we are releasing another issue from our series Charts That Matter. Going forward, this publication will become a regular monthly deliverable to our clients. This is a charts-only report with minimal wording. It presents the key charts, indicators, and relationships that we monitor at the time of publication. Needless to say, the importance of different indicators and factors varies over time. Thus, each issue of Charts That Matter will present different charts, indicators and relationships. Presently, global assets are experiencing a tug-of-war. On the one hand, equity and credit markets are overbought and have elevated valuations. On the other hand, expectations of a large US fiscal stimulus package are sustaining prospects of continued US and global economic recoveries. We have been expecting a pullback in risk assets before year-end due to a delay in significant US fiscal stimulus, potential volatility around the US elections as well as overbought conditions in risk assets. In addition, since April commodities prices have benefited from China’s growth recovery as well as inventory restocking (see Charts on page 11). Given that the latter is likely to be followed by a destocking phase, we believe resource prices are at a risk of experiencing a setback. This will weigh on commodity-producing emerging markets. The correction in September has been short circuited. It seems the prospects of an eventual large US fiscal stimulus package, even if it is next year, and the ongoing recovery in China (Charts on pages 8-9) are sustaining a bid under risk assets. Besides, cash on the sidelines has not been fully exhausted (Charts on page 6). Consistently, we illustrate on pages 3 that various US equity indexes are presently trying to break out and that the US equity market breadth has recently been strong. In contrast, EM equity breadth has been very weak (Chart on page 4). The latest rebound in the EM equity index has been again narrow, led by mega-cap new economy stocks in China, Korea and Taiwan. Provided such poor EM equity breadth in both absolute terms and relative to the US, we are reluctant to upgrade EM equities from neutral to overweight in a global equity portfolio. As to absolute performance, the Charts on pages 12-18 illustrate that many market-based indicators are flagging yellow or red lights for EM risk assets. Even though we turned structurally bearish on the US dollar in early July, we currently expect a tactical rebound in the greenback. Investor sentiment on the greenback is very depressed, which is positive for the US dollar from a contrarian perspective (Chart of the Week on page 1). In short, global financial markets are due to reset, which will not be long-lasting but will be meaningful and produce a better entry point. For now, we maintain a neutral allocation to EM stocks and credit markets within global equity and credit portfolios, respectively. In the currency space, we are short several EM currencies – BRL, CLP, ZAR, TRY, KRW and IDR – versus a basket of the euro, CHF and JPY. As to local rates, we are long duration – receiving 10-year swap rates in several countries – but are reluctant to take on currency risk at the moment. Arthur Budaghyan Chief Emerging Markets Strategist arthurb@bcaresearch.com US Equities Have Been Trading Well Various US equity indexes have broken out to new cyclical highs. This is a sign of a broad-based rally. Chart I-1US Equities Have Been Trading Well
US Equities Have Been Trading Well
US Equities Have Been Trading Well
Chart I-2US Equities Have Been Trading Well
US Equities Have Been Trading Well
US Equities Have Been Trading Well
Equity Market Breadth Is Strong In The US But Poor In EM The advance-decline line for the US equity market has rebounded from the neutral level of 0.5. On the contrary, the same measure for EM stocks remains below the 0.5 line, signaling poor breadth despite the rebound in the EM equity index. Chart I-3Equity Market Breadth Is Strong In The US But Poor In EM
Equity Market Breadth Is Strong In The US But Poor In EM
Equity Market Breadth Is Strong In The US But Poor In EM
The World Economy And Global Trade Are Reviving Economic data for September continue to register a sequential revival in business activity in most parts of the world. Chart I-4The World Economy And Global Trade Are Reviving
The World Economy And Global Trade Are Reviving
The World Economy And Global Trade Are Reviving
Chart I-5The World Economy And Global Trade Are Reviving
The World Economy And Global Trade Are Reviving
The World Economy And Global Trade Are Reviving
The US: Cash On The Sidelines Has Declined But Is Not Exhausted US institutional and money market funds presently amount to 8.5% of the value of the US equity market cap plus all US-dollar denominated bonds available to investors. The Fed and commercial banks hold $11 trillion of debt securities. This amount of securities has been withdrawn from the market and is not available to non-bank investors. Chart I-6The US: Cash On The Sidelines Has Declined But Is Not Exhausted
The US: Cash On The Sidelines Has Declined But Is Not Exhausted
The US: Cash On The Sidelines Has Declined But Is Not Exhausted
Chart I-7The US: Cash On The Sidelines Has Declined But Is Not Exhausted
The US: Cash On The Sidelines Has Declined But Is Not Exhausted
The US: Cash On The Sidelines Has Declined But Is Not Exhausted
A Delay In The US Fiscal Stimulus Package Is A Risk to The US Economy US fiscal transfers have produced a surge in household disposable income, which through consumer spending have contributed to the global recovery via a widening trade deficit. In the absence of large fiscal transfers to consumers, the opposite dynamics will prevail. Chart I-8A Delay In The US Fiscal Stimulus Package Is A Risk to The US Economy
A Delay In The US Fiscal Stimulus Package Is A Risk to The US Economy
A Delay In The US Fiscal Stimulus Package Is A Risk to The US Economy
Chart I-9A Delay In The US Fiscal Stimulus Package Is A Risk to The US Economy
A Delay In The US Fiscal Stimulus Package Is A Risk to The US Economy
A Delay In The US Fiscal Stimulus Package Is A Risk to The US Economy
The Business Cycle In China Is Recovering China’s domestic demand and production are recovering but labor market improvements are still timid. Chart I-10The Business Cycle In China Is Recovering
The Business Cycle In China Is Recovering
The Business Cycle In China Is Recovering
Chart I-11The Business Cycle In China Is Recovering
The Business Cycle In China Is Recovering
The Business Cycle In China Is Recovering
China: The Stimulus Is Working Its Way Into The Economy In China, the credit and fiscal stimulus leads the business cycle by about nine months. Thereby, China’s recovery will continue until the end of Q2 2021. Chart I-12China: The Stimulus Is Working Its Way Into The Economy
China: The Stimulus Is Working Its Way Into The Economy
China: The Stimulus Is Working Its Way Into The Economy
Chart I-13China: The Stimulus Is Working Its Way Into The Economy
China: The Stimulus Is Working Its Way Into The Economy
China: The Stimulus Is Working Its Way Into The Economy
China: Liquidity Tightening Has Not Yet Affected Money And Credit Growth The PBoC has withdrawn liquidity, pushing up the policy rate and bond yields. With a time lag, money and credit growth will eventually roll over. But for now, China is enjoying another period of credit splurge and the credit excesses are getting larger. Chart I-14China: Liquidity Tightening Has Not Yet Affected Money And Credit Growth
China: Liquidity Tightening Has Not Yet Affected Money And Credit Growth
China: Liquidity Tightening Has Not Yet Affected Money And Credit Growth
Chart I-15China: Liquidity Tightening Has Not Yet Affected Money And Credit Growth
China: Liquidity Tightening Has Not Yet Affected Money And Credit Growth
China: Liquidity Tightening Has Not Yet Affected Money And Credit Growth
China: From Commodities Restocking To Destocking? Chinese imports of many commodities have been super strong since April. However, they have substantially outpaced their final demand. This suggests there has been an inventory restocking phase. This will likely soon be followed by a period of destocking when Chinese imports of resources dwindle for several months. Chart I-16China: From Commodities Restocking To Destocking?
China: From Commodities Restocking To Destocking?
China: From Commodities Restocking To Destocking?
Chart I-17China: From Commodities Restocking To Destocking?
China: From Commodities Restocking To Destocking?
China: From Commodities Restocking To Destocking?
Red Flags For EM Currencies The rollover in platinum prices and pick-up in EM currency volatility (shown inverted on the bottom panel) point to a rebound in the US dollar and a relapse in EM exchange rates. Chart I-18Red Flags For EM Currencies
Red Flags For EM Currencies
Red Flags For EM Currencies
Yellow Flags For EM Equities The new cyclical high in EM share prices has not been confirmed by a new low in EM equity volatility (the latter shown inverted in the top panel). Moreover, our Risk-On/Safe-Haven Currency ratio has been trending lower since June, flagging risks to EM assets. Finally, global ex-TMT stocks are struggling to break above their June highs. Chart I-19Yellow Flags For EM Equities
Yellow Flags For EM Equities
Yellow Flags For EM Equities
EM Sovereign And Corporate Spreads, Currencies, Equities And Commodities Commodities prices and EM currencies drive EM sovereign and corporate spreads while EM corporate bond yields (shown inverted in the bottom panel) correlate with EM share prices. Chart I-20EM Sovereign And Corporate Spreads, Currencies, Equities And Commodities
EM Sovereign And Corporate Spreads, Currencies, Equities And Commodities
EM Sovereign And Corporate Spreads, Currencies, Equities And Commodities
Many Currencies Against The US Dollar Are At Critical Resistances If these currencies break out of these technical resistance levels, they will experience a lasting appreciation versus the US dollar. However, in our view, they will initially weaken before breaking out next year. Chart I-21Many Currencies Against The US Dollar Are At Critical Resistances
Many Currencies Against The US Dollar Are At Critical Resistances
Many Currencies Against The US Dollar Are At Critical Resistances
Chart I-22Many Currencies Against The US Dollar Are At Critical Resistances
Many Currencies Against The US Dollar Are At Critical Resistances
Many Currencies Against The US Dollar Are At Critical Resistances
Are Global Defensive Equity Sectors On A Cusp Of Outperformance? Many defensive equity sectors have reached or are close to their technical support lines. Their outperformance will likely occur during a risk-off period. Chart I-23Are Global Defensive Equity Sectors On A Cusp Of Outperformance?
Are Global Defensive Equity Sectors On A Cusp Of Outperformance?
Are Global Defensive Equity Sectors On A Cusp Of Outperformance?
Chart I-24Are Global Defensive Equity Sectors On A Cusp Of Outperformance?
Are Global Defensive Equity Sectors On A Cusp Of Outperformance?
Are Global Defensive Equity Sectors On A Cusp Of Outperformance?
These Markets Have Not Yet Entered A Bull Market These markets have rebounded to their technical resistance lines but have so far failed to break out. This gives us comfort to remain neutral on EM by expecting a pullback. Chart I-25These Markets Have Not Yet Entered A Bull Market
These Markets Have Not Yet Entered A Bull Market
These Markets Have Not Yet Entered A Bull Market
Chart I-26These Markets Have Not Yet Entered A Bull Market
These Markets Have Not Yet Entered A Bull Market
These Markets Have Not Yet Entered A Bull Market
Risk Measures Signal Modest Investor Complacency The SKEW index for the S&P 500 is low, entailing that investors are not hedging tail risks. The put-call ratio is not elevated despite many investors hedging against the US election uncertainty. Critically, the Nasdaq’s volatility is in a bull market. Chart I-27Risk Measures Signal Modest Investor Complacency
Risk Measures Signal Modest Investor Complacency
Risk Measures Signal Modest Investor Complacency
Chart I-28Risk Measures Signal Modest Investor Complacency
Risk Measures Signal Modest Investor Complacency
Risk Measures Signal Modest Investor Complacency
EM (ex-China, Korea And Taiwan): The Recovery Is Sluggish And Subdued Outside China, Korea and Taiwan, EM domestic demand recovery is very slow and tame. In these economies, the fiscal stimulus has been small, the banking system is unhealthy and the monetary transmission mechanism is broken, i.e. banks are failing to properly transmit monetary easing into the real economy. Chart I-29EM (ex-China, Korea And Taiwan): The Recovery Is Sluggish And Subdued
EM (ex-China, Korea And Taiwan): The Recovery Is Sluggish And Subdued
EM (ex-China, Korea And Taiwan): The Recovery Is Sluggish And Subdued
Chart I-30EM (ex-China, Korea And Taiwan): The Recovery Is Sluggish And Subdued
EM (ex-China, Korea And Taiwan): The Recovery Is Sluggish And Subdued
EM (ex-China, Korea And Taiwan): The Recovery Is Sluggish And Subdued
Footnotes Equities Recommendations Currencies, Credit And Fixed-Income Recommendations
According to BCA Research's US Bond Strategy service, municipal bonds offer exceptional value relative to both US Treasuries and corporate credit. Moreover, rising odds of a blue sweep make state & local government fiscal relief increasingly likely.…
Among value-oriented investors, the concept of a “margin of safety” is well known. In essence, a margin of safety approach focuses on capital preservation rather than outsized return potential, and espouses investing in securities with a positive gap between…
What To Make Of Spiking VIX Put/Call Ratio?
What To Make Of Spiking VIX Put/Call Ratio?
Bulls regained control of the equity market, and frenzied buying on Monday pushed the SPX and NDX indexes within striking distance of fresh all-time highs. Our sense is that the market has finally come round to BCA’s view of better-than-even chances of a “Blue Wave” as we first articulated in a joined Special Report with our Geopolitical Strategy service in mid-July “Blue Trifecta: Broad Equity Market And Sector Specific Implications”. However, market leadership is slightly perplexing. While a “Blue Wave” would make a massive fiscal package highly likely in the New Year, bulls bidding tech titans to nose bleed levels anew argues that a new closing of the economy is upon us. The “sleeping giant” 10-year US Treasury yield still hovering below the June highs also signals that something is amiss with the economy, thus boosting the allure of the longest duration equity sector: tech stocks. Finally, the VIX (volume) put/call ratio recently had a 3 handle (shown inverted as a 21-day moving average, top panel). The chart also shows the VIX (open interest) put/call ratio (PCR) that has historically behaved as a contrarian indicator: a high reading leads to a higher VIX and lower SPX and vice versa (PCR shown inverted, middle panel). In other words, as investors are foregoing downside protection the odds are high that an equity pullback would materialize. Bottom Line: Our view remains that the SPX could glide lower into the November election before rallying into year-end.
BCA Research's US Equity Strategy service remains neutral on the S&P homebuilders index, but it added the industry to its downgrade watch list. Homebuilders are enjoying the single family home renaissance as the pandemic turbo-charges the work from…
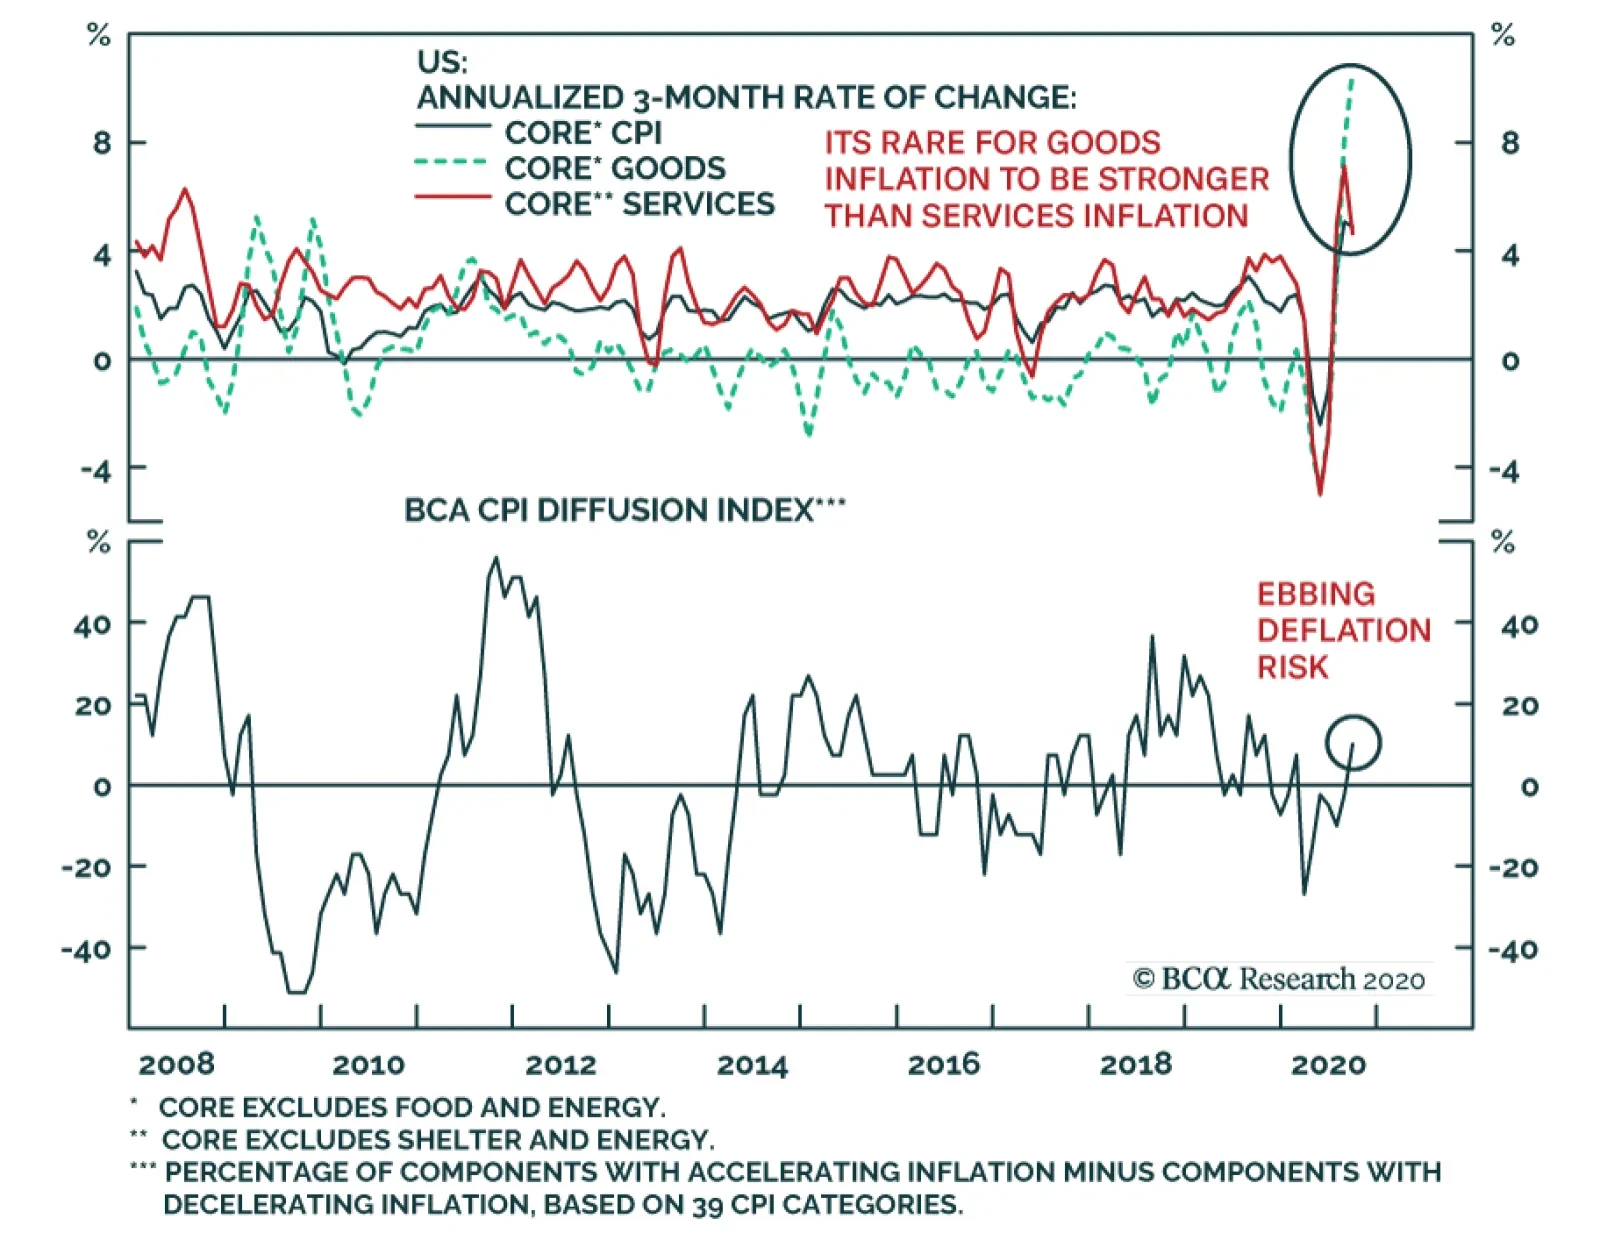
US consumer prices came in line with expectations in September, with core CPI inflation remaining at 1.7% annually and headline inflation perking up to 1.4%. Nonetheless, short-term dynamics reveal a marginal cooling of monthly core inflation. This moderation…
Highlights Duration: Prospects for more pre-election fiscal stimulus are slim. But with the Democrats gaining ground in the polls, the bond market will stay focused on rising odds of a blue sweep election and greater fiscal stimulus in early 2021. Municipal Bonds: Municipal bonds offer exceptional value relative to both US Treasuries and corporate credit. Not only that, but rising odds of a blue sweep election make state & local government fiscal relief increasingly likely. Investors should overweight municipal bonds in US fixed income portfolios. Economy: The economic recovery continues to roll on, but it will be some time before the output gap is closed and inflation starts to rise. Slow consumer and corporate credit growth suggest that animal spirits have not yet taken hold. Meanwhile, the falling unemployment rate masks a persistent uptrend in the number of permanently unemployed. Feature Chart 1Breakout
Breakout
Breakout
After having been lulled to sleep by several months of stagnant yields, bond investors experienced a minor shockwave in early October. The 10-year Treasury yield and 2/10 slope both broke out of well-established trading ranges and implied interest rate volatility bounced off all-time lows to reach its highest level since June (Chart 1). We suspect this might turn out to be just the first small tremor in a tumultuous month leading up to the US election. Specifically, there are two main political risks that will be resolved within the next month. Both have major implications for the bond market. Bond-Bullish Risk: No More Stimulus Before The Election The first risk is the possibility that the current Congress will not deliver any more fiscal stimulus. This increasingly looks like less of a possibility and more of a likelihood, especially after the president tweeted that he is halting negotiations with House Democrats. While he partially walked those comments back the next day, the fact remains that there is very little time between now and November 3rd, and the two sides remain at loggerheads. We have argued that more household income support from Congress is necessary. Otherwise, consumer spending will massively disappoint during the next year.1 However, it could take a few more months before this becomes apparent in the consumer spending data. Real consumer spending still rose in August, though much less quickly than it did in June and July (Chart 2). Meanwhile, August disposable income remained above pre-COVID levels, as it continued to receive a boost from facilities related to the CARES act (Chart 2, bottom panel). This boost will fade as the CARES act’s money is doled out, pushing spending lower. That is, unless Congress enacts a follow-up bill. There are two main political risks that will be resolved within the next month and both have major implications for the bond market. It looks less and less likely that a bill will be passed this month but, depending on the election outcome, a follow-up stimulus bill could become more likely in January. If consumer spending can hang in for the next couple of months, then the bond market might look past Congress’ near-term failure. This appears to be what is happening so far. The stock market fell 1.4% last Tuesday after Trump tweeted about halting negotiations. The 10-year Treasury yield, however, dropped only 2 bps on the day. More generally, long-dated bond yields rose during the past month, even as stocks sold off and prospects for immediate fiscal relief dimmed (Chart 3). Chart 2September's Consumer Spending Report Is Critical
September's Consumer Spending Report Is Critical
September's Consumer Spending Report Is Critical
Chart 3Bonds Ignore Stock ##br##Market...
Bonds Ignore Stock Market...
Bonds Ignore Stock Market...
With all that in mind, we think September’s consumer spending data – the last month of data we will see before the election – are very important. If spending collapses, it might re-focus the market’s attention on Congress’ failure, sending bond yields down. However, we think the market would see through a modest drop in spending, especially if the election looks poised to bring us a larger bill in 2021. Bond-Bearish Risk: A Blue Sweep Election Chart 4...Take Cues From Election Odds
...Take Cues From Election Odds
...Take Cues From Election Odds
This brings us to the second big political risk that could influence bond yields during the next month: The possibility of a “blue sweep” election where the Democrats win control of the House, Senate and White House. This would clearly be a bearish outcome for bonds, as an unimpeded Democratic party would enact a large stimulus package – likely worth $2.5 to $3.5 trillion – shortly after inauguration. It appears that the bond market is already tentatively pricing-in this outcome. While the recent increase in bond yields is hard to square with weak equity prices and souring expectations for immediate stimulus, it is consistent with rising betting market odds of a blue sweep election (Chart 4). To underscore the bond bearishness of this potential election outcome, consider that not only would a unified Congress be able to quickly deliver another fiscal relief bill, but Joe Biden’s platform calls for even more spending on infrastructure, healthcare, education and other Democratic priorities. In total, Biden is proposing new spending of around 3% of GDP, only about half of which will be offset by tax increases (Table 1). Table 1ABiden Would Raise $4 Trillion In Revenue Over Ten Years
Political Risk Will Dominate In A Pivotal Month For The Bond Market
Political Risk Will Dominate In A Pivotal Month For The Bond Market
Table 1BBiden Would Spend $7 Trillion In Programs Over Ten Years
Political Risk Will Dominate In A Pivotal Month For The Bond Market
Political Risk Will Dominate In A Pivotal Month For The Bond Market
How likely is a “blue sweep” election? It is our Geopolitical Strategy service’s base case.2 Also, fivethirtyeight.com’s poll-based forecasting model sees a 68% chance that Democrats win the Senate, a 94% chance that they win the House and an 85% chance that Joe Biden wins the presidency. Investment Strategy These two political risks appear to put bond investors in a bit of a conundrum. On the one hand, if no stimulus bill is passed this month and September’s consumer spending data are weak, then bond yields could fall in the near-term. However, we are inclined to think that if all that occurs against the back-drop of rising odds of a blue sweep election outcome, the bond market will look beyond the near-term and yields will move higher on expectations of larger stimulus coming in January. As such, we retain our relatively pro-reflation investment stance. We recommend owning nominal and real yield curve steepeners, inflation curve flatteners and maintaining an overweight position in TIPS versus nominal Treasuries. All these positions are designed to profit from a rising yield environment.3 Municipal bonds look extremely cheap compared to other US fixed income sectors. We retain an “at benchmark” portfolio duration stance for now, for two reasons. First, while a blue sweep election outcome looks like the most likely scenario, it is not a guarantee. Second, even against the backdrop of greater government stimulus and continued economic recovery, the US economy will still be dealing with a large output gap next year that will temper inflationary pressures. This will keep the Fed on hold, limiting the upside in bond yields. That being said, the odds of another significant downleg in bond yields look increasingly slim. We will likely shift to a more aggressive “below-benchmark” duration stance this month, if our conviction in a blue sweep election outcome continues to rise. A Rare Buying Opportunity In Municipal Bonds No matter how you slice it, municipal bonds look extremely cheap compared to other US fixed income sectors. First, we can look at the spread between Aaa-rated munis and maturity-matched US Treasury yields (Chart 5). When we do this, we find that 2-year and 5-year municipal bonds trade at about the same yields as their Treasury counterparts. This is despite municipal debt’s tax-exempt status. Munis look even more attractive further out the curve, with 10-year and 30-year bonds trading at a before-tax premium relative to Treasuries. Chart 5Aaa Munis Versus ##br##Treasuries
Aaa Munis Versus Treasuries
Aaa Munis Versus Treasuries
Table 2Muni/Corporate Breakeven Effective Tax Rates (%)
Political Risk Will Dominate In A Pivotal Month For The Bond Market
Political Risk Will Dominate In A Pivotal Month For The Bond Market
Next, we can look at how municipal bonds stack up compared to corporates. We do this in a couple different ways. In Table 2, we start with the Bloomberg Barclays Investment Grade Corporate Index split by credit tier. We then find the General Obligation (GO) municipal bond that matches each corporate index’s credit rating and maturity and calculate the breakeven effective tax rate between the two yields. The breakeven effective tax rate is the effective tax rate that would make an investor indifferent between owning the municipal bond and the corporate bond. For example, if an investor faces an effective tax rate of 7%, they will observe the same after-tax yield in a 12-year A-rated GO municipal bond as they do in a 12-year A-rated corporate bond. If their effective tax rate is more than 7%, the muni offers an after-tax yield advantage. Alternatively, we can look at the relative value between munis and credit using the Bloomberg Barclays Municipal Indexes. In Chart 6A, we start with the average yield on the Bloomberg Barclays General Obligation indexes by maturity. We then find the US Credit index that matches the credit rating and duration of the municipal index and calculate the yield differential.4 We find that in all cases, for GO bonds ranging from 6 years to maturity and higher, the muni offers a before-tax yield advantage compared to the Credit Index. This is also true when we perform the same exercise using municipal revenue bonds instead of GOs (Chart 6B). Chart 6AGO Munis Versus Credit
GO Munis Versus Credit
GO Munis Versus Credit
Chart 6BRevenue Munis Versus Credit
Revenue Munis Versus Credit
Revenue Munis Versus Credit
You may notice that municipal bonds trade at a before-tax premium to credit in Charts 6A and 6B, but at a discount in Table 2. This is because we compare bonds by maturity in Table 2 and by duration in Charts 6A and 6B. Unlike investment grade corporates, municipal bonds often carry call options making them negatively convex and giving them a duration that is much shorter than their maturity. Cheap For A Reason, Or Just Plain Cheap? Chart 7State & Local Balance Sheets Will Weather The Storm
State & Local Balance Sheets Will Weather The Storm
State & Local Balance Sheets Will Weather The Storm
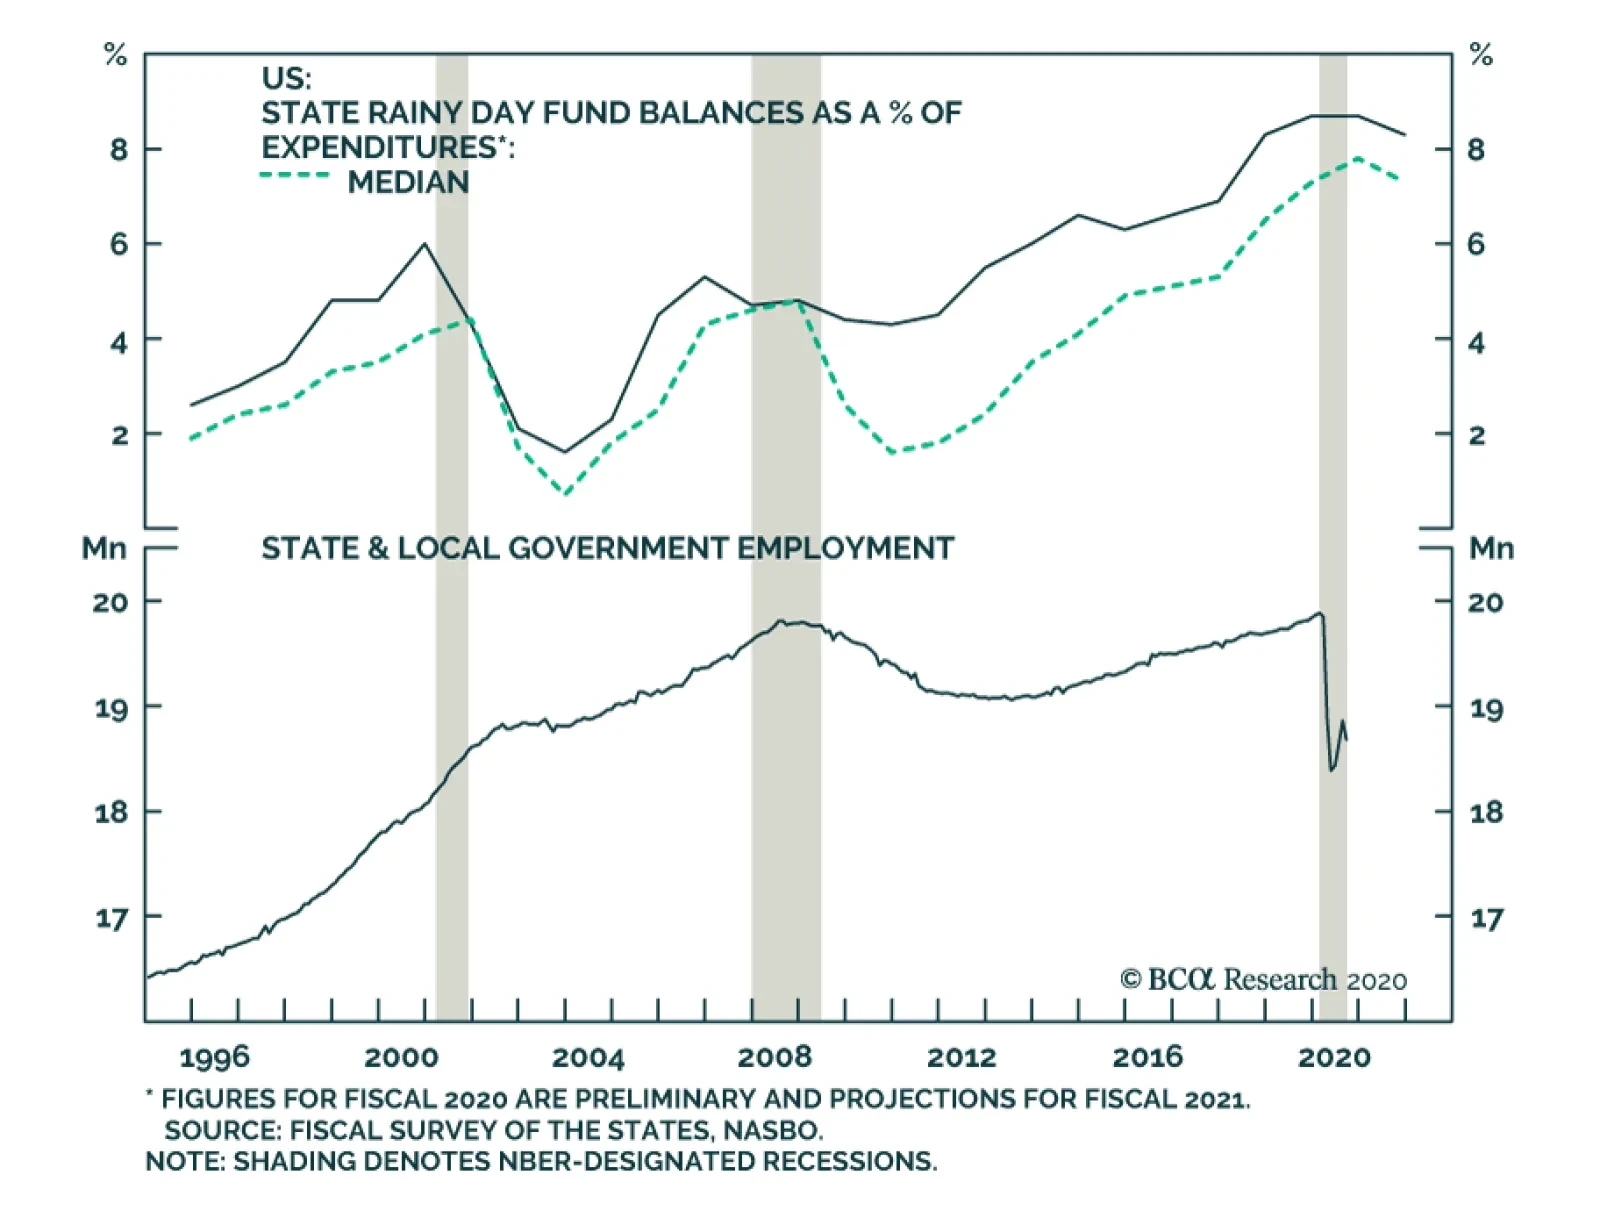
We have effectively demonstrated that municipal bonds offer value relative to both Treasuries and corporate credit. But attractive value is not enough to warrant an overweight allocation. Ideally, we would also like some degree of confidence that wide spreads won’t eventually be justified by a wave of downgrades and defaults. While state & local government balance sheets are certainly stressed, we see strong odds that the muni market will emerge from the COVID recession relatively unscathed. For starters, state & local governments were experiencing strong revenue growth prior to the pandemic (Chart 7, top panel). This allowed them to build rainy day funds up to all-time highs (Chart 7, panel 4). Second, income support for households from the CARES act helped prop up state & local income tax revenues in the second quarter (Chart 7, panel 2), though sales tax revenues took a significant hit (Chart 7, panel 3). Going forward, a blue sweep election scenario would not only provide more income support for households – helping income tax revenues – but a Democratic controlled Congress would also quickly deliver fiscal aid directly to state & local governments. In fact, it is this aid for state & local governments that is currently the key sticking point in fiscal negotiations. In the meantime, state & local governments will continue to clamp down on spending. This can already be seen in the massive drop in state & local government employment (Chart 7, bottom panel). This is obviously a drag on economic growth, but the combination of austerity measures and high rainy day fund balances will help municipal bonds avoid downgrades and defaults, at least until a fiscal relief bill is passed next year. While state & local government balance sheets are certainly stressed, we see strong odds that the muni market will emerge from the COVID recession relatively unscathed. Bottom Line: Municipal bonds offer exceptional value relative to both US Treasuries and corporate credit. Not only that, but rising odds of a blue sweep election make state & local government fiscal relief increasingly likely. Investors should overweight municipal bonds in US fixed income portfolios. Economy: Credit Growth & The Labor Market Credit Growth Slowing Chart 8No Animal Spirits
No Animal Spirits
No Animal Spirits
Of notable economic data releases during the past two weeks, we find it particularly interesting that both consumer credit and Commercial & Industrial (C&I) bank lending continue to slow (Chart 8). On the consumer side, massive income support from the CARES act and few spending opportunities caused households to pay down debt this spring. Then, after two months of modest gains, consumer credit fell again in August (Chart 8, top panel). This strongly suggests that, even as lockdown restrictions have eased, consumers aren’t yet ready to open up the spending taps. On the corporate side, firms received much less of a direct cash injection from Congress and were forced to take on massive amounts of debt to get through the spring and early summer months. But as of the second quarter, we recently observed that nonfinancial corporate retained earnings now exceed capital expenditures.5 This strongly suggests that firms have taken out enough new debt and that C&I bank lending will remain slow in the coming months. Cracks Showing In The Labor Market Chart 9Far From Full Employment
Far From Full Employment
Far From Full Employment
Finally, we should mention September’s employment report that was released two weeks ago (Chart 9). It is certainly positive that the unemployment rate continues to fall, but the main takeaway for bond investors should be that the US economy remains far from full employment, and therefore far away from generating meaningful inflationary pressure. While the unemployment rate fell for the fifth consecutive month, it is now dropping much less quickly than it did early in the summer (Chart 9, panel 2). Also, we continue to note that labor market gains are entirely concentrated in temporarily unemployed people returning to work. The number of permanently unemployed continues to rise (Chart 9, bottom panel). Bottom Line: The economic recovery continues to roll on, but it will be some time before the output gap is closed and inflation starts to rise. Slow consumer and corporate credit growth suggest that animal spirits have not yet taken hold. Meanwhile, the falling unemployment rate masks a persistent uptrend in the number of permanently unemployed. Appendix The Fed rolled out a number of aggressive lending facilities on March 23. These facilities focused on different specific sectors of the US bond market. The fact that the Fed has decided to support some parts of the market and not others has caused some traditional bond market correlations to break down. It has also led us to adopt of a strategy of “Buy What The Fed Is Buying”. That is, we favor those sectors that offer attractive spreads and that benefit from Fed support. The below Table tracks the performance of different bond sectors since the March 23 announcement. We will use this to monitor bond market correlations and evaluate our strategy’s success. Table 3Performance Since March 23 Announcement Of Emergency Fed Facilities
Political Risk Will Dominate In A Pivotal Month For The Bond Market
Political Risk Will Dominate In A Pivotal Month For The Bond Market
Ryan Swift US Bond Strategist rswift@bcaresearch.com Footnotes 1 Please see US Bond Strategy Weekly Report, “More Stimulus Needed”, dated September 15, 2020, available at usbs.bcaresearch.com 2 Please see Geopolitical Strategy Weekly Report, “It Ain’t Over Till It’s Over”, dated October 9, 2020, available at gps.bcaresearch.com 3 For more details on these recommended positions please see US Bond Strategy Weekly Report, “Positioning For Reflation And Avoiding Deflation”, dated August 11, 2020, available at usbs.bcaresearch.com 4 Note that we use the US Credit Index in Charts 6A and 6B. This index includes the entire US corporate bond index but also some non-corporate credit sectors like Sovereigns and Foreign Agency bonds. 5 Please see US Bond Strategy Weekly Report, “Out Of Bullets”, dated September 29, 2020, available at usbs.bcaresearch.com Fixed Income Sector Performance Recommended Portfolio Specification
Dear client, Next Monday, October 19, we will be hosting our quarterly webcast, “From Alpha To Omega With Anastasios”, at 10am EST; Matt Gertken, BCA’s Geopolitical Strategist will be our guest on the eve of the US Presidential Election. Our regular weekly publication will resume on Monday October 26, 2020. Kind Regards, Anastasios Highlights Portfolio Strategy Homebuilders are more than fully priced, discounting high margins as far as the eye can see and no end to demand. The specter of higher interest rates, lumber inflation, stealing demand from the future, unfriendly bankers and uncertainty with regard to a fresh stimulus package more than offset the positives, and compel us to issue a downgrade alert for the S&P homebuilding index. While the price of credit, loan growth prospects and credit quality all weigh on relative bank performance. A fiscal stimulus bill, depressed valuations and a Fed induced resumption of dividend hikes and share buybacks keep us on the sidelines in the S&P banks index. Recent Changes There are no changes to our portfolio this week. Table 1
COVID Fatigue, Fiscal Fatigue, Election Fatigue
COVID Fatigue, Fiscal Fatigue, Election Fatigue
Feature Equities seesawed last week as President Trump returned to the White House (WH) and injected fresh volatility in markets signaling that there will be no fiscal deal prior to the elections. The SPX immediately gapped down and we cannot stress enough the importance of our newly configured Fiscal Policy Loop: fiscal hawkishness causes skittishness in markets culminating to a classic BCA riot point and then policymakers relent and fiscal dovishness restores the equity bull market (Figure 1). While we cannot rule out a slimmed-down stimulus package deal by later this month, fiscal policy- and election-related uncertainties remain elevated. The daily back-and-forth on where Congress and the WH stand with passing a new stimulus bill coupled with the prospects of a contested election that would drag on the presidential race likely into December, have caused investor fatigue. The sooner both of these uncertainties recede, the quicker the SPX will climb to fresh all-time highs (Chart 1). Figure 1The Fiscal Policy Loop
COVID Fatigue, Fiscal Fatigue, Election Fatigue
COVID Fatigue, Fiscal Fatigue, Election Fatigue
Chart 1Receding Uncertainty Will Boost Stocks
Receding Uncertainty Will Boost Stocks
Receding Uncertainty Will Boost Stocks
We have shown in recent research, and update today, that the fourth year of presidential cycles finds the SPX ending the year on average in the green with a calendar return in the high single digits (Chart 2). Peering back in 2016 is instructive as that presidential election cycle year was in some ways similar to the current one. The economy, in particular, was fighting off a manufacturing recession that spread and infected the services sectors as the vast majority of S&P GICS1 sectors saw profit contraction and more importantly revenue declines. Chart 3 shows a number of asset classes and compares 2016 with 2020. The 10-year US Treasury yield appears poised to rebound significantly, especially if Congress passes a fresh fiscal package that aides the parts of the economy that need the stimulus checks most. Fiscal easing uncertainty remains a thorny issue across different markets and if history is an accurate guide, the SPX could glide lower into the November election before rallying into year-end. Chart 2Back Up Near The Average Profile
Back Up Near The Average Profile
Back Up Near The Average Profile
Meanwhile, a number of investors we talk to also experience COVID-19 fatigue (Chart 4). For the better part of the last 10 months media has constantly bombarded the world with pandemic news, and rightly so. However, all this seems dystopian by now, and we cannot wait for a semblance of normality to make a comeback, which a vaccine will definitively bring about. The equity market has been indurated to this news-flow and has shaken-off the recession. When the vaccine does arrive likely next year, profits will also return back to trend, as we have been arguing for some time, because the global economy will fully reopen. Chart 32016 Versus 2020
2016 Versus 2020
2016 Versus 2020
Already, if we juxtapose leading soft economic data surprises with lagging hard economic data surprises, it is clear that a stellar profit recovery looms (second panel, Chart 5). Similarly, within soft the data universe, the ISM new orders-to-inventories ratio paints a rosy picture for an earnings recovery in 2021 (third panel, Chart 5). Even within hard economic data, a simple liquidity indicator we have used in the past comparing industrial production (IP) with M2 money stock signals that S&P profits have troughed (IP vs. M2 shown advanced, bottom panel, Chart 5) Chart 4COVID Fatigue
COVID Fatigue
COVID Fatigue
Finally, the US Equity Strategy’s four-factor macro profit growth model has slingshot higher recently and signals that a return to $162 level of EPS in calendar 2021 is a high probability outcome (Chart 6). Netting it all out, we are in the tail end of the equity market correction and as election and fiscal policy uncertainties ebb, they will pave the way for a robust SPX rally. Chart 5Profit Recovery On Track
Profit Recovery On Track
Profit Recovery On Track
Chart 6EPS Model Concurs
EPS Model Concurs
EPS Model Concurs
This week, we continue with our strategy of preferring beaten-down cyclicals to defensives and steer the portfolio away from another safe haven staples industry via downgrading a consumer goods subgroup to underweight. We also delve deeper into the banking industry highlighting some cracks in small commercial banks. Put Homebuilders On Downgrade Alert Homebuilders have had a monster run since the depths of the recession back in March and the question a lot of our clients are now asking is: does it make sense to chase them higher at the current juncture? The short answer is no. Before we get into the details of our analysis a brief recap of our recent residential real estate-related moves is in order. Going into the March carnage we were cyclically underweight the niche homebuilding index. Moreover, last December we had identified homebuilders as a high-conviction underweight in our annual Key Views report. We monetized relative gains of 41% and 43%, respectively from both positions and lifted exposure to a benchmark allocation. While in retrospect we should have upgraded all the way to overweight, we did manage to participate in the V-shaped housing-related returns by opting to go overweight the mega cap home improvement retail index instead. In addition, this summer we eked out another 10% return from a long homebuilders/short REITs pair trade. Homebuilders are enjoying the single family home renaissance as the pandemic has turbo-charged the work from home movement and employees are rushing to move into comfortable spaces in the suburbs as the traditional office is literally declared dead. Indeed, housing starts and permits have renormalized, the drubbing in interest rates has boosted affordability and caused a knee jerk reaction in the mortgage application purchase index, and sell-side analysts are fighting hand-over-fist to upgrade profit projections for the homebuilding group (Chart 7). The end result has been a boom in new home sales that are trouncing existing home sales, and the NAHB’s survey of prospective homebuyers continues to paint a rosy picture for additional demand for new single family homes especially given the low inventory of homes (top & third panels, Chart 8). Chart 7Housing Tailwinds
Housing Tailwinds
Housing Tailwinds
Chart 8Price Concessions Generate Volume
Price Concessions Generate Volume
Price Concessions Generate Volume
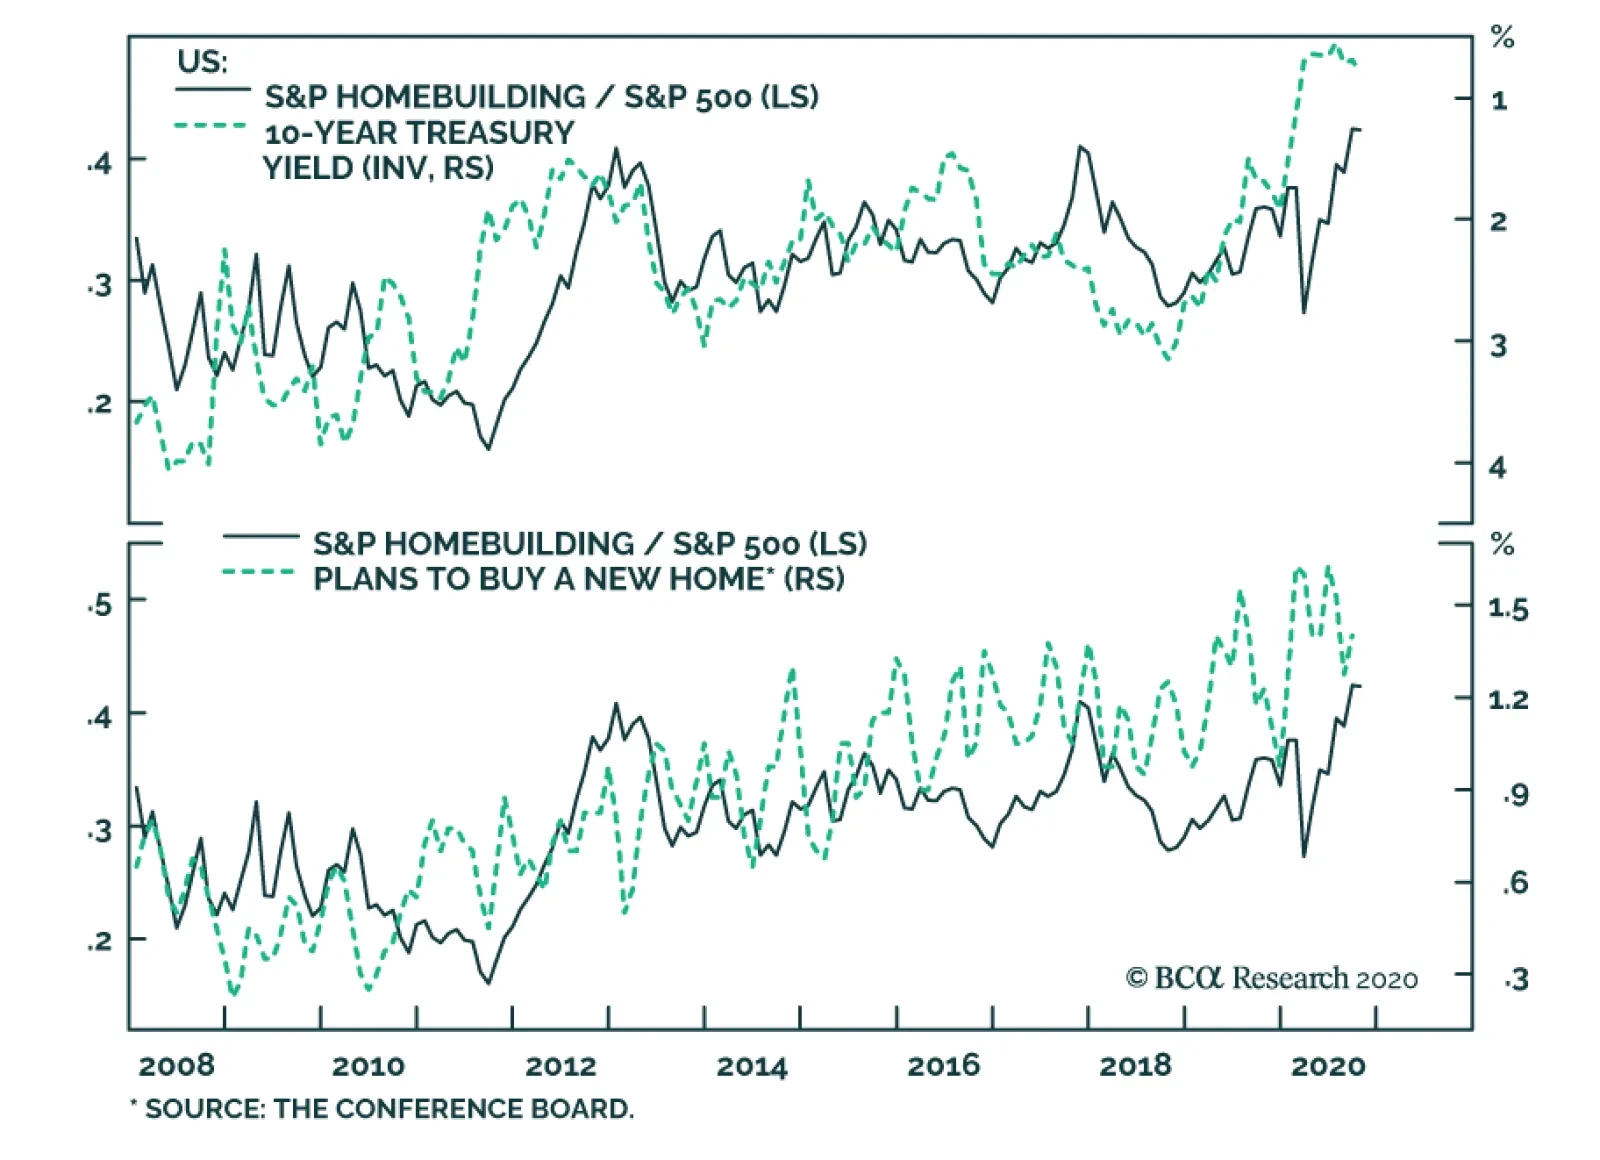
This is where all the good news ends. With respect to selling prices, homebuilders are making price concessions compared with existing homes and also in absolute terms new home prices are deflating (second & bottom panels, Chart 8). Therefore, at close to 15%, homebuilding profit margins are near all-time highs and under threat especially from a firming industry wage bill (second & third panels, Chart 9). Tack on surging lumber inflation and a profit margin squeeze is a high probability outcome (bottom panel, Chart 9). As a reminder framing lumber, on average, comprises 15% of a new single family home’s total input costs. While the NAHB survey points to brisk demand for new homes, the sister Conference Board survey shows that consumers’ appetite for a new home has crested (second & third panels, Chart 10). With consumers rushing to move to the suburbs due to the pandemic, there is an element of bringing housing demand forward. Chart 9Beware Margin Squeeze
Beware Margin Squeeze
Beware Margin Squeeze
Chart 10Good News Fully Priced
Good News Fully Priced
Good News Fully Priced
Worrisomely, if the economy continues to open up then interest rates should continue to back up. From all the major asset classes the 10-year Treasury yield is the one that has yet to discount a V-shaped economic recovery. The implication is that rising interest rate would dent affordability and at the margin weigh on housing demand (10-year Treasury yield shown inverted, top panel, Chart 10). Moving on to the credit backdrop, while demand for residential real estate loans has recovered, bankers refuse to extend mortgage credit (second & third panels, Chart 11). According to the latest Fed H8 weekly credit release, residential real estate loans are on the verge of contraction (bottom panel, Chart 11). Finally, the tug-of-war on the fiscal package front is also threatening to sustain the unemployment rate near double digits, which could jeopardize the housing recovery. Historically, housing starts have been near perfectly inversely correlated with the unemployment rate and the current message is for a leveling off in residential construction activity (middle panel, Chart 12). The recent homebuilding run has pushed relative valuations from undervalued to overvalued. The relative P/S ratio trades roughly 30% above the historical mean (a three-year high), and leaves no cushion for any mishaps (bottom panel, Chart 12). Chart 11Bankers Refusing To Dole Out Loans
Bankers Refusing To Dole Out Loans
Bankers Refusing To Dole Out Loans
Chart 12In Desperate Need Of Fiscal Help
In Desperate Need Of Fiscal Help
In Desperate Need Of Fiscal Help
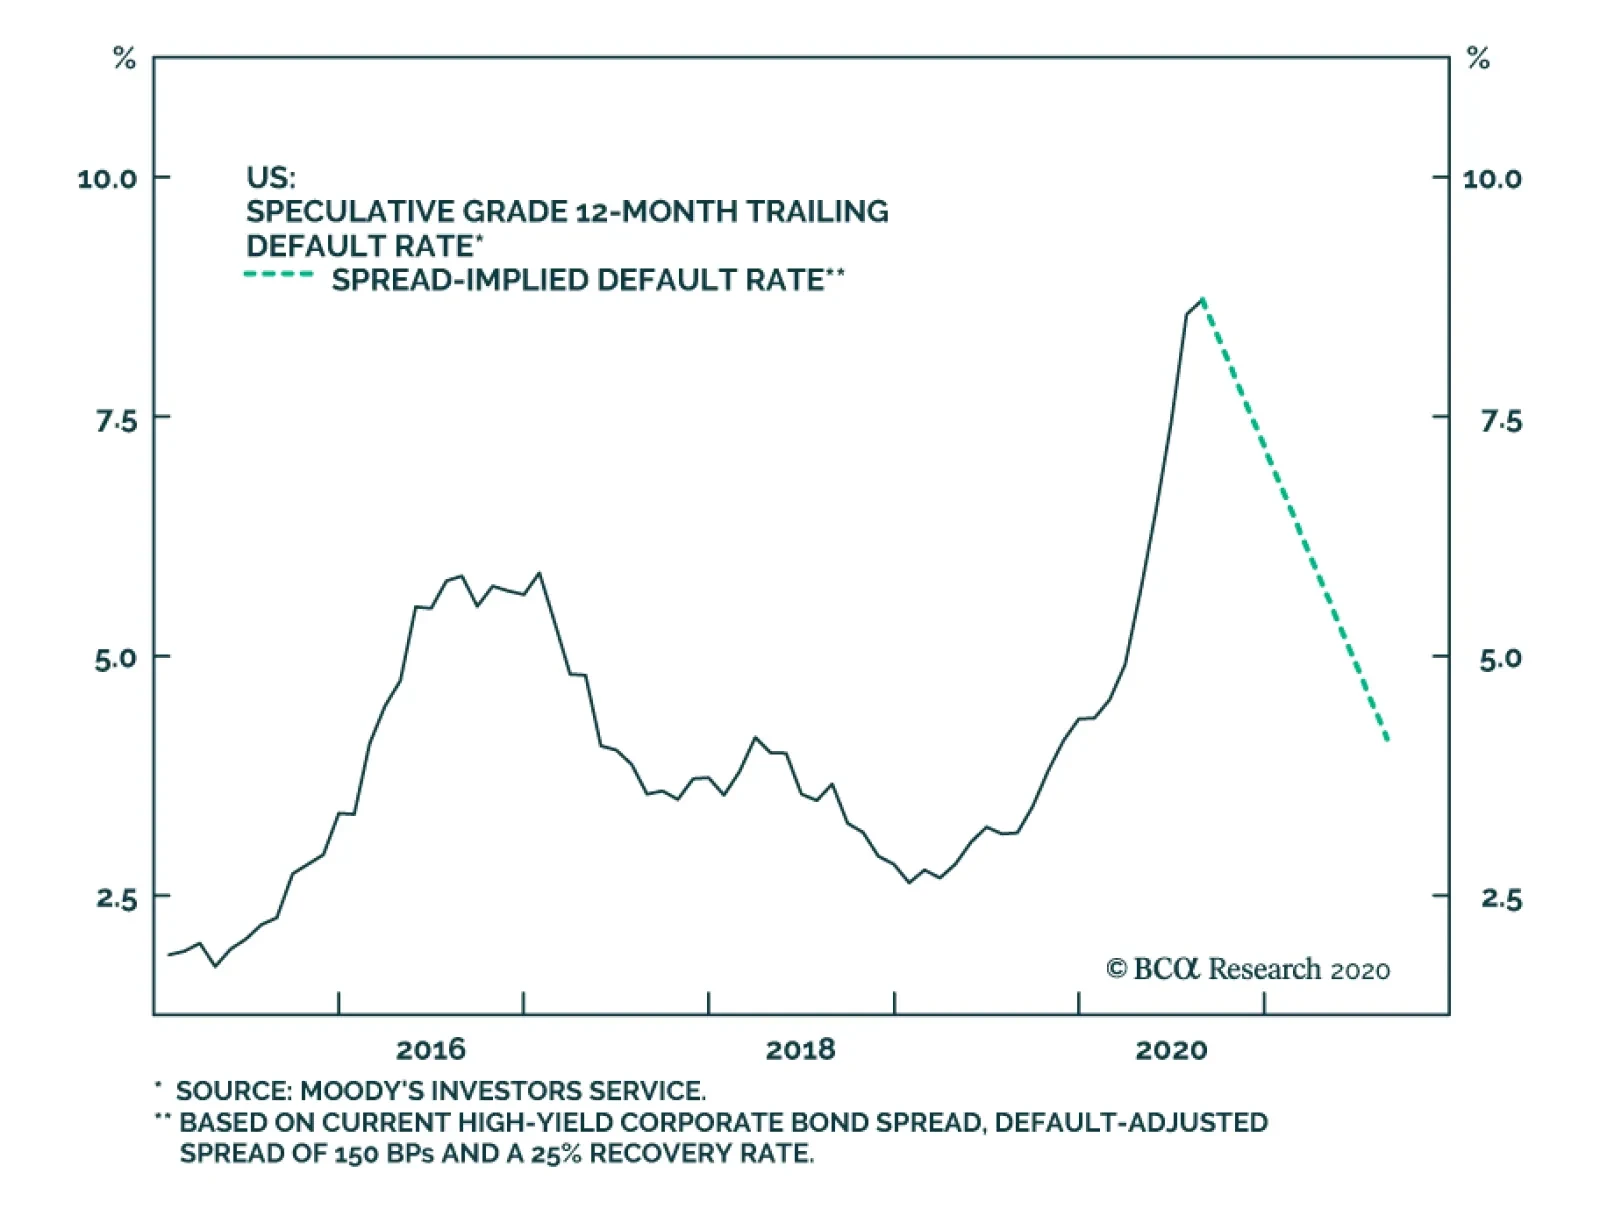
Netting it all out, homebuilders are more than fully priced, discounting high margins as far as the eye can see and no end to demand. The specter of higher interest rates, lumber inflation, stealing demand from the future, unfriendly bankers and uncertainty with regard to a fresh stimulus package more than offset the positives, and compel us to issue a downgrade alert for the S&P homebuilding index. Bottom Line: Stay neutral the S&P homebuilders index, but it is now on our downgrade watch list. The ticker symbols for the stocks in this index are: BLBG: S5HOME – LEN, PHM, DHI, NVR. A Few Words On Banks Pundits around the globe focus on Eurozone and pan-European banks and argue that these outfits have been value destroyers since the history of the data series in late-1986 (bottom panel, Chart 13). Similarly, US banks relative share prices peaked in the mid-1970s and have never looked back, and very recently have tumbled to fresh all-time lows whether one uses monthly, weekly or daily data (top panel, Chart 13). Meanwhile, the recent drubbing in relative share prices suggests that loan loss provisioning is not over. In fact, Q3 loan loss reserves will surpass the level hit in the GFC, and likely close in on the $300bn mark (provisions shown inverted, Chart 14). Chart 13Banks, The World Over, Are Value Destroyers
Banks, The World Over, Are Value Destroyers
Banks, The World Over, Are Value Destroyers
Chart 14More Loan Losses Loom…
More Loan Losses Loom…
More Loan Losses Loom…
Historically, loan loss provisions are the mirror image of bank net operating income and most importantly bank profits decline as provisioning increases (Chart 15). Worrisomely, the longer the new stimulus checks take to arrive, the longer it will take banks to rebound. Banks have been semi-sheltered from the recession courtesy of eviction/foreclosure moratorium as well as mortgage forbearance agreements. Absent a fresh stimulus package, the unemployment rate will remain elevated, warning that lagging non-performing loans will skyrocket (bottom panel, Chart 16). Chart 15…Which Will Weigh On Profits
…Which Will Weigh On Profits
…Which Will Weigh On Profits
Chart 16Fiscal Policy Easing To The Rescue?
Fiscal Policy Easing To The Rescue?
Fiscal Policy Easing To The Rescue?
Tack on the year-to-date more than halving in the 10-year US Treasury yield and the earnings outlook remains grim for banks (top & middle panels, Chart 17). The transmission mechanism is through net interest margins (NIMs). The fourth panel of Chart 17 highlights that the pair have been joined at the hip and all-time lows in the 10-year US Treasury yield have sank bank NIMs below 3%, which is another all-time low since the history of the FDIC data. Credit growth has crested and our loans and leases model suggests that loan growth will continue to decelerate into 2021 (second panel, Chart 17). Not only is there lack of appetite for new overall loan uptake, but bankers are stringent with extending credit to businesses and consumer alike, according to the most recent Fed Senior Loan Officer survey (Chart 18). Chart 17Credit Growth Blues
Credit Growth Blues
Credit Growth Blues
Chart 18Lack Of Loan Demand And Tightening Credit Supply
Lack Of Loan Demand And Tightening Credit Supply
Lack Of Loan Demand And Tightening Credit Supply
However, there are three significant offsets to all these stiff headwinds that prevent us from downgrading banks to an underweight stance. First, the 10-year US Treasury yield is one of the few assets that has yet to discount any economic recovery. Thus, as uncertainty lifts post the November election, the economy continues to open up and Congress and the new President manage to pass a fresh fiscal stimulus bill, all this could catalyze a catch up phase in the long bond yield. Second, valuations offer a deep enough discount to absorb a little bit of more negative news as analysts and investors alike have thrown in the towel in banks (bottom panel, Chart 19). Finally, the credible Fed’s stress test loom by year-end and assuming banks pass them with flying colors a resumption of shareholder friendly activities will boost the allure of owing banks and unwind extremely oversold conditions (middle panel, Chart 19). In sum, while the price of credit, loan growth prospects and credit quality all weigh on relative bank performance. A fiscal stimulus bill, depressed valuations and a Fed induced resumption of dividend hikes and share buybacks keep us on the sidelines in the S&P banks index. Chart 19Unloved And Under-owned
Unloved And Under-owned
Unloved And Under-owned
Bottom Line: Stay neutral the S&P banks index, but keep it on the downgrade watch list. The ticker symbols for the stocks in this index are: BLBG: S5BANKX – JPM, BAC, C, WFC, USB, TFC, PNC, FRC, FITB, MTB, KEY, SIVB, RF, CFG, HBAN, ZION, CMA, PBCT. Anastasios Avgeriou US Equity Strategist anastasios@bcaresearch.com Current Recommendations Current Trades Strategic (10-Year) Trade Recommendations
Drilling Deeper Into Earnings
Drilling Deeper Into Earnings
Size And Style Views July 27, 2020 Overweight cyclicals over defensives April 28, 2020 Stay neutral large over small caps June 11, 2018 Long the BCA Millennial basket The ticker symbols are: (AAPL, AMZN, UBER, HD, LEN, MSFT, NFLX, SPOT, TSLA, V). January 22, 2018 Favor value over growth
Highlights Hopes for another round of fiscal stimulus before the election were apparently torpedoed last week, … : The White House’s 180-degree turn to abandon stimulus talks may initially have been meant as a negotiating ploy, but it pushed House leadership to dig in, and a major stimulus agreement ahead of the election appears to be slipping out of reach. … but stocks rose anyway, … : Financial markets seem to have decided that a failure to reach agreement on a stopgap stimulus measure now increases the chances for a no-holds-barred package after the new year. … and they just may be getting it right: There are some indications that households have stored up enough nuts to make it through a fourth quarter with nothing more than automatic fiscal stabilizers. If they can get by until a torrent of new stimulus is released in February, equities may well be the place to be. We Need More Stimulus … We have been talking about fiscal stimulus ever since the pandemic arrived on US shores. It and monetary accommodation are the economic tools policymakers have to combat the virus and fiscal stimulus has loomed increasingly larger given that the Fed has done nearly all it can. Our constructive view on risk assets and the economy stems from our conviction that fiscal policymakers have the power to bridge the pandemic’s economic gap and will eventually summon the will to exercise it. We have not previously delved into why the stimulus is needed, however, so we highlight the primary reasons now. Labor market hysteresis: The longer an individual is out of the work force, the greater the probability that his/her skills will erode to the point that s/he may become unemployable. If enough workers suffer this fate, America’s labor pool will be appreciably diminished. Since long-run economic growth is simply the sum of the growth of the working-age population and growth in productivity, a shrunken labor force will crimp potential economic growth. Slower economic growth would lead to weaker earnings growth and more difficulty servicing private- and public-sector debt, signaling trouble for risk assets and Treasuries. Although the unemployment rate retreated very quickly from the postwar high it established in April (Chart 1, top panel), the ranks of the long-term unemployed, defined as workers out of work for at least 27 weeks, are poised to swell. The share of the unemployed who have been out of work for at least 15 weeks is extremely high relative to its postwar history, just shy of early 2010’s 60% record (Chart 1, bottom panel). Once layoffs recede, the mass of long-term unemployed workers will eventually be whittled down, but the process did not begin for a full year after initial jobless claims peaked after the great recession (Chart 2). With claims’ four-week moving average having stalled well above its GFC peak and fresh layoff announcements from businesses in the virus’ crosshairs like Disney, Regal Cinemas and several airlines, the pipeline of the newly unemployed will remain full without additional aid. Chart 1The Unemployment Rate Is Falling, But Its Average Duration Is Rising
The Unemployment Rate Is Falling, But Its Average Duration Is Rising
The Unemployment Rate Is Falling, But Its Average Duration Is Rising
Chart 2It Takes A While For Claims To Recede ...
It Takes A While For Claims To Recede ...
It Takes A While For Claims To Recede ...
State and local governments, which account for over 13% of nonfarm payrolls, are also poised to swell the ranks of the unemployed. Hamstrung by balanced-budget laws, many public entities have no choice but to reduce headcount in the face of plummeting tax revenues. The difficulty of calibrating seasonal adjustment factors with this year’s shuffled school calendar may have distorted summer payroll data, but the empirical record suggests that state and local government payrolls do not bottom until well after recessions end (Chart 3). Without generous infusions of federal aid, state and local government layoffs are likely to be a lingering drag. Chart 3... And State And Local Governments Keep Shedding Workers Until They Come Way Down
... And State And Local Governments Keep Shedding Workers Until They Come Way Down
... And State And Local Governments Keep Shedding Workers Until They Come Way Down
Self-reinforcing bankruptcies: Diminished potential long-run growth would be a drag for investors, but the most acute near-term concern is a wave of bankruptcies. In the absence of CARES Act provisions that expanded eligibility for unemployment insurance (UI) benefits, extended the period over which laid-off workers could collect UI benefits and granted the $600 weekly federal UI benefit supplement, along with various measures encouraging banks and forcing mortgage servicers to establish lender forbearance programs, consumer credit performance would have been significantly worse. Despite the pandemic shock, TransUnion reports that delinquencies across all consumer loan categories, ex-autos, have been steadily falling since March, and only auto loan delinquencies were higher (by a mere 7 basis points) in August 2020 than they were in August 2019. Bankruptcies beget bankruptcies. If policymakers can keep some creditworthy borrowers in viable industries out of the path of the falling dominoes, the economy will bounce back faster once the virus is contained. If consumer delinquencies (Chart 4) were to rise anything close to the level implied by the unemployment rate, the effects would reverberate across the banking system and the credit markets. Reported delinquencies have been held down by forbearance measures, which have had the cosmetic effect of removing many of the most vulnerable loans from the delinquency ratios, but through the second quarter the biggest banks uniformly reported that most borrowers enrolled in their forbearance programs were making at least some payments on their loans and that a far greater share than they had expected were exiting the programs without requesting extensions. We will hear later this week if that surprisingly benevolent trend held across the third quarter, most of which unfolded after the expiration of key CARES Act provisions, but management comments in public appearances last month suggest that it did. Without another round of federal aid, state and local government layoffs will continue. Chart 4The CARES Act Worked
The CARES Act Worked
The CARES Act Worked
Rising delinquencies and widening bond spreads typically sap banks’ and bond investors’ ardor for making new loans, establishing a vicious circle in which weak credit performance leads to reduced credit availability and more onerous terms. Banks have tightened lending standards on cue (Chart 5), but ultra-accommodative monetary policy and unprecedentedly generous fiscal policy have blunted tighter bank standards’ impact. The former made bond investors forget their fears, paving the way for a bonanza of investment grade and high yield issuance (Chart 6), while households’ transfer windfall supported consumer credit performance and made it possible for consumers to pay down a good chunk of their outstanding credit card balances (Chart 7). In 2020's hall of mirrors, household income rises, and personal loan delinquencies decline, despite a vicious recession. Chart 5Banks Tightened Lending Standards, ...
Banks Tightened Lending Standards, ...
Banks Tightened Lending Standards, ...
Chart 6... But The Bond Market Welcomed Large Corporate Borrowers With Open Arms
... But The Bond Market Welcomed Large Corporate Borrowers With Open Arms
... But The Bond Market Welcomed Large Corporate Borrowers With Open Arms
The result is that emergency policy measures have so far staved off defaults and bankruptcies by viable creditworthy borrowers but reduced credit availability could undo those victories going forward. Chart 7Consumer Loan Balances Typically Rise At The Onset Of A Recession
Consumer Loan Balances Typically Rise At The Onset Of A Recession
Consumer Loan Balances Typically Rise At The Onset Of A Recession
… But Do We Need It Right Away? Though they differ on their proposals for the ideal size and composition of a new package, mainstream economists unanimously support an additional round of stimulus. A stickier question we’ve been mulling over is when that package is needed. According to former Obama Council of Economic Advisers chairman Jason Furman, “The answer is, two months ago.”1 Furman’s formidable public policy credentials notwithstanding, financial markets do not share his sense of urgency. Given that the National Multifamily Housing Council’s Rent Tracker showed that residential rent collections haven’t missed a beat since CARES Act provisions expired in late July, markets may be on to something. September collections were a tick better than August’s and were within a percentage point of year-ago collections, while October is off to a better start than all of the last three months and has matched last year’s pace (Table 1). The rent collection data provide a real-world example of the ongoing impact of generous fiscal transfers. Despite the expiration of the federal UI supplement in July, August personal income exceeded February’s pre-pandemic level. Table 1Apartment Tenants Are Paying Their Rent
The Marshmallow Test
The Marshmallow Test
Even without that key pillar of the CARES Act, households were able to add another $100 billion of savings to the $1 trillion cache they amassed from March to July over and above the savings they would otherwise have accumulated if income had grown in line with nominal trend GDP growth and the savings rate had remained constant at its pre-pandemic level. Some vulnerable households will surely suffer, but it looks to us like the aggregate savings stash may be able to see the economy through the rest of the year from a consumption perspective (Table 2). That would suggest that the salubrious effect on household wealth from consumer belt tightening and CARES Act transfers may give policymakers some extra leeway to cobble together the next round. Table 2Savings Might Be Able To Plug The Stimulus Gap
The Marshmallow Test
The Marshmallow Test
Markets apparently reached that conclusion themselves, as they now seem to be rooting for the Democrats to take both the Senate and the White House. That outcome would likely postpone the next round of fiscal stimulus until February but would ultimately result in much more aid. The way that stocks swiftly shrugged off their initial disappointment over the termination of the latest stimulus talks suggests that they’re happy to forego a band-aid now for more significant assistance later. The situation is fluid, and Republicans may come around to providing immediate aid that would boost their electoral prospects, but we think markets could survive a fourth quarter without new fiscal stimulus, especially when it would increase the prospects of installing a Congress that shares the Fed's determination to err on the side of doing too much. Delayed Gratification In a now famous experiment, early childhood researchers at Stanford University seated a series of nursery school children at a table with a marshmallow, telling each child s/he could eat it, but if s/he held off until the researcher returned to the room (after an interval of several minutes), s/he would get a second marshmallow. The study’s subsequent conclusion that a child’s ability to delay gratification was an excellent predictor of his/her future success has since been questioned, but investors seem perfectly willing to forego modest stimulus now for a much richer reward in 2021. That perspective applies to the SIFI banks as well. Delaying the provision of additional support to households, businesses and state and local governments may cause a little near-term pain, but it’ll be well worth it to get a super-sized package promising much more long-term gain. The excess savings households built up across the spring and summer are large enough to cover projected consumption shortfalls, though it remains to be seen if they will be willing to part with them while the virus continues to spread. Our overweight recommendation is rooted in our conviction that extraordinary fiscal support will keep the SIFI banks’ ultimate credit losses well below market expectations. No support would force us to close out our recommendation, a skinny package now with uncertain follow-up later would undermine it, and a CARES Act sequel early next year would make it even more robust. A Democratic sweep would pave the way for Congress to match the Fed’s whatever-it-takes approach, greatly relieving the distress of consumers and small businesses as well as those who have lent to them. No one can be sure of how the election dynamics will unfold over the next three weeks, but it would be a mistake to walk away from SIFIs while the Democrats’ prospects are improving. We are therefore staying the course, further heartened by the SIFIs’ bombed-out valuations, which continue to imply gaping credit losses, and their failure to stay down in response to last week’s ostensibly bad news items. Investors would do well to heed our geopolitical strategy team’s admonition that single-party control of the White House and Capitol Hill contains risks that markets are currently overlooking, but our endorsement of the SIFIs has always been a cyclical call, not a tactical one. If Congress is eventually poised to join the Fed in a whatever-it-takes campaign, the SIFIs’ credit losses will be far smaller than feared and their stocks will have a long runway for unwinding their 2020 losses (Chart 8). Chart 8The SIFIs Would Benefit More From Supersized Stimulus Than The Overall Equity Market
The SIFIs Would Benefit More From Supersized Stimulus Than The Overall Equity Market
The SIFIs Would Benefit More From Supersized Stimulus Than The Overall Equity Market
Doug Peta, CFA Chief US Investment Strategist dougp@bcaresearch.com Footnotes 1 Casselman, Ben and Tankersley, Jim, "Anxious for a Lifeline, the U.S. Economy Is Left to Sink or Swim," New York Times, accessed October 8, 2020.
Is the long-period of underperformance of small-cap stocks ending? From March to June, it seemed to be the case, with the Russell 2000 outperforming the S&P 500 by nearly 15%. Yet, ever since, small-cap stocks have traded sideways relative to large-cap…