United States
In the Tuesday morning session of our BCA Research Annual investment Conference, Professor Larry Summers mentioned that the disconnect between stock prices and economic activity was a consequence of Secular Stagnation. Secular Stagnation causes a rise in…

Neutral - Downgrade Alert
Small Bank Trouble Brewing
Small Bank Trouble Brewing
Absent another fiscal package, banks risk digesting a new wave of credit defaults, further increasing their loan loss provisions as pandemic wounds remain open. Importantly, according to the latest Fed data, small banks1 are at the forefront of sloppy lending activity, warning that those weaker banks have higher exposure to defaults than large banks.2 Small bank C&I loan growth reached a whopping 50% per annum growth rate (second panel). Commercial real estate (CRE) loans are also expanding at a higher rate in small banks compared with large banks (third panel). With regard to concentration, small banks have been making inroads in feverishly doling out loans versus large banks. The former now comprise 40% of total C&I loan books (the largest credit category, bottom panel) and 2/3 of CRE loans – the second largest loan category with $2.4tn outstanding. Inevitably, some loans will sour because of the pandemic and the longer it takes Congress to pass a fresh stimulus bill the higher the pain for banks. One way out of this mess will likely be via much needed industry consolidation. As a reminder the US still has 4,400 banks. Bottom Line: We remain neutral the S&P banks index, which is also on our downgrade watchlist since early September. The ticker symbols for the stocks in these indexes are: BLBG S5BANKX – JPM, BAC, C, WFC, USB, TFC, PNC, FRC, FITB, MTB, KEY, SIVB, RF, CFG, HBAN, ZION, CMA, PBCT. Footnotes 1 Small banks are defined as all commercial banks excluding top 25 banks ranked by domestic assets. 2 Large banks are defined as top 25 commercial banks ranked by domestic assets.
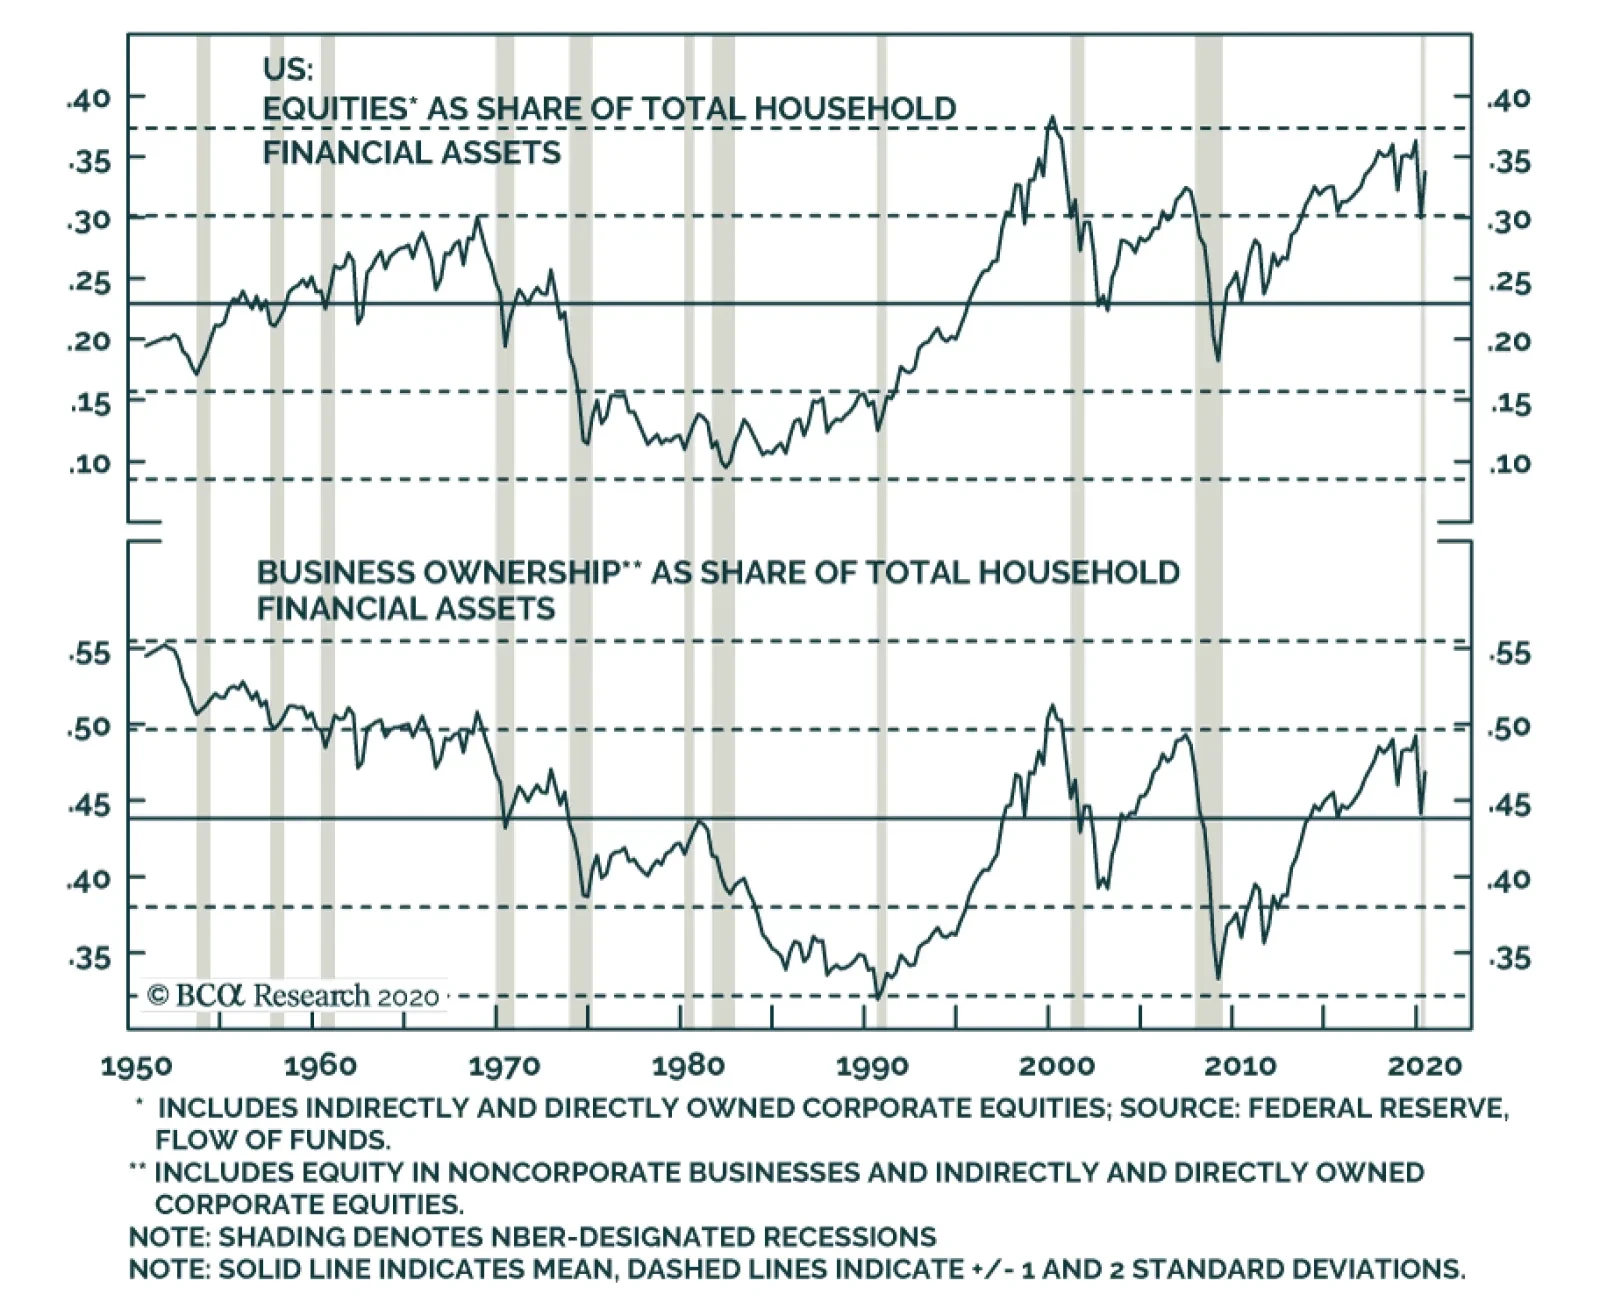
According to BCA Research's US Investment Strategy service, the aggregate household exposure to public equities does not appear worrisome after considering the secular decline in noncorporate businesses’ importance. Relative to the Flow of Funds’ 70-year…
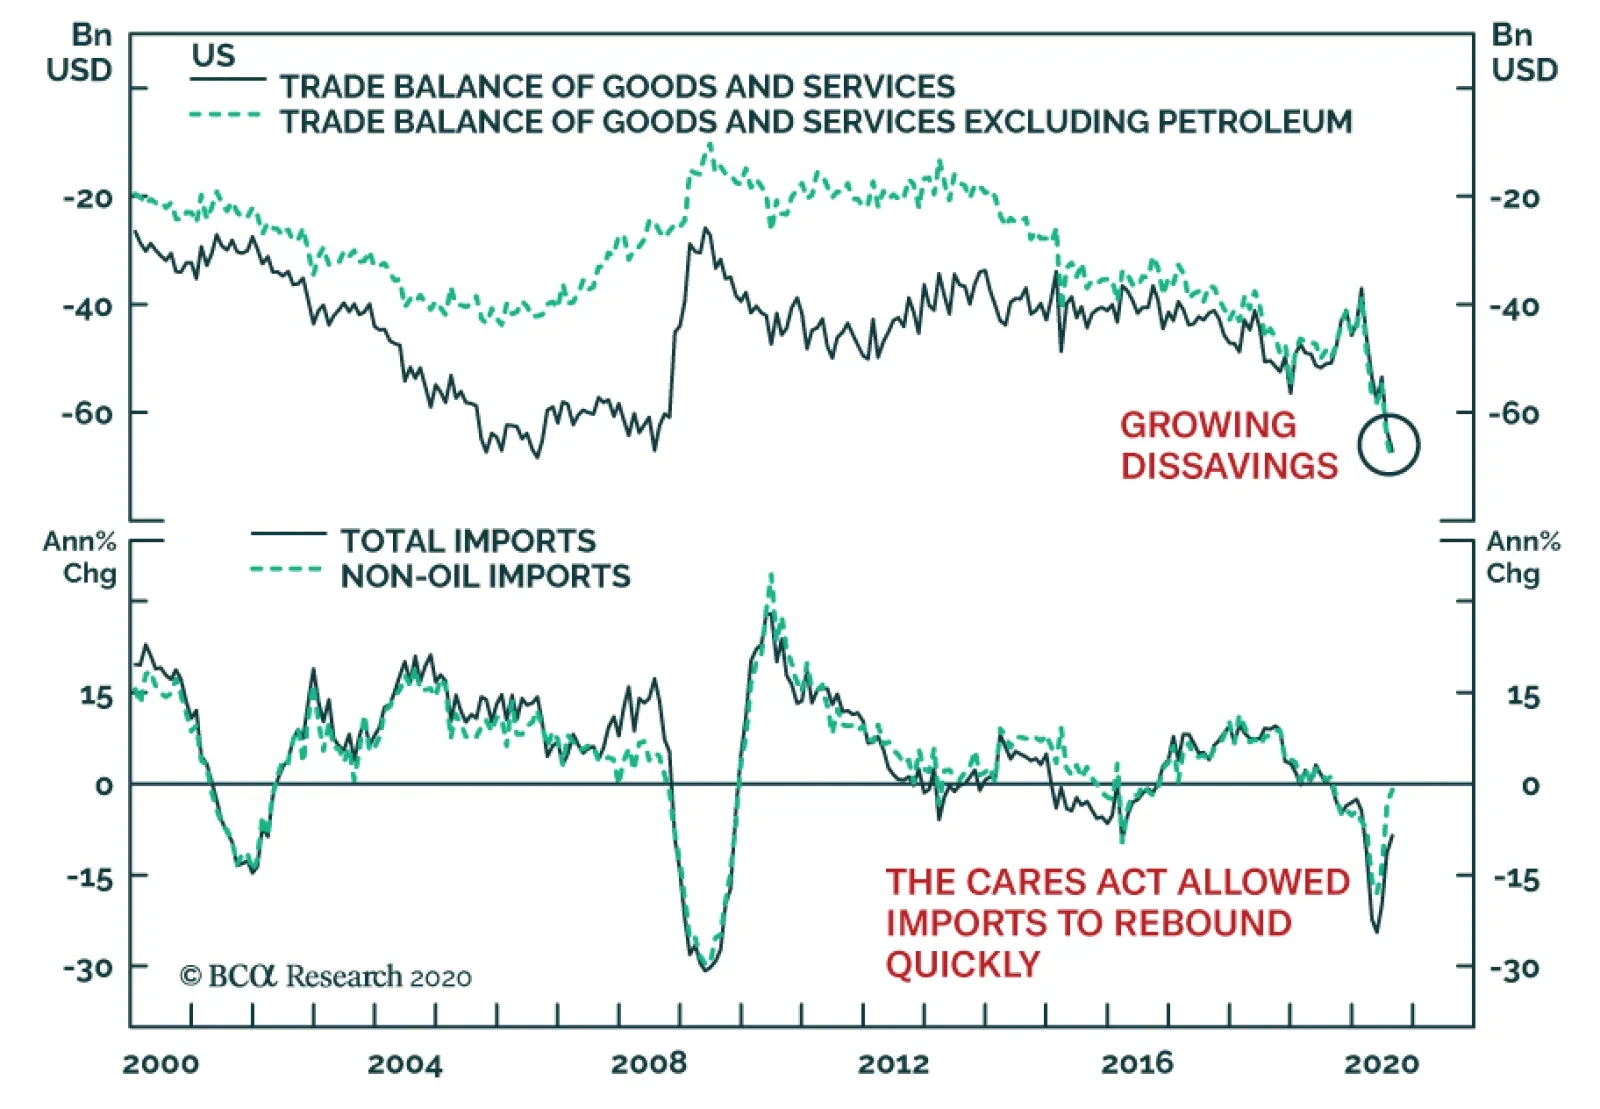
The US trade deficit currently sits at $67.1 billion, which is its worst reading since 2006. Excluding energy, the picture is even worse. with the trade gap hitting at an all-time high in August. The trade balance is weak because depressed global demand…
Reminiscences Of 2016?
Reminiscences Of 2016?
We have shown in recent research that the fourth year of presidential cycles finds the SPX ending the year on average in the green with a calendar return in the high single digits. Peering back in 2016 is instructive as that presidential election cycle year was in some ways similar to the current one. The economy, in particular, was fighting off a manufacturing recession that spread and infected the services sectors as the vast majority of S&P GICS1 sectors contracted profits and more importantly revenues. The chart shows a number of asset classes and compares 2016 with 2020. The 10-year US Treasury yield appears poised to rebound significantly, especially if Congress passes a fresh fiscal package that aides the parts of the economy that need the stimulus checks most. Fiscal easing uncertainty remains a thorny issue across different markets and if history is an accurate guide, the SPX could glide lower into the November election before rallying into year-end. Bottom Line: We are in the tail end of the equity market correction and as election and fiscal policy uncertainties recede they will pave the way for a robust SPX rally.
Highlights Chart 1Spending Held Up In August
Spending Held Up In August
Spending Held Up In August
The bulk of the CARES act’s income support provisions expired at the end of July and Congress has still not reached consensus on a follow-up package. Unsurprisingly, consumer spending responded by growing much more slowly in August, but at least so far, absolute calamity has been avoided (Chart 1). The failure of consumer spending to collapse has caused some, like St. Louis Fed President Jim Bullard, to question whether more stimulus is even necessary.1 We are less optimistic. The most recent personal income report shows that households still received $867 billion (annualized) of CARES act stimulus in August and the recovery in consumer confidence has been tepid at best (see page 12), suggesting that the savings rate will not drop quickly. We expect Congress to ultimately deliver more fiscal support, which will lead to a bear-steepening Treasury curve and spread product outperformance on a 6-12 month horizon. But continued brinkmanship warrants a more cautious near-term stance. Feature Investment Grade: Overweight Chart 2Investment Grade Market Overview
Investment Grade Market Overview
Investment Grade Market Overview
Investment grade corporate bonds underperformed the duration-equivalent Treasury index by 40 basis points in September, dragging year-to-date excess returns down to -394 bps. Last month’s sell-off caused some value to return to the sector. The overall index’s 12-month breakeven spread is back up to its 31st percentile since 1995 and the equivalent Baa spread is at its 38th percentile (Chart 2). Both levels appear somewhat expensive at first blush. However, considering the strong tailwinds from the Fed’s extraordinarily accommodative interest rate policy and emergency lending facilities, we see a lot of room for further spread tightening. Corporate bond issuance was up in August, but nowhere near the extreme levels seen in the spring (panel 4). The fact that the Financing Gap – the difference between capital expenditures and retained earnings – turned negative in the second quarter suggests that firms have sufficient cash to cover their investment needs, and that further debt issuance is unnecessary (bottom panel). At the sector level, we continue to recommend overweight allocations to subordinate bank bonds,2 Healthcare and Energy bonds.3 We also advise underweight allocations to Technology4 and Pharmaceutical bonds.5 Table 3ACorporate Sector Relative Valuation And Recommended Allocation*
Weathering The Storm … For Now
Weathering The Storm … For Now
Table 3BCorporate Sector Risk Vs. Reward*
Weathering The Storm … For Now
Weathering The Storm … For Now
High-Yield: Neutral Chart 3High-Yield Market Overview
High-Yield Market Overview
High-Yield Market Overview
High-Yield underperformed the duration-equivalent Treasury index by 107 basis points in September, dragging year-to-date excess returns down to -455 bps. Oddly, Ba-rated was the worst performing credit tier on the month and the lowest-rated (Caa & below) credits actually beat the Treasury benchmark by 42 bps. As we wrote last week, this suggests that there remains scope for low-rated junk to sell off in the event of a shock to economic growth expectations.6 Such a development could arise if Congress fails to pass a new stimulus bill. In terms of value, if we assume a 25% recovery rate on defaulted debt and a minimum required spread of 150 bps in excess of default losses, then the High-Yield index is priced for a default rate of 4.8% during the next 12 months (Chart 3). Such a large drop in the default rate would necessitate a rapid economic recovery and we are not yet confident that such a recovery can be achieved. Job Cut Announcements – a variable that correlates tightly with the default rate – ticked higher in September and they remain well above pre-COVID levels (bottom panel). At the sector level, we advise overweight allocations to high-yield Technology7 and Energy bonds.8 We are underweight the Healthcare and Pharmaceutical sectors.9 MBS: Underweight Chart 4MBS Market Overview
MBS Market Overview
MBS Market Overview
Mortgage-Backed Securities underperformed the duration-equivalent Treasury index by 14 basis points in September, dragging year-to-date excess returns down to -51 bps. The conventional 30-year MBS index option-adjusted spread (OAS) widened 4 bps on the month, and it continues to trade at a premium compared to other similarly risky sectors. The MBS index OAS is currently 80 bps. This compares to an OAS of 79 bps for Aa-rated corporate bonds, 66 bps for Agency CMBS and 30 bps for Aaa-rated consumer ABS. Despite the OAS advantage, we are concerned that the elevated primary mortgage spread is a warning that refinancing risk could flare during the next few months (Chart 4). Even if Treasury yields are unchanged, a further 50 bps drop in the mortgage rate due to spread compression cannot be ruled out. Such a move would lead to a significant increase in prepayment losses. With that in mind, we are concerned about the low level of expected prepayment losses (option cost) priced into the MBS index (panel 3). A fourth quarter refi wave would undoubtedly send that option cost higher, eating into the returns implied by the OAS. The recent spike in the mortgage delinquency rate does not pose a near-term risk to spreads as it is being driven by households that have been granted forbearance from the federal government (panel 4). The risk for MBS holders only comes into play if many households are unable to resume their regular mortgage payments when the forbearance period expires early next year. But even in that case, further government intervention to either support household incomes or extend the forbearance period would mitigate the risk. Government-Related: Underweight Chart 5Government-Related Market Overview
Government-Related Market Overview
Government-Related Market Overview
The Government-Related index underperformed the duration-equivalent Treasury index by 18 basis points in September, dragging year-to-date excess returns down to -313 bps. Sovereign debt underperformed duration-equivalent Treasuries by 99 bps on the month, dragging year-to-date excess returns down to -562 bps. Foreign Agencies underperformed the Treasury benchmark by 13 bps in September, dragging year-to-date excess returns down to -706 bps. Local Authority debt underperformed Treasuries by 4 bps in September, dragging year-to-date excess returns down to -341 bps. Domestic Agency bonds outperformed by 15 bps, bringing year-to-date excess returns up to -39 bps. Supranationals underperformed by 3 bps, dragging year-to-date excess returns down to -12 bps. US dollar weakness is usually a boon for Emerging Market (EM) Sovereign and Foreign Agency returns. However, most of this year’s dollar depreciation has occurred against other Developed Market currencies, not EMs (Chart 5). Added to that, dollar weakness against all trading partners helps US corporate sector profits, and Baa-rated corporate bonds continue to offer a spread pick-up versus EM Sovereigns (panel 4). We looked at EM Sovereign valuation on a country-by-country basis two weeks ago and concluded that Mexican and Russian Sovereigns offer the most compelling risk/reward trade-offs relative to the US corporate sector.10 Of those two countries, Mexican debt offers the best opportunity as the peso is on an appreciating trend versus the dollar. The Russian Ruble has been depreciating versus the dollar, and is vulnerable in the case of a Democratic sweep in November. Municipal Bonds: Overweight Chart 6Municipal Market Overview
Municipal Market Overview
Municipal Market Overview
Municipal bonds underperformed the duration-equivalent Treasury index by 12 basis points in September, dragging year-to-date excess returns down to -503 bps (before adjusting for the tax advantage). Short-dated municipal bond spreads versus Treasuries were stable in September, but long-maturity spreads widened. The entire Aaa muni curve remains above the Treasury curve, despite municipal debt’s tax-exempt status (Chart 6). Municipal bonds also remain attractively priced relative to corporate bonds across the entire investment grade credit spectrum. Aaa munis offer more after-tax yield than Aaa corporates for investors facing an effective tax rate above 15%. The breakeven effective tax rates for Aa, A and Baa-rated munis are 11%, 13% and 17%, respectively. Extremely attractive valuation causes us to stick with our municipal bond overweight, even as state and local governments face a credit crunch. State & local government payrolls shrank in September and, without federal support, cutbacks will no doubt continue (bottom panel). However, we expect that the combination of austerity measures and all-time high State Rainy Day Fund balances will be sufficient to prevent a wave of municipal ratings downgrades. Treasury Curve: Buy 5-Year Bullet Versus 2/10 Barbell Chart 7Treasury Yield Curve Overview
Treasury Yield Curve Overview
Treasury Yield Curve Overview
The Treasury curve bull-flattened somewhat in September, though even the 30-year yield only fell 3 bps on the month. The 2/10 and 5/30 Treasury slopes flattened 2 bps and 3 bps, reaching 56 bps and 118 bps, respectively. One easy way to think about nominal Treasury yields is as the market’s expectation of future changes in the fed funds rate.11 With that in mind, the Fed’s recent shift toward a regime of average inflation targeting will likely lead to nominal yield curve steepening on a 6-12 month horizon. That is, the Fed will keep a firm grip on the front-end of the curve but long-maturity yields will rise as investors price-in eventual Fed tightening in response to higher inflation. We recommend positioning for this outcome by owning the 5-year Treasury note and shorting a duration-matched barbell consisting of the 2-year and 10-year notes. This position is designed to profit from 2/10 curve steepening. We expect the economic recovery to be maintained over the next 6-12 months, allowing this steepening to play out. However, we also see near-term risks related to the passage of a follow-up stimulus bill. Those not already invested in steepeners are advised to wait until a deal is struck. Valuation is a concern with our recommended curve steepener, as the 5-year yield is below the yield on the duration-matched 2/10 barbell (Chart 7). However, the 5-year yield looked much more expensive during the last zero-lower-bound period between 2010 and 2013 (bottom 2 panels). We anticipate a return to similar valuation levels. TIPS: Overweight Chart 8TIPS Market Overview
TIPS Market Overview
TIPS Market Overview
TIPS underperformed the duration-equivalent nominal Treasury index by 54 basis points in September, dragging year-to-date excess returns down to -130 bps. The 10-year and 5-year/5-year forward TIPS breakeven inflation rates fell 18 bps and 16 bps on the month. They currently sit at 1.65% and 1.83%, respectively. Core CPI printed a strong +0.4% in August and the large divergence between core and trimmed mean inflation measures leads us to conclude that inflation will continue to rise quickly during the next few months (Chart 8). For this reason, we recommend maintaining an overweight allocation to TIPS versus nominal Treasuries for the time being, even though the 10-year TIPS breakeven rate is no longer cheap according to our Adaptive Expectations Model (panel 2).12 We could see inflation pressures moderating once core and trimmed mean inflation measures re-converge.13 This could give us an opportunity to reduce our exposure to TIPS sometime later this year. We also recommend holding real yield curve steepeners and inflation curve flatteners. With the Fed now officially targeting an overshoot of its 2% inflation goal, we would expect the cost of 2-year inflation protection to rise above the cost of 10-year inflation protection (panel 4). With the Fed also exerting more control over short-dated nominal yields than over long-term ones, this means that short-maturity real yields will come under downward pressure relative to the long end (bottom panel). ABS: Overweight Chart 9ABS Market Overview
ABS Market Overview
ABS Market Overview
Asset-Backed Securities outperformed the duration-equivalent Treasury index by 10 basis points in September, bringing year-to-date excess returns up to +63 bps. Aaa-rated ABS outperformed the Treasury benchmark by 7 bps on the month, bringing year-to-date excess returns up to +53 bps. Non-Aaa ABS outperformed by 32 bps, bringing year-to-date excess returns up to +128 bps. Aaa ABS are a high conviction overweight, given that spreads remain elevated compared to historical levels and that the sector benefits from Fed support through the Term Asset-Backed Loan Facility (TALF). However, spreads are even more attractive in non-Aaa ABS (Chart 9) and we recommend owning those securities as well. This is despite the fact that only Aaa-rated bonds are eligible for TALF. We explained our rationale for owning non-Aaa consumer ABS in a June report.14 We noted that stimulus received from the CARES act caused disposable income to increase significantly between February and July. Then, faced with fewer spending opportunities, households used much of that windfall to pay down consumer debt (panel 4). Granted, further income support from fiscal policymakers is needed now that the CARES act’s enhanced unemployment benefits have expired. But given the substantial boost to savings that has already occurred, we are confident that more stimulus will arrive in time to prevent a wave of consumer bankruptcies. Non-Agency CMBS: Neutral Chart 10CMBS Market Overview
CMBS Market Overview
CMBS Market Overview
Non-Agency Commercial Mortgage-Backed Securities outperformed the duration-equivalent Treasury index by 63 basis points in September, bringing year-to-date excess returns up to -259 bps. Aaa Non-Agency CMBS outperformed Treasuries by 46 bps on the month, bringing year-to-date excess returns up to -63 bps. Non-Aaa Non-Agency CMBS outperformed by 119 bps, bringing year-to-date excess returns up to -803 bps (Chart 10). We continue to recommend an overweight allocation to Aaa Non-Agency CMBS and an underweight allocation to Non-Aaa CMBS. Our reasoning is simple. Aaa CMBS are eligible for TALF, meaning that spreads can still tighten even as the hardship in commercial real estate continues. Without Fed support, Non-Aaa CMBS will struggle to deal with a climbing delinquency rate (panel 3).15 Agency CMBS: Overweight Agency CMBS underperformed the duration-equivalent Treasury index by 9 basis points in September, dragging year-to-date excess returns down to -12 bps. The average index spread widened 2 bps on the month to 68 bps, well above typical historical levels (bottom panel). The Fed is supporting the Agency CMBS market by directly purchasing the securities as part of its Agency MBS purchase program. The combination of strong Fed support and elevated spreads makes the sector a high conviction overweight. Appendix A: Buy What The Fed Is Buying The Fed rolled out a number of aggressive lending facilities on March 23. These facilities focused on different specific sectors of the US bond market. The fact that the Fed has decided to support some parts of the market and not others has caused some traditional bond market correlations to break down. It has also led us to adopt of a strategy of “Buy What The Fed Is Buying”. That is, we favor those sectors that offer attractive spreads and that benefit from Fed support. The below Table tracks the performance of different bond sectors since the March 23 announcement. We will use this to monitor bond market correlations and evaluate our strategy’s success. Table Performance Since March 23 Announcement Of Emergency Fed Facilities
Weathering The Storm … For Now
Weathering The Storm … For Now
Appendix B: Butterfly Strategy Valuations The following tables present the current read-outs from our butterfly spread models. We use these models to identify opportunities to take duration-neutral positions across the Treasury curve. The following two Special Reports explain the models in more detail: US Bond Strategy Special Report, “Bullets, Barbells And Butterflies”, dated July 25, 2017, available at usbs.bcaresearch.com US Bond Strategy Special Report, “More Bullets, Barbells And Butterflies”, dated May 15, 2018, available at usbs.bcaresearch.com Table 4 shows the raw residuals from each model. A positive value indicates that the bullet is cheap relative to the duration-matched barbell. A negative value indicates that the barbell is cheap relative to the bullet. Table 4Butterfly Strategy Valuation: Raw Residuals In Basis Points (As Of October 2nd, 2020)
Weathering The Storm … For Now
Weathering The Storm … For Now
Table 5 scales the raw residuals in Table 4 by their historical means and standard deviations. This facilitates comparison between the different butterfly spreads. Table 5Butterfly Strategy Valuation: Standardized Residuals (As Of October 2nd, 2020)
Weathering The Storm … For Now
Weathering The Storm … For Now
Table 6 flips the models on their heads. It shows the change in the slope between the two barbell maturities that must be realized during the next six months to make returns between the bullet and barbell equal. For example, a reading of 63 bps in the 5 over 2/10 cell means that we would only expect the 5-year to outperform the 2/10 if the 2/10 slope steepens by more than 63 bps during the next six months. Otherwise, we would expect the 2/10 barbell to outperform the 5-year bullet. Table 6Discounted Slope Change During Next 6 Months (BPs)
Weathering The Storm … For Now
Weathering The Storm … For Now
Appendix C: Excess Return Bond Map The Excess Return Bond Map is used to assess the relative risk/reward trade-off between different sectors of the US bond market. It is a purely computational exercise and does not impose any macroeconomic view. The Map’s vertical axis shows 12-month expected excess returns. These are proxied by each sector’s option-adjusted spread. Sectors plotting further toward the top of the Map have higher expected returns and vice-versa. Our novel risk measure called the “Risk Of Losing 100 bps” is shown on the Map’s horizontal axis. To calculate it, we first compute the spread widening required on a 12-month horizon for each sector to lose 100 bps or more relative to a duration-matched position in Treasury securities. Then, we divide that amount of spread widening by each sector’s historical spread volatility. The end result is the number of standard deviations of 12-month spread widening required for each sector to lose 100 bps or more versus a position in Treasuries. Lower risk sectors plot further to the right of the Map, and higher risk sectors plot further to the left. Chart 11Excess Return Bond Map (As Of October 2nd, 2020)
Weathering The Storm … For Now
Weathering The Storm … For Now
Ryan Swift US Bond Strategist rswift@bcaresearch.com Footnotes 1https://www.bloomberg.com/news/articles/2020-09-30/fed-s-bullard-says-debate-on-fiscal-aid-can-be-delayed-to-2021?sref=Ij5V3tFi 2 Please see US Bond Strategy Weekly Report, “The Case Against The Money Supply”, dated June 30, 2020, available at usbs.bcaresearch.com 3 Please see US Bond Strategy Special Report, “The Outlook For Energy Bonds Part 1: A Model Of Energy Bond Excess Returns”, dated July 14, 2020 and US Bond Strategy Special Report, “The Outlook For Energy Bonds Part 2: Buy The Dip In High-Yield Energy”, dated July 21, 2020, available at usbs.bcaresearch.com 4 Please see US Bond Strategy Weekly Report, “Take A Look At High-Yield Technology Bonds”, dated June 23, 2020, available at usbs.bcaresearch.com 5 Please see US Bond Strategy Weekly Report, “Assessing Healthcare & Pharma Bonds In A Pandemic”, dated June 9, 2020, available at usbs.bcaresearch.com 6 Please see US Bond Strategy Weekly Report, “Out Of Bullets”, dated September 29, 2020, available at usbs.bcaresearch.com 7 Please see US Bond Strategy Weekly Report, “Take A Look At High-Yield Technology Bonds”, dated June 23, 2020, available at usbs.bcaresearch.com 8 Please see US Bond Strategy Special Report, “The Outlook For Energy Bonds Part 1: A Model Of Energy Bond Excess Returns”, dated July 14, 2020 and US Bond Strategy Special Report, “The Outlook For Energy Bonds Part 2: Buy The Dip In High-Yield Energy”, dated July 21, 2020, available at usbs.bcaresearch.com 9 Please see US Bond Strategy Weekly Report, “Assessing Healthcare & Pharma Bonds In A Pandemic”, dated June 9, 2020, available at usbs.bcaresearch.com 10 Please see US Bond Strategy Weekly Report, “Trading Bonds In A Dollar Bear Market”, dated September 22, 2020, available at usbs.bcaresearch.com 11 For more details on this forecasting framework please see US Bond Strategy Weekly Report, “Positioning For Reflation And Avoiding Deflation”, dated August 11, 2020, available at usbs.bcaresearch.com 12 For more details on our model please see US Bond Strategy Weekly Report, “How Are Inflation Expectations Adapting?”, dated February 11, 2020, available at usbs.bcaresearch.com 13 Please see US Bond Strategy Weekly Report, “Positioning For Reflation And Avoiding Deflation”, dated August 11, 2020, available at usbs.bcaresearch.com 14 Please see US Bond Strategy Weekly Report, “No Holding Back”, dated June 16, 2020, available at usbs.bcaresearch.com 15 For a deeper dive into the outlook for US commercial real estate please see Global Investment Strategy Special Report, “Working From Home, Urban Flight, And Commercial Real Estate Loans: How Bad Can Things Get?”, dated August 28, 2020, available at gis.bcaresearch.com Fixed Income Sector Performance Recommended Portfolio Specification Corporate Sector Relative Valuation And Recommended Allocation
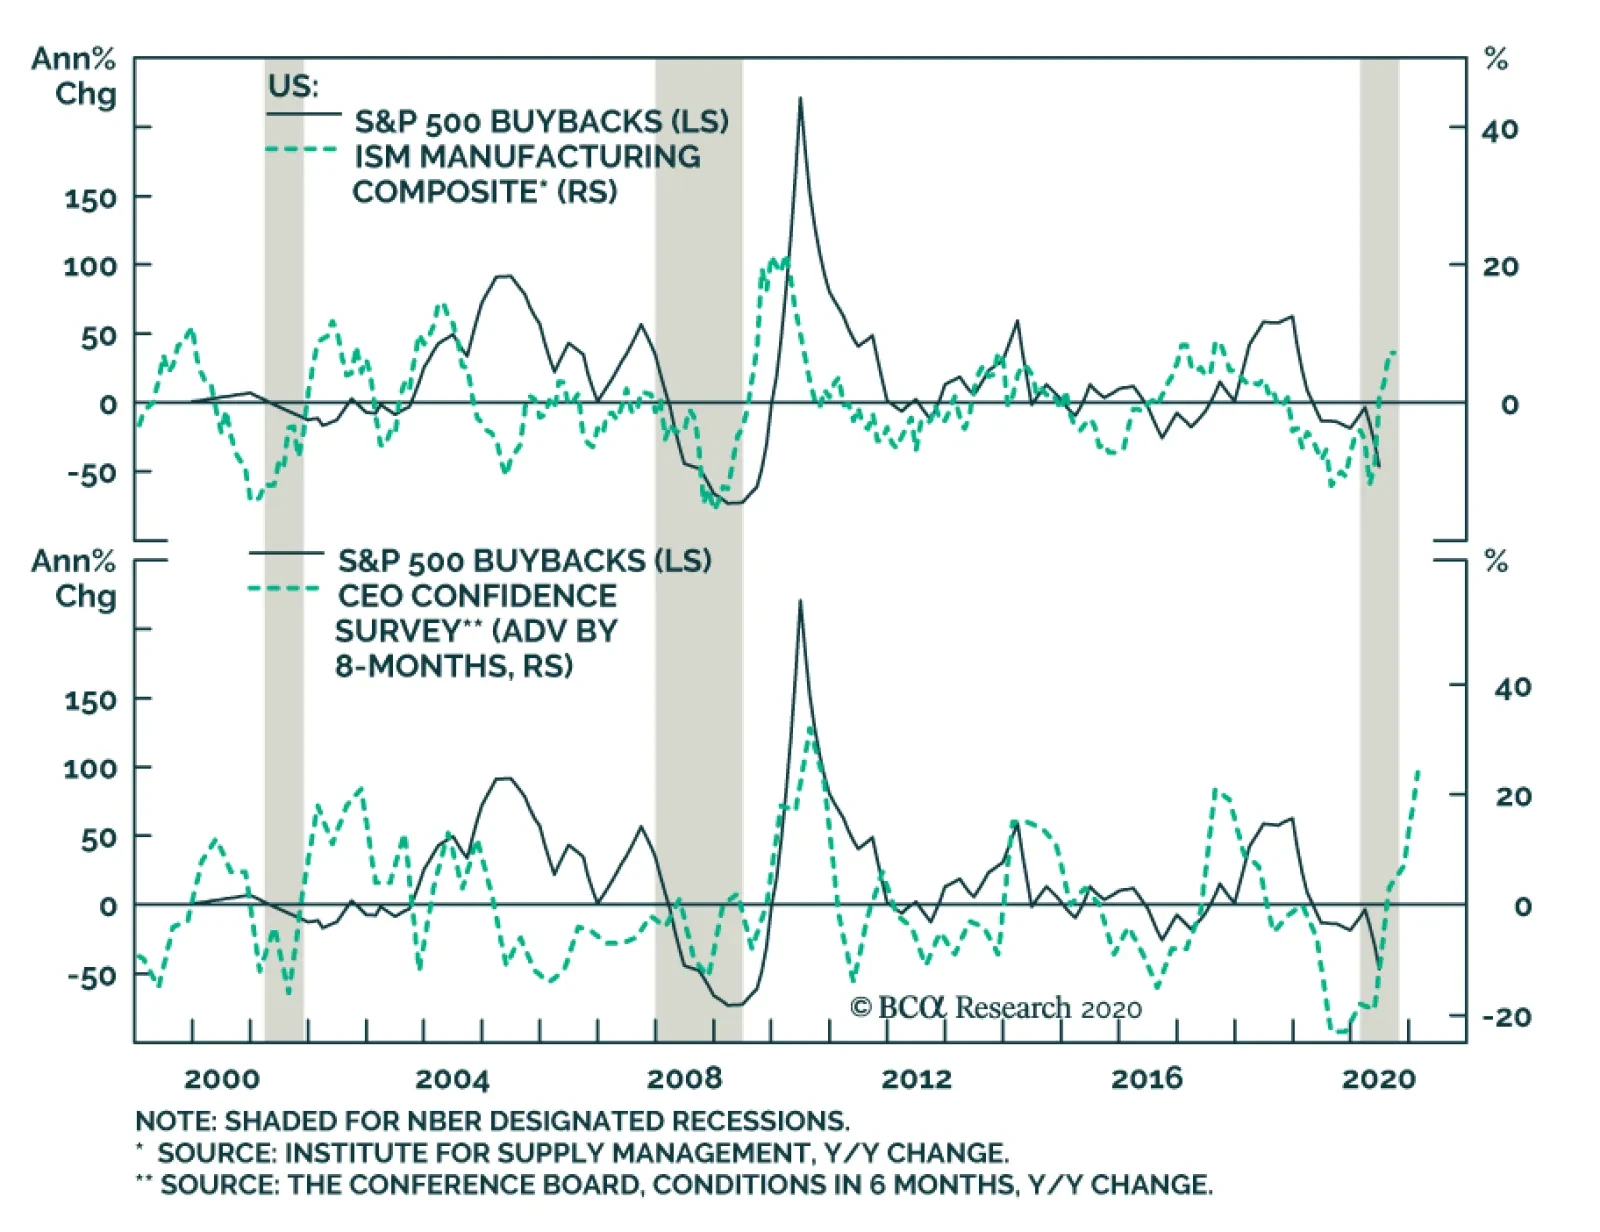
Not so fast, according to BCA Research's US Equity Strategy service, buybacks are down but not out. While financials have been weighing heavily on the S&P buybacks index, we would not write off the positive impact of equity retirement, especially in a…
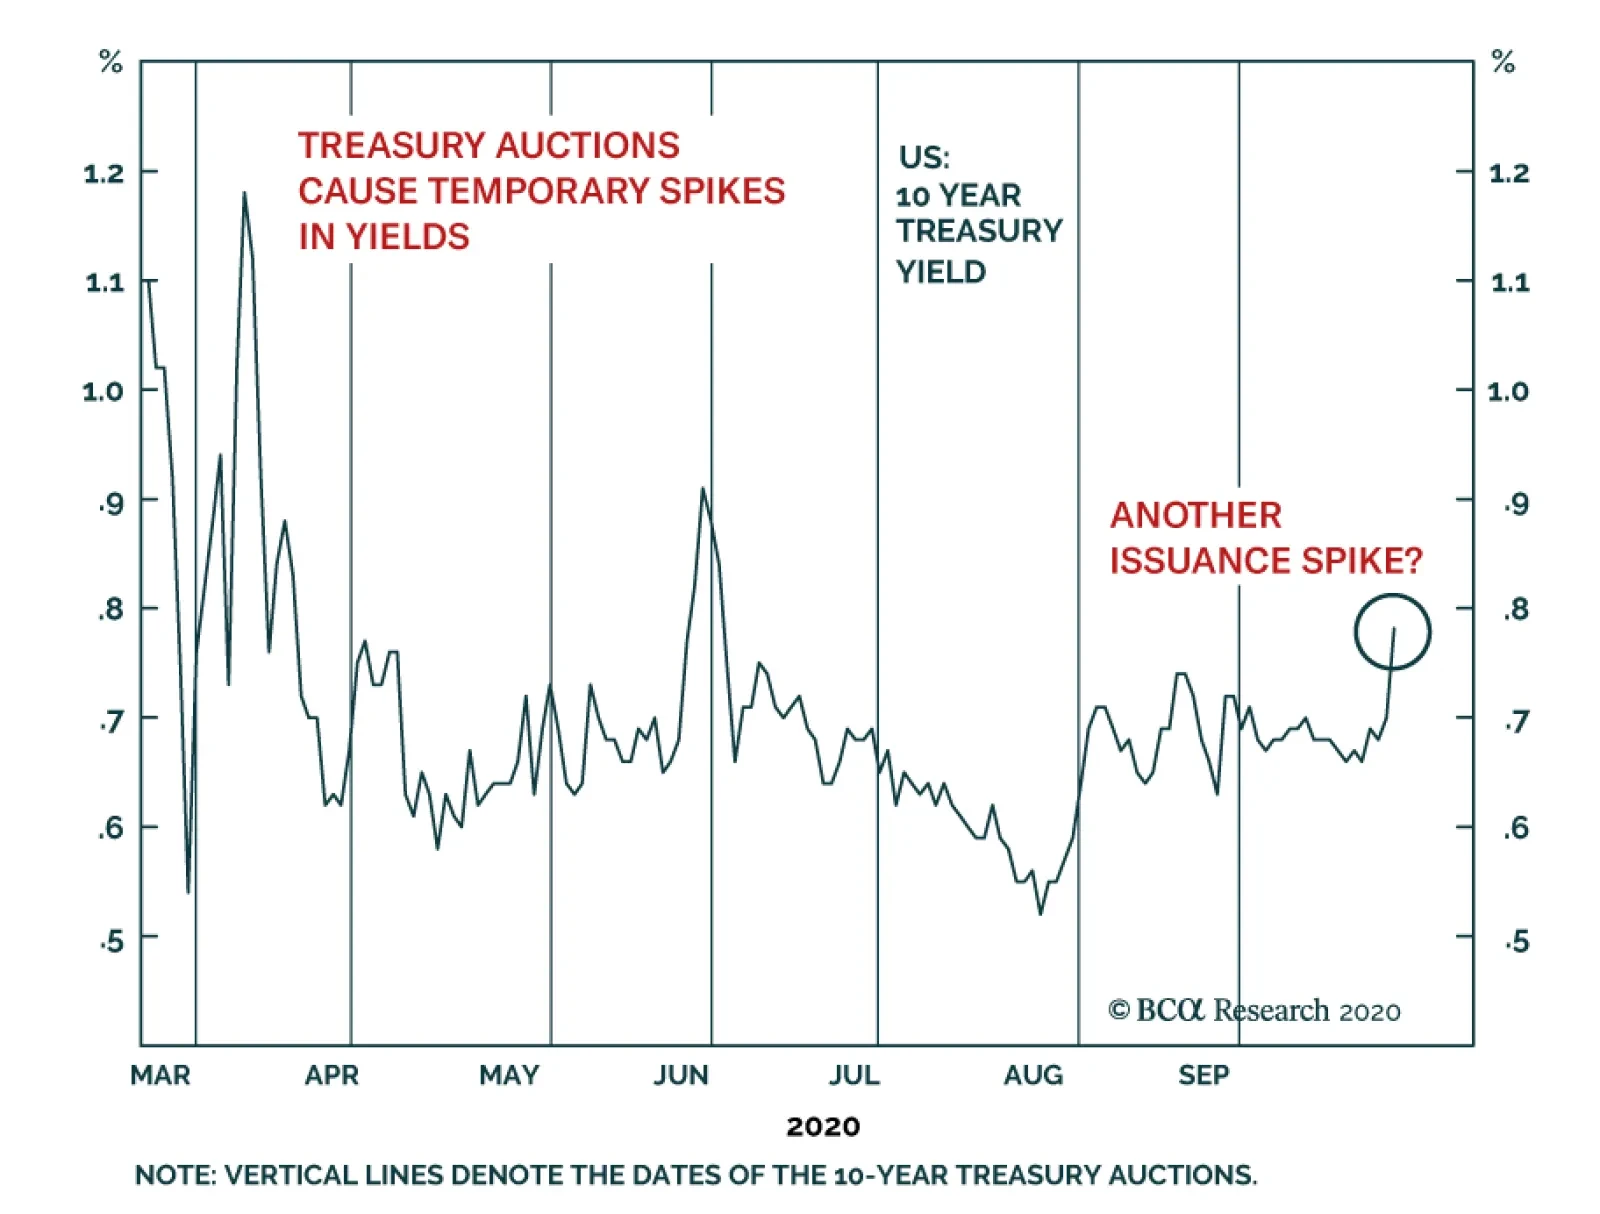
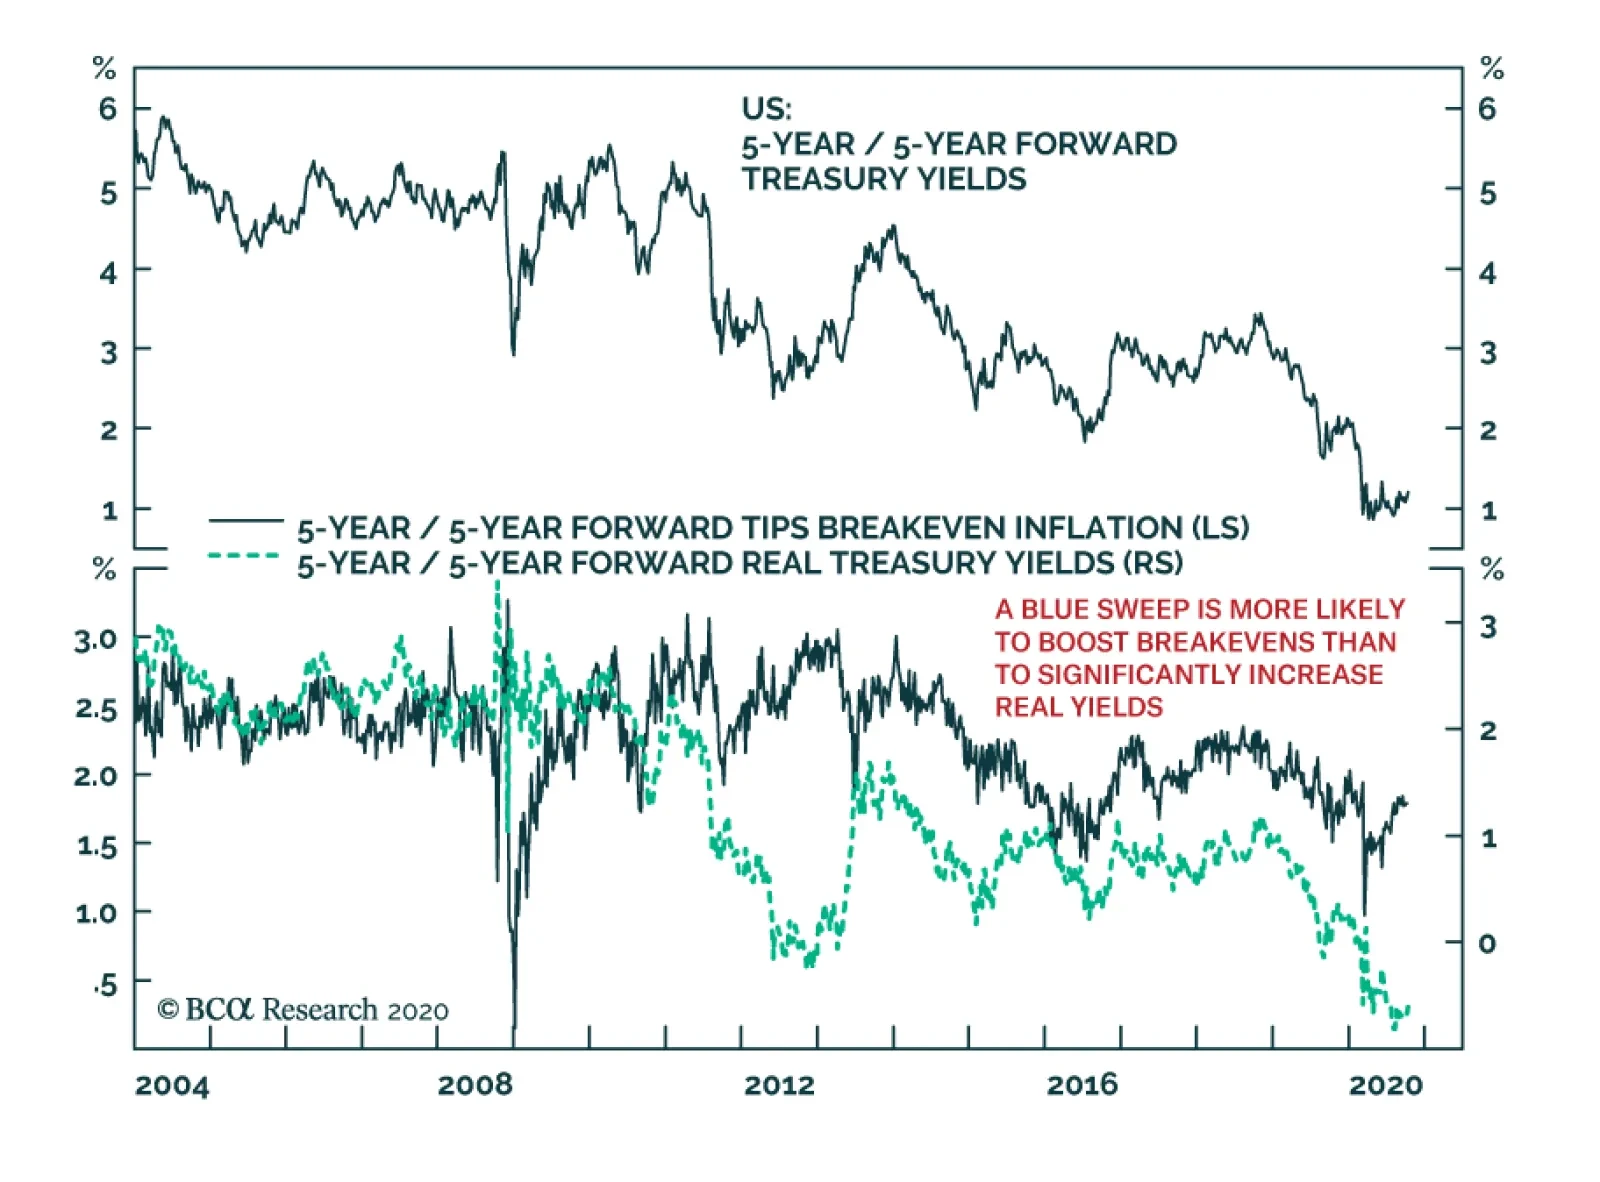
In recent days, Treasury yields have moved up nearly 15bps. Commentators are openly wondering about the cause of this move. The notion that following last week’s debate, the probability of Blue Wave (where the Democrats take control of both the White House…
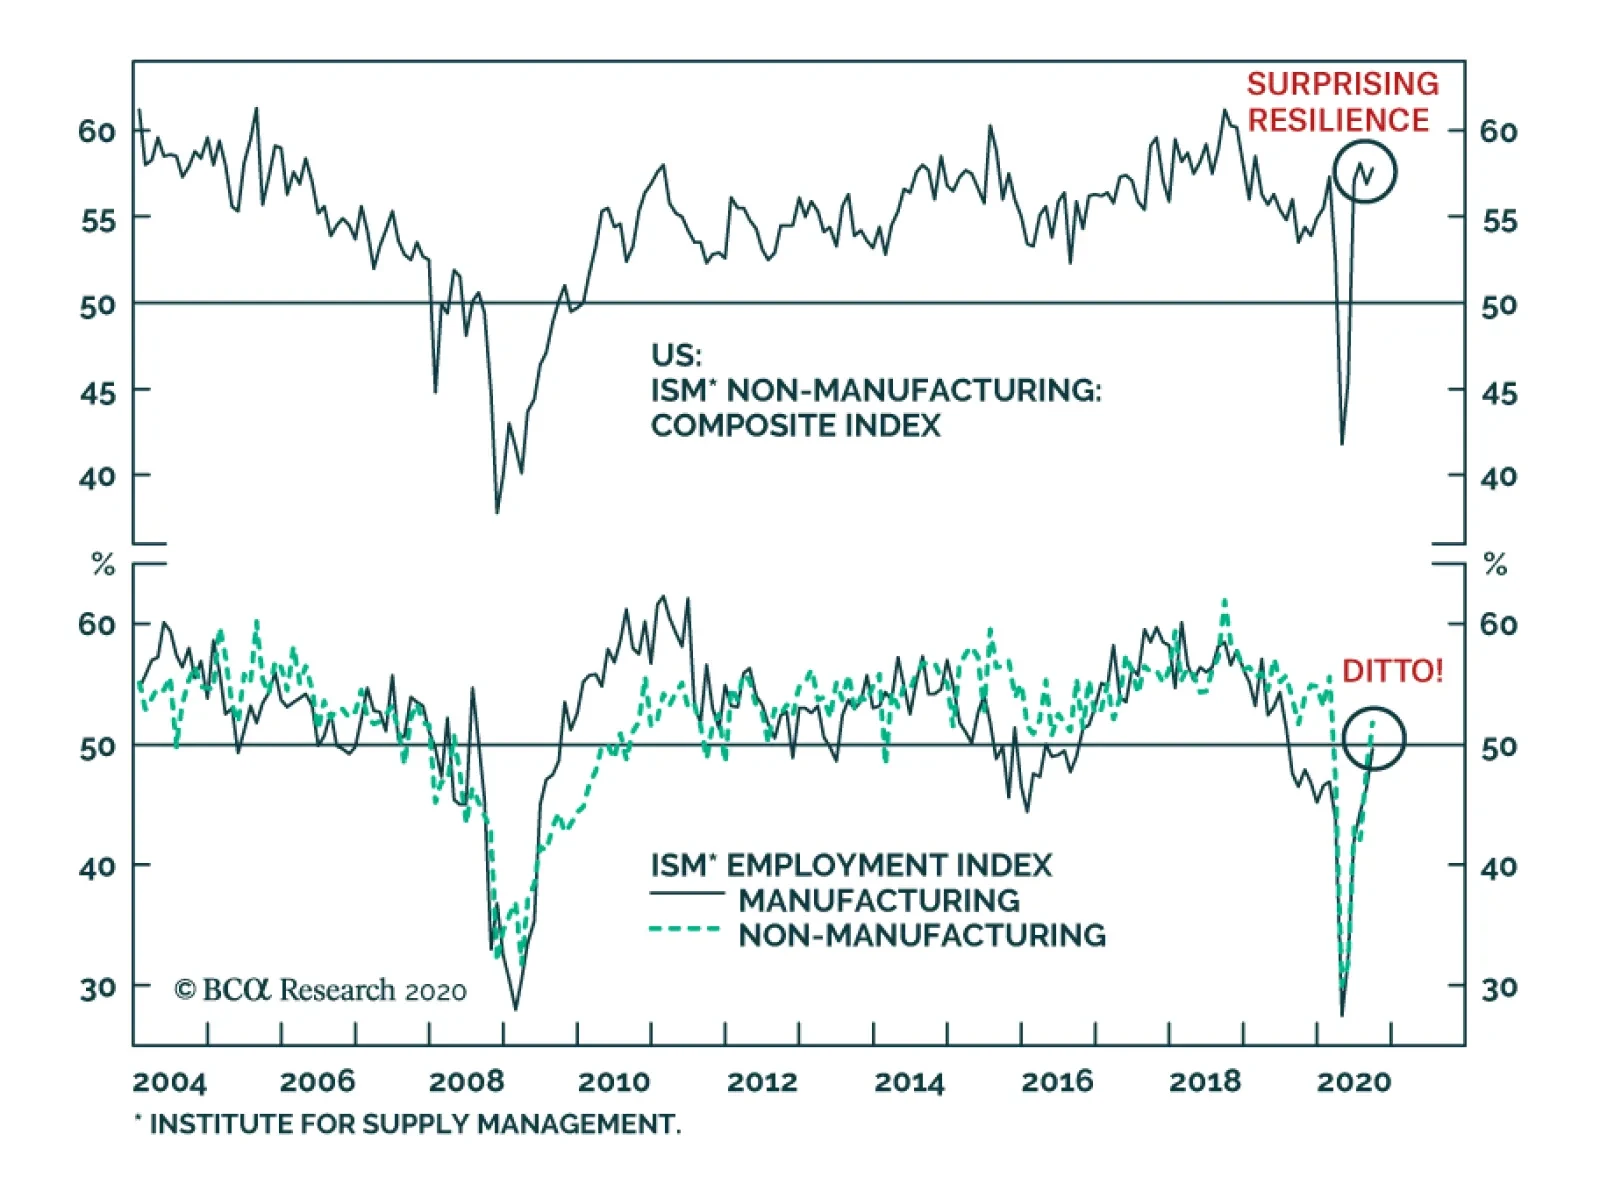
The ISM Non-Manufacturing survey for September came in at a surprisingly strong 57, well above the 56.2 expected by the consensus. The strength of the Employment component, which rose above the 50 boom/bust line for the first time since February, was…
Highlights Portfolio Strategy Buybacks are down but not out. While financials have been weighing heavily on the S&P buybacks index, we would not write off the artificial engineering of higher EPS via equity retirement, especially in a world of ZIRP likely for the next five-to-seven years. COVID-19 has permanently scarred demand while non-residential construction is elevated. This combination will deflate commercial real estate (CRE) prices further, which risks unraveling a CRE debt deflation spiral. Continue to avoid the S&P real estate sector. Recent Changes There are no changes to our portfolio this week. Table 1
Of Buybacks And Bonds
Of Buybacks And Bonds
Feature Equities sunk late last week, as diminishing chances of fiscal easing coupled with news that the POTUS and the First Lady tested positive for COVID-19 more than offset buyers taking advantage of oversold conditions. Our sense is that the SPX will bounce around key moving averages during October (Chart 1), until the election outcome breaks the stalemate. In the back half of the month, banks also kick-start Q3 earnings season, which is important because banks’ wellbeing rests on a fresh stimulus bill. Peering over at the bond market is instructive in order to try to make sense of these crosscurrents. Two weeks ago, we first highlighted that the corporate bond market was waving a yellow flag. The selloff in the LQD ETF will continue to weigh on equities (top panel, Chart 2) and corroborates our view that the Fed is now a bystander, which puts added pressure on fiscal authorities to act. It is not a coincidence that the Fed’s balance sheet impulse peaked first and soon thereafter so did the LQD. Chart 1Trapped Between Moving Averages
Trapped Between Moving Averages
Trapped Between Moving Averages
Worrisomely, the total return stock-to-bond ratio failed to break out to fresh all-time highs and has likely formed a head and shoulders pattern. The implication is that stocks are not out of the woods yet (bottom panel, Chart 2). Chart 2Bond Market…
Bond Market…
Bond Market…
Junk spreads are also firing a warning shot. The high-yield option-adjusted spread (OAS) was in a tight range between 2017 and 2019. Then spreads exploded higher because of the pandemic. However, unlike the SPX making new all-time highs, junk spreads failed to make new all-time lows and more importantly have not settled back down to the 2017-2019 range (middle panel, Chart 3). The VIX index is following a similar pattern to the high-yield OAS, which is quite unnerving for equity bulls. Put differently, still elevated VIX futures in the 30s warn that in the near-term more turbulence lies ahead for the SPX (bottom panel, Chart 3). As a reminder, we first recommended buying the December VIX futures on July 27 in a joined Special Report with our sister Geopolitical Strategy service, and we continue to recommend such a hedge to long equity exposure. Chart 3…And VIX Signal Trouble For Stocks
…And VIX Signal Trouble For Stocks
…And VIX Signal Trouble For Stocks
Bye-Bye Buybacks? According to the flow of funds data, a large dichotomy has taken shape between corporate debt issuance and net equity retirement. Up to very recently, the two moved in tandem. But now, the pandemic has caused a knee jerk reaction in non-financial corporate businesses that are tapping their credit lines and issuing debt at a breakneck pace. Worryingly, very little of these funds are used for equity retirement, which is a big break from recent past behavior (Chart 4). Not only does the Fed’s flow of funds data signal that buybacks have nearly ground to a halt, but also Standard and Poor’s data show that SPX buybacks collapsed to $88bn in Q2, from roughly $200bn in Q1. Crudely put, SPX buybacks have fallen by a whopping 67% quarter-over-quarter. Such a corporate buyer’s strike is negative for the near-term prospects of the S&P 500 (top panel, Chart 5). Chart 4Unsustainable Dichotomy
Unsustainable Dichotomy
Unsustainable Dichotomy
Chart 5Buybacks Are Down…
Buybacks Are Down…
Buybacks Are Down…
True, buybacks have come under intense scrutiny especially for bailed out sectors of the economy, nevertheless, the V-shaped economic recovery all but guarantees a rebound in depressed share buybacks sometime in 2021 (Chart 6). While our conservative $125/quarter buyback estimate proved overly optimistic in Q2, we maintain such an estimate for the next year (which it is the past decade’s average). On a cyclical 9-12 month horizon we have high conviction that SPX profits will return close to trend EPS of $162, and recovering CEO confidence should pave the way for a resumption of shareholder friendly activities, including equity retirement (middle panel, Chart 6). Drilling deeper beneath the surface is revealing. When we disaggregate the headline buybacks number into GICS1 sectors, we observe that once again the tech titans (comprising the S&P technology and the S&P communication services indexes) are doing all the heavy lifting accounting for 70% of the overall number (Chart 7). Q2 was the first time in recent memory where tech accounts for more buybacks that all the other sectors put together (bottom panel, Chart 5)! Chart 6But Not Out
But Not Out
But Not Out
Chart 7GICS1 Sector Buyback Breakdown: Q1 & Q2
Of Buybacks And Bonds
Of Buybacks And Bonds
Chart 8 shows the ebbs and flows of sectoral SPX buybacks since late-2006. In order for our estimate to prove accurate in 2021, the Fed will have to allow financials to resume their buybacks, which collapsed from over $45bn in Q1 to just above $5bn in Q2 (Chart 7). Chart 8GICS1 Sector Buyback Breakdown: An Historical Perspective
Of Buybacks And Bonds
Of Buybacks And Bonds
With regard to investable buyback indexes, financials dominate both the S&P 500 buyback index (Chart 9) and the NASDAQ US buyback achievers index. However, if the Fed does not relent and sustains a tight noose around banks’ shareholder friendly activities next year, then this index composition will change significantly in the 2021 rebalancing. While financials have been weighing heavily on the S&P 500 buyback index, its equal weighting methodology also partially explains why it has trailed the market cap weighted SPX by roughly 20% year-to-date (YTD). Nevertheless, in the long-haul buyback achievers come out on top. In fact, the S&P 500 buyback index has more than doubled the SPX’s return since the turn of the century (top panel, Chart 10) and such a portfolio tilt typically manages to shake off recession-related wobbles. Chart 9S&P 500 Buyback Index Sector Composition
Of Buybacks And Bonds
Of Buybacks And Bonds
Bottom Line: We would not write off the artificial engineering of higher EPS via equity retirement, especially in a world where ZIRP is likely for the next five-to-seven years. Already buyback announcements have troughed (bottom panel, Chart 10) and factors are falling into place for a sizable resumption of buybacks in 2021 as the economy stands back on its own feet. Chart 10Buyback Comeback?
Buyback Comeback?
Buyback Comeback?
Is CRE The Next Shoe To Drop? Last December in our 2020 Key Views report, the S&P real estate sector was one of our high-conviction underweight sectors for the year. However, frenetic trading in March compelled us to close out all our high-conviction trades and cement average relative gains of 3.4% in our eight high-conviction calls including 1.1% in the high-yielding S&P real estate sector. Nevertheless, we remained bearish on the prospects of this sector levered to commercial real estate (CRE) because the aftermath of the pandemic would leave this niche sector badly bruised. Already, YTD relative share prices are down 10%, and were it not for the tech/communications-laden – tower and digital storage – REITs that the S&P specialized REITs subgroup houses, then the relative underperformance would sink to 25% (Chart 11). In other words, the resilience of these mega cap tech-related REITs masks the carnage ongoing beneath the surface. Chart 11Specialized REITs Masking True Picture
Specialized REITs Masking True Picture
Specialized REITs Masking True Picture
Charts 12 & 13 break down the YTD relative performance of the real estate sector’s sub-groups and it is clear that most REITs categories are in distress with the exception of specialized and industrial REITs. Chart 12REITs Are Weak…
REITs Are Weak…
REITs Are Weak…
Chart 13…Across The Board
…Across The Board
…Across The Board
Not only will the long-term negative ramifications due to the pandemic scar office-, apartment- and mall-exposed REITs, but also uncertainty surrounding the fiscal stimulus bill risks a fresh down-leg in the S&P real estate sector. According to the latest Q2 Fed release, CRE delinquencies are on the rise (not shown) and CRE prices are on the verge of contracting (bottom panel, Chart 14). A fresh stimulus bill could transfer funds directly to unemployed consumers and to cash-strapped business owners and extend the eviction/foreclosure moratorium as well as mortgage forbearance agreements. Absent this help, CRE will remain distressed. Refinancing risk is another threat that could cause a gap down in CRE prices, as bankers remain unwilling to dole out CRE loans despite a collapse in interest rates. Once the underlying asset gets repriced lower, then the debt related house of cards comes crumbling down (top & middle panels, Chart 14). Recent news that “Cerberus repackaged near junk rated CMBS paper into a AAA rated CDO” (effectively creating a AAA security out of thin air) is eerily reminiscent of the subprime crisis in 2008 and a stark warning that CRE excesses have yet to fully flush out.1 Chart 14More Pain Looms
More Pain Looms
More Pain Looms
Chart 15Deflation Warning
Deflation Warning
Deflation Warning
The downdraft in demand for CRE is already showing up in declining occupancy rates (Chart 15). We fear that there are more skeletons hiding in the closet. First the “amazonification” of the economy is still wreaking havoc on retail/shopping center REITs. Second the new “work from home” reality is putting strains on office landlords. Lastly, lodging will remain in distress at least until a vaccine is readily available. As a result, REITs cash flow growth will remain elusive, which will further dampen prospects of a recovery in the relative share price ratio (Chart 15). Finally, the relentless increase in supply is not showing any signs of abating. Non-residential construction is hovering near previous highs, and multi-family housing starts are perched close to prior cyclical peaks of 400K/annum (Chart 16). Undoubtedly, this excess supply backdrop will continue to weigh on CRE prices. Chart 16Mind The Supply Overhang
Mind The Supply Overhang
Mind The Supply Overhang
Chart 17Valuations Have Yet To Fully Flush Out
Valuations Have Yet To Fully Flush Out
Valuations Have Yet To Fully Flush Out
Despite all this dour news and near all-time lows in relative performance, valuations have only corrected down to the neutral zone, leaving ample room for an undershoot phase (middle panel, Chart 17). Encouragingly, persistent recent selling has pushed our relative Technical Indicator deep in oversold territory signaling that a near-term reflex rebound may be forthcoming. Netting it all out, COVID-19 has permanently scarred demand while non-residential construction is elevated. This combination will deflate commercial real estate (CRE) prices further, which risks unraveling a CRE debt deflation spiral. Continue to avoid the S&P real estate sector. Bottom Line: Stay underweight the S&P real estate sector. The ticker symbols for the stocks in this index are: BLBG: S5RLST-AMT, EQIX, PLD, CCI, DLR, PSA, SBAC, AVB, WELL, ARE, O, SPG, WY, CBRE, EQR, ESS, FRT, PEAK, VTR, BXP, DRE, EXR, MAA, UDR, AIV, HST, IRM, KIM, REG, SLG, VNO. Anastasios Avgeriou US Equity Strategist anastasios@bcaresearch.com Footnotes 1 https://www.bloomberg.com/news/articles/2020-10-01/cerberus-is-repackaging-near-junk-cmbs-into-top-rated-securities Current Recommendations Current Trades Strategic (10-Year) Trade Recommendations
Drilling Deeper Into Earnings
Drilling Deeper Into Earnings
Size And Style Views July 27, 2020 Overweight cyclicals over defensives April 28, 2020 Stay neutral large over small caps June 11, 2018 Long the BCA Millennial basket The ticker symbols are: (AAPL, AMZN, UBER, HD, LEN, MSFT, NFLX, SPOT, TSLA, V). January 22, 2018 Favor value over growth