United States

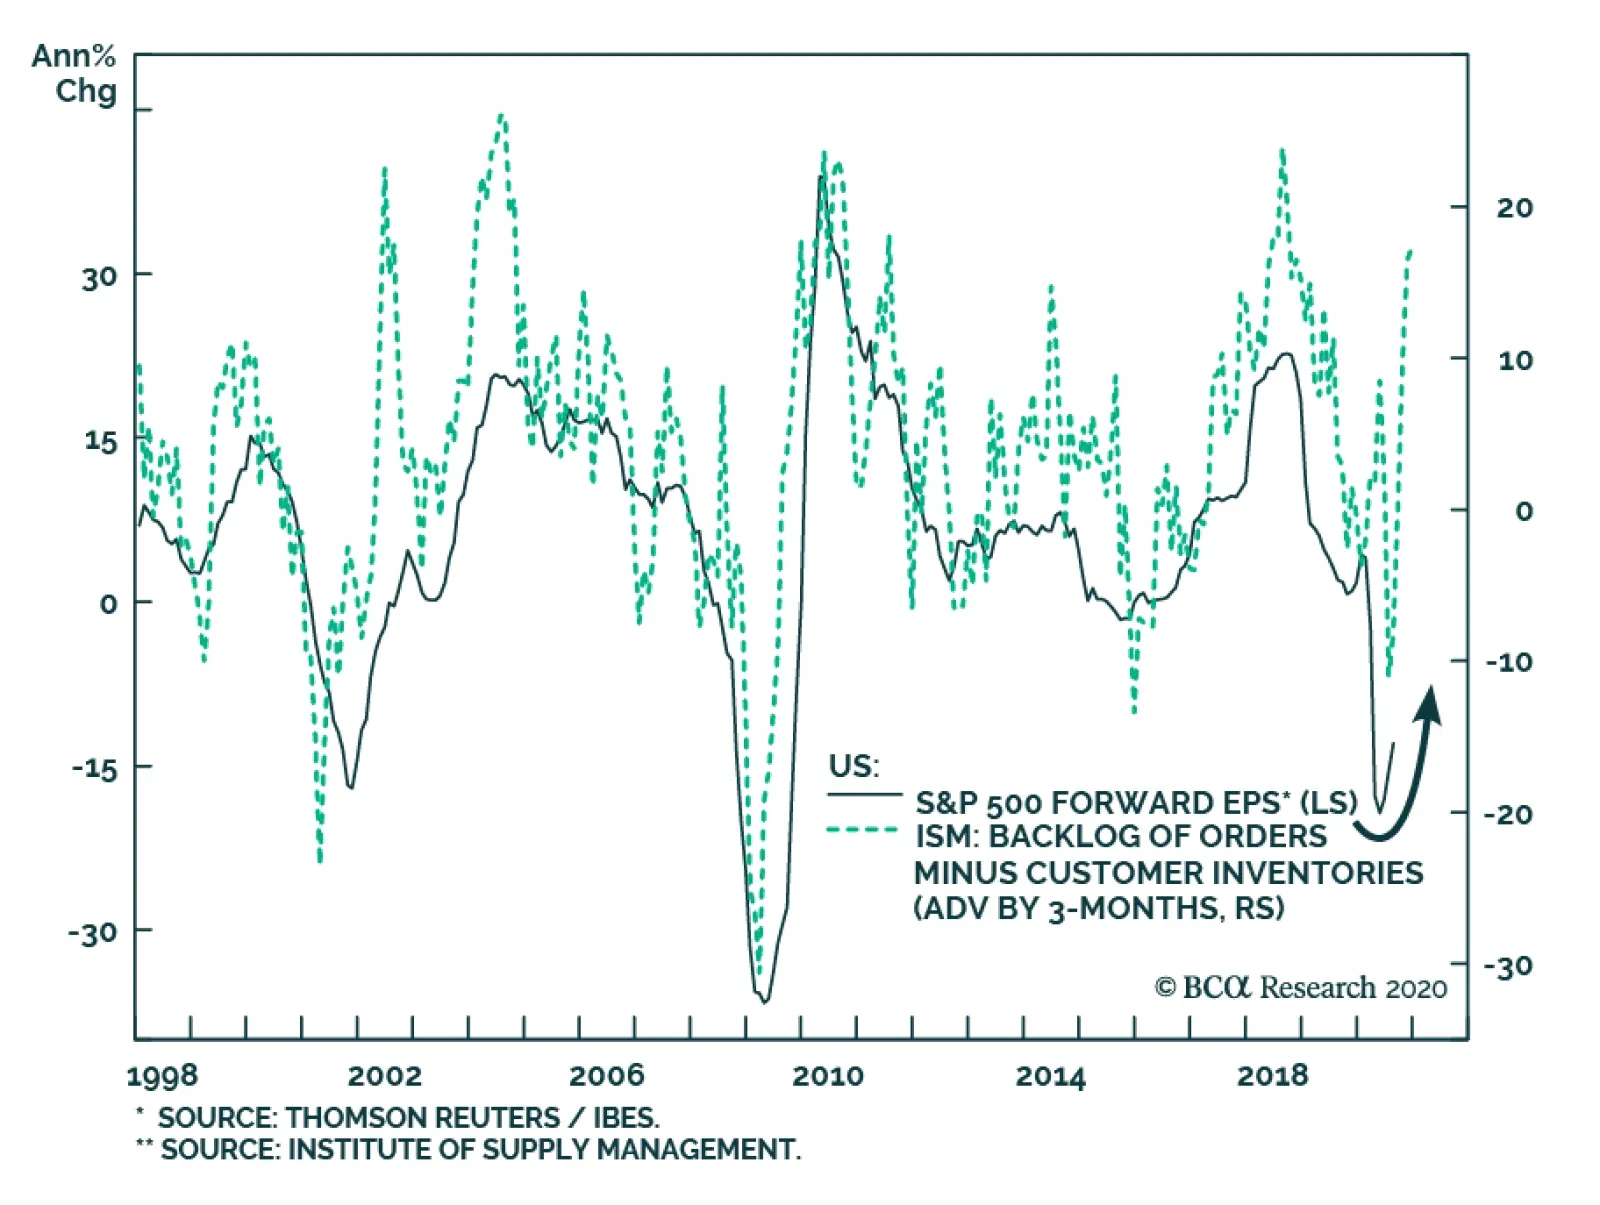
Highlights Aggregate household net worth reached an all-time high in the second quarter and likely rose further in the third quarter: The first quarter’s record quarter-on-quarter decline was completely unwound in the second quarter and resurgent financial and housing markets should have pushed wealth higher in the third quarter. Rising household net worth bodes well for consumption: Increases in household net worth lead increases in personal consumption expenditures by one or two quarters. Spending will roll over at some point in the fourth quarter without a new round of fiscal aid, but households retain some CARES Act support in the form of an enormous buildup of savings. Households do not appear to be overinvested in equities: Aggregate equity allocations are elevated relative to history, but the longstanding trend favoring corporate heft and consolidation may skew comparisons across time. Feature Chart 1A Ginormous Fiscal Response
The Household Balance Sheet
The Household Balance Sheet
The Fed’s latest quarterly Flow of Funds report reinforced the view that the pandemic provided households with an opportunity to shore up their financial positions. Shock-and-awe monetary and fiscal stimulus (Chart 1), combined with an inability to spend at shuttered businesses, turned out to be a heady brew for household finances. Surging financial markets boosted the value of wealthier households’ investment portfolios; a tidal wave of fiscal transfers produced an income surge for households in the lower half of the distribution; consumer confidence was dented by the myriad uncertainties posed by COVID-19, encouraging increased savings; and even those inclined to spend some of their windfall were hindered by the difficulty of finding an outlet for doing so. Testifying to the roller coaster nature of 2020, household net worth made a new all-time high at the end of the second quarter, thanks to a record three-standard-deviation quarter-over-quarter gain that unwound the first quarter’s record four-standard-deviation decline (Chart 2). Household net worth should make another new high on September 30, given the S&P 500’s 8.5% third-quarter advance, tighter corporate bond spreads, rising home prices and still-surging savings. It is unclear when or even if the wealth increase will translate to more consumption, given that spending ultimately comes down to fickle preferences, though we are confident that income gains will aid credit performance, helping the economy dodge a vicious circle of defaults and bankruptcies. Chart 2Yet Another 2020 Extreme
Yet Another 2020 Extreme
Yet Another 2020 Extreme
Wealth And Consumption There is no assurance that the formidable amount of wealth that households have amassed since the first quarter via a combination of fiscal transfers and investment gains will be directed to consumption. It is entirely possible that the savings rate will remain elevated for an extended period. Uncertainty still runs rampant for businesses disrupted by the pandemic and their employees, vendors, landlords and lenders. The travel, hospitality, food service, entertainment and real estate industries have a broad reach and their fates will ripple across much of the rest of the economy. There is a clear relationship between wealth gains and spending gains, ... In the past, however, smoothed year-over-year changes in household net worth have reliably correlated with smoothed year-over-year changes in personal consumption expenditures (PCE). The simple regression equation linking PCE and household net worth moves is nearly identical whether the lag between the two series is one or two quarters, as is the share of PCE’s variability that is explained by changes in wealth (r-squared). We show the scatterplot of household net worth growth (x-axis) lagged by two quarters with PCE growth (y-axis) in Chart 3, which reveals how rarely the four-quarter moving average of nominal PCE fails to grow from one year to the next. Every previous smoothed consumption decline occurred in the wake of the GFC in 2009-10 after having been preceded by significant wealth declines. At 6.6 percentage points below the best-fit regression line, the current observation is a notable outlier and suggests that households have stored up considerable dry powder. Chart 3Wealth Gains Typically Lead To Spending Gains
The Household Balance Sheet
The Household Balance Sheet
When and if that dry powder will be deployed is a mystery. The 62-year history of the savings rate, which is simply savings divided by disposable, or after-tax, income does not suggest a powerful pull toward mean reversion. Rather, the series has been characterized by three long waves: a steadily, albeit modestly increasing trend from inception until the mid-seventies; an extended decline well into the aughts; and a post-GFC increase back to the levels that prevailed in the late-eighties and early-nineties (Chart 4). Regardless of the savings rate’s ultimate normalized range, we view the pandemic levels as an anomaly. Once households become more comfortable inhabiting a post-COVID world, income hoarded this spring and summer will provide a tailwind for consumption. ... but it may not take hold until the savings rate, which rose to record levels in the spring, settles back into a normalized range. Chart 4It Is Not Clear When Or Where The Savings Rate Will Normalize
It Is Not Clear When Or Where The Savings Rate Will Normalize
It Is Not Clear When Or Where The Savings Rate Will Normalize
Bottom Line: Capricious sentiment will ultimately dictate when households deploy their pandemic savings, but there is a clear relationship between wealth gains and consumption. The second quarter Flow of Funds report buttresses the conclusion from the monthly personal income data that household wealth has benefited from pandemic policies so far. Are Households Overinvested In Equities? The Flow of Funds report also provides insight into the composition of aggregate household investment, grouping financial assets into five broad categories: Deposits (cash), Fixed Income, Corporate Equity, Life Insurance and Pensions, and Equity in Noncorporate Businesses. (The remainder of household wealth is concentrated in equity in homes and the property inside them.) Leaving out the value of life insurance and pension benefits, we reviewed the financial asset data for signs that households may have gotten over their skis in terms of their aggregate equity allocation. If they have, it might indicate that stocks are ripe for a reversal. Relative to the Flow of Funds’ 70-year history, the aggregate allocation to cash is a little low (Chart 5, top panel). With deposits sure to generate negative real income in a ZIRP world, however, a low cash allocation is rational and follows the historical pattern of moving with short rates (Chart 5, bottom panel). The fixed income allocation is lower, though not extreme (Chart 6, top panel). Households may tend to be backward-looking when allocating between stocks and bonds (Chart 6, bottom panel), but the currently elevated equity risk premium provides forward-looking support for preferring the former. Chart 5Cash Balances Were Low Before The Pandemic, But So Were Short Rates
Cash Balances Were Low Before The Pandemic, But So Were Short Rates
Cash Balances Were Low Before The Pandemic, But So Were Short Rates
Chart 6Mirror Image
Mirror Image
Mirror Image
On its face, households’ equity allocation looks somewhat frothy at one-and-a-half standard deviations above the mean (Chart 7, top panel). Like the forward P/E ratio, the household share of financial assets invested in equities has only ever been higher in the 1999-2000 crescendo to the dot-com boom. The household share of equity in noncorporate businesses has been plunging since the early eighties, however, and when all equity stakes are considered holistically, households don’t look overinvested (Chart 7, bottom panel). An investor could have reached that conclusion in 1999 to his/her subsequent regret, but household allocations to publicly traded holdings should have increased to reflect secular trends favoring concentration. This indicator is surely yellow, but we do not yet view it as red. Chart 7The Proceeds From Family Business Sales Have To Go Somewhere
The Proceeds From Family Business Sales Have To Go Somewhere
The Proceeds From Family Business Sales Have To Go Somewhere
Bottom Line: Individual investors tend to make allocation decisions based on the action in the rear-view mirror, but the aggregate household exposure to public equities does not appear worrisome after considering the secular decline in noncorporate businesses’ importance. Income And Credit Performance Changes in aggregate wealth do not link cleanly to credit performance. Households service debt out of their income, because if they didn’t need to augment or smooth out incoming cash flows they wouldn’t have borrowed in the first place. While there must be some link between the recent paydowns of credit card balances and increased household wealth, changes in wealth have far less bearing than changes in income when it comes to explaining consumer credit performance. Risk assets will eventually suffer in the absence of an additional fiscal aid package because cracks will start showing up all over the economy without more transfers. Current income in the form of generous fiscal transfers have made it possible for households to take the unprecedented step of paying down their credit card balances at the outset of a recession. Those transfers have also bolstered apartment rent collections and held down consumer loan delinquencies. Much of the transfer income has been saved and could be deployed to continue to service debt and prop up consumption, but the savings are not a panacea. Although August’s personal income release reflected an additional $85 billion in excess savings over what would have occurred under our baseline no-pandemic estimate, bringing the total excess savings from March through August to over $1.1 trillion (Table 1), it cannot plug the income gap indefinitely. Making several generous assumptions to support a back-of-the-envelope calculation, we estimate the average laid-off worker could at most go one more quarter without work before s/he fully ran down the cushion accumulated under the CARES Act (Table 2). Table 1Household Savings, With And Without The Pandemic
The Household Balance Sheet
The Household Balance Sheet
Table 2How Long Can The Average Worker Hold Out?
The Household Balance Sheet
The Household Balance Sheet
More help from Washington is needed, then, if the economy is to escape a potentially nasty downdraft. Our base-case scenario still holds that help will come this month, but Republican and Democratic negotiators had not reached an agreement before this report went to press. If they fail to do so before the election, all hope is not yet lost. If our average laid-off worker could hold out for September, October and November, s/he might avoid missed rent and loan payments as long the flow of aid resumed by December under a post-election bill. Investment Implications Since the pandemic arrived in the United States in full flower in March, we have viewed the big-picture economic and market backdrop as a contest between policymakers and the virus. Absent any monetary and fiscal stimulus, the US would have suffered a crippling recession in which cascading defaults and bankruptcies would have dented the economy’s growth capacity well into the long term. No modern policymaker would prescribe a Mellonian course of emetics to “purge the rottenness from the system,” but since no one knows how long COVID-19 will pose an acute threat to public health, no one can know for sure if the Fed and Congress will have the capacity and the will to provide the support to bridge the economic crater it will leave in its wake. Only Congress appears to have meaningful untapped capacity, and we expect it will regain its resolve to deploy it in time to make final campaign appeals. If no unexpected materially adverse virus development occurs – mortality and hospitalization rates remain subdued, testing capacity continues to expand, treatment protocols keep progressing and a vaccine is developed sometime in the first half of 2021 – it looks to us like a bill within the range of the latest proposals from the administration ($1.6 trillion) and the House ($2.2 trillion) would be enough to prevent the self-reinforcing wave of bankruptcies that have always been our worst-case-scenario fear. The devil is in the details, especially on Capitol Hill, but helping vulnerable businesses and workers, and reeling state and local governments, until a vaccine is in hand would support our constructive cyclical (12-month) view on risk assets. It would also support the SIFI banks, a prime beneficiary if the economy can slip the pandemic’s knockout credit punch. The market does not appear ready to embrace the SIFIs any time soon, but we will continue to recommend overweighting them as long as Congress eventually provides another sizable round of fiscal aid. The news of the president’s positive COVID-19 test could quite plausibly shake consumer and business confidence, undermining consumption and investment and making the need for fiscal aid even more acute. If he and other members of his circle recovery fully and quickly, however, economic participants might conclude that they have less to fear, helping to smooth the path of the recovery. His experience with the virus may well reshuffle election probabilities and our geopolitical strategists will be keeping a close eye on all the developments.1 As we go to press, we do not see a clear-cut market implication from the president’s illness and will stand pat with a tactically neutral equity allocation, an underweight bond allocation and an overweight cash position as we await further developments. Doug Peta, CFA Chief US Investment Strategist dougp@bcaresearch.com Footnotes 1 Please see the October 2, 2020 Geopolitical Strategy Special Alert, "Trump’s Illness Alone Not A Game Changer" available at gps.bcaresearch.com.
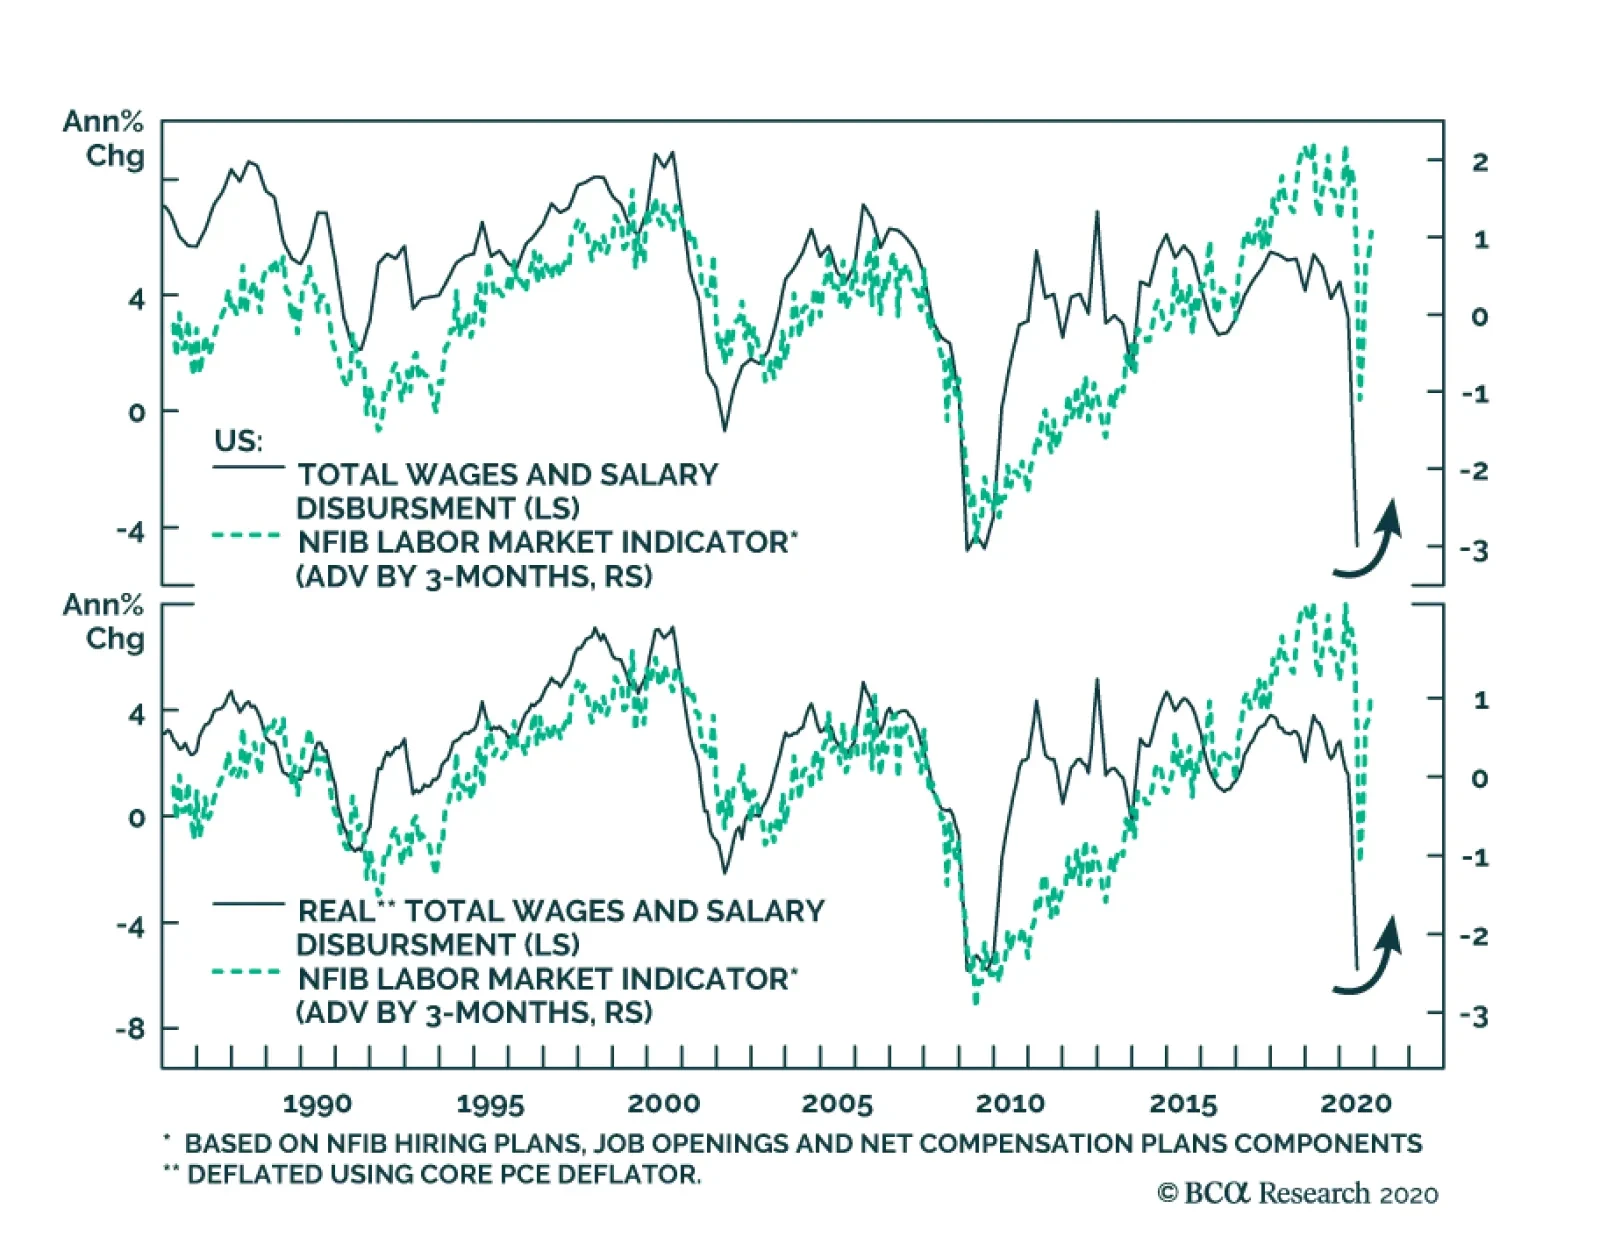
One of the great paradoxes of the COVID-19 recession is that between March and May, household disposable income grew by 9.28%. Obviously, this surge was a consequence of the CARES act's generous income provisions, which more than undid the negative impact on…
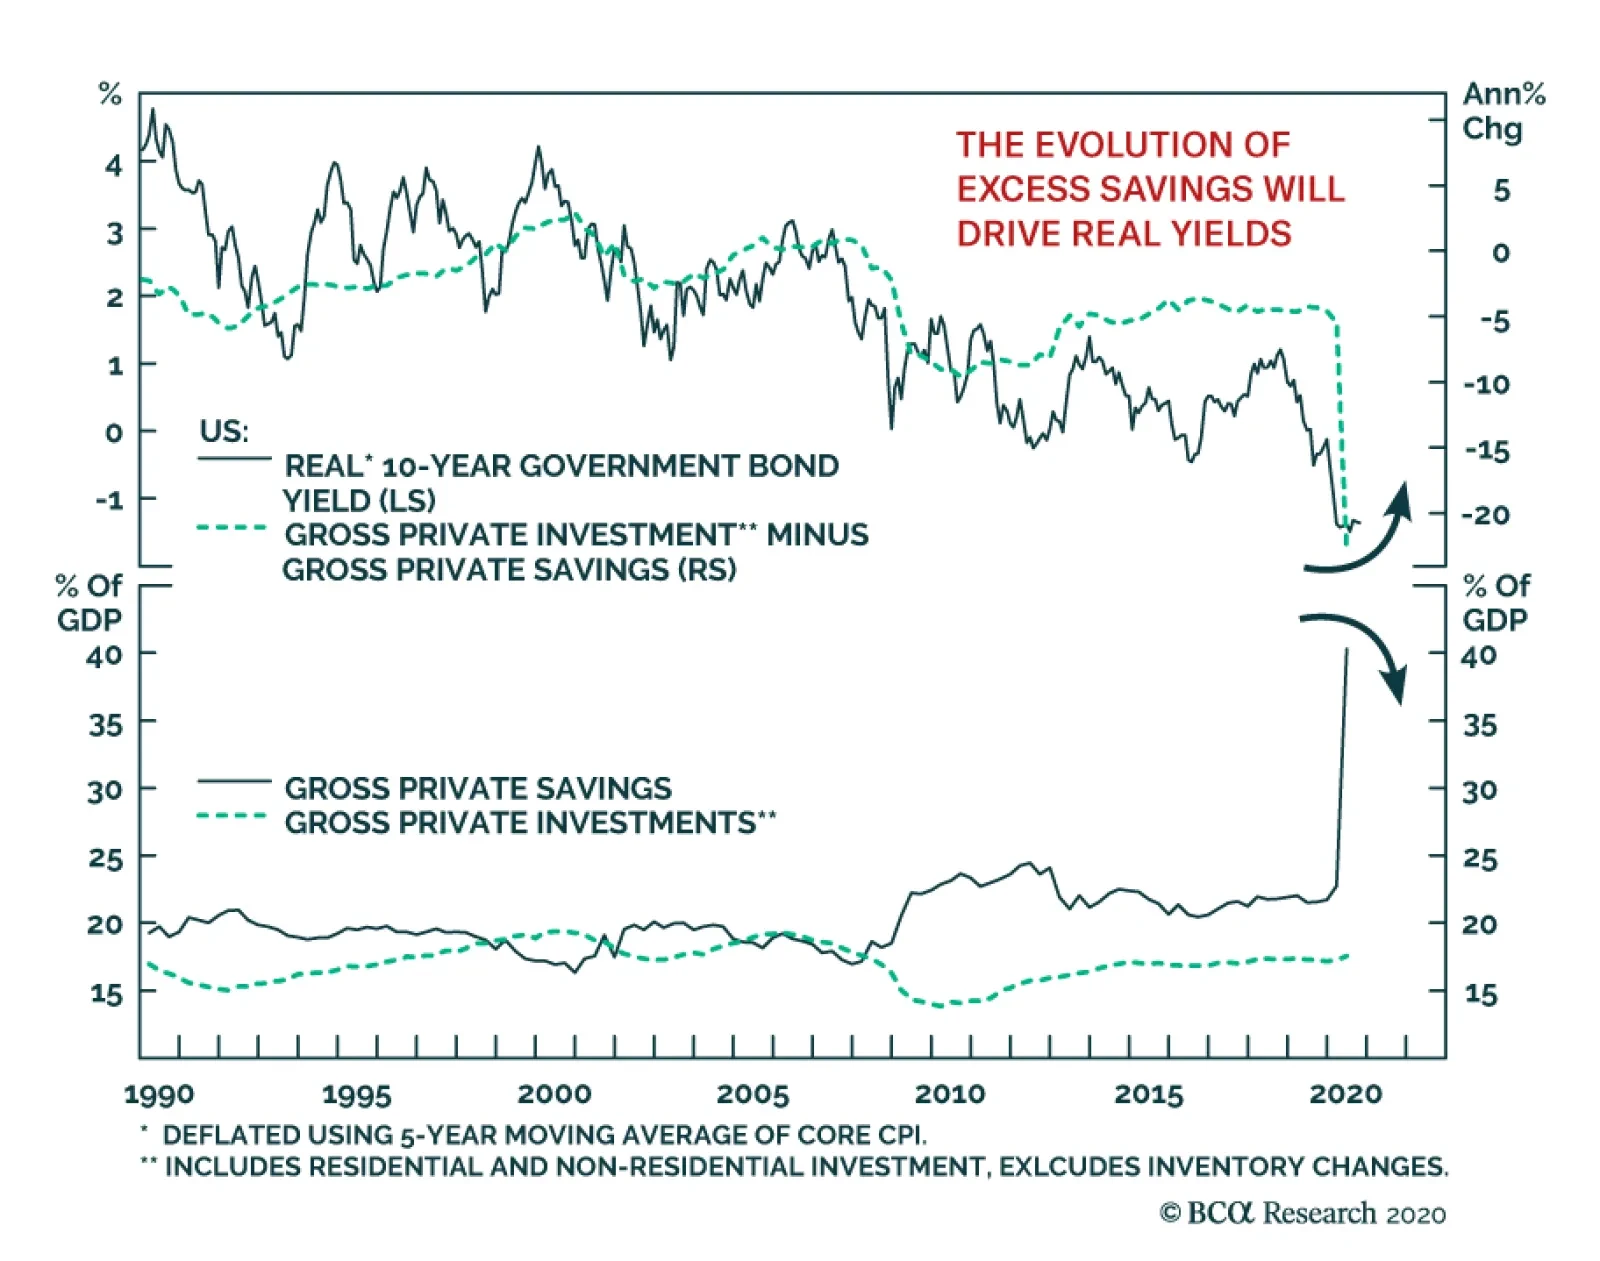
It is easy to paint a picture arguing that US real yields have little upside: The Fed is on hold indefinitely and aims to boost inflation expectations under its average-inflation target. However, the economic backdrop argues otherwise, suggesting that not…
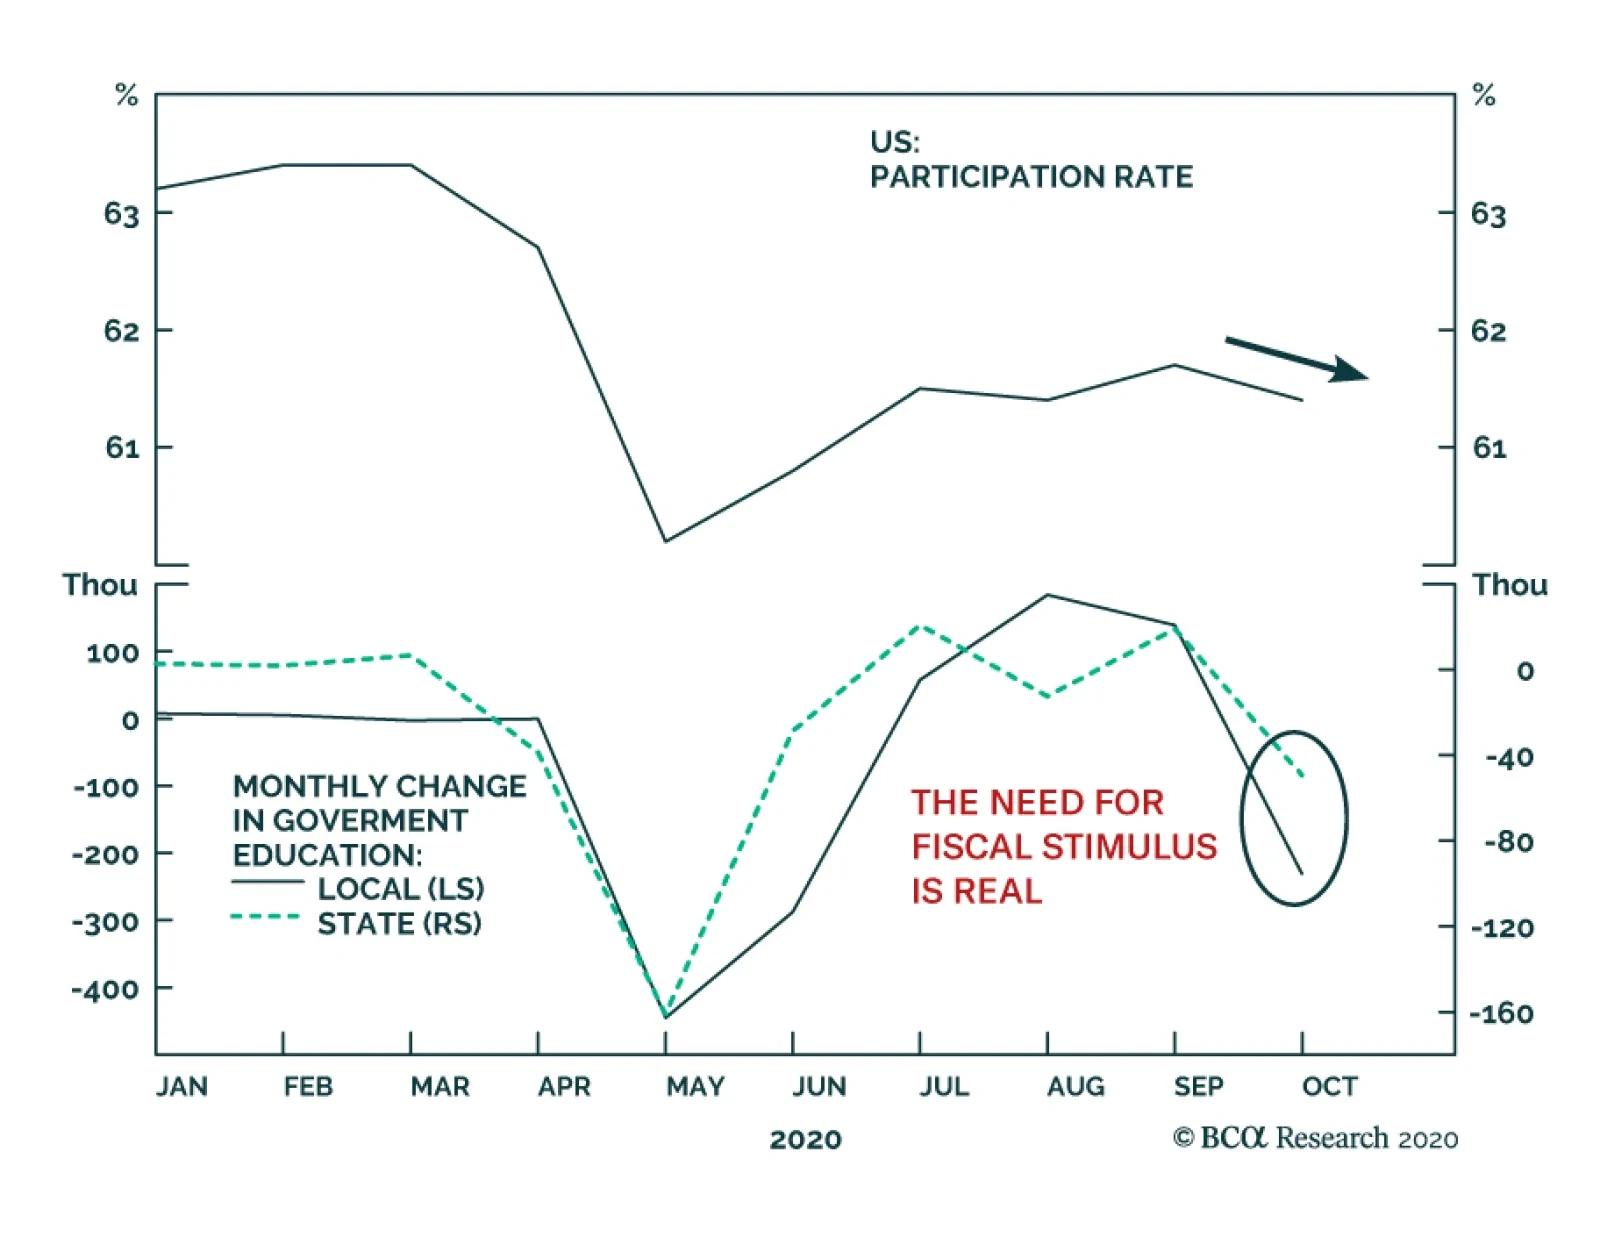
The September US Payroll number mostly bred confusion. It contained some important good news. While the headline job number disappointed, coming in at 661 thousand versus expectations of 859 thousand, the August job creation was revised up by 118 thousand.…
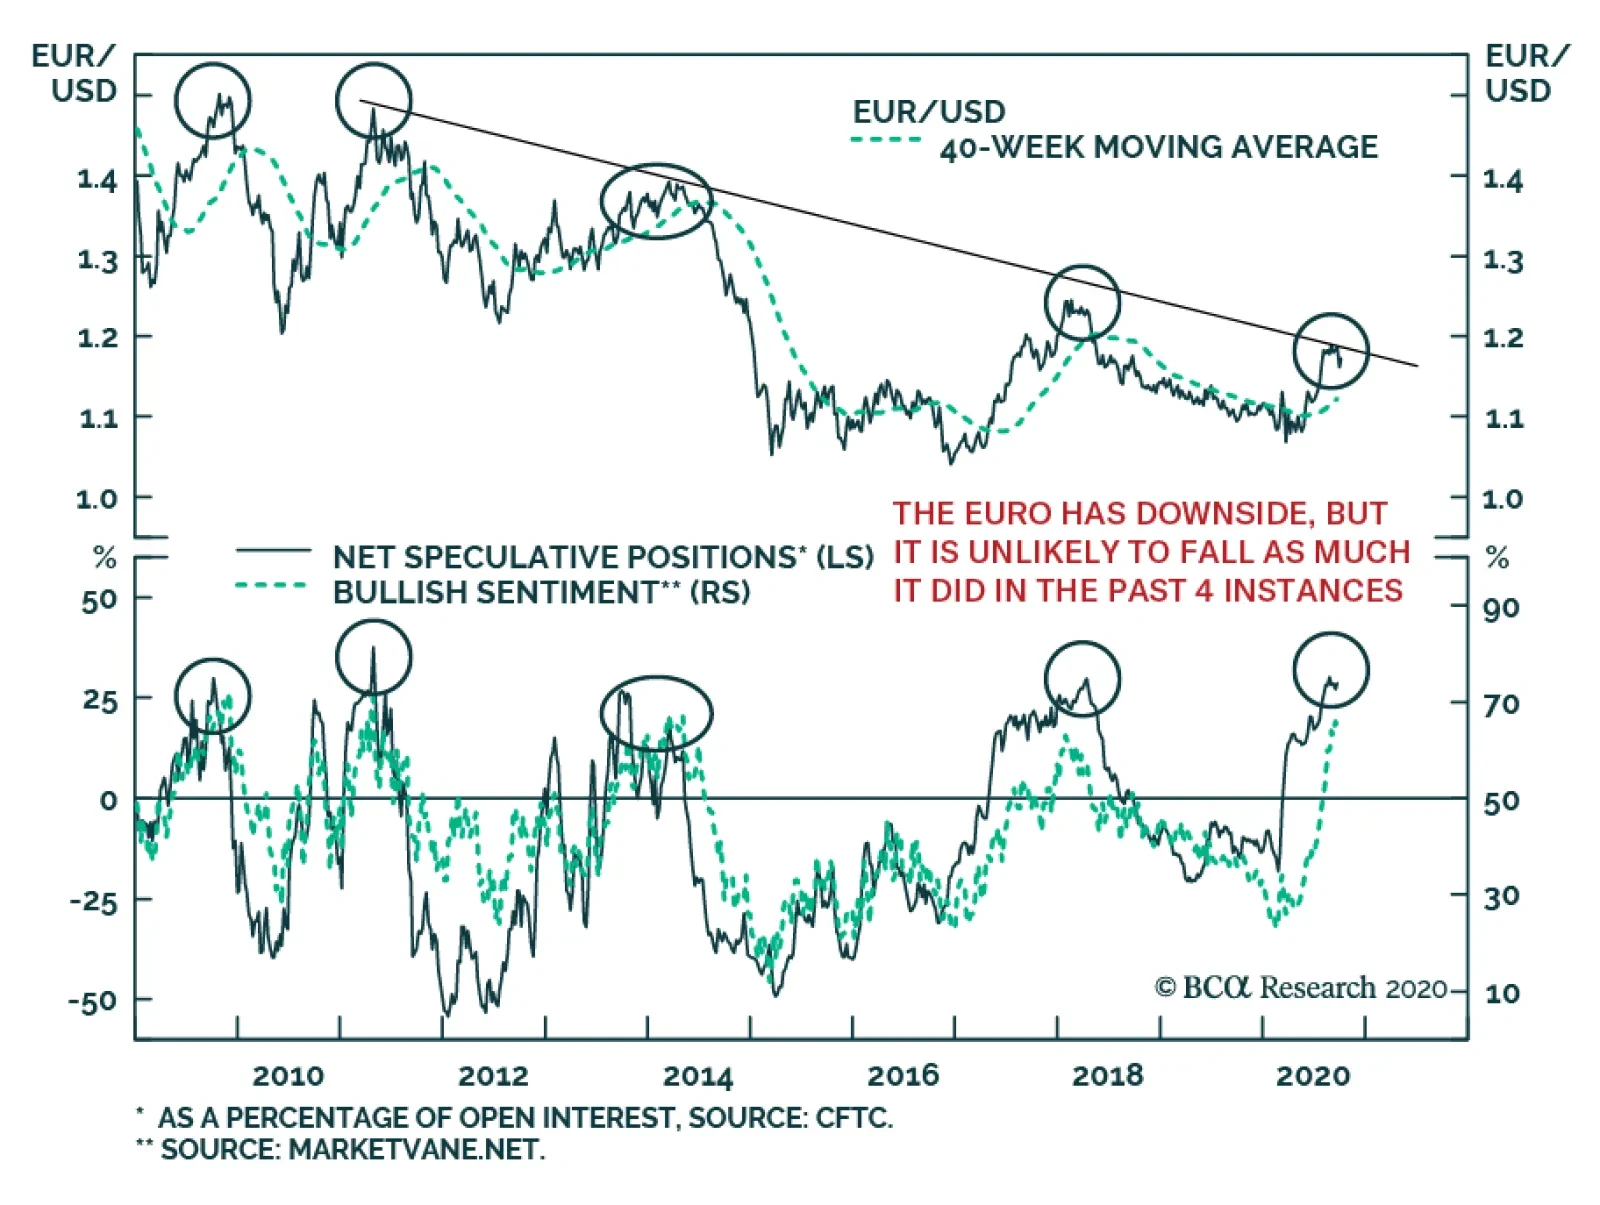
Highlights Three tail risks will continue to dominate the FX market narrative in the coming weeks: The upcoming November elections, Brexit, and the new wave of COVID-19 infections. As such, markets remain vulnerable in the near term and the dollar will continue to benefit from safe-haven flows. That said, most sentiment and technical indicators suggest the dollar is undergoing a countertrend bounce rather than entering a new bull market. Stay short USD/JPY as a core holding. Look to rebuy a basket of Scandinavian currencies versus the USD and EUR at a trigger point of -2%. Overall, the DXY should continue to face significant headwinds in the 94-96 zone, as we have witnessed recently. Feature US political risk remains the key “white swan” risk for currency markets. Unfortunately for investors, this week’s US presidential debate was full of theatrics and low on content. CNN polling showed that former Vice President Joe Biden was the preferred candidate going into the debate, and emerged as the interim winner. To be sure, the CNN polls are biased, with more contribution from Democratic voters compared to Republican ones. That said, it certainly helped that despite President Donald Trump’s constant jawboning, the former Vice President appeared unfazed and managed to slip in some of the key points of his political campaign. A Debate Post-Mortem Chart I-1The Dollar And Political Uncertainty
The Dollar And Political Uncertainty
The Dollar And Political Uncertainty
The political theater is likely to continue in the coming days. In terms of timelines, we have the Vice-Presidential debate on October 7 and the second and third Presidential debates on October 15 and October 22. But the most important dilemma for currency markets is not whether we have a Democratic or Republican victory, but if the US becomes the source of political uncertainty compared to the rest of the world. For almost two decades, the most important political driver of the dollar was whether uncertainty in the US was rising or falling relative to the rest of the world (Chart I-1). As markets begin to digest the political outcomes, the ultimate conclusion could be dollar bearish. Let’s start with what is priced in. Political uncertainty in the US has surged relative to the rest of the world as mentioned above. Part of the reason is that betting markets now expect a “blue wave” (Chart I-2). This was reinforced by the Presidential debates where former VP Biden was the preferred candidate (Chart I-3). A blue wave implies that Bidens wins the White House while Democrats gain control of the Senate, and retain the House. Chart I-2ABetting Markets Expect A Blue Wave
Tail Risks In FX Markets
Tail Risks In FX Markets
Chart I-2BBetting Markets Expect A Blue Wave
Tail Risks In FX Markets
Tail Risks In FX Markets
Chart I-3AFormer Vice President Joe Biden Was A Favorite
Tail Risks In FX Markets
Tail Risks In FX Markets
Chart I-3BFormer Vice President Joe Biden Was A Favorite
Tail Risks In FX Markets
Tail Risks In FX Markets
Such a victory will lead to massive fiscal stimulus, since Democratic leaders have been more aggressive in their demands for a greater government role in the economy. Bigger fiscal spending will lead to a higher US debt burden, widen the twin deficits and be only modestly positive for bond yields given that the Federal Reserve will anchor short term rates at zero. If US inflation takes off from increased aggregate demand, foreign bond investors are likely to continue fleeing the US market as real rates become even more negative, driving down the dollar in the process. Admittedly, there has been a small uptick in political uncertainty in the world relative to the US. President Donald Trump’s approval rating is closely correlated to the state of the economy and the US has been in a V-shaped recovery since the second quarter of this year. But as Chart I-2 shows, the probability of a Republican victory from betting markets has fallen recently. A Trump victory will ensure that the policies that have been favorable for markets since 2016 remain in place. Vice President Joe Biden’s hawkish tax policies, which he stuck with in the debate, will also be off the table. In terms of calculus, Senate Republicans may have to give in to more stimulus before the election to grease the wheels of the economy and support asset prices, which will otherwise fall and torpedo their chances. The most favorable outcome for markets could potentially be for Biden to clinch the White House and the Republicans to maintain control of the Senate. For one, it is likely that taxes will not go up as aggressively as Biden is proposing to raise them, while the likelihood of a global trade war will also fall. The dollar’s safe-haven bid will also fade, as capital starts to gravitate from the US towards other cheaper and beaten-up markets. What, then, are the bullish scenarios for the dollar? Chart I-4Swing State Wages Turning Up
Swing State Wages Turning Up
Swing State Wages Turning Up
First, a failure to pass a stimulus bill will boost the dollar, hijack the recovery, and cause a setback to risk assets. Second, big swings in Trump’s approval ratings will raise the prospect of a contested election. According to our Chief Geopolitical Strategist Matt Gertken, his in-house quantitative election model now pins the probability of a Trump victory at almost 50%. Remarkably, Michigan has risen to the ranks of a toss-up state, as economic indicators have drastically improved. In a nutshell, a V-shaped recovery in wages for the swing states that voted for President Trump boost his chances (Chart I-4). However, these are likely short-term hiccups that will ultimately be resolved. The base case is still for a Democratic win, according to Matt. Either way, we will know who the US President is by December (or, worst case, by January) and a new fiscal bill is likely to be passed, regardless of who sits in the White House. Forward-looking financial markets, by then, will have stopped discounting political uncertainty as they currently are. Therefore, as we argued last week, we continue to pay heed to both sentiment and technical indicators that suggest the dollar is in a counter-trend bounce, rather than a renewed bull market. What About The COVID-19 Saga? Unfortunately for markets, the US presidential election is not the only source of uncertainty. As we approach the winter season in the northern hemisphere, the potential for a new wave of infections is rising. As we approach the winter season in the northern hemisphere, the potential for a new wave of infections is rising. We are already in full lockdown in Montreal, Quebec, where BCA Research's headquarters are located. Around the G10, a second wave is taking hold in the euro area, UK, and Canada. Even Norway and Switzerland, which had managed to keep the virus under wraps for most of the summer, are seeing a resurgence in cases. Infection trends remain favorable in Australia, Japan, New Zealand, and Sweden, probably due to previous localized lockdowns in most of these countries (Chart I-5). Chart I-5A New COVID-19 Wave
A New COVID-19 Wave
A New COVID-19 Wave
The most direct impact for currency markets is relative economic growth. For much of the summer months, the US was under siege from a second wave while the Eurozone, and many other countries, were well into their reopening phases. This affected currency markets (Chart I-6). Specifically, the dollar declined as economic momentum was higher outside the US. More recently, improving relative economic performance between the US and other G10 countries has been a key catalyst behind the dollar’s recent strength (Chart I-7). Chart I-6Rising US Cases And A Fiscal Logjam
Rising US Cases And A Fiscal Logjam
Rising US Cases And A Fiscal Logjam
Chart I-7The Dollar And Relative Growth
The Dollar And Relative Growth
The Dollar And Relative Growth
Going forward, the potential impact from COVID-19 is likely to be much less than what many economies endured for the first half of 2020. There are a few reasons for this. The virus has become less deadly, as mortality rates across many countries have come down. This could be due to a higher incidence of infections among younger people, who are also healthier, or due to the widespread wearing of masks, which has helped mitigate the viral load. Governments are unlikely to introduce the kind of widespread lockdowns we saw during the onset of the outbreak. More likely are localized lockdowns, such as what we are experiencing here in Quebec, and stringent rules on sanitation and social distancing. We are closer to a vaccine than we were at the start of the year. According to Bio, an association of biotechnology and health care companies, there are currently 739 unique active compounds in development spanning the range from vaccines and antivirals to treatments for COVID-19. Almost 20 of these are in Phase 4 trial. Overall, there are 189 vaccines under trial, a big jump up from nil at the start of the year. Chart I-8Lots Of Fiscal Stimulus In Canada
Tail Risks In FX Markets
Tail Risks In FX Markets
The big risk is that governments fail to provide fiscal help to bridge economies until the widespread availability of a vaccine. However, outside the US, that does not appear to be the case. For example, during his Throne Speech last week, Canadian Prime Minister Justin Trudeau vowed to do “whatever it takes” to support people and businesses throughout the crisis. The Liberal government has just followed up with a C$10 billion infrastructure spending plan. Fitch Ratings estimates that the budget deficit in Canada will still remain wide going into 2022 (Chart I-8). In Australia, the Liberal-National coalition government has also been very proactive, especially with the “Job Seeker” and “Job Keeper” scheme, which has provided a valuable cushion for domestic economic conditions. The IMF estimates the fiscal thrust in Australia will be positive in 2021. In the euro area, there is still a 750 billion euro stimulus package to be deployed, while France announced a 100 billion euro plan last month. The bottom line is that while the pandemic is likely to induce more shockwaves into markets, spending gridlock appears to be concentrated within the US. At a minimum, this will limit any upside bounce in the dollar, since it will hurt US economic growth relative to its G-10 peers. An Update On Brexit Chart I-9EUR/GBP Bets Are Lopsided
EUR/GBP Bets Are Lopsided
EUR/GBP Bets Are Lopsided
As the pandemic returns in full force again in the UK, political uncertainty is also rising. Brussels is suing the UK on the new “internal market bill” that violates the Brexit withdrawal agreement. The key issue is still Northern Ireland. Last year, the agreement was that Ireland would remain bound to the EU’s customs and trade regime. The UK is seeking an amendment to be able to intervene, if there is “inconsistency or incompatibility with international or domestic law.” As we posited two weeks ago, it provided for UK discretion in state aid and the movement of goods to and from Northern Ireland, which the EU argues is a clear breach of the last year’s treaty. From the UK point of view, if there is no trade deal, why would it allow a division to emerge within its own national borders? It is remarkable that despite the ramp up in tensions, the GBP/USD remains well bid above 1.28. Odds of a “hard” Brexit have usually been associated with cable near 1.20. This suggests two things: Either we are in a new paradigm, where the dollar is winning the “ugly contest,” or the market is underestimating the potential for a hard Brexit. Fitch estimates that the budget deficit in Canada will still remain wide going into 2022. We subscribe to the former view. First, because the British government has nothing to gain from failing to agree to a trade deal, since the recession would only deepen, while it has much to lose, since the Scottish independence movement would likely gain steam. Second, risk reversals between cable and the euro are close to the post-referendum lows. This means that investors have already built significant put options on the pound, and call options on the euro (Chart I-9). Our base case remains that a deal will ultimately be reached. The UK side has a more resurgent pandemic to deal with, and will need to offer some concessions to ease economic volatility. Trade links between the two are also quite large. In terms of targets, cable will trade between 1.35-1.40 over the next six months. In an optimistic scenario, the pound could go 20%-25% higher. The pound is also cheap versus the euro — another sign that the market is not underestimating the no-deal exit risk. Ergo, shorting EUR/GBP (or being long EUR/GBP volatility) should be a good short-term bet on an eventual resolution. Investment Implications We continue to advocate for a prudent strategy when trading foreign exchange markets over the next few weeks: Hold some portfolio protection. Our preferred vehicle is the Japanese yen, which is cheap, although the pricier Swiss franc also make sense. Focus on trades at the crosses. We are short the NZD/CAD and EUR/GBP as a play on relative fundamentals, but are also looking to buy EUR/CHF on weakness and sell CAD/NOK on strength. We will discuss our CAD strategy in the coming weeks. Buy Scandinavian currencies if they drop another 2% versus an equal weighted basket of the euro and USD (Chart I-10). We initially took profits on this trade a fortnight ago, booking solid gains. Stay short the gold/silver ratio but tighten stops to 84. Chart I-10The Scandinavian Currencies Remain Cheap
The Scandinavian Currencies Remain Cheap
The Scandinavian Currencies Remain Cheap
Chester Ntonifor Foreign Exchange Strategist chestern@bcaresearch.com Currencies U.S. Dollar Chart II-1USD Technicals 1
USD Technicals 1
USD Technicals 1
Chart II-2USD Technicals 2
USD Technicals 2
USD Technicals 2
Recent data from the US have been mostly positive: The ISM Manufacturing PMI marginally declined from 56 to 55.4 in September. The new orders component slipped but remained elevated at 60.2. The Dallas Fed Manufacturing Index increased from 8 to 13.6 in September. The Chicago Manufacturing Index surged from 51.2 to 62.4 in September. Durable goods orders increased by 0.4% month-on-month in August. Initial jobless claims increased by 837K for the week ending on September 25. The DXY index fell by 0.6% this week. Market uncertainty continues as the election draws closer and the number of COVID cases keeps rising. The New York Fed Staff Nowcast revised Q4 GDP downward to 5.05% from 7.28% earlier this month. While risks remain tilted to the downside, any positive news on a vaccine and stimulus could revive risk sentiment, which is negative for the US dollar. Report Links: The Message From Dollar Sentiment And Technical Indicators - Sept. 25, 2020 Addressing Client Questions - Sept. 4, 2020 A Simple Framework For Currencies - July 17, 2020 The Euro Chart II-3EUR Technicals 1
EUR Technicals 1
EUR Technicals 1
Chart II-4EUR Technicals 2
EUR Technicals 2
EUR Technicals 2
Recent data from the euro area have been mixed: The Economic Sentiment Indicator increased from 87.5 to 91.1 in September. The Producer Price Index declined by 2.5% year-on-year in August. The unemployment rate ticked slightly up from 8 to 8.1% in August. The euro rebounded by 0.7% against the US dollar this week. The latest EU Economic Sentiment Indicator suggests that the economy continues to recover, albeit at a slower speed than expected. The resurgence of COVID cases might also lead to downward revisions to the Q4 growth outlook, which could trigger further stimulus from the ECB. Report Links: Addressing Client Questions - September 4, 2020 On The DXY Breakout, Euro, And Swiss Franc - February 21, 2020 Updating Our Balance Of Payments Monitor - November 29, 2019 Japanese Yen Chart II-5JPY Technicals 1
JPY Technicals 1
JPY Technicals 1
Chart II-6JPY Technicals 2
JPY Technicals 2
JPY Technicals 2
Recent data from Japan have been improving: Tokyo’s headline inflation declined from 0.3% to 0.2% year-on-year in September. Core inflation remained negative at -0.2% year-on-year. Vehicle sales contracted by 15.6% year-on-year in September. August saw a contraction of -18.5%. Industrial production rose by 1.7% month-on-month in August, while construction orders surged by 28.5% year-on-year in August. The Japanese yen has been flat against the US dollar this week. Japan’s Q3 Tankan Survey released this Thursday suggests that manufacturers’ sentiment has improved for the first time in three years, showing signs of a recovery supported by pent-up demand. The Japanese yen remains our favorite safe-haven hedge. Report Links: The Near-Term Bull Case For The Dollar - February 28, 2020 Building A Protector Currency Portfolio - February 7, 2020 Currency Market Signals From Gold, Equities And Flows - January 31, 2020 British Pound Chart II-7GBP Technicals 1
GBP Technicals 1
GBP Technicals 1
Chart II-8GBP Technicals 2
GBP Technicals 2
GBP Technicals 2
Recent data from the UK have been positive: The current account deficit narrowed from £20.8 billion to £2.8 billion in Q2. Nationwide housing prices increased by 5% year-on-year in September. Mortgage approvals surged by 84.7K in August. The British pound appreciated by 0.3% against the US dollar this week. The chief economist from the BoE, Andy Haldane, downplayed the possibility of negative interest rates in the UK in a speech on Wednesday. According to the speech, current conditions don’t warrant any further lowering of interest rates, which is positive for the British pound. Report Links: Revisiting Our High-Conviction Trades - September 11, 2020 Updating Our Balance Of Payments Monitor - November 29, 2019 A Few Trade Ideas - Sept. 27, 2019 Australian Dollar Chart II-9AUD Technicals 1
AUD Technicals 1
AUD Technicals 1
Chart II-10AUD Technicals 2
AUD Technicals 2
AUD Technicals 2
Recent data from Australia have been positive: Building permits fell by 1.6% month-on-month in August, following a 12.2% surge in the previous month. On a year-on-year basis, the August figure grew by 0.6% compared to the same month last year. The AiG Manufacturing PMI slipped from 49.3 to 46.7 in September. However, the final Markit Manufacturing PMI ticked up from 53.6 to 55.4. The Australian dollar increased by 1.6% against the US dollar this week. COVID-19 cases in Australia remain at low levels. As such, the Aussie has benefitted tremendously from the reflation trade. We remain positive on the Aussie both at the crosses as well as versus the USD. Report Links: An Update On The Australian Dollar - September 18, 2020 On AUD And CNY - January 17, 2020 Updating Our Balance Of Payments Monitor - November 29, 2019 New Zealand Dollar Chart II-11NZD Technicals 1
NZD Technicals 1
NZD Technicals 1
Chart II-12NZD Technicals 2
NZD Technicals 2
NZD Technicals 2
Recent data from New Zealand have been positive: Building permits increased by 0.3% month-on-month in August. The ANZ Business Confidence Index declined slightly from -26 to -28.5 in September, while the ANZ Activity Outlook Index improved from -9.9 to -5.4. The New Zealand dollar appreciated by 1.4% against the US dollar this week. While the New Zealand dollar might outperform the US dollar as the growth outlook improves, it remains likely to underperform at the crosses due to a more dovish RBNZ. Moreover, our FX model downgraded the kiwi to neutral for the month of October. Tactically, we are also short NZD/CAD. Report Links: Currencies And The Value-Versus-Growth Debate - July 10, 2020 Updating Our Balance Of Payments Monitor - November 29, 2019 Place A Limit Sell On DXY At 100 - November 15, 2019 Canadian Dollar Chart II-13CAD Technicals 1
CAD Technicals 1
CAD Technicals 1
Chart II-14CAD Technicals 2
CAD Technicals 2
CAD Technicals 2
Recent data from Canada have been positive: GDP expanded by 3% month-on-month in July. Building permits increased by 1.7% month-on-month in August. The Bloomberg Nanos confidence Index slightly ticked up from 53.1 to 53.2 for the week ending on September 25. The Canadian dollar increased by 0.7% against the US dollar this week. According to Statistics Canada, the economy expanded for a third consecutive month in July as more sectors reopened in the summer. Notably, all 20 industrial sectors posted gains in July. We continue to favor the Canadian dollar against the US dollar and will discuss the loonie more in-depth in the coming weeks. Report Links: Currencies And The Value-Versus-Growth Debate - July 10, 2020 More On Competitive Devaluations, The CAD And The SEK - May 1, 2020 A New Paradigm For Petrocurrencies - April 10, 2020 Swiss Franc Chart II-15CHF Technicals 1
CHF Technicals 1
CHF Technicals 1
Chart II-16CHF Technicals 2
CHF Technicals 2
CHF Technicals 2
Recent data from Switzerland have been mixed: The KOF Leading Indicator increased from 110.2 to 113.8 in September. Headline inflation increased from -0.9% to -0.8% year-on-year in September but remains deep in negative territory. Real retail sales increased by 2.5% year-on-year in August. Total sight deposits increased from CHF 703.9 billion to CHF 704.5 billion for the week ending on September 25. The Swiss franc appreciated by 1% against the US dollar this week. The KOF survey highlighted that Switzerland is in a V-shaped recovery. However, deflation remains pervasive, suggesting a strong franc could torpedo the recovery. We continue to expect the SNB to step up the pace of intervention, and are buyers of EUR/CHF on weakness. Report Links: On The DXY Breakout, Euro, And Swiss Franc - February 21, 2020 Currency Market Signals From Gold, Equities And Flows - January 31, 2020 Portfolio Tweaks Before The Chinese New Year - January 24, 2020 Norwegian Krone Chart II-17NOK Technicals 1
NOK Technicals 1
NOK Technicals 1
Chart II-18NOK Technicals 2
NOK Technicals 2
NOK Technicals 2
Recent data from Norway have been positive: Real retail sales expanded by 8.2% year-on-year, following a 13.8% surge the previous month. The Norwegian krone rose by 2.2% against the US dollar this week. The latest data from Statistics Norway showed strength in retail sales across various categories, especially in household equipment, recreational goods, food and beverages. We remain NOK bulls based on our positive energy price outlook, the resilience in domestic demand and a less dovish central bank. Report Links: Revisiting Our High-Conviction Trades - September 11, 2020 A New Paradigm For Petrocurrencies - April 10, 2020 Building A Protector Currency Portfolio - February 7, 2020 Swedish Krona Chart II-19SEK Technicals 1
SEK Technicals 1
SEK Technicals 1
Chart II-20SEK Technicals 2
SEK Technicals 2
SEK Technicals 2
Recent data from Sweden have been positive: The Swedbank Manufacturing PMI increased from 53.4 to 55.3 in September. Retail sales grew by 3% year-on-year in August. Consumer confidence increased from 85.1 to 88.3 in September. The trade balance shifted from a surplus of SEK 4 billion to a deficit of 1.6 billion in August. The Swedish krona rebounded by 1.6% against the US dollar this week. We continue to like the Swedish krona along with the Norwegian krone. We are looking to purchase the Nordic basket again at a 2% discount relative to last week’s price levels. Stay tuned. Report Links: Revisiting Our High-Conviction Trades - September 11, 2020 Updating Our Balance Of Payments Monitor - November 29, 2019 Where To Next For The US Dollar? - June 7, 2019 Kelly Zhong Research Analyst Trades & Forecasts Forecast Summary Core Portfolio Tactical Trades Limit Orders Closed Trades
Highlights President Trump’s contraction of COVID-19 will buy him some voter sympathy but it will not change the game in the US election unless he perishes from the disease (unlikely), or Senate Republicans agree to a new relief package in the face of heightened national attention to the pandemic. Our quantitative election model gives Republicans a 49% chance of winning the White House. We think the odds are much lower, at 35%, but we will upgrade them if the Senate GOP approves a new fiscal relief package. A relief package would remove the risk of financial turmoil in the final month of the campaign, which would be the death knell for Republicans. The election is ultimately about the pace of de-globalization and the disruptiveness of US political polarization. If Trump wins, these forces will intensify. If not, global uncertainty will get a reprieve … though US-China conflict will persist in the long run. Feature United States President Donald J. Trump is reported to have contracted COVID-19 and to be showing minor symptoms. Vice President Mike Pence has tested negative. The office of the president will not be vacant. The Republican Party election campaign will likely benefit from some sympathy, but a failure to pass new fiscal stimulus in Congress would hurt the Republican bid anyway via market turmoil. Foreign powers have mostly avoided antagonizing President Trump as the election approaches. The US would react aggressively if threatened by another state during a period of heightened vulnerability. But while the US is distracted, other powers can pursue their interests within their region more aggressively. In this report, we explore the implications of Trump’s sickness, including the worst case for the president. We are a non-partisan and non-normative investment strategy and have no intention of doing anything other than investigating the scenarios that could arise. Step Back – What Is Trump’s Personal Impact? What is the US election really about, from an investment point of view? It is about whether global policy uncertainty will continue its dramatic ascent in recent years. Huge increases in uncertainty have exacerbated the dollar bull market and US equity outperformance, as the US is an insulated market and the dollar is a safe haven currency (Chart 1). Chart 1US Election Is About Relative Policy Uncertainty
US Election Is About Relative Policy Uncertainty
US Election Is About Relative Policy Uncertainty
If Trump is elected, uncertainty will spike again on Trump’s erratic conduct of foreign and trade policy, particularly the likelihood of a “Phase Two” trade war with China and potentially a global trade war. If not, US trade and foreign policy will moderate. It will not return to the status quo ante 2016, but it will be more predictable, more responsive to the input of presidential advisers, less erratic. This is more or less the case if Democratic Party candidate Joe Biden wins or if Trump should be succeeded by Pence, who is a conventional Republican and would continue Trump’s policies with less aggression. The US election is also about political polarization within the United States. Trump has exacerbated this long-spiraling trend because he is not nationally popular but depends on regional appeal, so his presidency splits the popular vote from the Electoral College vote. He is also extremely controversial when it comes to voters’ deepest-held values. Polarization has contaminated US fiscal policy as well as foreign policy (e.g. the Middle East). The US debt ceiling crises of 2011-13 and the current standoff over COVID fiscal relief have global market consequences but are the result of US partisanship. The Tax Cut and Jobs Act injected steroids into the US economy, while its partial repeal under Biden would weigh on animal spirits. Chart 2Election Is About US Polarization, Which Raises Risks To RoW
Election Is About US Polarization, Which Raises Risks To RoW
Election Is About US Polarization, Which Raises Risks To RoW
US polarization, like US protectionism, has fed into global uncertainty in recent years and aggravated the dollar’s strength, US equity outperformance, US tech outperformance, and the downward trend in US treasury yields (Chart 2). Given the above, if Trump is not awarded a second term the world will see a reprieve in uncertainty – at least once a new administration takes shape. Trade risk will decline, and polarization and fiscal risk could decline depending on the outcome in the Senate. However, uncertainty will not collapse to pre-2016 levels. The world will still face geopolitical multipolarity, which comes from the US’s relative loss of economic and military power. Ultimately the US conflict with China will continue under Biden or Pence or any other American president. Sans Trump, it is unlikely that the US would expand the trade war to the European Union or the rest of the world. The US would also be more cooperative with NATO and other international institutions under Biden and even Pence. Bottom Line: US monetary policy will be ultra-dovish over most of the next presidency. Hence faster US growth will cause real interest rates to fall, which is ostensibly negative for the dollar and positive for risk-on currencies and commodities. Hence the election raises risks due to fiscal and trade policy. On fiscal policy, the Senate race is key, discussed below. On trade policy, either Biden or Pence would be less hawkish than Trump, but not dovish, meaning that the EU and the euro would become the ultimate beneficiaries of a change of president while China and the renminbi face risks over the medium- and long-term regardless. So How Will Trump’s Illness Affect The Election? The immediate impact of Trump’s illness on global financial markets is volatility due to election uncertainty: Trump’s sickness underscores that COVID cases are reemerging both in the US and Europe, which will discourage economic activity as households and firms practice distancing. This is market negative. Unless a fiscal stimulus package is passed promptly, that is. It remains unclear whether Senate Republicans will agree to a fiscal package prior to the election. We think they will, but our view is under pressure. The odds have probably gone up due to the president’s sickness and the resurgence of the COVID crisis. If Republican Senators prove pragmatic, then the fiscal outlook for the next two years improves because they could retain a majority of the Senate. If Biden wins, a Republican Senate will be obstructionist – a clear fiscal risk for the next two years – but it is still immensely important to determine if they are pragmatic enough to concede to more spending when a crisis becomes acute, as that would reduce the risk. Chart 3Trump’s Handling Of COVID Has Been A Major Liability
Trump’s Illness Alone Not A Game Changer
Trump’s Illness Alone Not A Game Changer
Republican odds of winning the White House and Senate should increase somewhat due to Trump’s illness, which in turn reduces the odds of tax hikes and re-regulation. A major liability for the party has been Trump’s handling of COVID but his own sickness may clear them of some blame (Chart 3). Our quantitative election model already gives the Republican Party a 49% chance of election based on the V-shape economic recovery (Chart 4). Typically elections are a referendum on the incumbent party, and the Republican Party may receive a sympathy boost. In modern times the incumbent party has won the election in every instance in which the president died in office, though this is not the most likely outcome (Table 1). Chart 4Trump Has 49% Chance of Victory According To Our US Election Quant Model
Trump’s Illness Alone Not A Game Changer
Trump’s Illness Alone Not A Game Changer
Table 1In Modern Times, Incumbent Party Wins After Presidents Who Died In Office
Trump’s Illness Alone Not A Game Changer
Trump’s Illness Alone Not A Game Changer
Conservative British Prime Minister Boris Johnson received a popular opinion bounce and survived COVID-19 but the election took place before his illness. The period between April 5 and 12, when he left the hospital, was a harrowing time. While Boris received only a temporary boost in opinion polls, for President Trump any boost would be convenient given that the election is right around the corner if he recovers in mid-October (Chart 5). Chart 5Boris Got A Sympathy Bounce For COVID
Trump’s Illness Alone Not A Game Changer
Trump’s Illness Alone Not A Game Changer
Any boost for Republicans this month increases the risk of a closely fought election whose results are contested. That in turn will prolong volatility though it will be resolved by December or worst-case end of January. If Republicans lose steam the Democrats will win a clean sweep in November. Bottom Line: Trump’s COVID-19 October surprise highlights the rise in volatility which can last through the next few months, likely motivating a counter-trend bounce in the dollar and weakness in risky assets. The main market outcomes depend on whether Trump survives (most likely he will), whether a fiscal deal is passed now or later (we think it will be passed but risks are rising), and whether Republicans retain the White House and Senate (neither is our base case at present). How Would The Market Respond To Trump’s Passing? Table 2COVID-19 Death Rates By Age Cohort
Trump’s Illness Alone Not A Game Changer
Trump’s Illness Alone Not A Game Changer
Investors cannot shy away from difficult questions. Tables 2 and 3 highlight that the mortality rates for males infected by COVID-19 according to age and body mass index. We do not want to jump to any conclusions regarding his illness, but like many Americans, the president faces a serious risk – between 2%-8% odds of death – though he will get the best treatment. Table 3COVID-19 Mortality Risk Increases With Body Mass Index
Trump’s Illness Alone Not A Game Changer
Trump’s Illness Alone Not A Game Changer
Trump is more likely to survive, but if he should pass away then the market’s direction, whatever it is, will ultimately be unaffected outside of the trade issues discussed above. The experience of all previous American presidents who have died in office during the history of the S&P 500 demonstrates this point (Chart 6). Hence the fate of the fiscal relief bill, the election itself, and other pandemic and economic data are more important than the president for the short-term direction of stocks. Chart 6SPX Returns On Death Of US President
SPX Returns On Death Of US President
SPX Returns On Death Of US President
Chart 7SPX Returns For Presidents Seeking Re-Election After H1 Recession
SPX Returns For Presidents Seeking Re-Election After H1 Recession
SPX Returns For Presidents Seeking Re-Election After H1 Recession
Only three presidents have been re-elected when a recession occurred during the election year. Prior to Trump’s illness, the stock market was sending mixed signals about whether Trump would follow in their footsteps (Chart 7). Interestingly, two of these three were “takeover presidents” who succeeded the death of a president in office: Theodore Roosevelt (1904) and Calvin Coolidge (1924). Opinion polls showed a tightening race in the critical swing states prior to the first debate on September 29 and today’s news of Trump’s illness (Chart 8). Polls will tighten temporarily if Trump does get sympathy, namely from independents and undecided voters. Trump is viewed as having lost the first presidential debate to Biden, but public opinion on the debates is not an accurate predictor of the presidency (Chart 9). Today’s news will neutralize the first debate. It may also result in the cancellation of the October 15 debate. There is already criticism from top Democrats and Republicans about the debates. They could matter, but most likely they will not determine the final result. Chart 8Polling Shows A Tightening Race
Trump’s Illness Alone Not A Game Changer
Trump’s Illness Alone Not A Game Changer
Chart 9Debates Do Not Predict Election Outcomes
Trump’s Illness Alone Not A Game Changer
Trump’s Illness Alone Not A Game Changer
Bottom Line: The rapid economic recovery is the critical reason that the Republican Party’s odds of winning the election have shot up to 49% in our quantitative model. Whether sentiment continues to recover depends on stimulus. We have not yet upgraded our subjective odds of President Trump’s election (35%) due to the fiscal fiasco in Congress. Insofar as Republican Senators move faster to get a fiscal deal, the economic recovery will continue and we will upgrade GOP odds of winning the White House and Senate. While Trump may receive a sympathy bounce for his illness, it will be fleeting, so the economy is the key factor. However, if Trump fails to recover, then the Republican Party as a whole will receive a sympathy boost, at least according to past precedent. Pence could lead the party to victory if the economy and markets do not collapse. US equities will outperform global if Republicans retain the White House and Senate, especially if they do so without compromising on a fiscal deal. The dollar would see a counter-trend rally. Investment Takeaways Global equities will outperform American equities if Democrats win the election (Diagram 1). If they win the Senate, however, tax hikes will have to be discounted which introduces short-term downside, particularly for US equities. Diagram 1Scenarios For US Election Outcomes And Market Impacts
Trump’s Illness Alone Not A Game Changer
Trump’s Illness Alone Not A Game Changer
Global policy uncertainty will fall if Trump is defeated or if Pence replaces him. US polarization will fall if the election results are decisive either way. Falling uncertainty and polarization will accelerate the US dollar’s decline and favor global equities and commodities. Government bonds will remain well bid during the volatile short term but will sell off once stimulus is passed and the global economic recovery advances, particularly if the result is a Democratic sweep. Matt Gertken Vice President Geopolitical Strategist mattg@bcaresearch.com Appendix Appendix Table 1Calendar Of US Election 2020
Trump’s Illness Alone Not A Game Changer
Trump’s Illness Alone Not A Game Changer
APPENDIX TABLE 2US Line Of Succession If Presidency Vacant
Trump’s Illness Alone Not A Game Changer
Trump’s Illness Alone Not A Game Changer
Footnotes
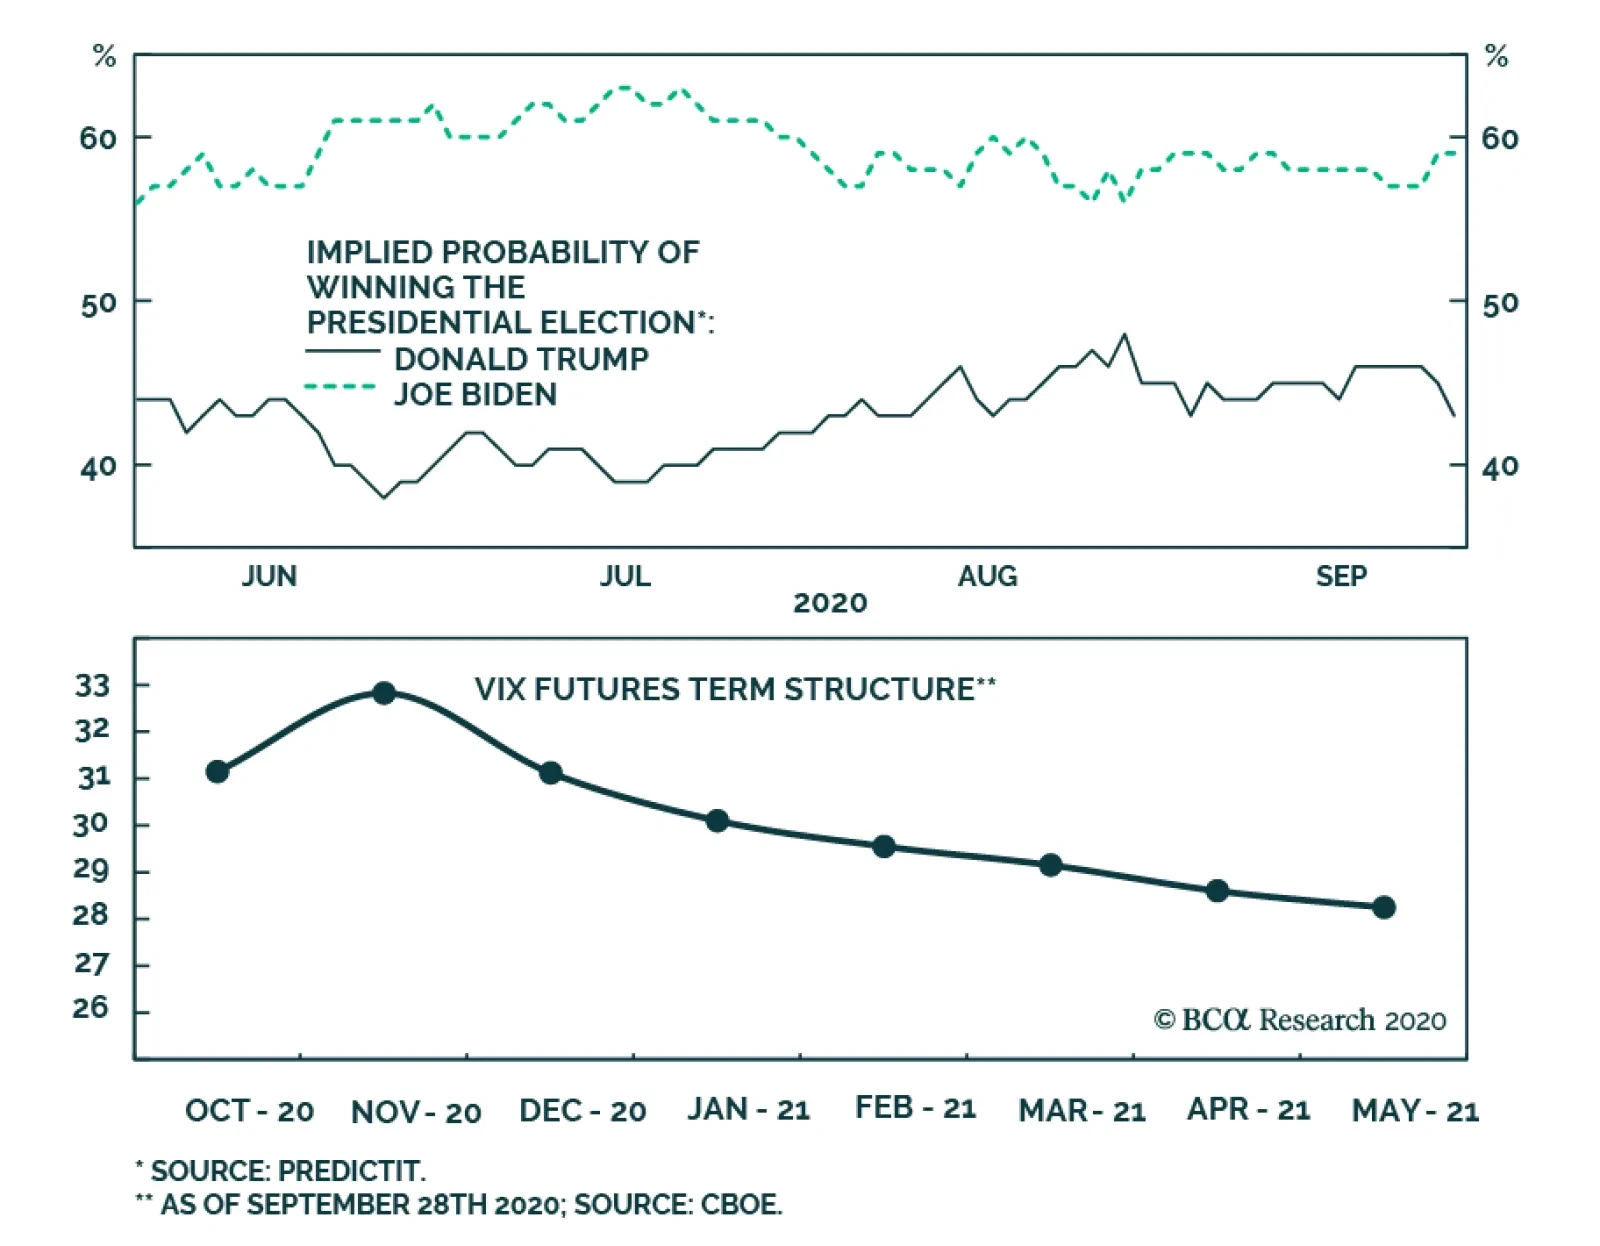
According to BCA Research's Global Asset Allocation, investors should put on some hedges against a tricky two months. Vix futures are pricing in elevated risks in November but not yet through December. It’s only a month away, but over the next four weeks,…
At first glimpse, the ISM Manufacturing release was slightly disappointing. The headline number declined from 56 to 55.4 when it was expected to rise to 56.5. Moreover, the New Orders component fell to 60.2 from 67.6 while expectations stood at 65.2. …
In recent weeks, we have repeatedly warned that since March, the dollar had fallen too quickly and risked staging a countertrend bounce. As a corollary, the euro was expected to undergo a temporary correction that could see it revisit the 1.14-1.15 zone. …
Fiscal stimulus has been dominating the news flow of late. This is not surprising as COVID-19 affected consumers and businesses alike are running on empty. The Citi economic surprise index took off when the IRS started making direct payments to households in mid-April and leveled off toward the end of July when the stimulus money coffers ran dry. What is surprising, is haggling for roughly one trillion of stimulus dollars that separates Democrats from Republicans. If Congress fails to pass a new fiscal package by October 16 the latest, now that the Ruth Bader Ginsburg SCOTUS replacement seems to have become the number one priority, we doubt a fiscal package can pass during a contested election. Thus, realistically a fresh stimulus bill is likely only after the new president’s inauguration. Under such a backdrop, the economy will suffer a relapse, and stocks another drawdown. Bottom Line: We continue recommend investors remain patient and not deploy fresh capital just yet. For more details, please refer to this Monday’s Weekly Report.
Show Me The Money
Show Me The Money