United States
Tuesday night, the first of three debates ahead of the US presidential election took place and was far from presidential. Biden performed better than expected and was deemed by various polls to have won the night. Beyond the question of whether or not these…
The final release of Q2 GDP numbers marginally revised up the quarterly annualized growth rate to -31.4% from -31.7% as personal consumption growth was revised to -33.2% from -34.1%. It is fair to say that it remains a dismal number, unlikely to be…

Overweight We have been offside on the S&P industrials sector, but now is not the time to throw in the towel. In contrast we are doubling down on our overweight stance as the ongoing rotation should see some tech sector outflows find their way to under-owned capital goods producers. Over in the currency market, the recent debasing of the US dollar should underpin industrials stocks via the export relief valve (third panel). A depreciating greenback also lifts the commodity complex and hence industrials equities that are levered to the extraction of commodities and other derivative activities (top panel). Historically, an appreciating USD has been synonymous with a multiple contraction phase and vice versa. Looking ahead, the industrials sector relative 12-month forward P/E multiple should continue to expand smartly (bottom panel). Bottom Line: We continue to recommend an above benchmark allocation in the S&P industrials sector. For more details, please refer to this Monday’s Weekly Report. Chart 1
Industrials - Powering Ahead
Industrials - Powering Ahead
Highlights The first presidential debate does not change our subjective judgment on Trump’s odds of victory (35%), but our quantitative election model is flagging a major risk to this view. The V-shaped economic recovery is greatly improving Trump’s odds in key swing states – including Michigan – according to our model. We will upgrade Trump’s chances if the Republicans agree to a fiscal bill that removes the risk of further financial turmoil in the final month of the campaign. A stock market selloff combined with rising COVID-19 cases is a deadly combination for a president whose re-election bid is on thin ice. The best outcome for financial markets is a stimulus deal now, a Biden victory, and a Republican Senate. The worst outcome is no stimulus and a Democratic sweep, but there would be a silver lining in the form of major fiscal expansion in 2021. Feature The shouting match, er, debate between President Trump and former Vice President Joe Biden probably did not change many voters’ minds. Trump started stronger, Biden finished stronger. The key takeaway is that Biden lived to fight another day. At 77 years old, Biden’s age has been a concern, but he did not appear incoherent like he did in the Democratic primary election.1 From a market perspective, the debate revealed the following: The Republican failure to pass a new fiscal relief bill is hurting their re-election bid, as Biden successfully criticized Trump for not providing new resources amid the national crisis. The next 24-48 hours are critical on our view that the Senate GOP will capitulate to a deal. Joe Biden will raise taxes regardless of the recession. There is speculation that Democrats might delay tax hikes to aid the recovery but Biden did not give reason for optimism. China faces pressure from both parties. Trump blames China for the pandemic and recession while Biden hammered Trump for being weak on China. Biden is trying to steal back the thunder on manufacturing and he emphasized on-shoring more than Trump. Decoupling from China will continue regardless of the election outcome. Table 1Recessions Weigh On Incumbent Win Rates
A Big Risk To A Democratic Sweep
A Big Risk To A Democratic Sweep
We have given Trump a 35% chance of winning since March, based on the historical odds of an incumbent party winning when a recession occurs in the year of the election. However, the economic recovery now poses a clear risk to this view. First, the historical odds rise to 50/50 if the recession ends before the election (Table 1). Second, our quantitative election model now gives Trump a 49% chance of victory, discussed below. Subjectively, we are keeping Trump at 35% because a failure to pass fiscal relief will cause a stock market selloff and remove the last leg of Trump’s re-election bid. But we will upgrade Trump if there is a relief bill and his polling gains momentum. Quant Model Upgrades Trump To 49% Odds Of Victory Our quantitative election model is upgrading Trump’s odds, having taken in the just-released Philly Fed’s coincident economic index for the month of August (Chart 1). The US economy continues to recover, and the more the data improve, the better Trump’s odds of winning the election. Chart 1Quant Model Signals Trump At 49% Odds, Michigan A Toss-Up
A Big Risk To A Democratic Sweep
A Big Risk To A Democratic Sweep
Our quant model consists of (1) state-by-state economic indexes (2) a “time for change” variable that rewards the incumbent party after a four-year term but penalizes it after an eight-year term in the White House (3) the president’s margins of victory in the previous election (3) the range of Trump’s approval rating (rather than the level, thus avoiding any concerns about polling understating Trump’s support). Our model now predicts that Trump will win 259 Electoral College votes, an increase of 29 votes from our August update by flipping Florida back into the Republican camp with a ~60% probability. Thus Trump’s probability of winning the election has risen by 4ppt to 49%. Remarkably Michigan has risen into the ranks of a toss-up state, with a 49.6% chance of a Republican win. The coincident indicators in this state have improved drastically over the past three months and our model uses a three-month rate of change (Chart 2). Our model also gives greater weight to these indicators the closer we get to the election. In discussions with many clients we have observed that the model seemed to be underrating the key upper Midwestern battlegrounds, but now that is changing. The odds that Trump could win New Hampshire and Nevada have also improved substantially, to 41% and 25% respectively. Chart 2State Economic Indicators Put MI, NH, NV Into Play?
A Big Risk To A Democratic Sweep
A Big Risk To A Democratic Sweep
Chart 3Swing State Wages Turning Up
Swing State Wages Turning Up
Swing State Wages Turning Up
Still, as it stands, Democrats are still expected to win Michigan, as well as Pennsylvania and Wisconsin, thus pulling off a narrow victory in the Electoral College. Chart 4Median Family Income Improved
Median Family Income Improved
Median Family Income Improved
However, the trend is in Trump’s favor. Barring very bad economic news in September, the model’s final reading on October 23 may even favor Trump for re-election. The state economic indicators are supported by additional factors: The V-shape recovery is pronounced in workers’ wages, including swing states that voted for Trump (Chart 3). Median family income is still growing – and slightly faster than when Trump took office (Chart 4). Thus it is clear that the economic recovery is a growing risk to our view that Biden will win in a Democratic clean sweep of US government. Trump Faces Imminent Risks From Pandemic And Recession In the debate, Trump successfully deflected criticisms of his handling of the economy and pinned the blame for the coronavirus on China. But a worsening of either of these factors would spell his doom in the final month of the campaign. Trump’s approval rating is still weak, though a sharp improvement would put him on the trajectory that won Presidents Bush and Obama re-election (Chart 5). Chart 5Trump Approval Rating Recovering
A Big Risk To A Democratic Sweep
A Big Risk To A Democratic Sweep
Chart 6Trump Looks Better In Swing State Polling
A Big Risk To A Democratic Sweep
A Big Risk To A Democratic Sweep
Biden’s lead in head-to-head polling in the swing states is stable over the course of the year so far, though Trump has recently improved and is close to or within the typical margin of error for these polls. Chart 7Trump Must Beware Whiplash From Pandemic And Recession
A Big Risk To A Democratic Sweep
A Big Risk To A Democratic Sweep
What should prove decisive in the final month is the trajectory of the pandemic and the economy. Trump’s approval on the economy is just barely above 50%, but his handling of COVID-19 has relapsed (Chart 7). The pandemic will bring bad news over the coming month, but it is not clear how bad. New daily cases of COVID-19 are rising in the US as a whole and in key swing states like Wisconsin, Arizona, and Pennsylvania. It makes sense to see cases springing up in states that are improving rapidly in economic terms, including these states and Nevada and New Hampshire (Charts 8A & 8B). As deaths increase, bad news will affect consumers’ behavior and sentiment. Chart 8ACOVID-19 Uptick A Major Risk To Trump
A Big Risk To A Democratic Sweep
A Big Risk To A Democratic Sweep
Chart 8BCOVID-19 Uptick A Major Risk To Trump
A Big Risk To A Democratic Sweep
A Big Risk To A Democratic Sweep
New fiscal relief would sustain the economy even if social distancing and government restrictions increase in October to fend off this third wave in infections. Meanwhile the absence of fiscal relief will weigh on Trump’s fragile approval on the economy. Voters have consistently punished both the president and the Congress for brinksmanship over fiscal deadlines (Charts 9A & 9B). Chart 9AVoters Give Thumbs Down For Fiscal Dysfunction
A Big Risk To A Democratic Sweep
A Big Risk To A Democratic Sweep
Chart 9BVoters Give Thumbs Down For Fiscal Dysfunction
A Big Risk To A Democratic Sweep
A Big Risk To A Democratic Sweep
Markets also sell off when policymakers threaten to take the US over a fiscal cliff (Charts 10A & 10B). So far this is also the case in September 2020, though the jury is out. Chart 10AMarkets Sell Off During Fiscal Cliffs
Markets Sell Off During Fiscal Cliffs
Markets Sell Off During Fiscal Cliffs
Chart 10BMarkets Sell Off During Fiscal Cliffs
A Big Risk To A Democratic Sweep
A Big Risk To A Democratic Sweep
Can President Trump Stimulate By Executive Order? The president has few unilateral alternatives to a congressional fiscal bill. Chart 11Unilateral Stimulus Will Not Save Markets
Unilateral Stimulus Will Not Save Markets
Unilateral Stimulus Will Not Save Markets
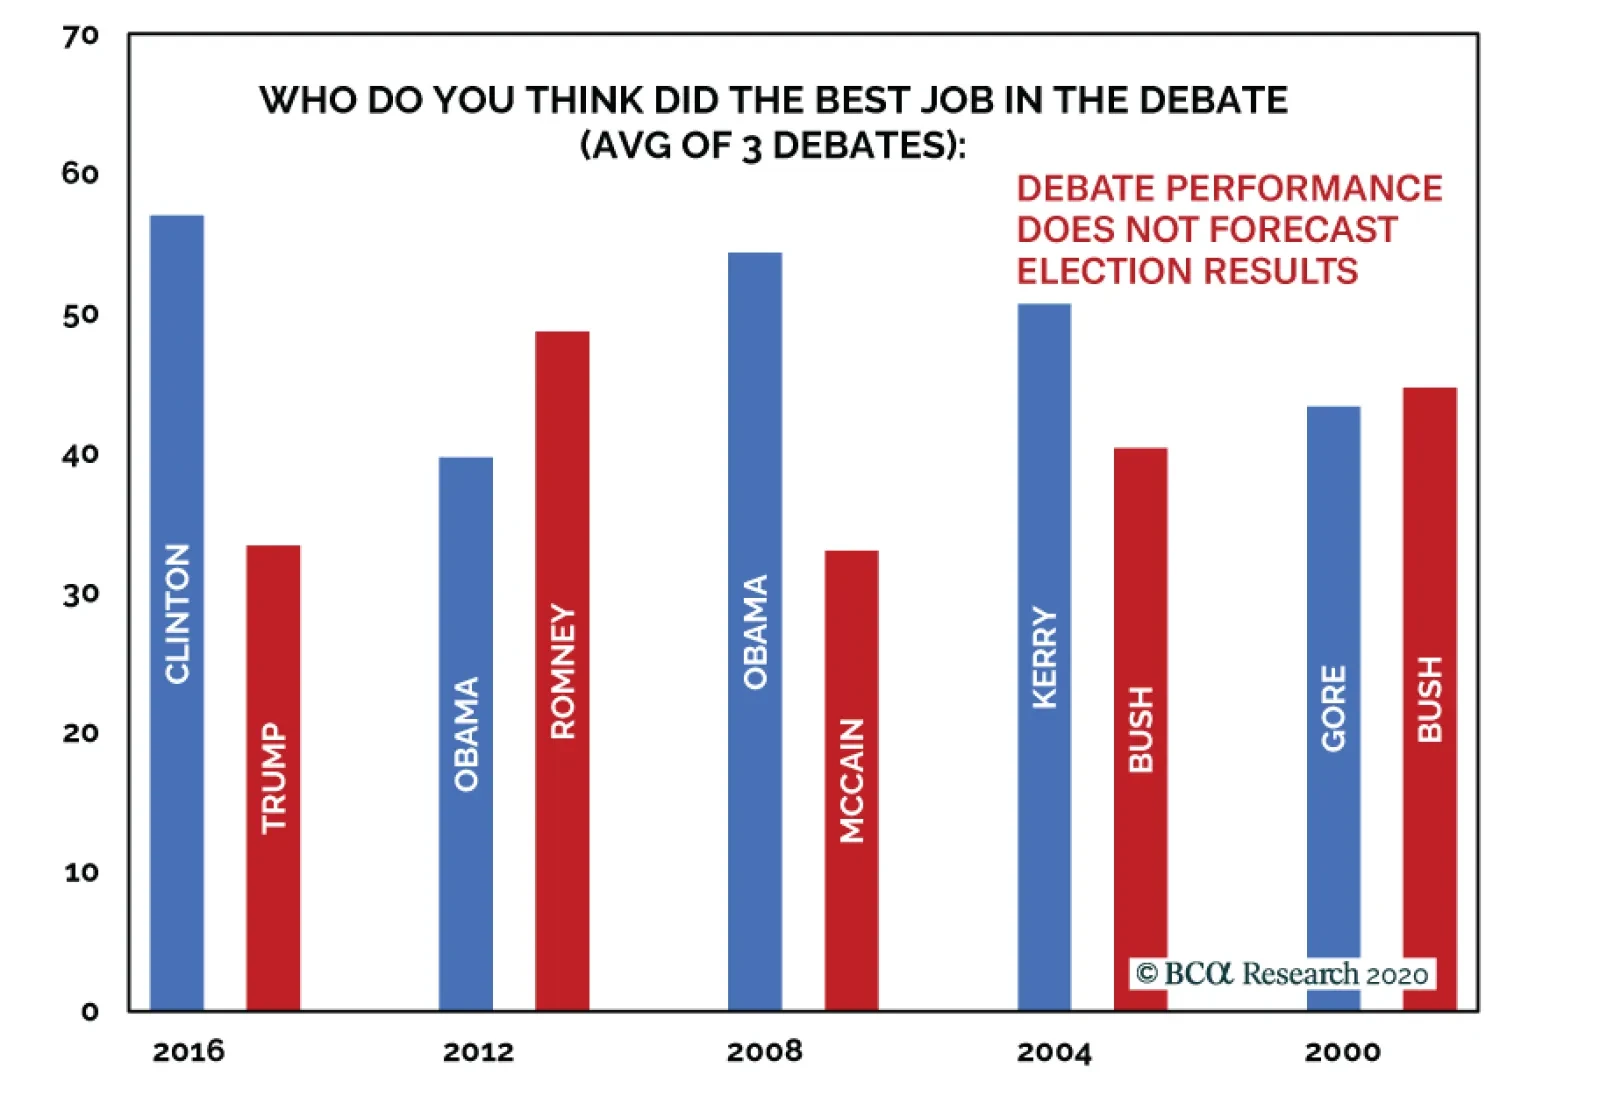
Several clients have asked about the Treasury’s general account, which currently holds over $1.5 trillion in cash (Chart 11). The Treasury issued lots of bonds and temporarily over-prepared for what is necessary to finance the US’s surging deficits, as the economic recovery has seen better-than-expected revenues. Our US bond strategist addressed this issue in a recent report entitled “The Case Against The Money Supply.” Could Trump unilaterally re-purpose these funds as economic stimulus if Congress fails to agree on a fiscal bill? We would not put it past the president to try – he is already stimulating by decree – but the courts would issue injunctions since the House has the constitutional power of the purse. In the meantime it would be difficult to implement the president’s orders, as with recent executive orders on extending unemployment insurance and deferring the payroll tax. Uncertainty over the US’s fiscal future would increase, not decrease, due to the legal dispute and the simultaneous risk that Republicans who had proved fiscally hawkish would retain the Senate after November 3. Therefore raiding the Treasury account is not a viable solution for markets in the absence of a real stimulus deal. And while voters might approve of the president’s actions in the face of a do-nothing Congress, the market’s negative response would damage sentiment and Trump’s approval on the economy. Investment Takeaways Our subjective reason not to upgrade Trump’s odds from 35% stems from the relationship of politics and financial markets. We have a high conviction view that the equity market will sell off if Republicans fail to conclude a fiscal deal. Financial turmoil in October will undermine recent improvements in the economy, economic sentiment, and opinion polls, as it will undermine Trump’s approval on handling the economy. The rise in COVID-19 cases reinforces the downside risk to markets, especially in the absence of stimulus. We will upgrade Trump’s odds of victory if this contradiction is resolved either through new fiscal relief or through something that improves sentiment on the pandemic, such as a credible vaccine announcement. It is hard to see Trump’s odds improving otherwise. An upgrade of Trump’s odds will increase the substantial risk of a contested election. Volatility will persist through November, with potential to expand into December and possibly even January. However we have a high conviction view that volatility will collapse by the end of January. Election scenarios would then look like this: If no fiscal relief passes, and markets sell prior to the election, then a Democratic clean sweep becomes more likely and will galvanize a move up for risk assets, as investors will look to major fiscal expansion in 2021 and beyond. But if Republicans retain the Senate in this scenario, then the need for a market riot for each future dose of stimulus will unnerve investors and the selloff will be prolonged. However, if fiscal stimulus passes prior to the election as we expect, then markets will view a Democratic sweep as an initial negative due to tax hikes and re-regulation. The prospect of fiscal expansion will only gradually become a positive factor. Thus the post-election adjustment will be short-lived. Global and cyclical equities will outperform. If stimulus passes pre-election, yet Republicans retain the Senate under a President Biden, fear of fiscal obstruction will be postponed, the prospect of tax hikes will collapse, and trade war risk will be at least somewhat reduced (Biden will be soft on global trade ex-China). This is the best outcome for risk assets, especially global equities and cyclical sectors. If stimulus passes, and Trump and the Republicans retain power, any relief rally will be short-lived as the prospect of a global trade war will loom. US equities will continue outperforming global. We are booking a small 5.7% profit on our long French energy / short US energy trade due to the risk of a Trump comeback, which would help the US energy sector. Dollar strength on near-term uncertainty will also be a headwind for this trade until the US election is resolved. Matt Gertken Vice President Geopolitical Strategy mattg@bcaresearch.com Guy Russell Research Analyst GuyR@bcaresearch.com Footnotes 1 Post-debate polling by CNN suggests that Biden beat expectations, performed better than Trump, and increased in voter favorability, while Trump underperformed Biden and expectations and shed favorability. However, post-debate polls tend to overrepresent Democratic-leaning voters and have not predicted past presidential election results. (Post-debate polls over the course of three debates would have predicted a Clinton win in 2016, a Romney win in 2012, and a Kerry win in 2004.)
BCA Research's US Bond Strategy service ponders whether it is possible for the default rate to fall to 5% during the next 12 months. Historically, the default rate tends to fall very quickly when the economy is coming out of recession and, already, August…
BCA Research is positive on equities on a cyclical basis. However, the easiest part of the rally is behind us and while stocks will climb over the next 12 to 18 months, violent episodes of correction will punctuate this rise. Since yields have little downside…
US consumer sentiment keeps improving. Despite elevated infection rates, US Consumer Confidence from the Conference Board rose to 101.8 from 86.3 in September. Not only was this the biggest increase in consumer sentiment in more than 17 years, it handily beat…
In this Monday’s Weekly Report we reiterated our overweight stance in the S&P machinery index owing to a healthy macro backdrop. Starting from overseas, China is providing a large enough stimulus, which is on a par with the early-2016 numbers. On the currency front, the US dollar has entered a bear market, and we expect it to resume once the recent election uncertainty retracement phase fully plays out. The weakening US dollar is a material tailwind for machinery stocks as they derive a significant portion of their revenues from abroad. Domestically, manufacturing surveys are in a V-shaped recovery across the board which will further underpin the machinery stock rally. All of these dynamics are well filtered through our macro sales and earnings models that emit a positive signal (see chart). Bottom Line: Stay overweight the S&P machinery index. The ticker symbols for the stocks in this index are: BLBG S5MACH– CAT, DE, PH, ITW, IR, CMI, PCAR, FTV, OTIS, SWK, DOV, XYL, WAB, IEX, SNA, PNR, FLS.
Buy The Machinery Breakout
Buy The Machinery Breakout
Highlights Near-Term Uncertainties: Investors have grown a bit more nervous in recent weeks, amid signs of a second wave of the coronavirus in Europe and with the contentious US presidential election only five weeks away. The pro-growth cyclical investment backdrop, however, remains unchanged. From a strategic perspective (6-12 months), maintain an overall neutral stance on interest rate duration, with a moderate overweight to global spread product versus government bonds while staying up in quality. EM USD-Denominated Debt: The main drivers of the emerging market hard currency debt rally since March – a weakening US dollar, improving global growth momentum, and massively accommodative global monetary policies – remain in place. Valuations, however, appear more attractive for EM USD-denominated corporates relative to USD-denominated sovereigns. Favor the former over the latter, within an overall neutral strategic allocation to EM hard currency debt. Feature Chart of the WeekMarkets Starting To Get Cautious
Markets Starting To Get Cautious
Markets Starting To Get Cautious
As the third quarter of 2020 draws to a close, investors have developed a slight case of the jitters about the near-term outlook for global financial markets. The positives that drove risk assets higher during the spring and summer - rebounding global economic activity, fueled by aggressive policy stimulus and a slowing of the spread of COVID-19, along with a weaker US dollar – have given way to some fresh uncertainties. Economic data releases have started to disappoint versus expectations, the rapid expansion of central bank balance sheets in the major developed economies has temporarily stalled, a second wave of new COVID-19 cases appears to have started in Europe and the US, and the US dollar has strengthened by 2.7% from the 2020 lows (Chart of the Week). Risk assets have pulled back in response, with the MSCI World equity index down -6.1% from the 2020 peak and US high-yield corporate credit spreads 66bps wider from recent lows. So far, these moves appear more a correction of overbought markets, rather than a change in trend. From the perspective of our strategic (6-12 months) investment recommendations, we remain generally positive on risk assets. Within global fixed income, that means maintaining a modest overall overweight stance on spread products versus government bonds, while focusing more on relative opportunities between countries and sectors to generate alpha. A Quick Assessment Of The Cyclical Backdrop The recent in increase in market volatility has started to shake out crowded positioning in popular winning trades. For example, high-flying US tech stocks have seen deeper pullbacks than the overall US equity market, while investors yanked nearly $5 billion from US junk bond funds in the week ending last Wednesday according to the Financial Times – the highest such outflow since the apex of the COVID-19 market rout in mid-March. We prefer to judge the health of a market rally by assessing the state of macroeconomic fundamentals underpinning that particular asset class Mainstream financial pundits often dub such corrections of overheated markets as a “healthy” way to ensure the continuation of medium-term bullish trends. We prefer to judge the health of a market rally by assessing the state of macroeconomic fundamentals underpinning that particular asset class – the most important of which remain positive for risk assets, in general, and global fixed income spread products, in particular. Economic Data Chart 2Economic Data Is Mostly Optimistic
Economic Data Is Mostly Optimistic
Economic Data Is Mostly Optimistic
While data surprise indices like the widely followed Citigroup series are topping out, this is more because of an improvement in beaten-up growth expectations, rather than a sharp decline in the actual data. The global ZEW economic expectations survey continues to point in an optimistic direction, while other reliable measures of business confidence like the German IFO and the US NFIB small business surveys have also continued to improve in recent months. Our own global leading economic indicator (LEI) is firming, with a majority of countries seeing a rising LEI (Chart 2). At the same time, the preliminary release of manufacturing PMI data for September showed continued improvements in the US and Europe. While the news is not 100% upbeat – the services PMI for the overall euro area fell -2.9 points in September, possibly due to the increase in new reported cases of COVID-19 in Europe – the tone of global economic data remains consistent with improving cyclical momentum. The US Dollar Chart 3Growth And Yield Differentials Signalling Dollar Weakness
Growth And Yield Differentials Signalling Dollar Weakness
Growth And Yield Differentials Signalling Dollar Weakness
The most likely medium-term path of least resistance for the US dollar remains downward. Economic growth remains stronger outside the US, based on the differential between the US and non-US manufacturing PMI data – an indicator that our currency strategists follow closely given its strong correlation to US dollar momentum (Chart 3). Relative interest rate differentials also remain less positive for the US dollar, with the decline in real US bond yields seen in 2020 pointing to additional medium-term dollar depreciation (bottom panel). US Politics The US general election is now only 35 days away, with the latest polling data showing President Trump closing the lead on the Democratic Party candidate, Joe Biden. Our colleagues at BCA Research Geopolitical Strategy remain of the view that a Biden victory is the more probable outcome, given the more difficult time Trump will have in winning all the key swing states that gave him his narrow election victory in 2016. Chart 4A "Blue Sweep" Is Bearish For Markets
A "Blue Sweep" Is Bearish For Markets
A "Blue Sweep" Is Bearish For Markets
The recent peak in US equity markets, and trough in the VIX index, coincided with improving odds of a Democratic Party sweep of the White House, House of Representatives and Senate (Chart 4). Such an outcome would give a President Biden the power, and perceived mandate, to implement many of the more progressive elements of the Democratic Party agenda – including a hike in corporate tax rates that could damage equity market sentiment. Our political strategists think that a “Blue Sweep” would only occur if the Republican Party fails to agree with the Democrats on a new fiscal stimulus bill.1 Both sides are playing hardball in the current negotiations, which is keeping investors on edge given how much of the US economy still requires fiscal support because of the pandemic. The Republicans will not want to take the blame for a failure to reach a stimulus deal, which would likely hand the Democrats the keys to the White House and Congress. Thus, a fiscal deal of sufficient size to calm jittery markets – most likely in the $2-2.5 trillion range sought by the Democrats – should be announced within the next couple of weeks before the final run up to the election. Financial/Monetary Conditions It will take more than a corrective pullback in equity and credit markets to threaten the economic recovery from the COVID-19 recession, given how highly stimulative financial conditions have become since the spring (Chart 5). In more normal times, booming equity and credit markets would eventually lead to upward pressure on government bond yields, since all would be reflecting improving economic growth and, eventually, expectations of faster inflation and tighter monetary policy. That move higher in yields would eventually act to restrain growth and depress the value of growth-sensitive risk assets. Chart 5Financial Conditions Remain Supportive For Growth
Financial Conditions Remain Supportive For Growth
Financial Conditions Remain Supportive For Growth
As we discussed in last week’s report, government bond yields are now likely to stay very low for a period measured in years, with major central banks like the US Federal Reserve leaning dovishly to support growth during the pandemic and trigger a temporary overshoot of inflation expectations.2 Thus, loose monetary settings (including more quantitative easing) will remain a critical underpinning for keeping risk assets well supported, by eliminating the typical cyclical threat from rising bond yields. Summing it all up, the fundamental economic and political backdrop remains cyclically bullish for risk assets, despite recent investor nervousness. Of course, a major wild card could be that the latest surge in new COVID-19 cases becomes large enough to trigger renewed economic restrictions in the US or Europe. Yet any such moves would likely not be as severe as those that occurred back in the spring, given the much lower mortality rates seen during the current upturn in COVID-19 cases, which is reducing the public’s willingness to accept more economy-crushing lockdowns. Bottom Line: Investors have grown a bit more nervous in recent weeks, amid signs of a second wave of the coronavirus in Europe and with the contentious US presidential election only five weeks away. The pro-growth cyclical investment backdrop, however, remains unchanged. From a strategic perspective (6-12 months), maintain an overall neutral stance on interest rate duration, with a moderate overweight to global spread product versus government bonds while staying up in quality. EM USD-Denominated Credit: Focus On Corporates Relative To Sovereigns Chart 6An Overview of USD-Denominated EM Debt
An Overview of USD-Denominated EM Debt
An Overview of USD-Denominated EM Debt
Back in July of this year, we turned more positive on emerging market (EM) USD-denominated spread product, upgrading our recommended allocation to both EM USD sovereign and corporate debt to neutral from underweight in our model bond portfolio.3 The change was motivated by signs of rebounding global economic growth after the COVID-19 lockdowns and a loss of upward momentum in the US dollar, coming at a time when EM spreads still looked relatively cheap (wide) compared to developed market corporate debt. An underweight stance was inconsistent with that backdrop. EM credit has done well since our upgrade (Chart 6). Using Bloomberg Barclays index data, the yield on the EM USD-denominated sovereign index has fallen from 5.2% to 4.4%, while the option-adjusted spread (OAS) on that same index tightened from 447bps to 368bps. It has been a similar story for EM USD-denominated corporates, with the index yield falling from 4.1% to 3.9% and the index OAS narrowing from 361bps to 344bps.4 Given the close correlations typically exhibited between EM USD sovereign and corporate yields and spreads, we have tended to change our recommended allocations to both asset classes at the same time and in the same direction. Yet the EM credit universe is quite diverse, incorporating many different issuers of highly varying credit quality and risk (Table 1). Treating the allocations to EM USD sovereign debt and USD corporate debt separately may reveal more profitable relative return opportunities. The fundamental economic and political backdrop remains cyclically bullish for risk assets, despite recent investor nervousness. Table 1Details Of The USD-Denominated EM Sovereign And EM Corporate & Quasi-Sovereign Indices
Stay The Course
Stay The Course
A first step to analyzing the EM USD sovereigns versus corporates investment decision is to develop a list of macro factors that correlate to the relative performance of EM sovereign and corporate credit. From there, we can build a list of directional indicators that can help inform that sovereign versus corporates decision. Treating the allocations to EM USD sovereign debt and USD corporate debt separately may reveal more profitable relative return opportunities. Our colleagues at BCA Research Emerging Markets Strategy have long held the view that overall EM debt performance is mostly driven by just two important macro factors: industrial commodity prices and the US dollar. Specifically, they have shown that the broad cyclical swings in EM sovereign and corporate spreads correlate strongly to the price momentum of a simple blend of industrial metal and oil prices, as well as the price momentum of a basket of EM currencies versus the US dollar (Chart 7). Chart 7EM Credit Spreads: A Commodity And Currency Story
EM Credit Spreads: A Commodity And Currency Story
EM Credit Spreads: A Commodity And Currency Story
On that basis, the recent moderate widening of EM credit spreads is justified by the corrective pullback in industrial commodity prices and a bit of US dollar strength – trends that our EM strategists believe can continue in the near-term. Although they share our view that the medium-term trend in the US dollar is still bearish, thus any near-term EM debt selloff will represent a longer-term buying opportunity.5 The demand for industrial commodities remains largely driven by economic trends in the world’s largest commodity consumer, China. Thus, our China credit impulse (the change in overall Chinese credit relative to GDP), which leads Chinese economic activity, is a good leading indicator of industrial commodity prices. We will use the China credit impulse in our list of directional indicators to forecast EM sovereign versus corporate performance. We also will include the annual rate of change of the index of EM currencies versus the US dollar (shown in Chart 7). We also believe that a global monetary policy variable should be included in our indicator list, particularly in the current environment of super-low developed market interest rates and central bank purchase of government bonds – both of which tend to drive yield-starved investors into higher-yielding EM assets and, potentially, can influence the relative performance of EM sovereigns and corporates. To capture the global monetary policy trend in our indicator list, we use the combined annual growth rate of the balance sheets of the Fed, the ECB, the Bank of Japan and the Bank of England. The message from our indicator list is that EM USD corporates should outperform EM USD sovereign debt over the next 6-12 months. In Charts 8 & 9, we show the relative total return of the Bloomberg Barclays EM USD corporate and USD sovereign indices, expressed in year-over-year percentage terms, versus our list of three potential directional indicators of the relative total return. We have broken up the overall EM universe by broad credit quality, with index data used for investment grade issuers in Chart 8 and below investment grade (high-yield) issuers in Chart 9. For all three of our directional indicators, we have pushed them forward in the charts to look for a potential leading relationship to the relative returns. Chart 8EM Investment Grade Corporates Looking Set to Outperform ...
EM Investment Grade Corporates Looking Set to Outperform ...
EM Investment Grade Corporates Looking Set to Outperform ...
Chart 9... But The High Yield Space Tells A More Mixed Story
... But The High Yield Space Tells A More Mixed Story
... But The High Yield Space Tells A More Mixed Story
The charts show that China credit impulse leads the relative total returns of EM USD corporates versus EM USD sovereigns by between 9-18 months for investment grade and high-yield EM credit. The growth of the major central bank balance sheets also leads the relative performance of EM USD corporates versus EM USD sovereigns by one full year, both for investment grade and high-yield EM credit. Finally, the annual growth of EM currencies leads the relative return of EM USD corporates versus sovereigns by around nine months, although the correlation is the weakest of the three indicators in our list. In terms of current investment strategy, the message from our indicator list is that EM USD corporates should outperform EM USD sovereign debt over the next 6-12 months, both for investment grade and high-yield, largely due to aggressive credit stimulus in China and the rapid expansion of central bank balance sheets. In terms of the attractiveness of EM USD-denominated yields in a global fixed income portfolio, however, there is a difference between higher-rated and lower-rated EM debt. In Chart 10, we present a scatter chart that plots the yields on various global fixed income sectors, all hedged into US dollars and compared to trailing yield volatility, versus the average credit rating of each sector. Investment grade EM USD corporate and sovereign issuers offer relatively more attractive yields compared to other sectors with similar credit ratings, like investment grade corporates in the US and Europe. The same cannot be said for high-yield EM USD corporates and sovereigns, which only offer a more attractive volatility-adjusted yield compared to euro area high-yield corporates among the lower-rated global credit sectors. Chart 10EM USD-Denominated High Yield Debt Not Especially Attractive On A Risk-Adjusted Basis
Stay The Course
Stay The Course
Based on this analysis, we are making the following changes in our model bond portfolio on page 14: Upgrading EM USD corporates to overweight Downgrading EM USD sovereigns to underweight Keeping the combined EM USD credit allocation at neutral. This fits with our current overall investment theme of keeping overall spread product exposure relative close to benchmark, while taking more active risks on relative allocations between fixed income sectors. Bottom Line: The main drivers of the emerging market hard currency debt rally since March – a weakening US dollar, improving global growth momentum, and massively accommodative global monetary policies – remain in place. Valuations, however, appear more attractive for EM USD-denominated corporates relative to USD-denominated sovereigns. Favor the former over the latter, within an overall neutral strategic allocation to EM hard currency debt. Robert Robis, CFA Chief Fixed Income Strategist rrobis@bcaresearch.com Footnotes 1 Please see BCA Research Geopolitical Strategy Weekly Report, "Stimulus Will Come … But May Not Save Trump", dated September 25, 2020, available at gps.bcaresearch.com. 2 Please see BCA Research Global Fixed Income Strategy Weekly Report, "What Would It Take To Get Bond Yields To Rise Again?", dated September 23, 2020, available at gfis.bcaresearch.com. 3 Please see BCA Global Fixed Income Strategy Weekly Report, "GFIS Model Bond Portfolio Q2/2020 Performance Review & Current Allocations: Selective Optimism", dated July 14, 2020, available at gfis.bcaraesearch.com. 4 Note that the index data we are using here includes both EM corporate and so-called “quasi-sovereign” debt, the latter being bonds issued by EM companies that are majority-owned by their local governments. 5 Please see BCA Emerging Markets Strategy Weekly Report, "A Reset In The Making", dated September 24, 2020, available at ems.bcaresearch.com. Recommendations The GFIS Recommended Portfolio Vs. The Custom Benchmark Index
Stay The Course
Stay The Course
Duration Regional Allocation Spread Product Tactical Trades Yields & Returns Global Bond Yields Historical Returns
Highlights Treasuries: Bond yields held steady in September, even as the stock market sold off sharply. This leads us to conclude that long-maturity Treasury yields have room to fall in the near-term if progress towards a fiscal stimulus package moves too slowly. We continue to recommend keeping portfolio duration close to benchmark on a 6-12 month horizon. Corporates: Corporate spreads widened significantly in September, but they still embed a relatively optimistic default outlook. While corporate leverage has peaked, some labor market indicators have stalled. This makes us question whether defaults can improve enough to meet lofty market expectations. Continue to overweight investment grade corporates and Ba-rated junk on a 6-12 month horizon, while avoiding junk bonds rated B and lower. A Fed-Driven Sell-Off? Chart 1Treasuries A Poor Hedge In September
Treasuries A Poor Hedge In September
Treasuries A Poor Hedge In September
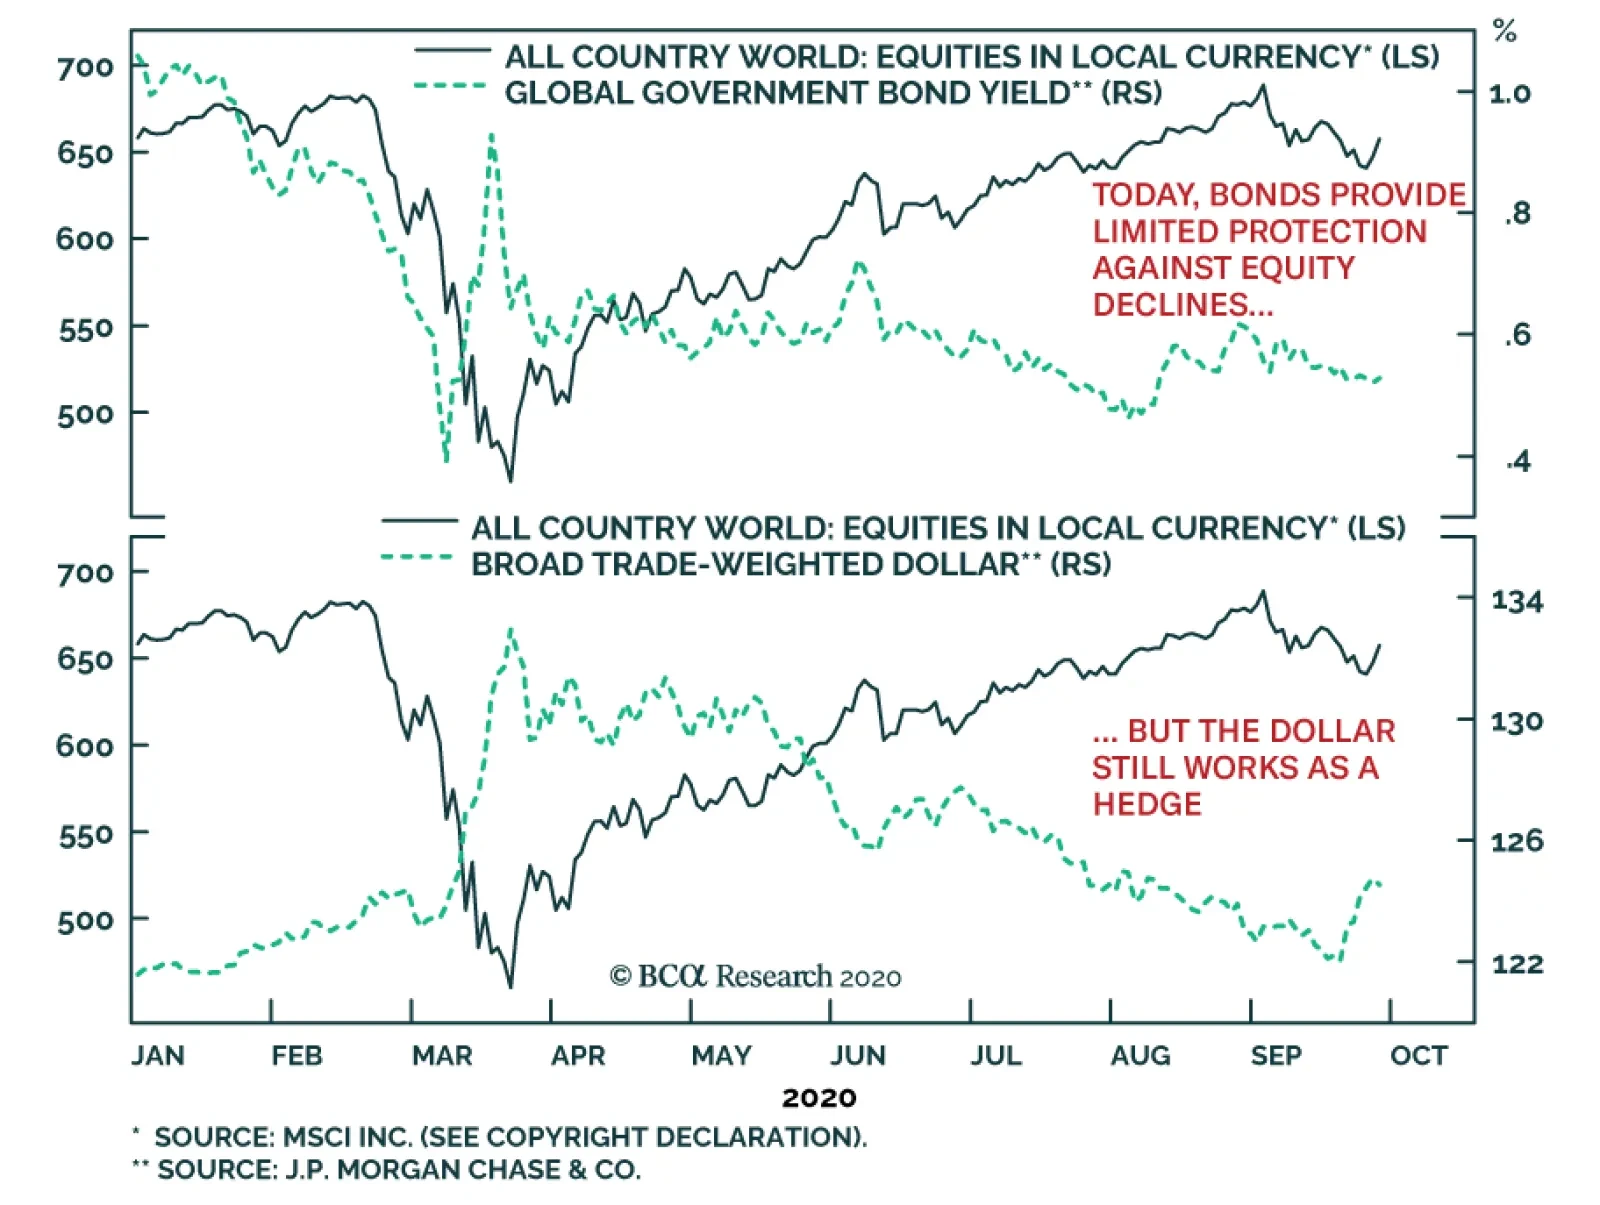
It might seem odd to think of this month’s market weakness as a reaction to an overly hawkish Fed. With the funds rate pinned at its effective lower bound and no rate hikes expected until 2024 (at least), monetary conditions have never been more accommodative. However, the relative performance of different asset classes in September leads us to only one conclusion. Financial markets had been priced for even more central bank dovishness this month, and came away disappointed. Equity Sectors Responded To Monetary Tightness, Not Weaker Growth First, consider the simple observation that risk assets (equities and credit) have sold off sharply since September 2nd but the Bloomberg Barclays Treasury Index actually underperformed a position in cash (Chart 1). Investors have seen none of the usual hedging benefits from bonds. Some of this can be chalked up to the relative performance of different equity sectors (Table 1). Tech stock underperformance was responsible for the bulk of September’s market weakness, particularly early in the month. Meanwhile, the most cyclical (or growth-sensitive) sectors – Industrials, Energy and Materials – performed only slightly worse than traditionally defensive sectors. Typically, cyclical sectors perform worst when the stock market is responding to a negative re-rating of economic growth expectations. The fact that cyclicals weren’t the worst performers this month suggests that the sell-off had a different catalyst. Table 1Equity & Treasury Returns: September 2nd To September 25th
Out Of Bullets
Out Of Bullets
The sector composition of the sell-off has important implications for bond yields because the relative performance between cyclical and defensive equity sectors explains more of the variation in the 10-year Treasury yield than the overall performance of the stock market (Chart 2). Chart 2Relative Sector Performance Matters For Bond Yields
Relative Sector Performance Matters For Bond Yields
Relative Sector Performance Matters For Bond Yields
Commodities Suggest A Hawkish Policy Surprise … Table 2Commodities & Bond Yields: September 2nd To September 25th
Out Of Bullets
Out Of Bullets
Second, consider the performance of industrial commodities and gold (Table 2). Growth-sensitive industrial commodities held up pretty well this month, but gold fared poorly. The relatively strong performance of industrial commodities suggests that markets were not pricing-in a significant shock to global growth expectations. Weakness in gold suggests that investors started to price-in less long-run inflation risk. This is the exact sort of performance you would expect if the central bank delivered an unexpected dose of monetary tightening. Along with the relative performance of equity sectors, the relative performance between industrial commodities and gold also helps explain why Treasury yields remained stable. The ratio between the CRB Raw Industrials Index and gold is tightly correlated with the 10-year Treasury yield (Chart 3). Chart 3Bond Yields Track The CRB/Gold Ratio
Bond Yields Track The CRB/Gold Ratio
Bond Yields Track The CRB/Gold Ratio
… As Do Inflation-Linked Bonds Third, we can look at relative movements in nominal yields, real yields and inflation breakevens. Recall that we like to think of nominal yields as being driven by fed funds rate expectations and of inflation breakevens as being driven by inflation expectations. Real yields have no independent driver, but can be calculated using the Fisher Equation:1 Real Yield = Nominal Yield – Inflation Expectations With that in mind, look at how yields have moved since the stock market’s September 2nd peak (Table 2). The 10-year TIPS breakevens rate is down sharply but the 10-year nominal yield is unchanged. This suggests that the market moved to price-in less long-run inflation risk alongside an unchanged path for the policy rate. The result of the interaction between those two drivers is a sharp move up in the 10-year real yield. Credit Performance Also Looks Policy Driven Table 3Corporate Bond Excess Returns*: September 2nd To September 25th
Out Of Bullets
Out Of Bullets
Finally, we can look at the relative performance of different corporate bond credit tiers (Table 3). In a typical risk-off market driven by greater pessimism about the outlook for economic growth, we would expect to see the bulk of underperformance concentrated in the lowest credit tiers where bonds are most likely to default. However, since September 2nd, Ba-rated issuers have underperformed all lower-rated credit tiers, even distressed Ca/C-rated issuers. One possible explanation is that Ba-rated and higher corporate bonds generally benefit from the Fed’s emergency lending facilities while B-rated and lower credits are mostly locked out. It could be that September’s market moves reflect some increased pessimism about the Fed’s ability or willingness to stick with its emergency facilities. Or more likely, there had been some hopes that the Fed would somehow expand its current emergency lending facilities. Hopes that were dashed when Chair Powell testified to Congress last week and seemed to suggest that the Fed has already done all it can in this regard. Investment Implications For us, this is the main takeaway from September’s strange market moves: Fed policy is certainly in no rush to tighten, but equally, the Fed can’t deliver any further easing on its own. All it can do is continue to support credit markets with its current emergency facilities and refrain from lifting rates even if inflation starts to rise. Those looking for an additional dose of economic adrenaline should look to fiscal policymakers, not the Fed. With regards to markets, since September’s moves don’t appear to reflect expectations for weaker economic growth, we fret that such a shock could still emerge. The most likely near-term catalyst would be the failure of Congress to pass a new stimulus package. We have previously written that consumer spending will not be able to sustain a decent growth rate without additional income support from Congress.2 If it looks like a deal is not forthcoming or we see some negative consumer spending data, there is room for cyclical equity sectors and bond yields to move lower. We view this as a material near-term risk. September’s junk bond weakness was unusual in that higher-rated credits performed worse than lower-rated ones. Beyond the near-term, on a 6-12 month horizon, we continue to believe that the economic recovery will continue. Congress will ultimately deliver sufficient stimulus, though it may not come in time to prevent a near-term market reaction. The conflict between these near-term and medium-term views leads us to maintain our cautious cyclical investment stance. We recommend keeping portfolio duration close to benchmark while holding duration-neutral yield curve steepeners that are designed to profit from higher yields on a 6-12 month horizon.3 More specifically, we advise medium- and long-run investors who are already exposed to curve steepeners to stay the course. But if you aren’t yet exposed, it is a good idea to wait until a follow-up stimulus bill is announced before moving in. An Update On Corporate Sector Health And The Default Rate As noted above, September’s junk bond weakness was unusual in that higher-rated credits performed worse than lower-rated ones. As with our Treasury call, the fact that markets appeared to react to a policy shock and not a growth shock makes us nervous that a near-term growth shock is still not in the price. We see low-rated junk bonds as looking particularly complacent, especially when you consider that spreads continue to embed a relatively optimistic default outlook. Calculating The Spread-Implied Default Rate Our workhorse valuation tool for junk bonds is the Default-Adjusted Spread. This is the average index option-adjusted spread less default losses observed over the subsequent 12-month period. For example, the Default-Adjusted Spread came in at -301 basis points for the 12-month period ending August 2020. This is equal to the August 2019 index spread of 393 bps less realized default losses of 694 bps that occurred between August 2019 and August 2020. Over time, we have found that the Default-Adjusted Spread does a good job of explaining excess junk returns and that, typically, a Default-Adjusted Spread of at least 150 bps is required for high-yield to outperform duration-matched Treasuries on a 12-month investment horizon (Chart 4).4 Chart 4Calculating The Spread-Implied Default Rate
Calculating The Spread-Implied Default Rate
Calculating The Spread-Implied Default Rate
With that knowledge, we can set a target Default-Adjusted Spread of 150 bps and calculate the default rate that would have to occur during the next 12 months to hit that target. We call this the Spread-Implied Default Rate, and it is presented in the bottom panel of Chart 4. As of today, the Spread-Implied Default Rate is 5.1%. This means that if the speculative grade default rate comes in below 5.1% during the next 12 months, then our Default-Adjusted Spread will be above 150 bps and junk bonds will likely outperform Treasuries. If the default rate turns out to be above 5.1%, then the prospects for junk bond outperformance look dimmer. Can The Default Rate Fall To 5%? The logical question then becomes whether it’s possible for the default rate to fall to 5% during the next 12 months. This would certainly be a rapid improvement from its current level of 8.7%, but not one that is without historical precedent. In fact, the default rate tends to fall very quickly when the economy is coming out of recession and, already, August saw only six default events. This is down from above 20 in May, June and July (Chart 5). Chart 5Only Six Defaults In August
Only Six Defaults In August
Only Six Defaults In August
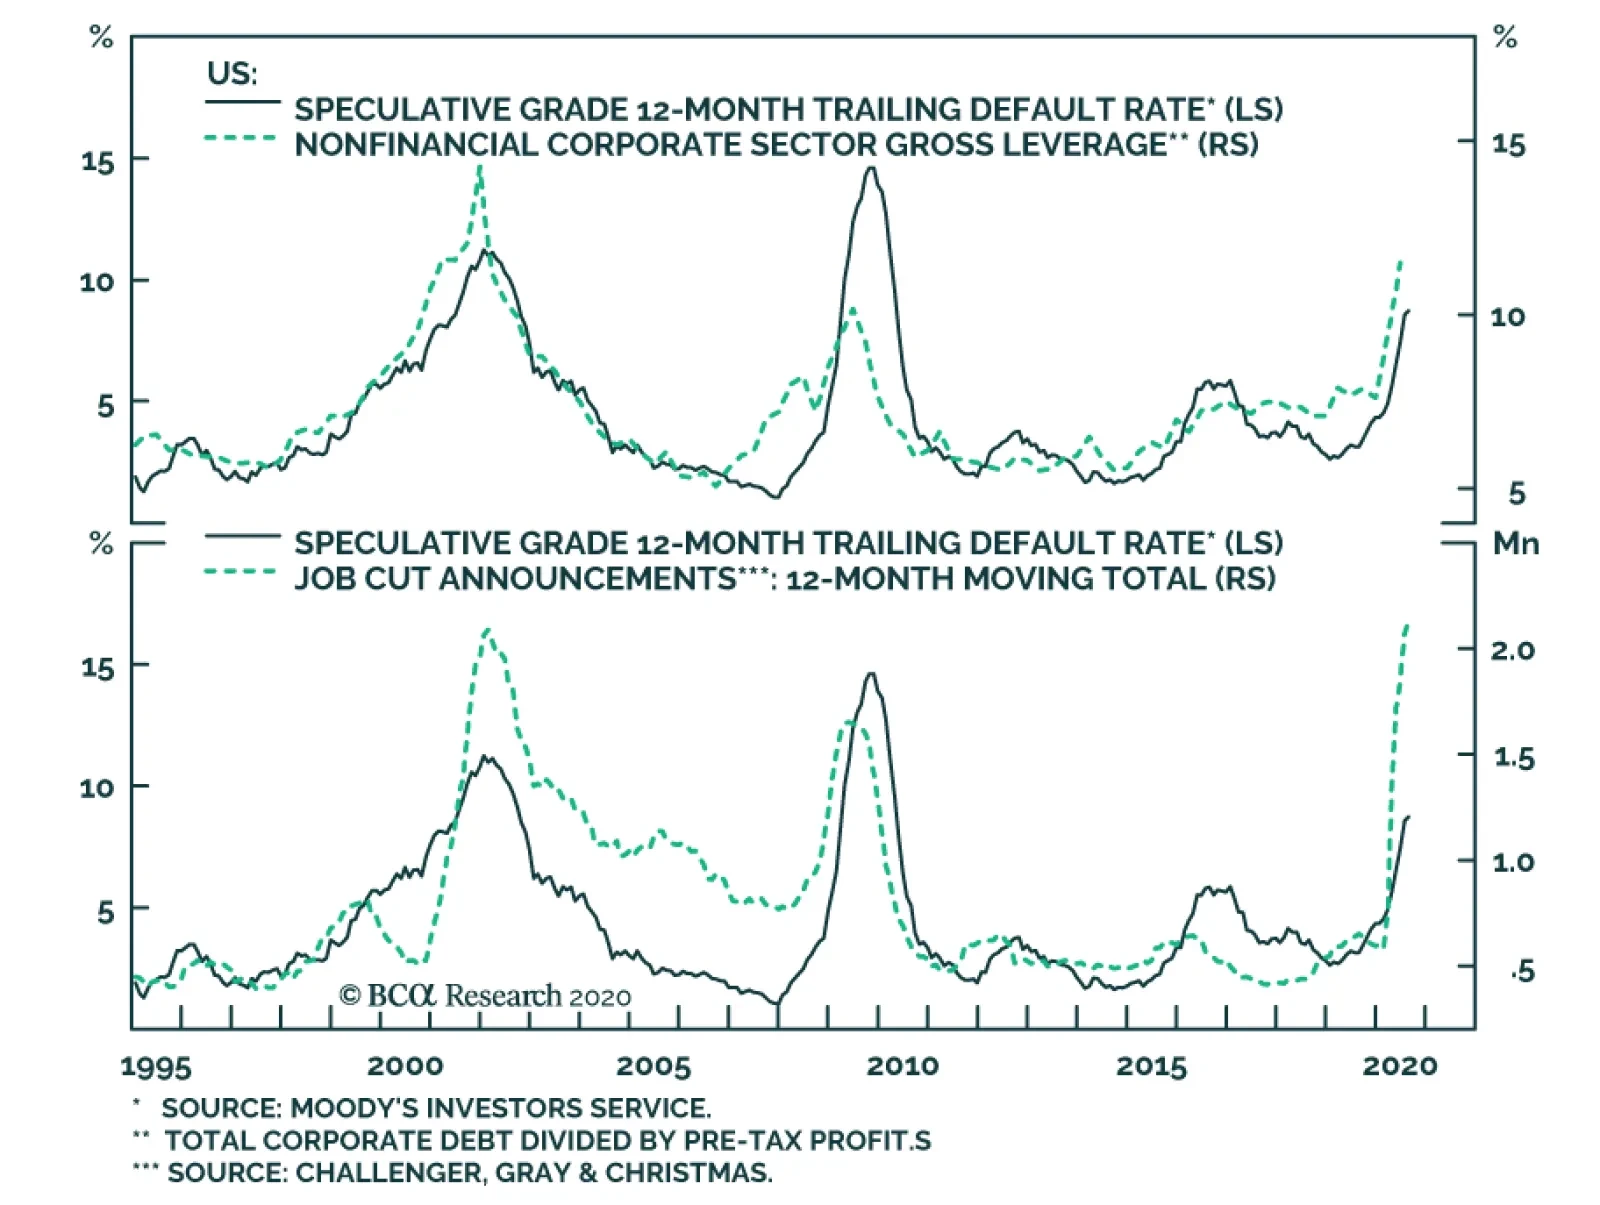
Obviously, whether August’s gains can be maintained depends on the speed of economic recovery. In particular, we focus on nonfinancial corporate sector gross leverage – the ratio between total debt and pre-tax profits – and job cut announcements (Chart 6). Chart 6Default Rate Drivers
Default Rate Drivers
Default Rate Drivers
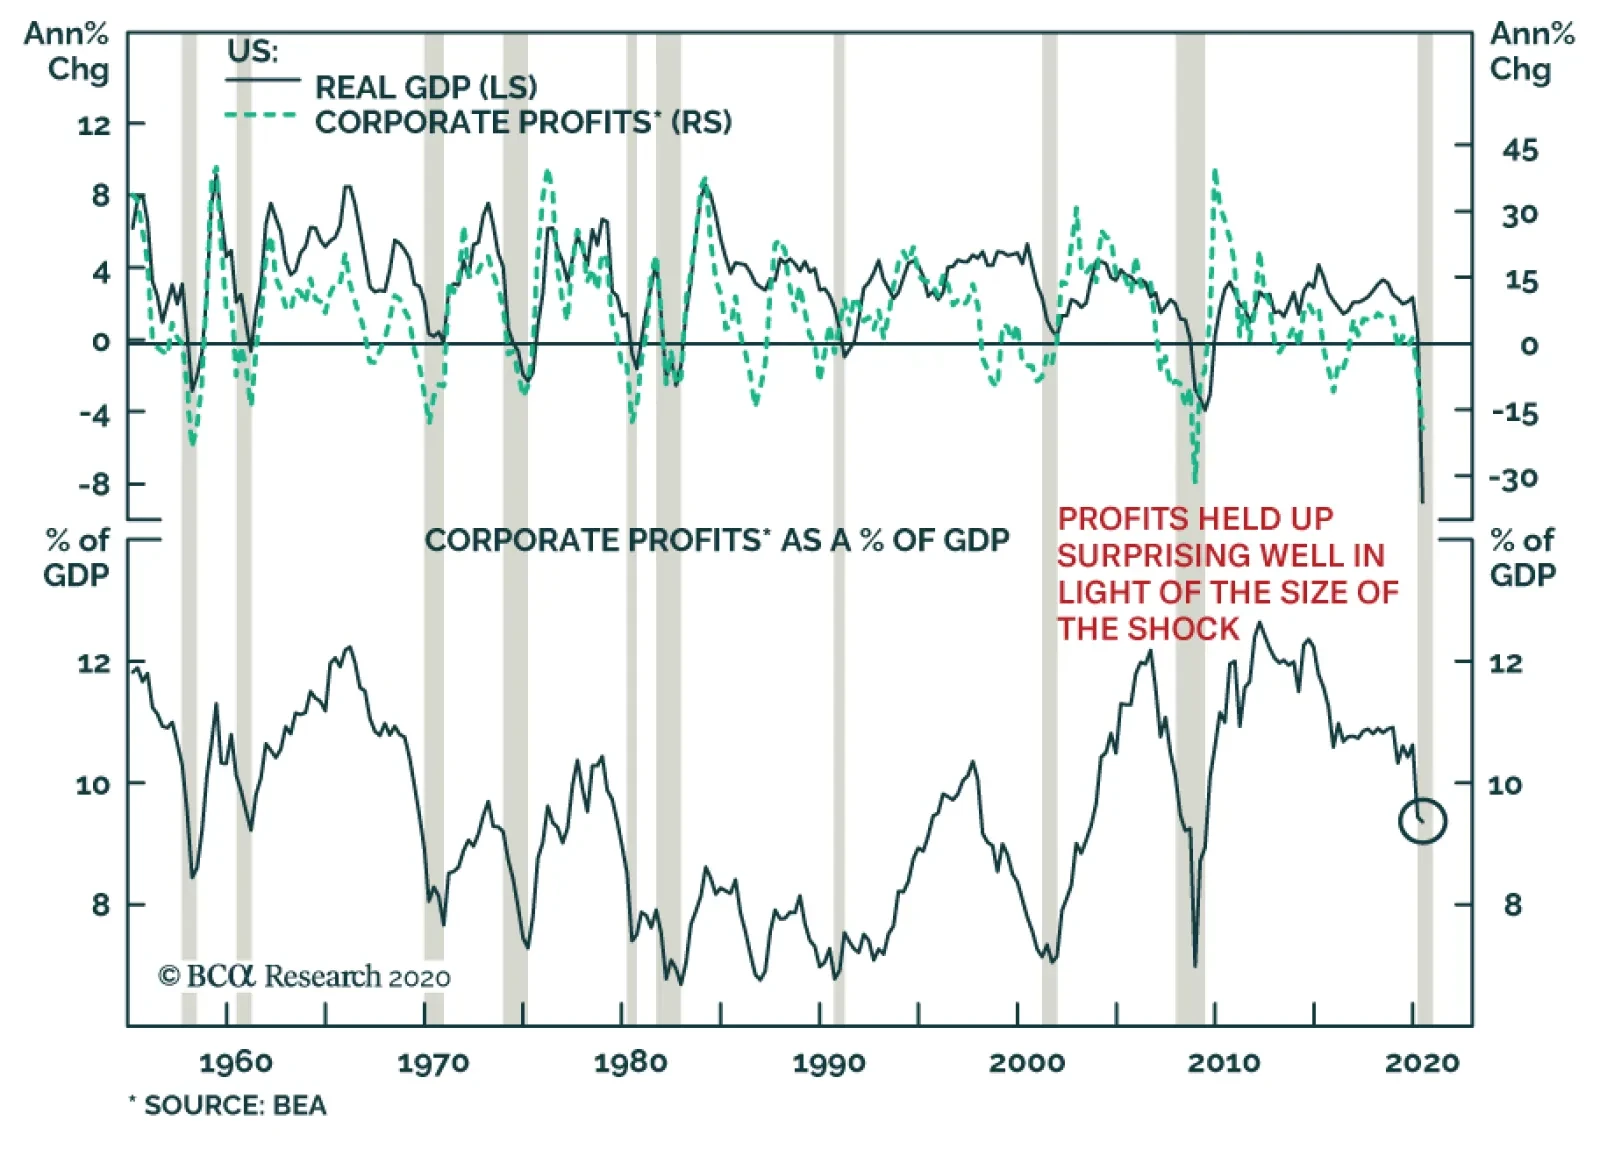
Looking first at leverage, corporate profits plunged in the second quarter but that will probably represent the cyclical trough (Chart 7, top panel). Already, we see that analysts are revising up their earnings expectations (Chart 7, panel 2). Typically, positive net earnings revisions coincide with positive profit growth. On the debt side, firms issued massive amounts of debt in the first and second quarters (Chart 7, panel 3), but that process is also over. We note that the Financing Gap – the difference between capital expenditures and retained earnings – dipped into negative territory in Q2 (Chart 7, bottom panel). This means that firms retained more earnings than they needed to cover capital expenditures and suggests that further debt issuance is not necessary. When the Financing Gap moved below zero in 2009, it ushered in a lengthy period of corporate deleveraging. Chart 7Firms Have Enough Retained Earnings To Cover Capex
Firms Have Enough Retained Earnings To Cover Capex
Firms Have Enough Retained Earnings To Cover Capex
It is therefore quite likely that both corporate sector leverage and the default rate have already peaked. The question is whether both can fall quickly enough to meet market expectations. Of this, we are less certain. When the Financing Gap moved below zero in 2009, it ushered in a lengthy period of corporate deleveraging. Job Cut Announcements – another predictor of corporate defaults – have also improved markedly since April, but they remain well above pre-COVID levels (Chart 8). Further, an array of other employment indicators suggest that labor market improvement has stalled during the past few weeks. Initial unemployment claims have flattened off and remain well above pre-COVID levels (Chart 8, panel 2). What’s more, high frequency data from scheduling firm Homebase show that the total number of employees working for companies using the Homebase software is no longer rising and is far below its pre-COVID level (Chart 8, bottom panel). It’s important to note that the Homebase data are biased toward small businesses, mostly in the restaurant, food & beverage, retail and services sectors. Those sectors have obviously been hit the hardest by COVID, but those are also the sectors where we are likely to see the bulk of corporate defaults. Chart 8Labor Market Indicators
Labor Market Indicators
Labor Market Indicators
Investment Conclusions We are confident that the default rate has peaked, but we aren’t yet confident enough to recommend owning B-rated and below junk bonds. To make that recommendation we would need to have confidence that the default rate will move to 5% or lower during the next 12 months. The default rate was already 4.5% in the 12 months prior to COVID, and it now appears that most labor market data are stalling at worse than pre-COVID levels. An array of employment indicators suggest that labor market improvement has stalled during the past few weeks. We reiterate our recommendation to overweight investment grade and Ba-rated corporate bonds, while avoiding high-yield bonds rated B and lower. We will consider adding exposure to low-rated junk bonds if spreads rise to more attractive levels in the near-term and/or if Congress announces a significant stimulus package that looks poised to boost the economic recovery and labor market. Appendix A: Buy What The Fed Is Buying The Fed rolled out a number of aggressive lending facilities on March 23. These facilities focused on different specific sectors of the US bond market. The fact that the Fed has decided to support some parts of the market and not others has caused some traditional bond market correlations to break down. It has also led us to adopt of a strategy of “Buy What The Fed Is Buying”. That is, we favor those sectors that offer attractive spreads and that benefit from Fed support. The below Table tracks the performance of different bond sectors since the March 23 announcement. We will use this to monitor bond market correlations and evaluate our strategy’s success. Table 4Performance Since March 23 Announcement Of Emergency Fed Facilities
Out Of Bullets
Out Of Bullets
Ryan Swift US Bond Strategist rswift@bcaresearch.com Footnotes 1 For more details on this forecasting framework please see US Bond Strategy Weekly Report, “Negative Oil, The Zero Lower Bound And The Fisher Equation”, dated April 28, 2020, available at usbs.bcaresearch.com 2 Please see US Bond Strategy Weekly Report, “More Stimulus Needed”, dated September 15, 2020, available at usbs.bcaresearch.com 3 For more details on our yield curve recommendations please see US Bond Strategy Weekly Report, “Positioning For Reflation And Avoiding Deflation”, dated August 11, 2020, available at usbs.bcaresearch.com 4 To calculate the Spread-Implied Default Rate we also need to estimate the 12-month recovery rate. We assume a recovery rate of 25%, slightly better than the 20% recovery rate seen during the past 12 months. Fixed Income Sector Performance Recommended Portfolio Specification