United States
BCA Research's US Bond Strategy service concludes that US dollar weakness will be bearish for bonds during the next 6-12 months. As long as the global economic recovery is maintained, the dollar will weaken further and bond yields have room to rise. We…
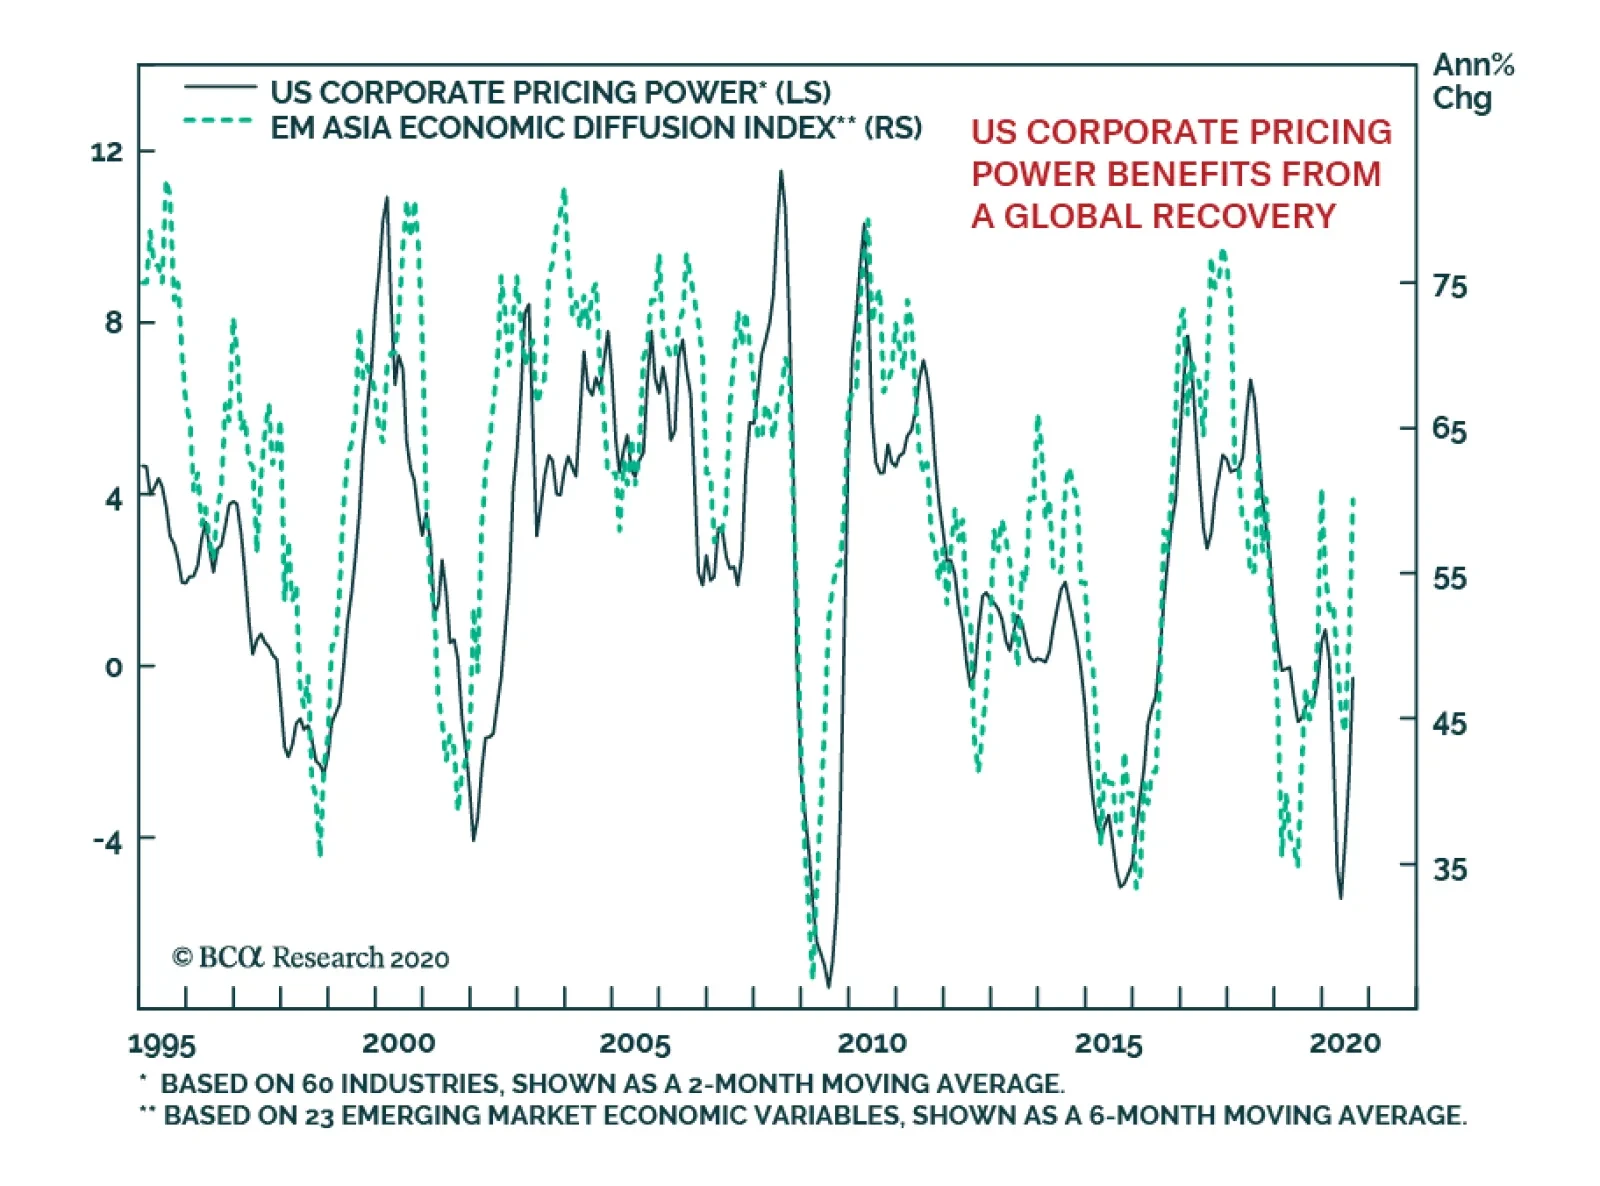
BCA Corporate Pricing Power Indicator has staged a meaningful rebound thanks to the combination of a pick-up in capacity utilization, a weaker dollar and stronger commodity prices. Moreover, as our US Equity Strategy service recently discussed, 59% of the…

Cement Gains In The Internet Retail Index And In The Consumer Discretionary Sector
Cement Gains In The Internet Retail Index And In The Consumer Discretionary Sector
Neutral In mid-April we moved the S&P consumer discretionary sector to the overweight column via upgrading the internet and home improvement retail sub-sectors. While the home improvement retailers hit our stop earlier this month resulting into 15% relative gains, last Friday internet retailers followed suit. We are obeying our previously instituted stop in the S&P internet retail index and crystalizing gains at the 20% relative return mark and downgrade to neutral. This move also pushes the overall S&P consumer discretionary sector to a benchmark allocation, locking in profits of 15% in excess of the broad market over the past five months. Bottom Line: Downgrade the S&P internet retail index to neutral which also pushes our S&P consumer discretionary sector allocation to benchmark for 20% and 15% relative gains, respectively, since the mid-April inception.
Highlights Monetary Policy: The Fed will keep rates at the zero bound at least until inflation is above 2% and it will maintain an accommodative policy stance until long-dated TIPS breakeven inflation rates move above 2.3%. Remain overweight spread product versus Treasuries and stay in nominal yield curve steepeners. Bond Yields & The Dollar: US dollar weakness will be bearish for bonds during the next 6-12 months. As long as the global economic recovery is maintained, the dollar will weaken further and bond yields have room to rise. EM Sovereigns: Remain underweight USD-denominated EM Sovereigns in a US bond portfolio, with the exception of Mexico. Economy: August’s poor retail sales figures strengthen our conviction that further fiscal stimulus is required to sustain the economic recovery. Our base case outlook is that Congress will deliver that stimulus in the coming weeks, and that yields will be higher in 6-12 months. But the risk of no deal is too great to ignore. Keep portfolio duration close to benchmark for now. Fed Adopts Explicit Forward Guidance, But Leaves Many Questions Unanswered Chart 1Fed And Markets Agree: No Rate Hike Until 2024
Fed And Markets Agree: No Rate Hike Until 2024
Fed And Markets Agree: No Rate Hike Until 2024
Following last month’s adoption of an average inflation targeting regime, the next logical step was for the Fed to translate its new policy framework into more explicit forward rate guidance.1 The Fed took that step at last week’s FOMC meeting by adding the following language to its post-meeting statement: The Committee decided to keep the target range for the federal funds rate at 0 to ¼ percent and expects it will be appropriate to maintain this target range until labor market conditions have reached levels consistent with the Committee’s assessments of maximum employment and inflation has risen to 2 percent and is on track to moderately exceed 2 percent for some time.2 Chart 2A Long Way From 2%
A Long Way From 2%
A Long Way From 2%
The new guidance says that the funds rate will not rise off the zero bound until three criteria are met: The labor market must be at “maximum employment” Inflation must be at or above 2% Inflation must be “on track to moderately exceed 2%” Notice that the criteria of “maximum employment” and inflation that “moderately exceeds 2%” are quite vague. In fact, Fed Chair Powell stated in his post-meeting press conference that “maximum employment” refers to a range of different labor market indicators, not just the unemployment rate. He also refused to provide more detail on how much of an inflation overshoot would qualify as “moderate”. This means that, practically, the only actionable information that the Fed gave investors is the promise that the funds rate won’t rise at least until inflation is at or above 2%. This is important info that can be easily visualized on a chart (Chart 2). We can plainly see that core inflation has a long way to go before it reaches the Fed’s target, and also that the Fed will not be making the same hawkish policy mistake it made in 2015, when it lifted rates with year-over-year core PCE inflation at 1.2%. Monetary policy will remain accommodative and supportive for risk assets until TIPS breakeven inflation rates return to well-anchored levels. For their part, FOMC participants don’t expect inflation to reach the 2% target for quite a while. The median participant doesn’t see core inflation reaching 2% until sometime in 2023, and only 4 out of 17 participants expect to lift rates before 2024. This is consistent with market pricing. The overnight index swap curve doesn’t price-in a full 25 basis point rate hike until September 2024 (Chart 1). Investment Implications We know that the Fed wants inflation to overshoot 2% for some period of time. Now, based on last week’s new guidance, we also know that no rate hikes will occur until inflation is above 2%. However, we still don’t know how much or how long of an inflation overshoot the Fed is targeting. For this reason, we think investors would be wise to keep in mind that the goal of the Fed’s new framework is to ensure that inflation expectations return to well-anchored levels. Our sense is that “well anchored” can be defined as a range of 2.3% to 2.5% for long-maturity TIPS breakeven inflation rates (Chart 3). Chart 3Inflation Expectations: The Fed's Real Target
Inflation Expectations: The Fed's Real Target
Inflation Expectations: The Fed's Real Target
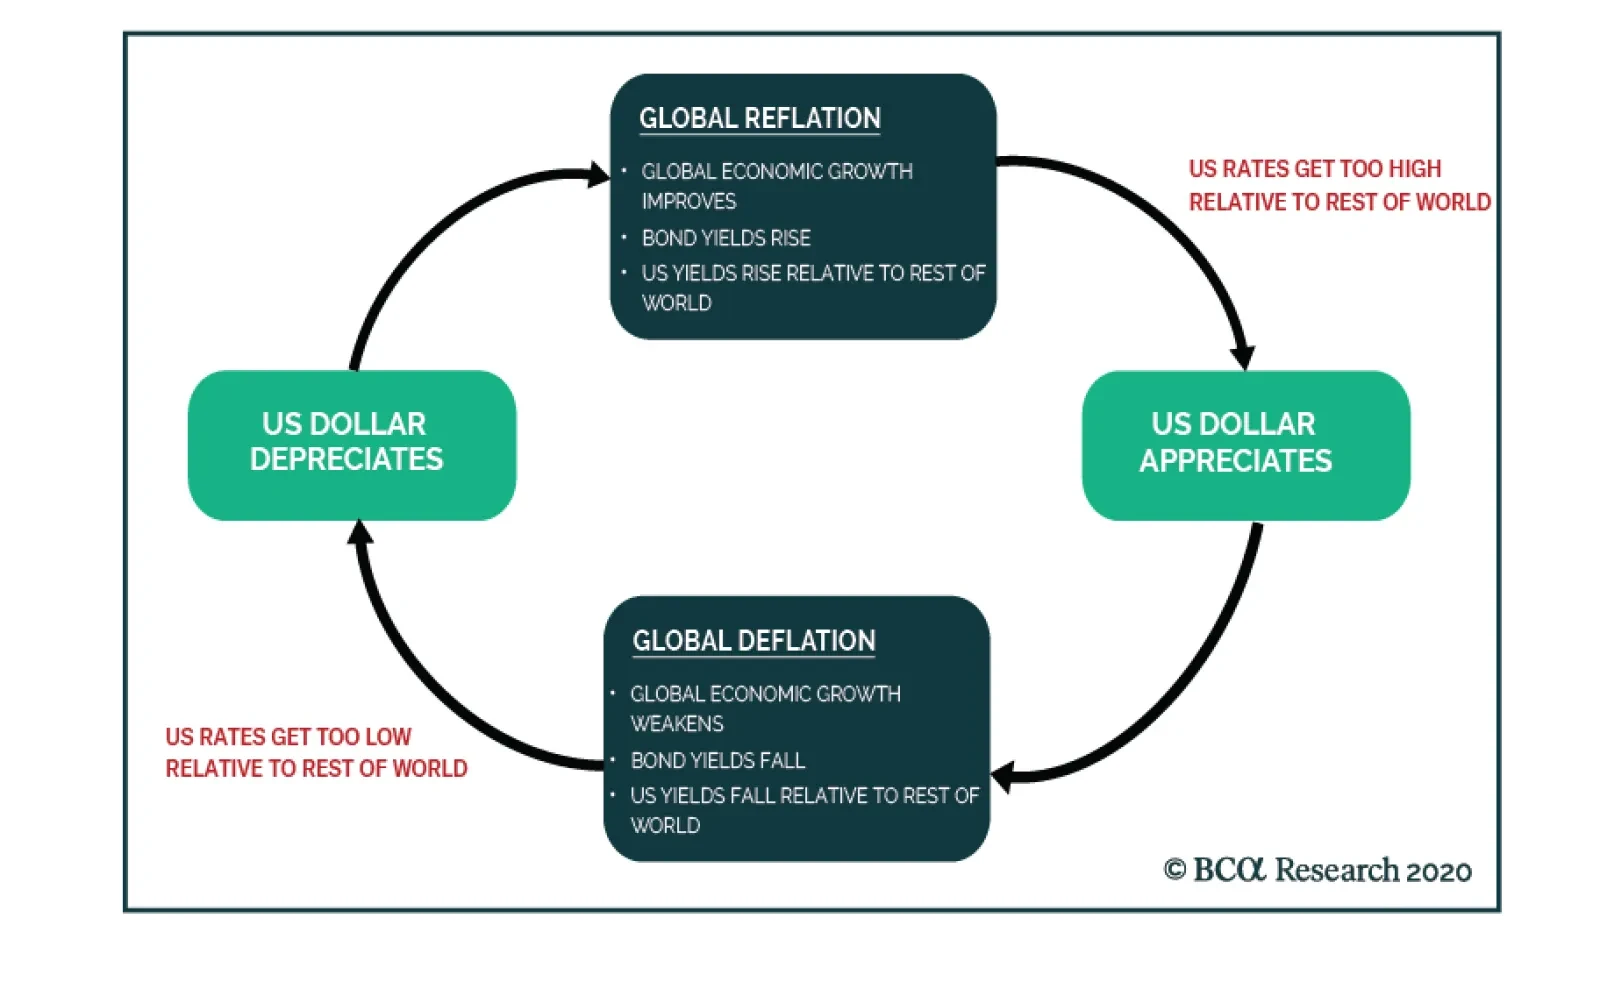
We see monetary policy staying accommodative and supportive for risk assets until TIPS breakeven inflation rates reach those levels. This argues for maintaining an overweight 6-12 month allocation to spread product versus Treasuries. This also argues for staying overweight TIPS versus nominal Treasuries, and for positioning in nominal yield curve steepeners. The Fed will maintain its firm grip on the front-end of the curve for a long time yet, but the market will eventually start to price-in liftoff at the long end. A Weaker Dollar Will Be Bearish For Bonds, Bullish For EM Sovereign Spreads The broad trade-weighted US dollar is 8% off its 2020 peak, and the BCA house view is that the dollar will weaken further during the next 12 months. This section explores what that will mean for Treasury yields and for USD-denominated Emerging Market Sovereign debt. The Dollar And Treasury Yields Bond yields and the dollar are intimately related, but the relationship is more complex than a simple coincident correlation. We like to think of the relationship as a feedback loop between the exchange rate, bond yields and global economic growth (Chart 4). Chart 4The Dollar/Bond Feedback Loop
Trading Bonds In A Dollar Bear Market
Trading Bonds In A Dollar Bear Market
Since the dollar is currently falling, let’s start at the left-hand side of the feedback loop shown in Chart 4. The dollar’s current weakness is both a reflection of improving global economic growth and a catalyst for even stronger global economic growth. It is reflective because, compared to the rest of the world, the US is a large and stable economy. Firms and investors will respond to a positive global growth environment by sending capital overseas in search of higher returns. This puts downward pressure on the dollar. Dollar weakness also boosts global economic growth by making US dollars cheaper to acquire in global markets. This is particularly important for emerging markets, where a weaker dollar gives policymakers leeway to boost domestic growth via easier monetary and fiscal policies, without sacrificing the purchasing power of their currencies. Higher yielding countries tend to have less economic slack than low yielders. Moving to the top of the loop, stronger global economic growth (aka global reflation) will obviously impart upward pressure to bond yields. What’s less obvious is that US yields will rise by more than yields in the rest of the world. Chart 5 shows 3-year trailing yield betas for several major developed bond markets. Notice that the highest-yielding countries (US and Canada) also have the highest yield betas. This means that their yields rise the most when global bond yields are rising and fall the most when global bond yields are falling. This pattern holds because higher yielding countries tend to have less economic slack than low yielders. In other words, the high yielders will be quicker to price-in eventual monetary tightening when global growth is on the upswing. The high yielders also have more room to fall when growth ebbs. Chart 5High Yielding Bond Markets Are The Most Cyclical
High Yielding Bond Markets Are The Most Cyclical
High Yielding Bond Markets Are The Most Cyclical
Initially, global reflation sends US bond yields higher. But eventually, US yields will become too high relative to the rest of the world. At that point, the US dollar will respond to wide interest rate differentials and start to appreciate. This dollar appreciation will eventually lead to slower economic growth (“global deflation”), which will cause bond yields to decline. Finally, just as US bond yields rise more than non-US yields during the global growth upswing, they also fall more during the downswing. Eventually, the tightening rate differentials lead to US dollar depreciation and the cycle repeats. Where are we situated in the cycle right now? As of today, we contend that rate differentials between the US and the rest of the world have fallen a lot, and we are at the stage of the loop where the dollar is weakening in response (Chart 6). This means that dollar weakness has further to run, and we should expect that it will eventually lead to global reflation and higher US bond yields. In fact, Chart 7 shows that sentiment toward the dollar has already soured considerably, and that increasingly bearish dollar sentiment has a habit of leading to higher bond yields. Chart 6Rate Differentials Signal More Downside For Dollar
Rate Differentials Signal More Downside For Dollar
Rate Differentials Signal More Downside For Dollar
Chart 7Bearish Dollar Sentiment Leads To Higher Bond Yields
Bearish Dollar Sentiment Leads To Higher Bond Yields
Bearish Dollar Sentiment Leads To Higher Bond Yields
Eventually, US yields will rise too much compared to the rest of the world and the dollar’s depreciation will stop. But for now, dollar weakness is bearish for bonds. The Dollar And USD-Denominated EM Sovereign Spreads USD-denominated Emerging Market Sovereigns are an obvious sector that benefits from a weaker US dollar. Since the debt is denominated in US dollars but the country collects tax revenues in its local currency, any dollar weakness makes the issuer’s debt easier to service, and presumably leads to tighter sovereign spreads. Most of the dollar’s weakness this year has come against other developed market currencies, not against EMs. Despite this relationship, we are reluctant to advocate an overweight allocation to EM Sovereigns. First, most of the dollar’s weakness this year has come against other developed market currencies, not against EMs (Chart 8). Chart 8EM Currencies Have Lagged
EM Currencies Have Lagged
EM Currencies Have Lagged
Second, an environment of US dollar depreciation and global reflation is also a good environment for US corporate bonds and, with a couple exceptions, US corporate spreads are more attractive than EM Sovereign spreads. The vertical axis of Chart 9 shows the spread differential between the USD-denominated bonds of several EMs relative to a position in US corporate bonds with identical duration and credit rating. After differences in duration and credit rating are considered, only Turkey, Colombia, South Africa, Mexico and Russia offer a spread advantage over US corporate credit. The horizontal axis of Chart 9 shows each country’s export coverage of its foreign debt obligations. Greater coverage should make that country’s currency less vulnerable to depreciation, and vice-versa. In our view, the Turkish, Colombian and South African currencies are simply too risky. But Mexico and Russia present more interesting opportunities. Chart 9EM Sovereign Spread Over US Credit Versus Currency Vulnerability
Trading Bonds In A Dollar Bear Market
Trading Bonds In A Dollar Bear Market
We recommend an overweight allocation to Mexican Sovereigns because they offer a spread advantage relative to US corporates, and because the currency has been on an appreciating trend versus the dollar that still has further to run to get back to pre-COVID levels (Chart 8, panel 3). Despite the small spread pick-up, we would avoid Russian Sovereigns, at least until after the US election. The Ruble has been depreciating versus the dollar since mid-year (Chart 8, bottom panel) and a Democratic sweep in November will likely lead to the imposition of fresh US sanctions on Russia.3 Bottom Line: Remain underweight USD-denominated EM Sovereigns in a US bond portfolio. Despite the outlook for US dollar weakness, US corporate bonds offer more value and will deliver better returns. Mexican debt is the sole exception. Mexican spreads are attractive and the peso has room to appreciate. Economic Update: Signs Of Weakness In Consumer Spending Chart 10A Warning From Retail Sales
A Warning From Retail Sales
A Warning From Retail Sales
In last week’s report, we warned that without a fresh round of fiscal stimulus, the 12-month outlook for US consumer spending is dire.4 Then, last Wednesday, we received August’s retail sales figures – the first month of spending data since the expiry of the CARES act’s income support provisions – and learned that spending contracted on the month, after having rebounded sharply in May, June and July when the CARES act was in full force (Chart 10). There had been some hope that US consumers might be able to compensate for the lack of income by deploying some of the savings they had built up in the spring, thus keeping spending at decent levels for at least a few months. But August’s weak retail sales report challenges that narrative, as does the fact that consumer sentiment surveys have not improved very much since April (Chart 10, panel 3). Still low consumer sentiment suggests that households remain cautious and that they will be reluctant to spend with the same abandon they showed prior to COVID. We also note that, while weekly initial jobless claims continue to fall, the pace of improvement has significantly tapered off during the past few weeks and initial claims are still coming in about 4 times higher than they were last year (Chart 10, bottom panel). Bottom Line: While significant strides have been made, the US economy is not out of the woods. Our base case view is that Congress will deliver sufficient household income support in the coming weeks, allowing the economic recovery to continue. But the risk that they won’t is too great to ignore. Keep portfolio duration close to benchmark for now, and position for higher yields on a 6-12 month horizon via less risky duration-neutral yield curve steepeners. Appendix A: Buy What The Fed Is Buying The Fed rolled out a number of aggressive lending facilities on March 23. These facilities focused on different specific sectors of the US bond market. The fact that the Fed has decided to support some parts of the market and not others has caused some traditional bond market correlations to break down. It has also led us to adopt of a strategy of “Buy What The Fed Is Buying”. That is, we favor those sectors that offer attractive spreads and that benefit from Fed support. The below Table tracks the performance of different bond sectors since the March 23 announcement. We will use this to monitor bond market correlations and evaluate our strategy’s success. Table 1Performance Since March 23 Announcement Of Emergency Fed Facilities
Trading Bonds In A Dollar Bear Market
Trading Bonds In A Dollar Bear Market
Ryan Swift US Bond Strategist rswift@bcaresearch.com Footnotes 1 For a more detailed examination of the Fed’s new average inflation targeting regime please see US Bond Strategy / Global Fixed Income Strategy Special Report, “A New Dawn For Monetary Policy”, dated September 1, 2020, available at usbs.bcaresearch.com 2 https://www.federalreserve.gov/monetarypolicy/files/monetary20200916a1.pdf 3 Please see Geopolitical Strategy / Emerging Markets Strategy Special Report, “US-Russia: No Reverse Kissinger (Yet)”, dated July 3, 2020, available at gps.bcaresearch.com 4 Please see US Bond Strategy Weekly Report, “More Stimulus Needed”, dated September 15, 2020, available at usbs.bcaresearch.com Fixed Income Sector Performance Recommended Portfolio Specification
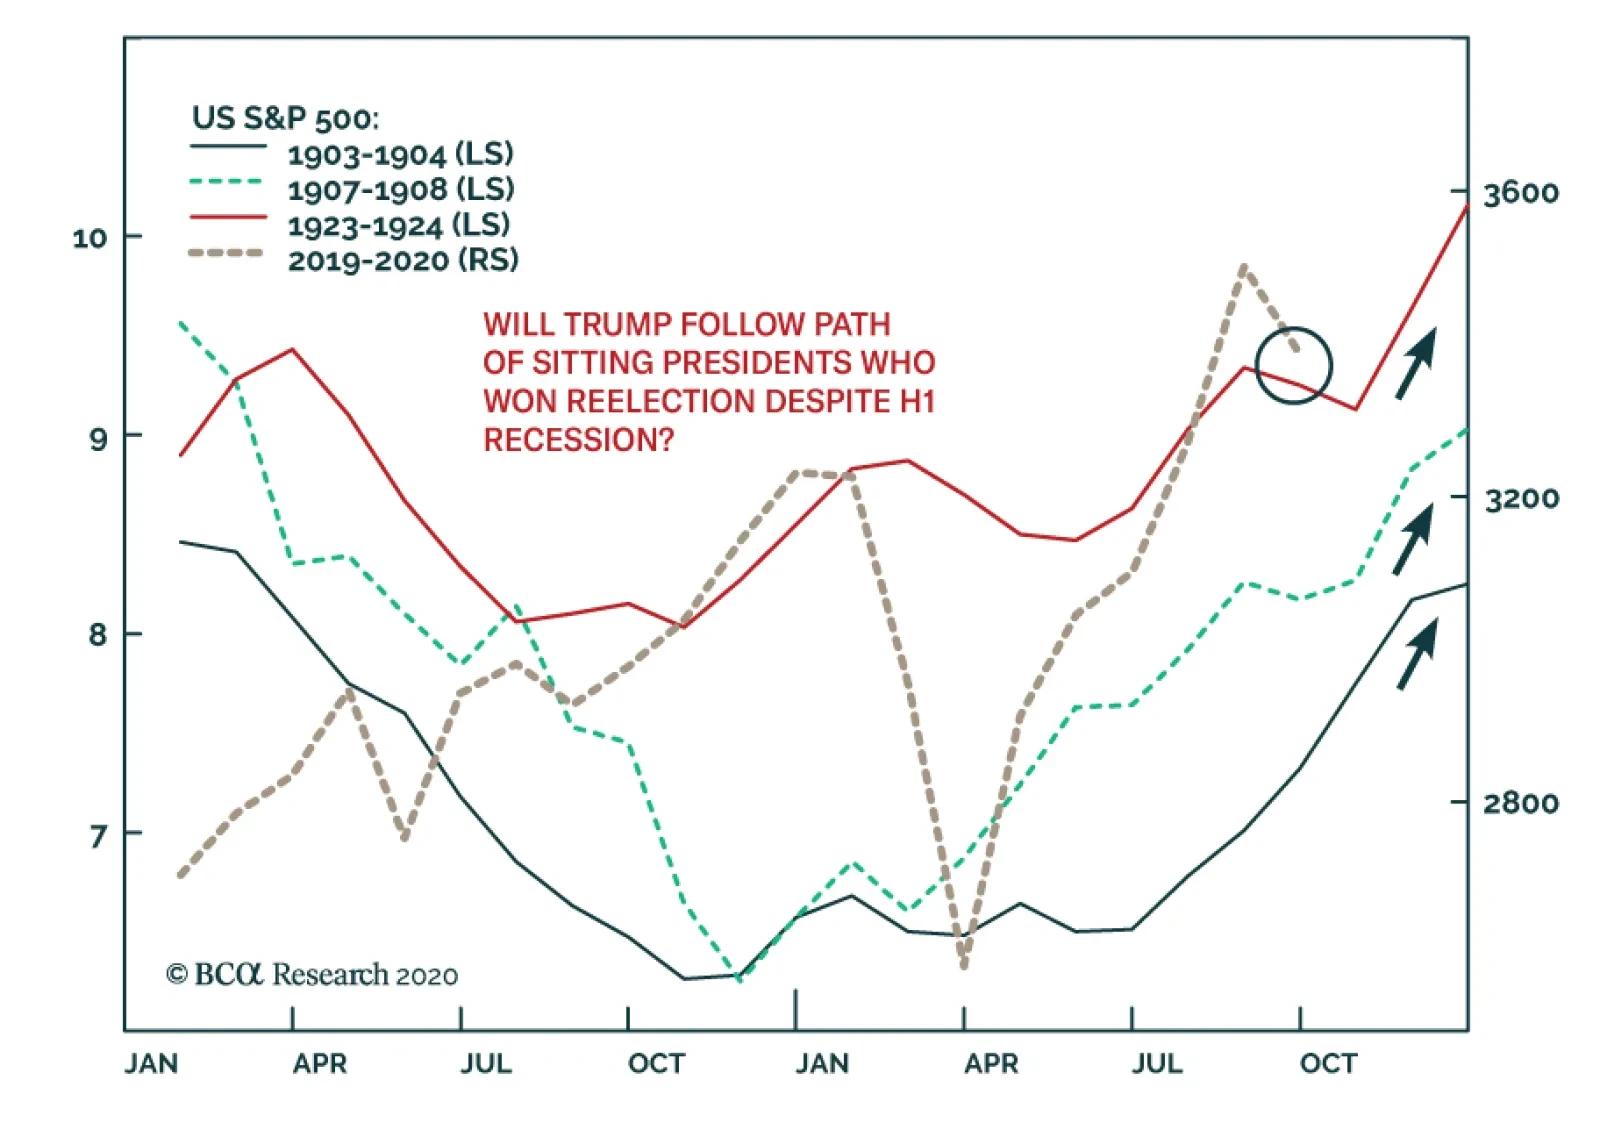
BCA Research's Geopolitical Strategy service analysis concludes that a recession during the first half of an election year should not rule out an incumbent. We may well be forced to upgrade Trump’s odds of winning if his comeback gains momentum. Our…
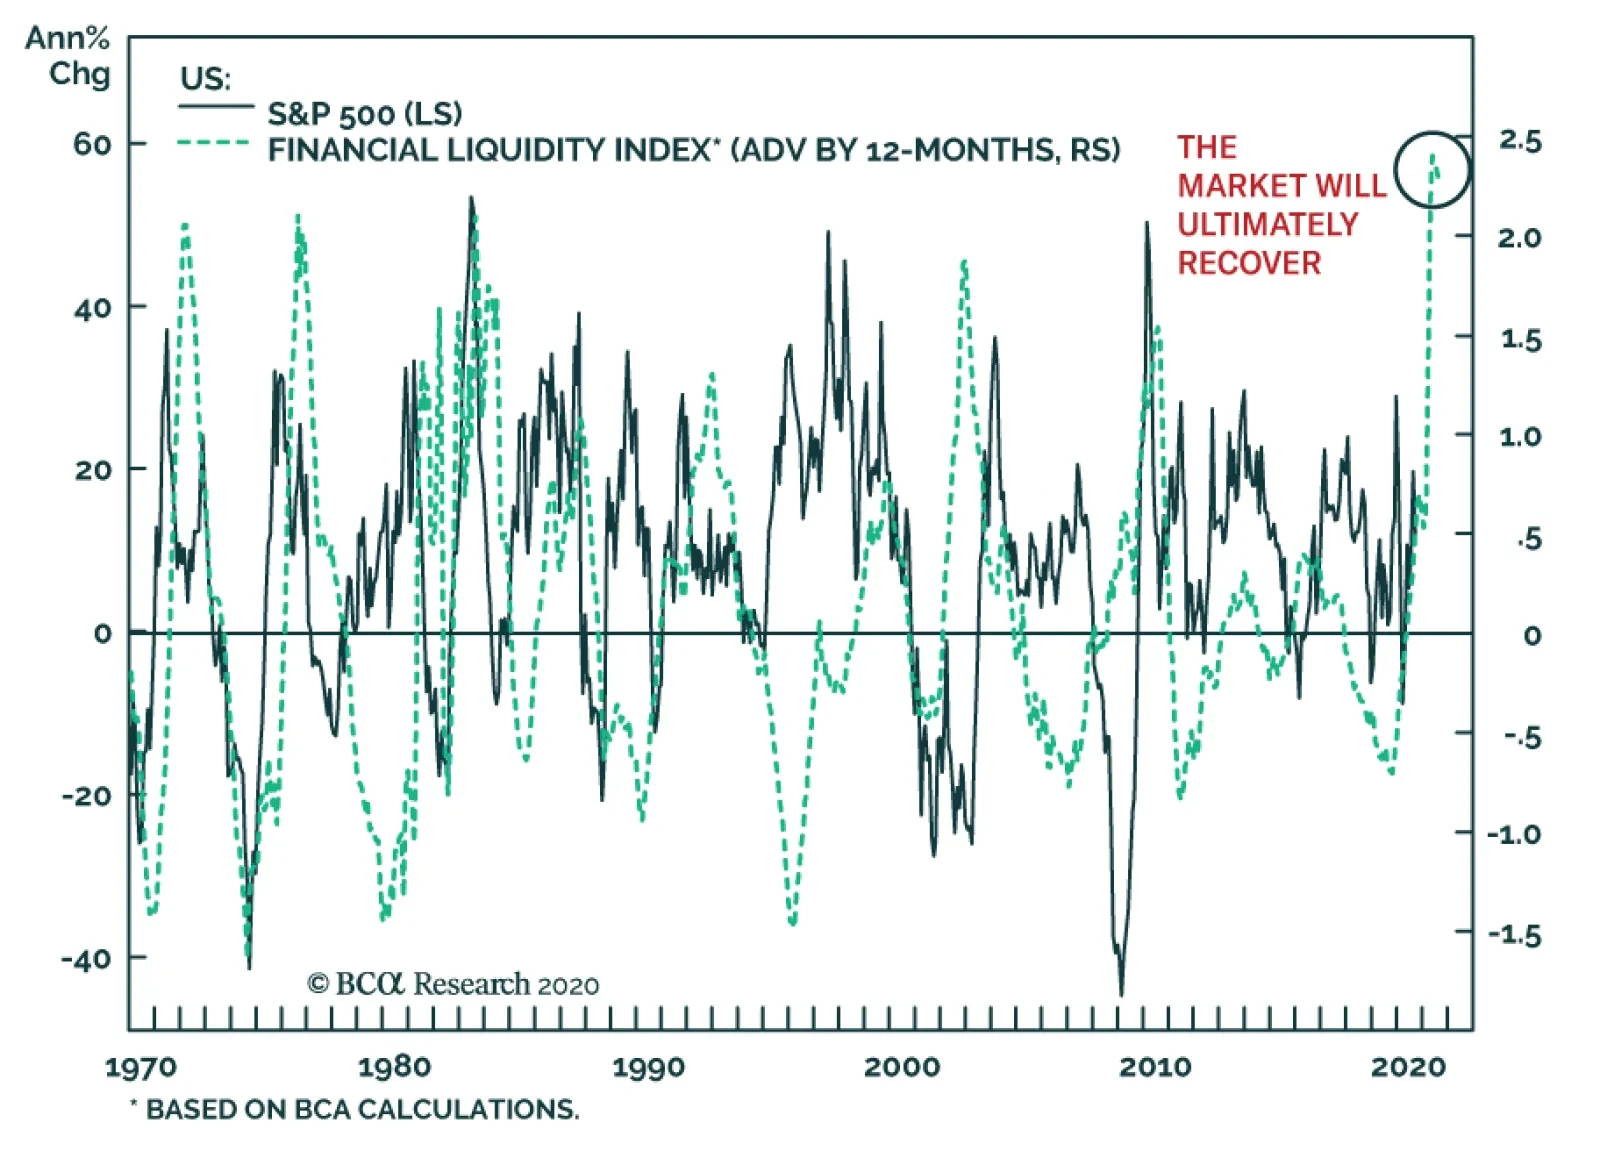
While the near-term risks to the market are acute, an essential cyclical support remains firmly in place: Liquidity conditions are exceptionally accommodative. Our BCA US Financial Liquidity Index still stands near all-time highs. With this much liquidity…
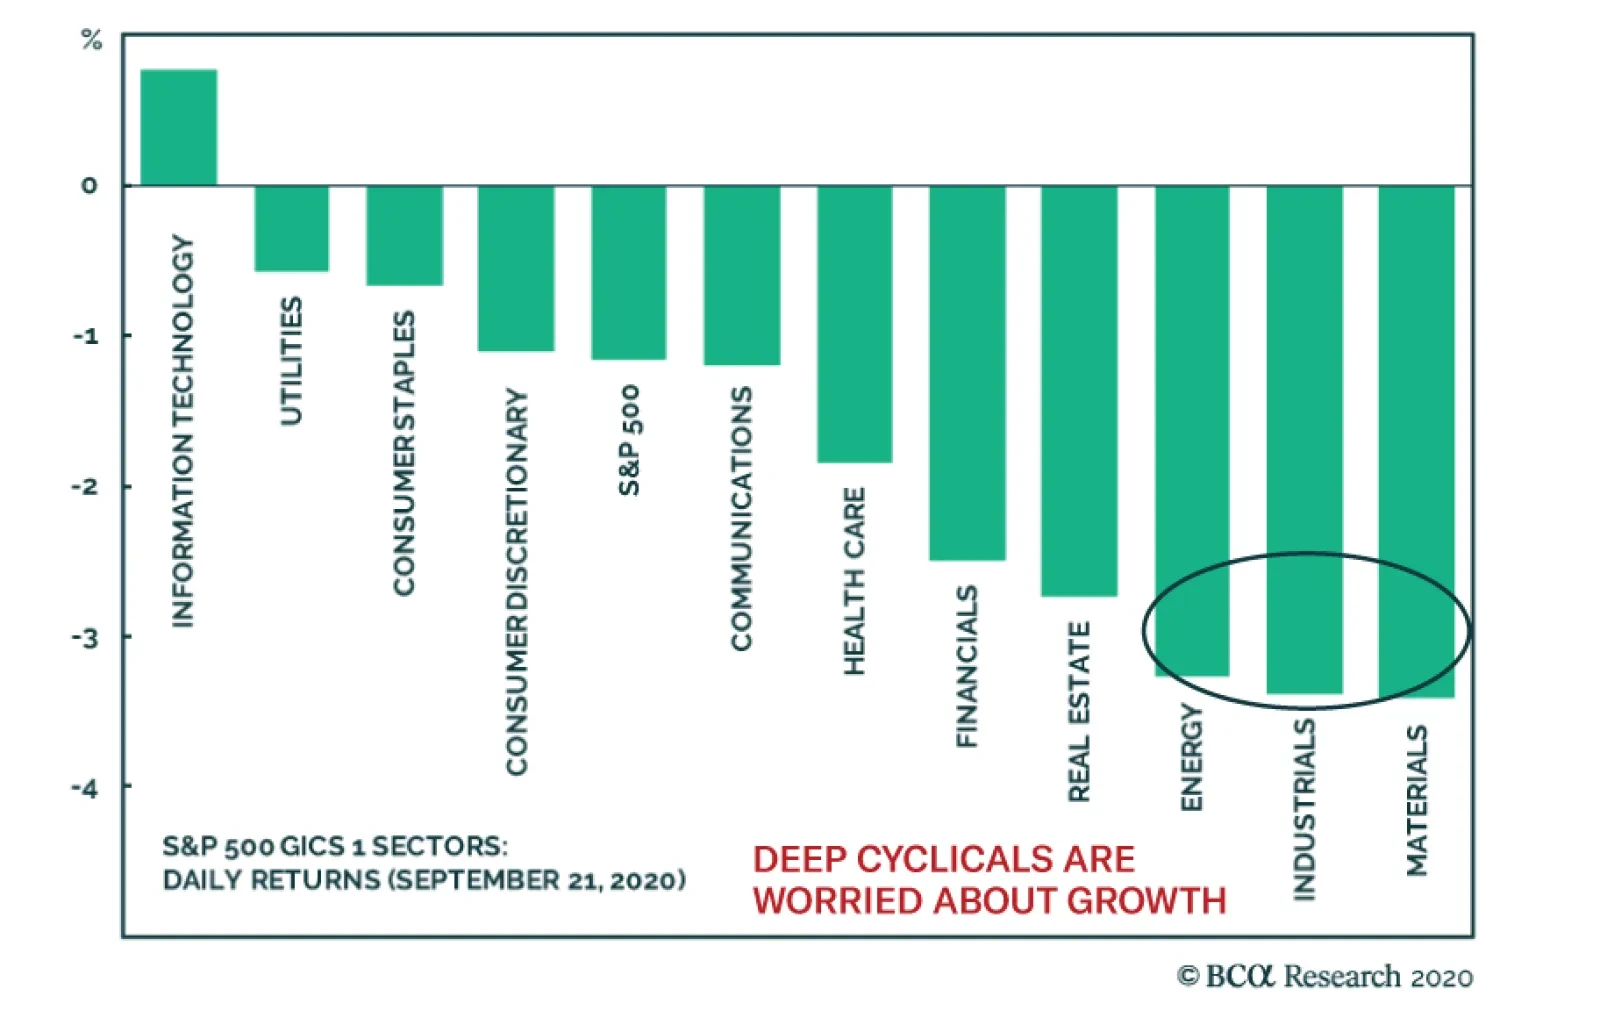
The market correction continues to deepen. More than the decline itself, the most worrisome element of yesterday’s 1.2% fall in the S&P 500 was its composition. Unlike in previous red days this September, the largest decliners were the deep cyclical…
BCA Research's US Equity Strategy service recommends investors stay underweight the S&P 500 semiconductors equipment index because of the softening demand backdrop that is weighing on selling prices, the rekindling of the US/China tech-related trade war…
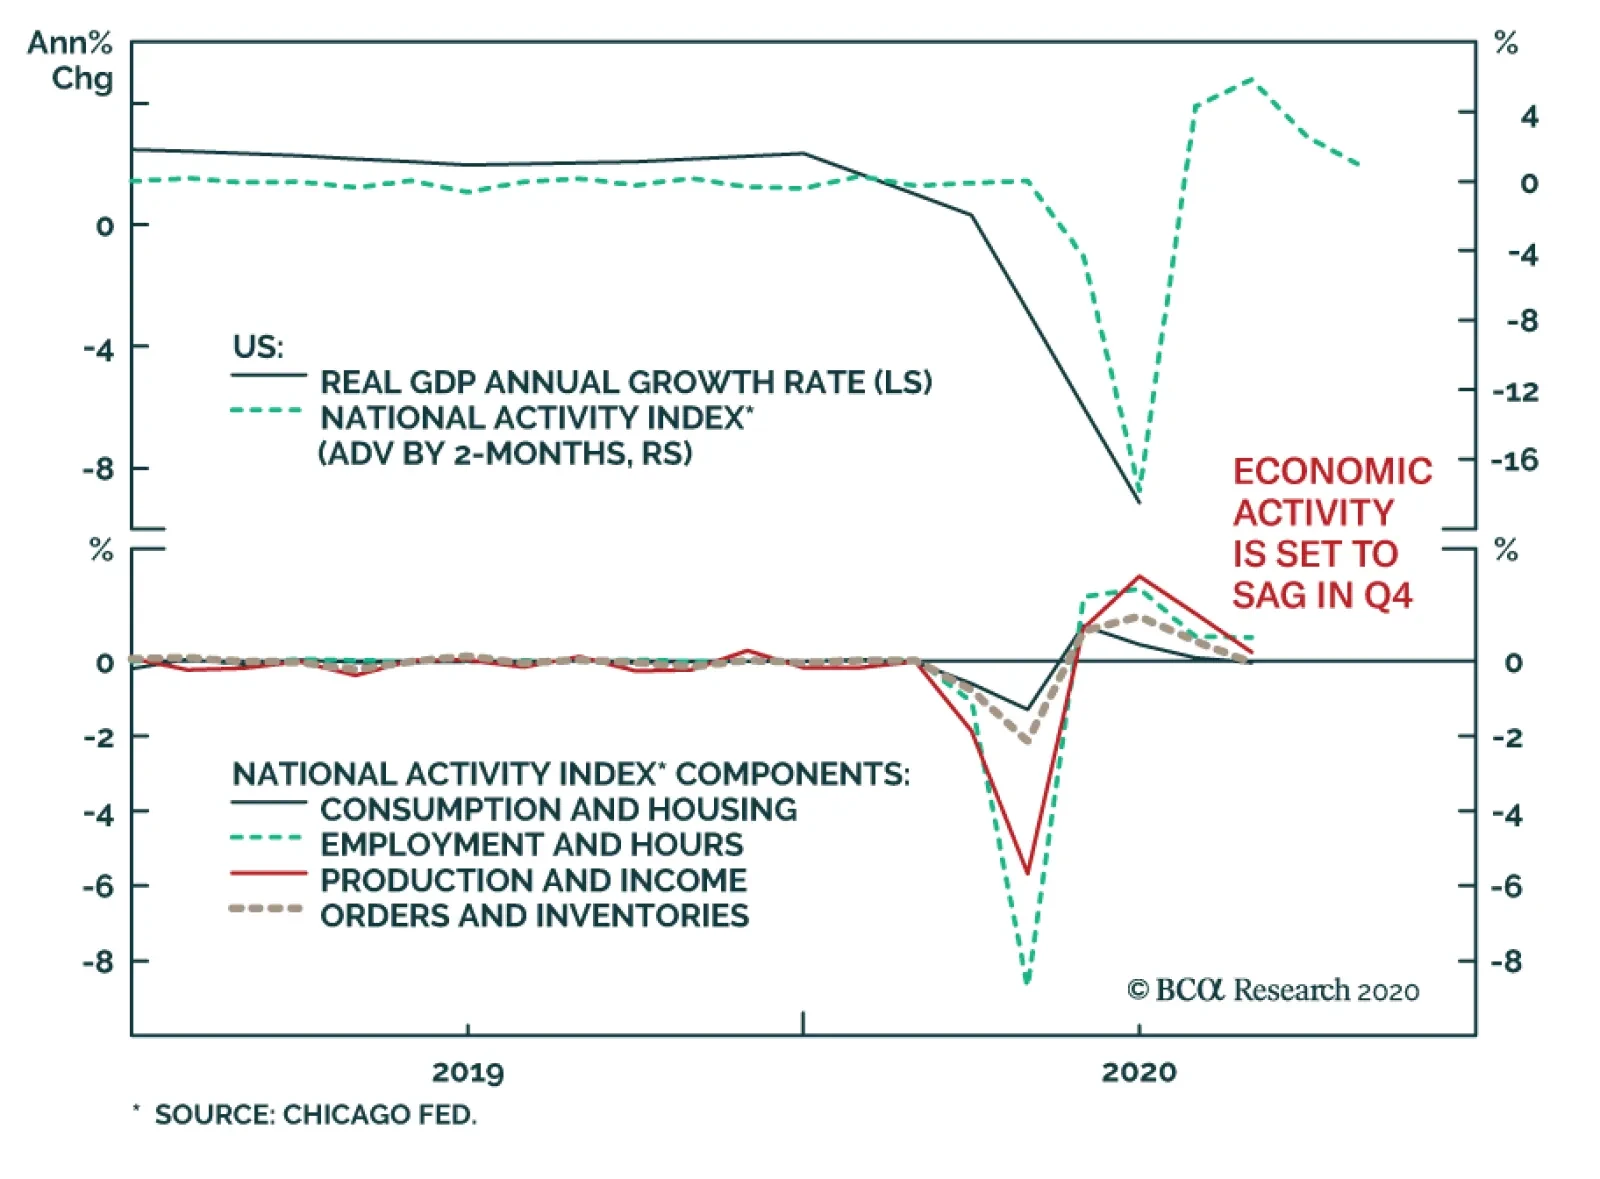
Yesterday, the Chicago Fed's August National Activity Index fell from July's revised print of 2.54 to 0.79, well beneath expectations of 1.19. This deceleration suggests that the economy will slow in Q4 following an incredible rebound in Q3, which reflected…
Highlights Portfolio Strategy We opt to stay patient and refrain from deploying fresh capital especially in the tech sector in the near-term; a better entry point will likely materialize between now and the end of the year. The softening demand backdrop that is weighing on selling prices, the rekindling of the US/China tech-related trade war and the risk of a reflex rebound in the US dollar, all warn to shy away from semi cap stocks. A balanced outlook keeps us on the sidelines in the S&P home improvement retail (HIR) index. Recent Changes There are no changes to the portfolio this week. Table 1
Churning
Churning
Feature Equities tried to regain their footing last week, but risks still lingering on the (geo)political front should sustain the tug of war between bulls and bears and rekindle volatility. While monetary and fiscal policies will remain loose, the intensity of easing is waning as both the Fed’s impulse (i.e. second derivative) of asset purchases has ground to a halt and Congress has hit a stalemate over the next round of stimulus. Crudely put, the thrust of monetary and fiscal policies is at heightened risk of shifting from stimulative to contractive (Chart 1). As a result, we remain patient with fresh capital and will wait to deploy it when the dust settles hopefully by the end of the year. Turning to equity market internals and other high frequency financial market data is instructive in order to get a clearer picture of the direction of the broad equity market. The value line arithmetic and geometric indexes and small cap stocks that led the March 23 SPX trough are emitting a distress signal (Chart 2). Chart 1Running Out Of Thrust
Running Out Of Thrust
Running Out Of Thrust
Chart 2Market Internals...
Market Internals...
Market Internals...
Drilling deeper on a sector basis, hypersensitive chip stocks, energy shares, and discretionary versus staples equities will likely weigh on the prospects of the broad equity market (Chart 3). The VIX index, the vol curve and the yield curve, all excellent leading indicators of the S&P 500, have crested and warn that the shakeout phase has yet to run its course (VIX shown inverted ,Chart 4). Chart 3...Say It Is Prudent...
...Say It Is Prudent...
...Say It Is Prudent...
Chart 4...To Remain On The Sidelines
...To Remain On The Sidelines
...To Remain On The Sidelines
Trying to quantify the SPX drawdown, we turn to CBOE’s equity put/call (EPC) ratio. The EPC ratio is nowhere near recent extreme readings. SPX pullbacks since the early-2018 “Volmageddon” have corresponded to significantly higher EPC ratio readings. In the past 10 such iterations, the median EPC ratio has been 0.86, the mean 0.93, with a range of 0.77 to 1.28 (Table 2). Currently, the EPC ratio is hovering near 0.58 suggesting that downside risks persist (EPC ratio shown inverted, Chart 5). Chart 5Downside Risks Persist
Downside Risks Persist
Downside Risks Persist
Table 2Equity Put/Call (EPC) Ratio During Pullbacks Since 2018
Churning
Churning
Finally, the commodity complex is also firing warnings shots. Lumber has collapsed nearly $300/tbf from the recent peak, oil is trailing gold bullion and silver is also cresting versus the yellow metal, iron ore is petering out and the Baltic dry index is wobbling. True, copper and materials stocks are holding their own, but overwhelmingly commodity market internals are waving a yellow flag (Chart 6). Chart 6Commodity Yellow Flags
Commodity Yellow Flags
Commodity Yellow Flags
Netting it all out, we opt to stay patient and refrain from deploying fresh capital especially in the tech space in the near-term; a better entry point will likely materialize between now and the end of the year. This week we reiterate our underweight stance in a niche technology index and shed more light on our recent downgrade to neutral of a key consumer discretionary subgroup. Chip Equipment Update: Tangled Up In The Trade War We remain committed to our intra-tech strategy of preferring defensive software and services tech names to aggressive hardware and equipment tech stocks. In that light, we reiterate our underweight stance in the niche S&P semi equipment index. Recent news of the Trump administration’s potential tightening of the noose on Chinese chip company SMIC (the country’s largest foundry) was a net negative for US semi cap names, similar to export restrictions of American technology to Huawei was a net negative for US semi cap names. As a reminder, these manufacturers count China as one of their largest export market alongside Taiwan and South Korea. Thus, this flare up in the US/Sino trade war bodes ill for semi cap companies’ future sales and profit growth projections (Chart 7). There are high odds that relative share prices have plateaued earlier this month and a fresh down cycle has commenced. Under such a backdrop, this hyper-sensitive manufacturing group will likely overshoot to the down side as is evident in the historical tight correlation with the ISM manufacturing survey: these violent oscillations are warning that a cooling off in the ISM will be severely felt in this niche manufacturing intense index (Chart 8). Chart 7Lofty Expectations
Lofty Expectations
Lofty Expectations
Chart 8Violent Oscillations
Violent Oscillations
Violent Oscillations
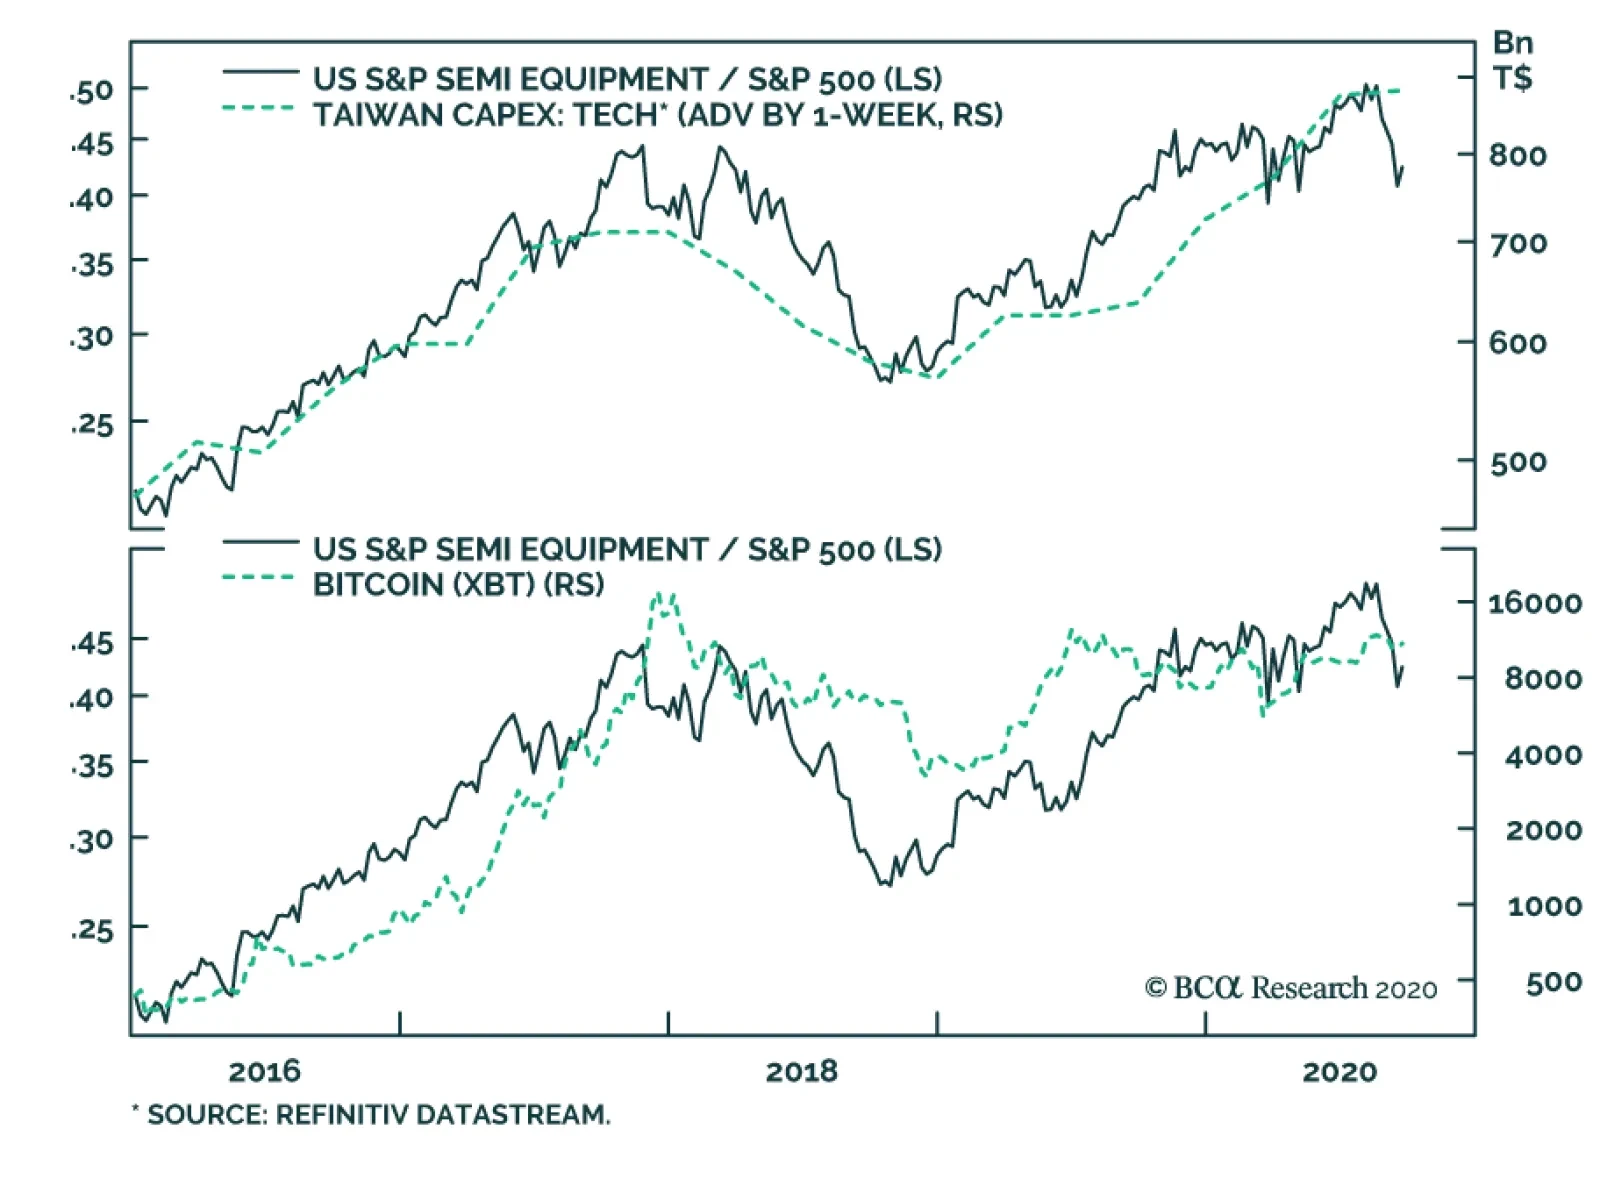
On the global demand front, there is an element that COVID-19 is stealing sales from the future and bringing demand forward. Already global semi sales are rolling over, and a couple of industry pricing power proxies are deflating at an accelerating pace: Asian DRAM prices are topping out in the contraction zone and Taiwanese export prices are sinking like a stone, warning that a deficient demand down cycle will squeeze semi cap profit margins (Chart 9). Importantly, Taiwanese tech capex, which TSMC dominates, has crested, warning that all the euphoria behind 5G deployment and uptake is likely baked in the relative share price ratio. The implication is that semi cap names remain vulnerable to any global 5G-related hiccups (top panel, Chart 10). Chart 9Waning Selling Price Backdrop
Waning Selling Price Backdrop
Waning Selling Price Backdrop
Chart 10Cresting
Cresting
Cresting
Finally, the tight positive correlation between Bitcoin prices and the relative share price ratio remains intact. Were a knee-jerk rebound in the US dollar to knock down Bitcoin, at least temporarily, it would serve as a catalyst to shed chip equipment stocks (bottom panel, Chart 10). Moreover, 90% of the industry’s sales originate abroad, thus a rise in the greenback would eat into their P&L via FX translation losses. Adding it all up, a softening demand backdrop that is weighing on selling prices, the rekindling of the US/China tech-related trade war and a reflex rebound in the US dollar, all warn to shy away from semi cap stocks. Bottom Line: Stay underweight the S&P semiconductor equipment index. The ticker symbols for the stocks in this index are: BLBG S5SEEQ – AMAT, KLAC, LRCX. Home Improvement Retailers: Stay On The Sidelines Two weeks ago our trailing stop was triggered in the S&P home improvement retail index (HIR) and we monetized gains of 15% since the mid-April inception and moved to the sidelines. Today we reiterate our benchmark allocation in this consumer discretionary sub group. Clearly, HIR was a major beneficiary of the lockdown as the US and Canadian governments deemed these retailers “essential” and allowed them to stay open during the peak of the pandemic. These Big Box retailers saw their sales soar as the fiscal easing package replenished consumers’ wallets, and coupled with the lockdown, caused a surge in DIY remodeling activity. Our portfolio also greatly benefited from the stellar performance of the S&P HIR index, as existing home sales staged a significant comeback and inventories of homes for sale receded substantially thus further tightening the residential real estate market (top & middle panels, Chart 11). As reminder, historically a vibrant housing market is synonymous with handsome returns in relative share prices and vice versa. But now a number of stiff headwinds, which our HIR model encapsulates, signal that a lateral digestive move is in store in the coming months (Chart 12). Chart 11Unsustainable Front Running
Unsustainable Front Running
Unsustainable Front Running
Chart 12Stiff Headwinds
Stiff Headwinds
Stiff Headwinds
First, a repeat of the spike in demand for home improvement projects is highly unlikely, especially given that demand was brought forward. Also during the autumn and winter months there is a natural slowdown in the take-up of remodeling projects until the spring home selling season arrives. Second, the industry’s sales-to-inventories (S/I) ratio is literally off the charts (bottom panel, Chart 11). An inventory build-up and easing in demand will bring back the S/I ratio back to a more reasonable level. Lastly, lumber prices have taken a beating of late collapsing from over $900/tbf to below $600/tbf. This drubbing of this economically hypersensitive commodity directly cuts into HIR earnings. These Big Box retailers make a set margin on lumber sales so as prices fall they take a big bite out of profits (bottom panel, Chart 13). Nevertheless, a few offsets prevent us from turning outright bearish in this early cyclical retailers. Namely, the industry’s profit growth bar is on a par with the broad market and thus does not pose a large hurdle to overcome. Importantly, given that HIR earnings have kept pace with the massive run-up in stock prices (second panel, Chart 14), they have kept relative valuations at bay. While, the S&P HIR 12-month forward P/E trades at a market multiple, the relative forward P/E changes hands at a 20% discount to the historical mean. Thus, HIR enjoy a significant valuation cushion (bottom panel, Chart 14). Chart 13Timber!
Timber!
Timber!
Chart 14But There Are Powerful Offsets
But There Are Powerful Offsets
But There Are Powerful Offsets
Finally, the Fed just explicitly committed to stay on the zero interest rate line until 2023! This easy monetary policy as far as the eye can see is a powerful tonic to early cyclical and interest rate-sensitive home improvement retailers (fed funds rate shown inverted, top panel, Chart 14). Netting it all out, a balanced outlook keeps us on the sidelines in the S&P HIR index. Bottom Line: Stick with a benchmark allocation in the S&P home improvement retail index. The ticker symbols for the stocks in this index are: BLBG S5HOMI – HD, LOW. Anastasios Avgeriou US Equity Strategist anastasios@bcaresearch.com Current Recommendations Current Trades Strategic (10-Year) Trade Recommendations
Drilling Deeper Into Earnings
Drilling Deeper Into Earnings
Size And Style Views July 27, 2020 Overweight cyclicals over defensives April 28, 2020 Stay neutral large over small caps June 11, 2018 Long the BCA Millennial basket The ticker symbols are: (AAPL, AMZN, UBER, HD, LEN, MSFT, NFLX, SPOT, TSLA, V). January 22, 2018 Favor value over growth