United States

Highlights The great political surprises of 2016 are approaching key deadlines on November 3 and December 31. Investors should not let Brexit take their eye off the US election. Globalization will retreat faster under Trump regardless of what happens in the United Kingdom. The market is starting to price several clear risks: a failure to extend fiscal relief in the US (25% chance); a surprise Trump tariff move (40%); a contested election (20%); or a failure of the UK and EU to seal a deal (35%). Trump is unlikely to pull off a landslide like Boris Johnson in December 2019. The backdrop has darkened and Biden is an acceptable alternative for voters, unlike Jeremy Corbyn. Go long GBP-USD at the 1.25 mark; go long GBP-EUR volatility. Feature The end game is approaching for the two great political shocks of 2016 – Brexit and Trump. November 3 is the US election and December 31 is the deadline for an UK-EU trade deal. Investor sentiment is starting to show some cracks for various reasons, some technical (Chart 1). But we do not believe near-term volatility and risk-off sentiment have fully run their course yet. Either the US election cycle or the UK’s brinkmanship with the EU, or both, will agitate markets as the deadlines approach. The former is a much weightier factor. Chart 1Market Starts To Price Bevy Of Near-Term Risks ... But Cyclical View Still Constructive
Market Starts To Price Bevy Of Near-Term Risks ... But Cyclical View Still Constructive
Market Starts To Price Bevy Of Near-Term Risks ... But Cyclical View Still Constructive
The risks in play are a failure to extend fiscal relief in the US (25% chance); a conflict between Trump and one of America’s foreign rivals such as China, whether due to Trump’s reelection or lame duck status (40%); a contested election (20%); or a failure of the UK and EU to seal a deal, setting back their economic recovery (35%). Maybe all of these risks will dissipate by mid-November, but maybe not. The market has not discounted any of them fully. So investors should buy insurance now. Vox Populi Is The Biggest Constraint For global investors Brexit is far less consequential than President Trump’s “America First” policy but the UK does punch above its economic weight in financial markets (Chart 2). Chart 2Brexit: Why Should We Care? UK Punches Above Its Economic Weight In Financial Markets
Brexit: Why Should We Care? UK Punches Above Its Economic Weight In Financial Markets
Brexit: Why Should We Care? UK Punches Above Its Economic Weight In Financial Markets
Geopolitical analysis teaches that limitations on policymakers should be the starting point of analysis. For democracies, the biggest constraint of all is the vox populi – the voice of the people, or popular will. The Brexit movement faced a vociferous “Resistance” that won over the media and financial market consensus until reality struck in the general election of December 12, in which the Conservative Party won a historic victory. Chart 3Joe Biden Is Not Jeremy Corbyn
The End-Game For Trump And Brexit
The End-Game For Trump And Brexit
The election vindicated Prime Minister Boris Johnson’s brinkmanship and “hard Brexit” terms, while once again chastening the elites and experts – including an innovative Supreme Court. Johnson’s single-party majority, combined with COVID-19 and the surge in domestic economic stimulus, have increased the odds that the UK will choose sovereignty over the economy and walk away from trade talks. Trump’s supporters show the same enthusiasm as Brexiteers and the same scorn for conventional wisdom and opinion polls. Will they be similarly vindicated? Beyond any knee-jerk equity rally, that would entail a “Phase Two” trade war with China – and possibly a new trade war with Europe or a global trade war. However, Trump faces much worse odds than Boris Johnson did. First, Johnson’s snap election took place at the top of the business cycle, back when a novel coronavirus was just starting to be discovered in Wuhan, China. This is how Harry Truman won his surprise victory in 1948, in defiance of all the opinion polls. Had Truman run in 1949, after a deep recession, the story would have gone differently – which is a problem for both Trump and the near-term equity market. Second, the political alternative was not acceptable in the United Kingdom but it is in the United States. Johnson led Jeremy Corbyn, a far-left rival for the premiership, by around 15%-20% in the polls. The Conservative Party itself led the Labour Party by 10%. By contrast, former Vice President Joe Biden is a center-left Democrat who has many flaws but is not out of the mainstream. He leads President Trump in the polling, as do Democrats over Republicans, though only by single digits. There is no contest between Biden and Corbyn (Chart 3). Trump might still win, but an American version of the UK landslide in 2019 is unlikely. Trump will lose the popular vote even if he wins the Electoral College, and Republicans have a very slim chance of winning the House of Representatives. The implication for financial markets is doubly negative, at least in the near term: there is about a 35% chance that the UK will leave without a deal and about a 35% chance that Trump will win. He could also kick China in the interim period if he loses. Won’t stocks cheer a Trump comeback and victory? Perhaps, but a data-dependent approach suggests that a “blue sweep” is still the base case, and that would be a good trigger for a full equity correction. Nor would a Trump win be positive for long-term equity returns in the final analysis. Trump is reflationary, but a larger trade war would hamper the global economic recovery and thus keep earnings suppressed. There is a 35% chance that Trump will win re-election. Trump is unlikely to win the national vox populi, like Brexit did, but he obviously can win the popular vote in the critical regions – the Sun Belt and the Rust Belt. If he does, the revolution in the global system will be confirmed: the retreat of globalization will accelerate. If he does not, then Brexit alone cannot confirm de-globalization; rather the UK will face even more pressure to make concessions and get a trade deal. Trump’s Path To Victory Chart 4Sitting Presidents Win Half The Time If Recession Ends In H1
Sitting Presidents Win Half The Time If Recession Ends In H1
Sitting Presidents Win Half The Time If Recession Ends In H1
We may well be forced to upgrade Trump’s odds of winning if his comeback gains momentum. Our subjective odds of a Trump win come from the historical record – incumbent parties only retain the White House amid recessions five out of 13 times in American history – but there are some important exceptions. First, the longest-serving American president, Franklin Delano Roosevelt, served during the Great Depression. So obviously a bad economy does not always disqualify a president. Nevertheless FDR got lucky with the timing of the fluctuations and he was personally popular, unlike President Trump. Second, an incumbent president wins 50% of the time if the recession ends before the election – namely in 1900, 1904, and 1924 (contrasted with defeats in 1888, 1912, and 1980). Today’s market performance looks similar to these cases, though premature fiscal tightening is now jeopardizing Trump’s bid (Chart 4). Assuming new stimulus passes, it is extremely beneficial for President Trump that COVID-19 cases are subsiding (Chart 5). Chart 5COVID-19 Subsides In Nick Of Time For Trump?
The End-Game For Trump And Brexit
The End-Game For Trump And Brexit
Chart 6Even Approval Of Trump’s Pandemic Response Improving
The End-Game For Trump And Brexit
The End-Game For Trump And Brexit
His approval rating on handling COVID-19 is somewhat recovering at the moment (Chart 6). Trump’s “law and order” message is also benefiting him amid the rise in vandalism, rioting, and homicide, judging by his improvement in national approval rating across almost all demographic groups, including many that are otherwise averse to Trump. Finally, Trump’s Abraham Accords – a potentially major peace deal between Israel and an expanding list of Arab states – could give his image another boost (Table 1). Foreign policy will not decide the election but these peace deals should not be underrated because they underscore a more important argument for voters: that the US should withdraw from its endless foreign wars and pursue peace and prosperity instead. If Trump’s typically weak approval rating on foreign policy starts to rise then his comeback gains breadth. Table 1The Abraham Accords Give Boost To Trump Image As Peacemaker
The End-Game For Trump And Brexit
The End-Game For Trump And Brexit
We will upgrade our 35% odds of Trump’s re-election if Congress passes a new fiscal relief package, assuming Trump’s polling continues to improve. Our quantitative model is now giving Trump a 45% chance, which is in line with the consensus view but well above our subjective odds (Chart 7). We will upgrade our view if Congress passes a new fiscal relief package, assuming Trump’s polling continues to improve. Chart 7Quantitative US Election Model Puts Trump Win At 45% Odds
The End-Game For Trump And Brexit
The End-Game For Trump And Brexit
Chart 8Stimulus Hiccups Cause Market To Sell
Stimulus Hiccups Cause Market To Sell
Stimulus Hiccups Cause Market To Sell
The stock market does not perform well during periods in which fiscal cliff negotiations are prolonged – the failure of the Emergency Economic Stabilization Act in 2008 is one thing, but today’s impasse is more reminiscent of the debt ceiling crises of 2011 and 2013. Trump is now directly pressuring Senate Republicans to capitulate to House Democratic spending demands. If Republican senators abandon him, market turmoil will undercut his argument that he is the best man to revive the economy and he will lose the election (Chart 8). We do not think they will – and House Speaker Nancy Pelosi’s pledge to keep the House in session until a deal is passed is very positive news – but until the deal is sealed the market is vulnerable. As mentioned above we give a 25% chance of a failure to pass any stimulus bill in September or October. The next chance for stimulus will be in late January or February. Trump stands for growth at all costs, which will be received well by equity markets, other things being equal. But a Trump victory implies more trade war and that the GOP will retain the Senate, creating a steeper fiscal cliff next year – so any relief rally will be short-lived. Meanwhile a Trump defeat raises the risk he will take aggressive actions on the way out to cement his legacy as the Man Who Confronted China, and bind the Biden administration to decoupling policy. This is not a favorable outlook for investor sentiment or the economic recovery over the next few months. Brexit: The Three Kingdoms Will Force A Trade Deal Chart 9Sterling Will Fall Before It Bounces Back On A Deal
Sterling Will Fall Before It Bounces Back On A Deal
Sterling Will Fall Before It Bounces Back On A Deal
In December 2016 we pointed to the three kingdoms – England, Ireland, and Scotland – as the origin of the geopolitical and constitutional crisis that would arise from the Brexit referendum and act as a powerful bar against a no-deal Brexit. That framework remains salient today as the risk of no-deal escalates due to quarrels over Northern Ireland Protocol, which was agreed in October 2019 as part of the formal Withdrawal Agreement that made Brexit happen on January 31, 2020. The implication is that the pound has not bottomed yet, though we see a buying opportunity around the corner (Chart 9). No one should doubt that the UK could walk away from the EU without a deal this December: The Tories’ single-party majority gives them the raw capability to push through plans they decide on – and raises the risk that they will overreach. The tariff shock of a no-deal exit is frequently exaggerated. The UK would suffer a tariff shock of about 1.38% of GDP, larger than what the US suffered in its tariff-war with China but hardly a death knell (Table 2). (The costs of losing single-market access would grow over time, however.) Table 2A No-Trade-Deal Brexit Would Create A Minimum Tariff Shock Of 1.4% Of GDP
The End-Game For Trump And Brexit
The End-Game For Trump And Brexit
COVID-19 has supplanted the worst-case outcome of a no-deal exit by producing a much worse recession than anyone feared. The US is using the disruption to decouple from China and the UK could do the same with the EU. The result of COVID-19 is massive domestic stimulus that raises the UK’s and Europe’s threshold for pain. Any failure of trade talks would spur more stimulus. The Bank of England still has some bond-buying ammunition left and parliament, again, is undivided. Given that Boris Johnson has until 2024 before the next election, there is theoretically time for his personal and party approval ratings to improve as the economy recovers from the pandemic and any messy Brexit (Chart 10). Chart 10Bojo Has Until 2024 To Recover From Crises
The End-Game For Trump And Brexit
The End-Game For Trump And Brexit
Chart 11UK Would Face WTO-Level Tariffs If No Deal
The End-Game For Trump And Brexit
The End-Game For Trump And Brexit
The UK’s position in the quarrel over Ireland is rational – but so is the EU’s. If the trade talks collapse, the UK will need to remove any regulatory or customs divisions with Northern Ireland. Yet in preparing to do so it vitiates trust with the EU and makes a trade deal less likely. However, weighing all these points up, an UK-EU trade deal is still the most likely outcome (65% chance), as the economic and political costs are crystal clear while the benefits of a hard break are not so clear. Allow us to explain. Northern Ireland is the latest cause of tensions, although it was inevitable that tensions would arise ahead of the end-of-year deadline for a trade deal. Westminster has proposed an Internal Market Bill, which has passed with solid majorities in two readings in parliament, to reclaim aspects of sovereignty over Northern Ireland that were traded away to clinch the Withdrawal Agreement last year. The Johnson government’s position should be seen as a negotiating tactic to build leverage in the talks but also as a real fallback position if the talks fail. The House of Lords could delay the bill by a year, meaning that it may not take effect until end of 2021 – but a trade deal would make it moot. The Northern Ireland Protocol solved the riddle of how to preserve the integrity of the EU’s single market after Brexit yet avoid a return to a hard customs border with the Republic of Ireland. Customs checks were removed with the Good Friday (or Belfast) Agreement in 1998, which ended the Troubles between the two Irelands. The Protocol introduces a pseudo-customs border on the Irish Sea, requiring declarations on exports to Great Britain and EU oversight of UK state aid for Northern Irish firms, so that Northern Ireland can stay in the EU customs area while the UK can leave and still preserve a semblance of its own customs area in Northern Ireland. If the UK and EU get a trade deal, then all trade is tariff-free and the Protocol becomes redundant. Also, the Protocol enables a Joint Committee to review disputes over exports to Northern Ireland that are “at risk” of making their way into the EU without duties. The Protocol is supposed to operate even if the UK and EU fail to get a trade deal. Yet it is politically untenable for the UK to subject trade within its own country to EU rules or duties, or allow the EU to supervise state corporate subsidies across the UK, if no deal is agreed. The UK is more likely to violate the treaty to preserve its internal integrity. As Northern Ireland Secretary Brandon Lewis admitted, “Yes, this [Internal Market Bill] does break international law in a very specific and limited way.” While the EU’s threat to slap tariffs on British food exports to Northern Ireland is the proximate trigger of the Internal Market Bill, another key reason for the UK’s aggressive shift is the issue of state aid. All governments are extending emergency aid to major corporations to keep them from insolvency amid the recession. This will be the case for some time and it is even more true of the EU than of the United Kingdom. However, under the Protocol, the EU would be able to penalize companies in Great Britain that receive subsidies if goods or firms in Northern Ireland can be shown to benefit. Northern Ireland is supposed to operate within the EU’s standards on state aid. London obviously bristles at this backdoor for letting in EU regulation, not least because, in the event that a trade deal is not reached, it will need to pump the country full of state aid to compensate for the shock of seeing exports to the EU rise by 3% across the board according to Most Favored Nation status under the World Trade Organization (Chart 11). An UK-EU trade deal is the most likely outcome. As Dhaval Joshi of BCA’s European Investment Strategy points out, Boris needs to keep his own Tories under his heel (Chart 12). The Internal Market Bill provoked a backlash among 30 moderates. If that number rises to 40 Johnson loses his majority. This is a problem that he is seeking to address by giving parliament a veto over any future uses of the bill that would violate international law (this is an acceptable compromise because he has a majority). But a failure to drive a hard bargain with the EU would cause a much bigger rebellion among hard Brexit Conservative MPs and threaten his job. Chart 12Bojo Must Balance Hard Brexit Tories
The End-Game For Trump And Brexit
The End-Game For Trump And Brexit
Geopolitics is about might, not right – the UK can assert its sovereignty and violate these international agreements, while the EU can then apply punitive tariffs, non-tariff barriers, and sanctions under the Withdrawal Agreement. Brexit is a power-political struggle that could devolve into a trade war. Obviously that would be a very bad outcome for the market, particularly for the UK, which is overmatched (Chart 13). But this risk is also a key limitation on the UK that will prevent this worst-case outcome. Indeed, despite all of the above, our base case is still that the UK and EU will get a deal. First, the economy will clearly suffer without a deal. After all, the US-China tariffs produced a negative effect for these two economies in 2019 and the impact on the UK would be bigger than that on the US (Chart 14). Chart 13The Brick Wall The UK Cannot Avoid
The Brick Wall The UK Cannot Avoid
The Brick Wall The UK Cannot Avoid
Chart 14UK Faces Trade Shock If No Deal
UK Faces Trade Shock If No Deal
UK Faces Trade Shock If No Deal
Second, the public doesn’t support a no-deal exit (Chart 15). Northern Ireland itself voted against Brexit in the referendum and as such would rather see an agreement that groups the UK and the EU under a single zero-tariff free trade agreement. Third, Boris faces a rebellion in Scotland if he pursues a hard break. The Scottish National Party would revive ahead of Scottish elections in May 2021 and demand a second independence referendum (Chart 16). The Irish Sea is a natural division that makes a more intrusive customs presence more supportable than otherwise. A little more paperwork is an acceptable cost to keep the United Kingdom from falling apart. Scotland is much more likely to go independent than Ireland is to unite. Chart 15Only 25% Think 'No Deal' A Good Outcome
The End-Game For Trump And Brexit
The End-Game For Trump And Brexit
Boris is now prime minister, not just party leader, and he will ultimately have to decide whether he wants to be the last prime minister of a United Kingdom. Assuming Boris is at least focused on the next election, he will have to decide if he wants the rest of his premiership to be consumed with a self-inflicted double-dip recession and democratic revolt in Scotland, or a recovery on the back of a functional if uninspiring trade deal enabling him to head off the Scottish threat and save the union. Chart 16No Deal' Would Boost Scottish Independence Movement
No Deal' Would Boost Scottish Independence Movement
No Deal' Would Boost Scottish Independence Movement
Obviously the final deal may not be clinched until the eleventh hour. The October 15 deadline can be delayed but talks must conclude in November or December in time to be ratified by the EU member states by December 31. US Election Drives Geopolitics, But Not The Brexit Outcome One factor that will not play much of a role in the UK’s decision-making is the US election. It is true that the Johnson government would benefit from President Trump’s reelection. But the EU is a much bigger market for the UK and the UK’s best strategy is to focus on its national interest regardless of what the US does. The US election may not be decided in mid-December in time for the UK to agree to a deal that can be ratified by year’s end anyway. Moreover the UK’s best strategy is to conclude a deal with the EU first, and then pursue a deal with the United States. This is because President Trump will be inclined to sign at least an executive deal, while a congressional deal requires support from the Democrats, which is only possible if Northern Ireland is resolved without hard border checks. Because the EU makes up such a larger share of British trade, an American deal does not give the UK much leverage in negotiating with the EU, but an EU deal does give the UK greater leverage in negotiating with the US. As Diagrams 1 and 2 show, this strategic logic holds even if the UK knows the outcome of the US election ahead of time: the scenarios with the least benefit and the greatest cost would still be scenarios involving no deal with the European Union. Diagrams 1 & 2United Kingdom Wants An EU Trade Deal (Regardless Of Trump/Biden)
The End-Game For Trump And Brexit
The End-Game For Trump And Brexit
Diagram 3 boils all of this down to a single decision tree. First, the diagram shows that the economic costs are not prohibitive and therefore the risk of a no-deal exit is substantial – we would say 35%. Second, it shows that the risks of the negotiation are skewed to the downside. Third, it highlights that the UK will settle its affairs directly with the EU and not hinge its actions on the US election cycle. Diagram 3No-Deal Brexit Cost Not Prohibitive, But Best Strategy Is To Get A Deal
The End-Game For Trump And Brexit
The End-Game For Trump And Brexit
Clearly the best strategy and best outcome involve seeking a trade deal with the EU, and hence it is our base case. This means an opportunity to buy the pound and domestic-oriented British equities, and turn neutral on gilts, is just around the corner. Investment Takeaways The GBP-EUR is the best measure of the market’s sensitivity to Brexit risks, so it should fall in the near term and rally sharply after resolution. However, the US election complicates things. The euro’s response is fairly binary: it is one of the biggest winners if Biden wins and one of the biggest losers if Trump wins. Hence GBP-EUR volatility will rise in the coming months (Chart 17). We recommend going long 1-month implied volatility contracts for October and November. The pound sterling, by contrast, will ultimately rise regardless of US election result, since the UK will pursue a trade deal out of its own national interest. Trump is less negative for the US dollar than Biden and a comeback and victory will drive a counter-trend dollar bounce. However, in the medium term we expect the dollar to fall regardless due to debt monetization and global growth recovery. Thus we recommend going long GBP-USD on a strategic basis when political risks peak over the next two-to-three months and GBP-USD falls to around 1.25, as recommended by our Foreign Exchange Strategist Chester Ntonifor (Chart 18). Chart 17EUR-GBP Volatility Will Rise
EUR-GBP Volatility Will Rise
EUR-GBP Volatility Will Rise
Sterling bears are forgetting that the sound defeat of Corbyn ruled out a sharp left-wing turn in domestic economic policy (higher taxes), while the Tories have made a clear turn against fiscal austerity. Therefore the worst-case scenario is a failure to agree to a trade deal by the end of this year. But that is not the base case and the risk will be priced within a month or two. Chart 18Pound Will Rally After Deal Concluded In November Or December
Pound Will Rally After Deal Concluded In November Or December
Pound Will Rally After Deal Concluded In November Or December
Chart 19Yes, China Is Opening The Taps
Yes, China Is Opening The Taps
Yes, China Is Opening The Taps
We remain tactically cautious and defensive even though the US fiscal negotiations are improving. The market is underrating too many clear and concrete risks to sentiment and the corporate earnings outlook, so the current bout of volatility can continue until there is greater clarity on US fiscal spending, the US election cycle, associated geopolitical risks, and the Brexit showdown. Book gains on long Brent trade for a return of 69.7%. We initiated this trade on March 27 in our “No Depression” report, which marked our shift to a strategic risk-on positioning. We remain bullish on oil prices and commodities on the back of global stimulus and our assessment that the OPEC 3.0 cartel will maintain discipline overall, but the next three-to-six months are crowded with downside risk. Cyclically, we see a global economic recovery deepening and broadening. China’s stimulus is surprising to the upside, as we have long written and the latest credit numbers bear this view out (Chart 19), which is critical for global reflation. Matt Gertken Vice President Geopolitical Strategy mattg@bcaresearch.com
Highlights If it can maintain production discipline over the next 2-3 years, OPEC 2.0 will be the oil market’s most important determinant of price levels for years. The massive increase in OPEC 2.0 spare capacity resulting from COVID-19-induced demand destruction, along with its low-cost production, global storage and distribution will allow it to bring crude to market quicker than US shale-oil producers, and to manage an orderly drawdown in global inventories, which remains its raison d'être. As spare capacity is drawn down over the next couple of years, Brent and WTI forward curves will backwardate in in 1H21, as spare capacity and the slope of the forward curve are inversely related (lower spare capacity leads to higher backwardation). This will keep spot prices realized by OPEC 2.0 states above the deferred prices at which shale producers hedge (Chart of the Week). Parsimonious capital markets will continue to deny funding to all but the most profitable producers, which will continue to limit E+P ex-OPEC 2.0. ESG-focused investments will increasingly favor energy producers outside the oil and gas sector. As demand growth resumes, this will sow the seeds for higher oil prices in the mid-2020s. We will be updating our oil balances and 2H20 and 2021 forecasts – $46/bbl and $65/bbl for Brent in 2H20 and 2021 – next week. Feature While the hit to oil producers’ revenues from the demand destruction caused by the COVID-19 pandemic has been severe – particularly for those states comprising OPEC 2.0, which are so heavily dependent on oil exports – it set the stage for the producer coalition to take control of global oil-price dynamics for the next couple of years. If the OPEC 2.0 coalition can maintain its production discipline, its member states could extend this control for years into the future, just as they are attempting to diversify their economies from this dependence on hydrocarbons. Once OPEC 2.0 member states manage to diversify a large part of their economies, the next optimal strategy will be to monetize their reserves and market share. Until then, it is our contention it is in these states' interest to have higher prices via gaining control of supply. The producer coalition led by the Kingdom of Saudi Arabia (KSA) and Russia today sits on some 7mm b/d of spare capacity that is a direct result of the global collapse in demand. This gives it a powerful lever to restrain the recovery of production growth in the US shales and elsewhere. Spare Capacity Turns The Tables On Shale Oil The enormous spare capacity now held by OPEC 2.0 – the majority of which is in KSA – allows the coalition to turn the tables on the US shales and producers ex-US Since its inception in late 2016, OPEC 2.0 has accommodated higher US shale production by reducing its output and then expanding it at a slower rate, as US production soared to meet domestic demand and, increasingly, global oil demand (Chart 2). OPEC 2.0 has been in operation since January 2017. Over that period, the coalition reduced its output growth ~ 0.37% for every 1% increase in crude and liquids output ex-OPEC 2.0. Within that adjustment, OPEC 2.0’s output falls by 0.16% for every 1% increase in US output, most of which was accounted for by the unprecedented growth of shale production.1 The enormous spare capacity now held by OPEC 2.0 – the majority of which is in KSA – allows the coalition to turn the tables on the US shales and producers ex-US (Chart 3). Chart of the WeekFalling OPEC 2.0 Spare Capacity Will Backwardate Brent Forward Curves
Falling OPEC 2.0 Spare Capacity Will Backwardate Brent Forward Curves
Falling OPEC 2.0 Spare Capacity Will Backwardate Brent Forward Curves
Chart 2OPEC 2.0 Accommodated US Shales
OPEC 2.0 Accommodated US Shales
OPEC 2.0 Accommodated US Shales
Chart 3OPEC 2.0 Would Benefit From Maintaining Spare Capacity At High Levels
OPEC 2.0 Would Benefit From Maintaining Spare Capacity At High Levels
OPEC 2.0 Would Benefit From Maintaining Spare Capacity At High Levels
Along with its low-cost production, global storage and distribution, this spare capacity allows OPEC 2.0 member states to bring crude to market quicker than US shale-oil producers as the need for additional supply becomes apparent. This was demonstrated earlier this year by KSA when it engaged in a brief market-share war with Russia following the breakdown of negotiations to extend OPEC 2.0’s production cuts.2 The spare capacity also allows the coalition to manage an orderly drawdown in global inventories, which remains its raison d'être, by making crude available out of production on short notice. As a result, Brent and WTI forward curves will backwardate in 1H21, keeping spot prices realized by OPEC 2.0 states above the deferred prices at which shale producers hedge. By keeping forward curves backwardated, the amount of revenue – i.e., price x quantity – hedged is limited by lower forward prices vs. spot prices. This limits the volume of oil a producer can bring to market in the future. Extending OPEC 2.0’s Low-Cost Spare Capacity In the near term, we expect OPEC 2.0’s production to come back faster and stronger than that of the US shales. The advantage OPEC 2.0 realizes from holding spare capacity – KSA in particular – can be extended at low cost going forward.3 And, if OPEC 2.0 communicates its intent to maintain spare capacity at higher levels than have prevailed recently, as was indicated last week by Aramco’s CEO, who announced KSA intends to raise capacity 1mm b/d to 13mm b/d, this could, at the margin, disincentivize investment in production ex-OPEC 2.0 in the future.4 Developing spare capacity for low-cost producers like Aramco is akin to building a portfolio of deep-in-the-money options to increase output quickly at minimal expense. These options can be exercised – i.e., output can be increased in short order at low cost – before competitors can mobilize to meet the market need. What makes this strategy credible is KSA’s capacity to surge production and put oil on the water in VLCCs at astonishing speed, as noted above vis-à-vis the breakdown in negotiations earlier this year in Vienna to extend production cuts. In the near term, we expect OPEC 2.0’s production to come back faster and stronger than that of the US shales (Chart 4). This will allow them to begin rebuilding revenues sooner as demand recovers (Chart 5). Any demand increase in excess of OPEC 2.0’s flowing supply – which could be restrained to force refiners to draw storage (Chart 6) – can be met with spare capacity and storage held or controlled by coalition members. Chart 4OPEC 2.0 Supply Recovers Faster Than US Shales
OPEC 2.0 Supply Recovers Faster Than US Shales
OPEC 2.0 Supply Recovers Faster Than US Shales
Chart 5Rate Of Demand Growth Will Exceed Supply Growth
Rate Of Demand Growth Will Exceed Supply Growth
Rate Of Demand Growth Will Exceed Supply Growth
Chart 6Forcing Inventories Lower
Forcing Inventories Lower
Forcing Inventories Lower
Capital-Market Parsimony Will Tighten Supply Equity investors have abandoned the oil and gas sector, as can be seen in the collapse in the percentage of the overall market accounted for by energy stocks (Chart 7). Chart 7Energy Share Of Overall Market Collapses
Energy Share Of Overall Market Collapses
Energy Share Of Overall Market Collapses
This no doubt is fueled by underperformance vs. technology stocks and other alternatives available to investors, and to a migration toward Environmental, Social, and Corporate Governance (ESG) investing (Chart 8). Indeed, as our colleagues in BCA’s Global Asset Allocation Strategy noted, “ESG-related equities have outperformed global benchmarks over the past two years, as well as during the recent equity selloff.” In addition, “green energy” investments account for half of the $300 billion G20 governments have allocated to clean energy policies and renewable energy programs as part of the COVID-19 fiscal stimulus deployed worldwide.5 Chart 8ESG Investment Surge
Oil's Next Bull Market, Courtesy Of COVID-19
Oil's Next Bull Market, Courtesy Of COVID-19
We believe this combination of a long-standing aversion to oil and gas equities and OPEC 2.0’s clear advantage in terms of its spare capacity, low-cost production and global storage and distribution networks will result in under-funding of new E+P, and will lead to a tighter market by the mid-2020s. This is particularly true for oil, which, is not confronting the competitive threat faced by natural gas vis-à-vis renewable energy. We will continue to develop these themes, and subject this thesis to fiery critique, borrowing from Kant’s methodology.6 Risks To Our View There are two major risks to the thesis developed here: OPEC 2.0 breaks down, as it came close to doing earlier this year (discussed above). A breakdown of the coalition would lead to lower E&P investment via very low oil prices that almost surely would occur if this were to happen. This would be a far more volatile path to higher prices, which also would discourage investment. A battery-technology breakthrough that makes electric vehicles viable – i.e., unsubsidized – competitors to internal-combustion engine technology powering the vast majority of transportation. We expect Brent and WTI forward curves to backwardate in 1H21, keeping spot prices realized by OPEC 2.0 states above the deferred prices at which shale producers hedge. Bottom Line: OPEC 2.0’s massive spare capacity resulting from COVID-19-induced demand destruction, its low-cost production and global storage and distribution network allow it to take control of crude-oil pricing dynamics over the next couple of years. These endowments also allow it to orchestrate an orderly drawdown in global inventories, which remains its raison d'être. As a result, we expect Brent and WTI forward curves to backwardate in 1H21, keeping spot prices realized by OPEC 2.0 states above the deferred prices at which shale producers hedge. Parsimonious capital markets and a preference for ESG-focused investment will increasingly favor energy producers outside the oil and gas sector. As demand growth resumes, this will sow the seeds for higher oil prices in the mid-2020s. Robert P. Ryan Chief Commodity & Energy Strategist rryan@bcaresearch.com Hugo Bélanger Associate Editor Commodity & Energy Strategy HugoB@bcaresearch.com Commodities Round-Up Energy: Overweight JKM and TTF natural gas prices are up 49% and 27% over the past four weeks. The price spreads for December 2020 futures contracts between the US and Europe and Asia reached $1.6/MMBtu and $1.9/MMBtu this week. This will support the ongoing recovery in US LNG exports – which was briefly halted last month by Hurricane Laura – during the coming winter season (Chart 9). Separately, Libyan oil exports could be set to rebound following statements by General Haftar – the leader of Libyan National Army (LNA) – that he was committed to lifting the current blockade on the country’s exports, according to the US Embassy in Libya. Base Metals: Neutral China’s expansionary monetary and fiscal stimulus continued in August. The country’s total social financing (TSF) climbed past market expectations of CNY 2.59 trillion to CNY 3.58 trillion (Chart 10). This will provide further support to base metals prices – chiefly copper – over the coming months. The increase in TSF reflects the strong local government bond issuance and reinforces our view that the recovery in copper prices will be policy-driven – i.e. dictated by Chinese policymakers’ decisions on the allocation of total social financing funds in its economy with domestic supply adjusting to demand. Precious Metals: Neutral Palladium prices are up 7% since the beginning of September, supported by rebounding car sales and production in China. In August, vehicle sales grew by 12% y/y. We expect fiscal and credit stimulus in the country will allow car sales to continue growing y/y in the coming months. Ags/Softs: Underweight Soybean prices remain strongly bid, looking to re-test 2018 highs. The latest weekly USDA crop progress report indicated continued deterioration in the number of soybean crops in good or excellent condition. Investor sentiment is fueled by China maintaining its promise to import record amounts of U.S. agricultural goods this year, as part of the Phase 1 trade deal. Last week, the U.S. Agriculture Department reported that Chinese buyers booked deals to buy 664,000 tonnes of soybeans, the largest daily total since July 22. Chart 9LNG
LNG
LNG
Chart 10COPPER PRICES
COPPER PRICES
COPPER PRICES
Footnotes 1 These estimates were generated by an ARDL model used to determine the sensitivity of OPEC 2.0 total liquids output to non-OPEC 2.0 production and consumption. 2 For a recap of this market-share war, please see KSA, Russia Will Be Forced To Quit Market-Share War, which we published March 19, 2020. It is available at ces.bcaresearch.com. Briefly, KSA put millions of barrels on the water in a matter of months after Russia launched its market-share war at the end of OPEC’s March 2020 meeting in Vienna. This demonstrated an ability to mobilize supply and deliver it that greatly surpassed the eight-month time frame we estimate is required for shale production to reach the market after prices signal the need for additional crude. 3 Please see The $200 billion annual value of OPEC’s spare capacity to the global economy published by The King Abdullah Petroleum Studies and Research Center (KAPSARC) July 17, 2018, for a discussion of the global impact of KSA’s spare capacity. 4 Please see Aramco CEO: Saudi Arabia to raise oil production capacity to 13 million barrels per day published by Oil & Gas World Magazine September 9, 2020. 5 Please see ESG Investing: From Niche To Mainstream, published by BCA’s Global Asset Allocation Strategy August 25, 2020. It is available at gaa.bcaresearch.com. 6 Please see O’Shea, James R. (2012), “Kant’s Critique of Pure Reason, An Introduction and Interpretation,” Acumen Publishing Limited, Durham, UK. Investment Views and Themes Recommendations Strategic Recommendations Tactical Trades Trade Recommendation Performance In 2020 Q2
Lower Vol As OPEC 2.0 Gains Control
Lower Vol As OPEC 2.0 Gains Control
Commodity Prices and Plays Reference Table Trades Closed in 2020 Summary of Closed Trades
Lower Vol As OPEC 2.0 Gains Control
Lower Vol As OPEC 2.0 Gains Control
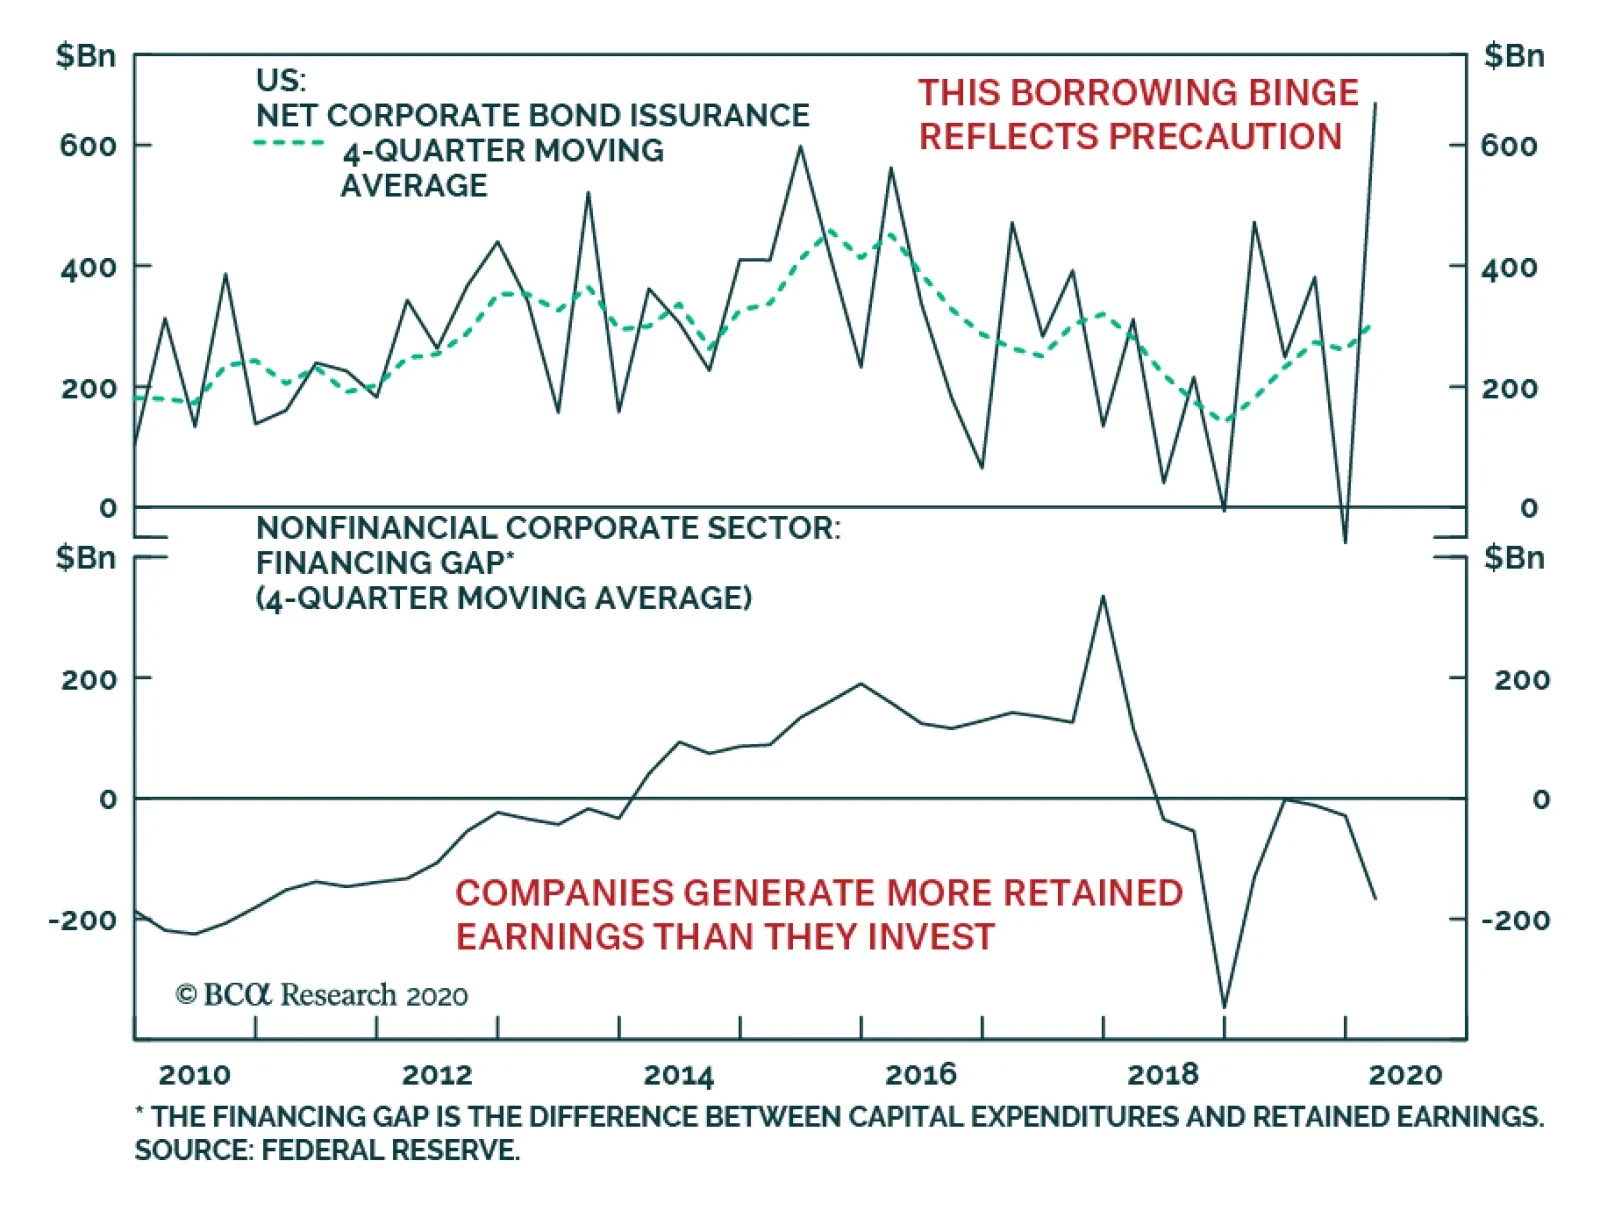
Global corporate debt issuance is exceptionally strong in 2020 and, according to Bloomberg, has reached $2.6 trillion so far this year, a record. The rise in corporate leverage has many commentators and the press sounding alarm bells about the risk of…
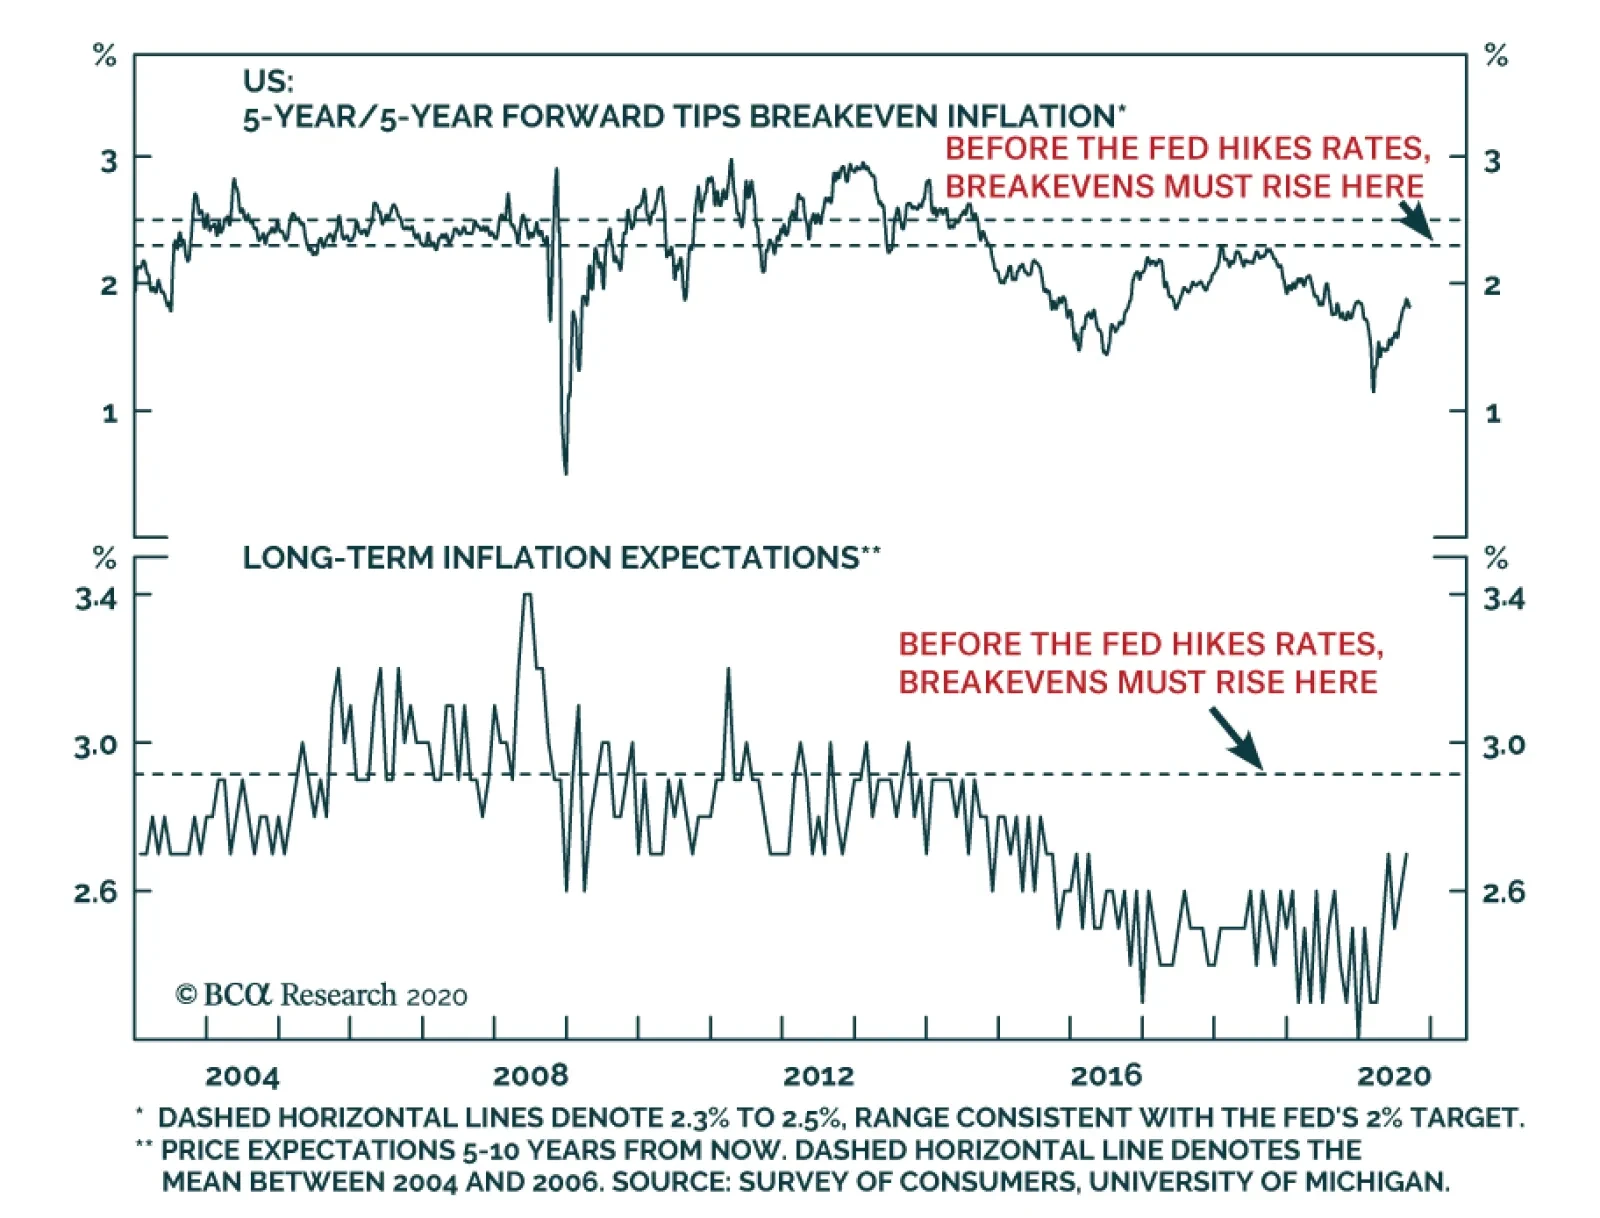
While the Federal Reserve did not adjust policy on Wednesday, Fed Chair Powell set out to clarify the parameters surrounding policy tightening under the new average inflation framework announced at the Jackson Hole symposium. The Fed has chosen a…

Lofty Valuations
Lofty Valuations
Undoubtedly, the SPX is fully valued trading near an all-time 12-month forward P/E multiple and an all-time high trailing P/S ratio. Correcting the forward P/E multiple for the 5-year forward growth rate and creating an S&P 500 forward P/E/G ratio is revealing. The SPX P/E/G ratio has exploded to 4 standard deviations above the historical mean (using I/B/E/S data back to 1985) with a 2 handle. Not only the jump in the 12-month forward P/E (courtesy of a gap down in EPS) has slingshot the P/E/G ratio to the stratosphere, but also sell-side analysts throwing in the towel in long-term SPX EPS growth projections has contributed to the SPX P/E/G ratio's parabolic rise. Such exuberance is clearly unsustainable. Our sense is that the S&P 500 P/E/G ratio will come back down to earth as the trifecta of rising 12-month EPS estimates, sideways to lower move in the SPX in the near-term and a recovery in the 5-year EPS growth rate, will exert enormous gravitational pull. Bottom Line: We continue to recommend investors keep some powder dry and refrain from deploying capital at the current juncture. A better entry point in the broad equity market will likely materialize in late Q4.
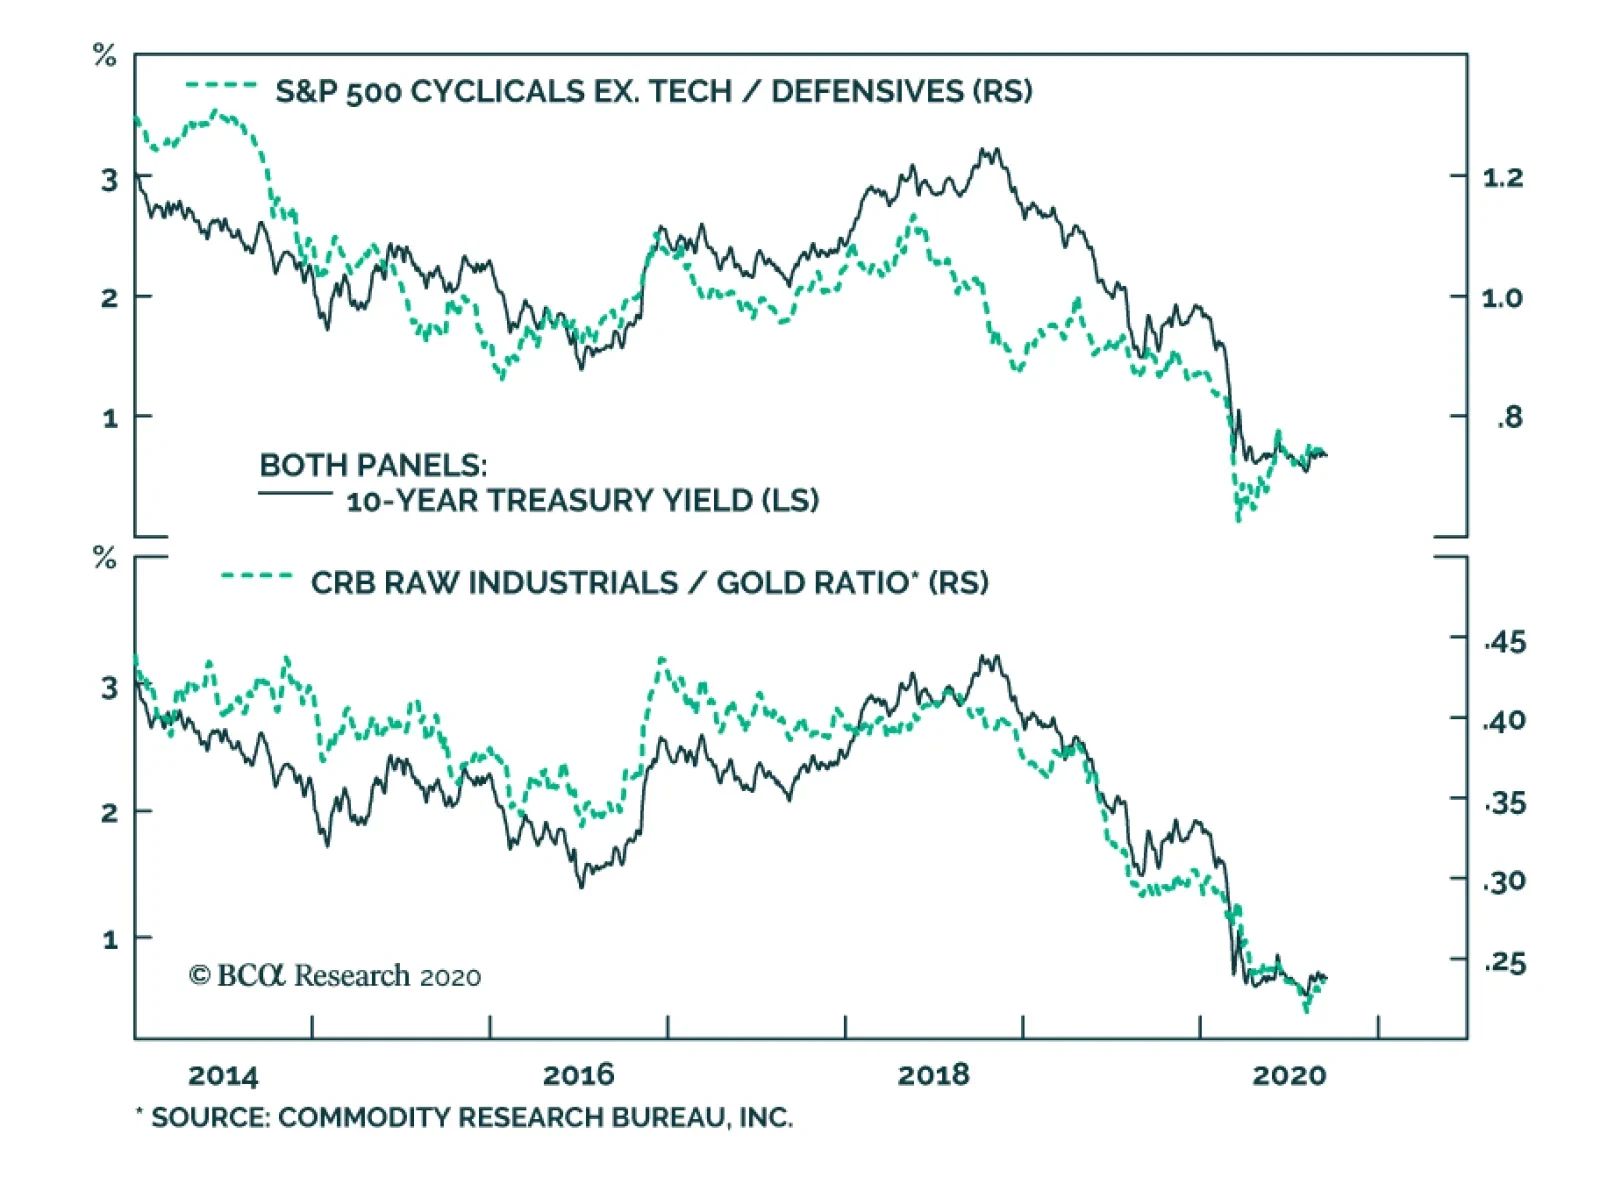
BCA Research's US Bond Strategy service assess the tech stock sell off and its implications on bonds. Bond yields correlate most strongly with: The performance of cyclical equities over defensive equities. The ratio of CRB Raw Industrials over…
Many commentators have quipped that we are not in a V-shaped, nor a U-shaped or W-shaped recovery but a K-shaped one where a few winners are reaping large gains while considerable segments of the economy are under extreme duress. Paradoxically, strong…
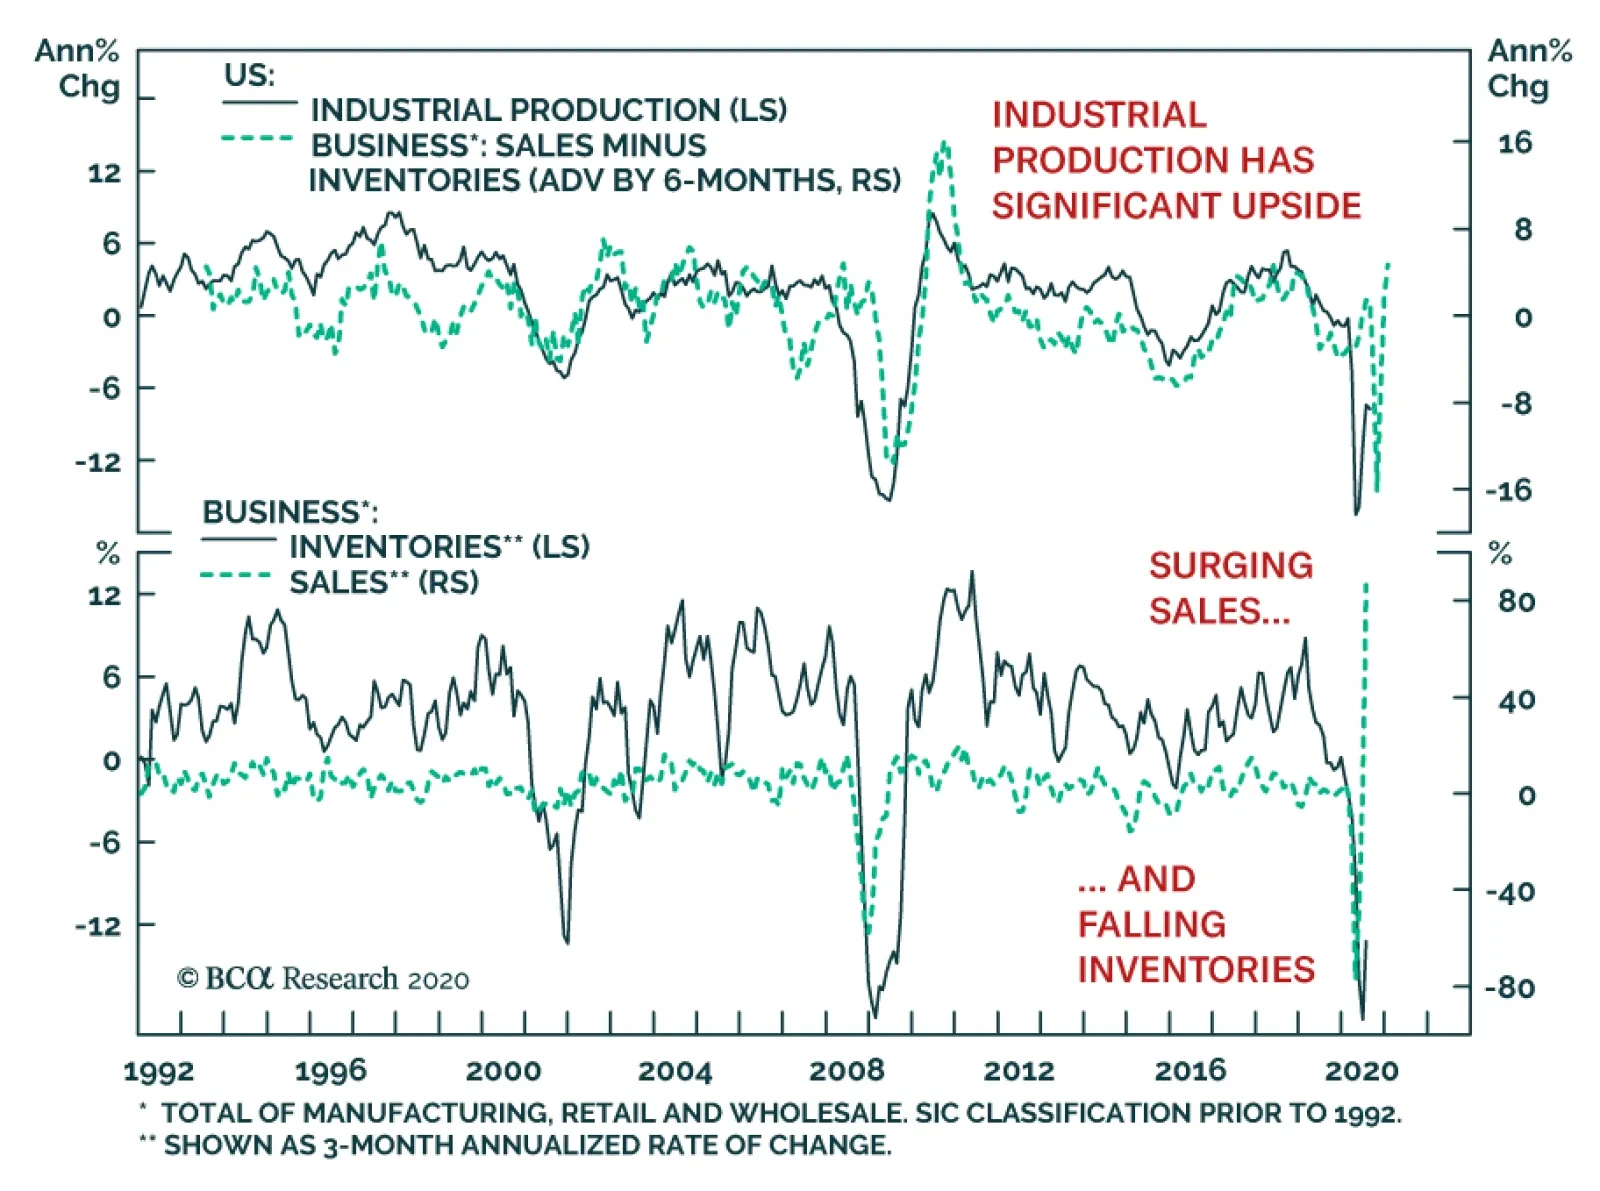
In response to the production shutdowns and decreased run rates that have plagued the US and global economy since March, US inventories contracted at their quickest three-month rate since the depth of the Great Financial Crisis. Yet, as the economy re-opens…
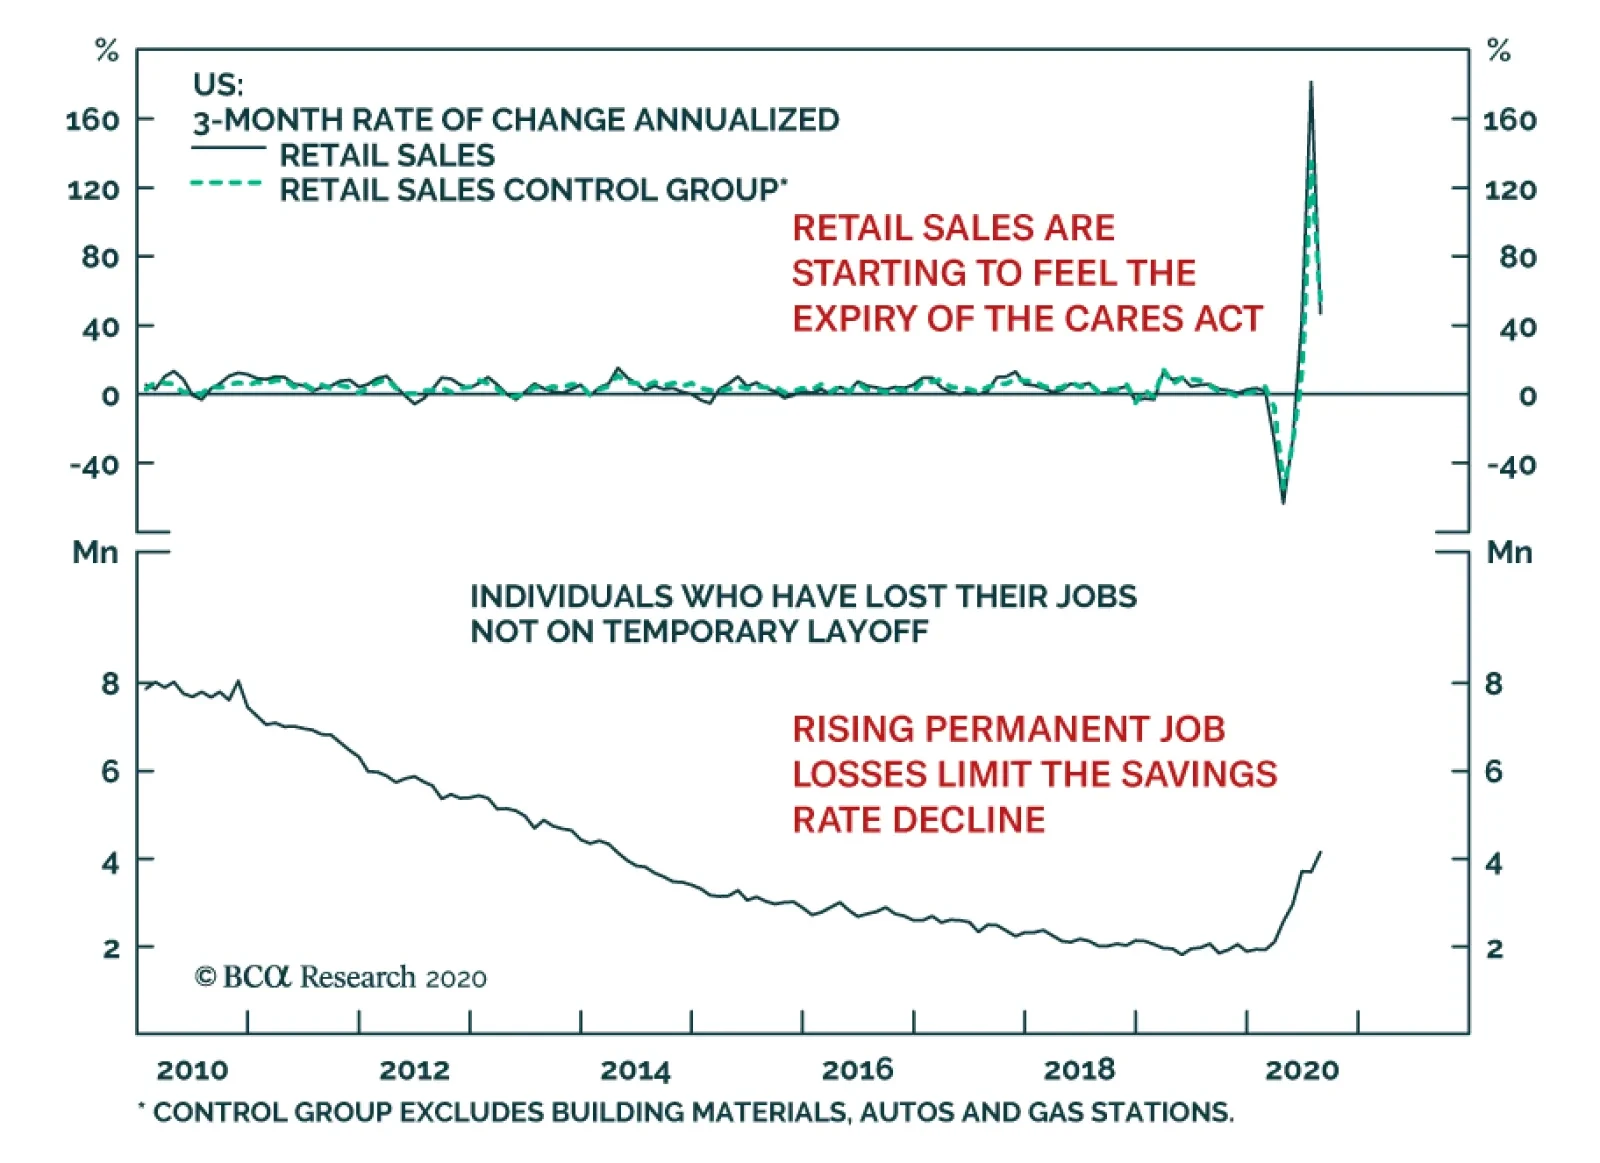
August's retail sales print came in weaker than expected at 0.6% month over month, missing expectations of 1% and down from July's revised print of 0.9%. Meanwhile, the retail sales control group actually contracted by 0.1% and failed to meet expectations of…
Materials Are On Fire
Materials Are On Fire
Overweight We reiterate our recent upgrade to overweight in the S&P materials sector. Since the late-July inception, materials stocks have been steadily climbing and also propelling our cyclicals/defensives portfolio bent. Given the rosy macro outlook more gains are in store. Materials stocks are hyper-sensitive to the global reflation cycle and China’s aggressive stimulus is reverberating across the Pacific. Namely the Chinese are opening up the fiscal and credit taps at a breakneck pace (bottom panel). Already, the economy is responding and has likely returned to the trend growth trajectory observed prior to the pandemic. The Chinese bond and stock markets are heeding the message of the authorities and corroborate that the economic recovery is gaining steam (top panel). All of this suggests that global trade is on the mend and the commodity-laden S&P materials sector remains in the driver’s seat. Bottom Line: Stay overweight the S&P materials index.