United States

Highlights EM domestic fundamentals, global trade and commodities prices, as well as global financial market themes are the main drivers of EM financial assets and currencies. The positive effect of improving global growth and rising commodity prices on EM currencies (ex-China, Korea and Taiwan) has been offset by these countries’ inferior domestic fundamentals. The odds of a near-term US dollar rebound are rising. This will likely produce a setback in EM currencies, fixed-income markets and equities. However, such a setback will likely prove to be a buying opportunity. Increased central bank intervention in asset markets may diminish the importance of fundamentals in determining the asset prices. Feature Chart I-1Unusual Divergences
Unusual Divergences
Unusual Divergences
EM risk assets have done well in absolute terms but have underperformed their DM counterparts. This is unusual given the substantial weakness in the US dollar and the rally in commodities prices since April (Chart I-1). Until early this year, many commentators had argued that monetary policies of DM central banks were the principal drivers of EM financial markets. Given the zero interest rates and money printing that is prevalent in DM, the underperformance of EM equities and currencies is especially intriguing. Is this underperformance an aberration or is it fundamentally justified? What really drives EM performance? Back To Basics As we have argued over the years, EM risk assets and currencies are primarily driven by their domestic fundamentals, rather than by the actions and policies of the US Federal Reserve or the ECB. The critical determinant of EM stocks’ absolute as well as relative performance versus DM equities has been corporate profits. Chart I-2 illustrates that relative equity performance and relative EPS between EM and the US move in tandem, both in common and, critically, local currency terms. Similarly, the main reason why EM share prices in absolute terms have failed to deliver positive returns over the past 10 years is that their profits have been stagnant over the same period, even prior to the pandemic (Chart I-3). Interestingly, fluctuations in EM EPS resemble those of Korea’s exports. This reflects the importance of global growth in shaping EM profit trends. Chart I-2Corporate Profits Drive EM Absolute And Relative Performance
Corporate Profits Drive EM Absolute And Relative Performance
Corporate Profits Drive EM Absolute And Relative Performance
Chart I-3EM EPS Has Been Flat For 10 Years
EM EPS Has Been Flat For 10 Years
EM EPS Has Been Flat For 10 Years
The key drivers of EM risk assets and currencies have been and remain: 1. EM domestic fundamentals that can be encapsulated by a potential risk-adjusted return on capital. The latter is impacted by both cyclical and structural growth trajectories, as well as by the quality and composition of growth. Risks to growth can be gauged based on factors such as (but not limited to): productivity, wages, inflation, fiscal and balance of payment positions, the global economic and financial environment, and the health of the banking system. In EM (ex-China, Korea and Taiwan), the fundamentals remain challenging: The business cycle recovery is slower in these economies than it is in China and advanced economies. Fiscal stimulus has not been as large as in many advanced countries, while the pandemic situation has been worse. Their banking systems were already fragile before the pandemic, and have lately been hit by defaults stemming from the unprecedented recession. These governments have less room than in DM and China, to stimulate fiscally and bail out debtors and banks. Banks in EM (ex-China, Korea and Taiwan) will continue struggling for some time, and their ability to finance a new expansion cycle will, for now, remain constrained (Chart I-4). A restructuring of non-performing loans and a recapitalization of banks will be required to kick-start a new credit cycle in many of these economies. 2. Global growth, especially relating to China’s business cycle and commodities. The recovery in China since April, along with rising commodities prices have been positive for EM (ex-China, Korea and Taiwan). Given the substantial stimulus injected into the Chinese economy, its recovery will continue well into next year (Chart I-5). As a result, higher commodities prices will benefit resource producing economies by supporting their balance of payments and enhancing income growth. Chart I-4EM ex-China: Limited Bank Support For Growth
EM ex-China: Limited Bank Support For Growth
EM ex-China: Limited Bank Support For Growth
Chart I-5China's Stimulus Entails More Upside In Commodity Prices
China's Stimulus Entails More Upside In Commodity Prices
China's Stimulus Entails More Upside In Commodity Prices
3. Global financial market themes: a search for yield and leadership of new economy stocks. Global investment themes have an important bearing on EM financial markets. For example, in recent years, the increased market cap of new economy and semiconductor stocks – due to an exponential rise in their share prices – has amplified their importance for the aggregate EM equity index. The largest six mega cap stocks in the EM benchmark are new economy and semiconductor companies, and make up about 25% of the EM MSCI market cap. The six FAANGM stocks presently account for about 25% of the S&P 500. Hence, the concentration risk in EM is as high as it is in the US. Consequently, the trajectory of new economy and semiconductor stocks globally will be essential to the performance of the EM equity index. On August 20, we published an in-depth Special Report assessing near-term and structural outlooks for global semiconductor stocks. With new economy and semiconductor share prices going parabolic worldwide, we are witnessing a full-fledged mania, as we discussed in our July 16 report. The equal-weighted US FAANGM stock index has risen by 24-fold in nominal and 20-fold in real (inflation-adjusted) terms, since January 1, 2010 (Chart I-6). Chart I-6History Of Manias Of Past Decades
History Of Manias Of Past Decades
History Of Manias Of Past Decades
In brief, with respect to magnitude and duration, the bull market in FAANGM is on par with the bubbles of previous decades (Chart I-6). Those bubbles culminated in bear markets, where prices fell by at least 50% after topping out. Chart I-7EM ex-TMT Stocks: Absolute And Relative Performance
EM ex-TMT Stocks: Absolute And Relative Performance
EM ex-TMT Stocks: Absolute And Relative Performance
We do not know when the FAANGM rally will end. Timing a reversal in a powerful bull market is impossible. Also, we are not certain about the magnitude of such a potential drawdown. Nevertheless, our message is that the risk-reward tradeoff of chasing FAANGM at this stage is very unattractive. Excluding technology, media and telecommunication (TMT) – as most growth stocks are a part of TMT– EM equities remain in a bear market (Chart I-7, top panel). In relative terms, EM ex-TMT stocks have massively underperformed their global peers (Chart I-7, bottom panel). Even with a larger weighting of mega-cap growth TMT stocks than the overall DM equity index, the aggregate EM equity index has underperformed the overall DM index. Bottom Line: EM domestic fundamentals, global trade and commodities prices, and global financial market themes are the main drivers of EM financial assets and currencies. What About The Dollar? The high correlation of the trade-weighted US dollar and EM equities is due to the following: (1) the greenback has been a countercyclical currency; and (2) the US dollar’s exchange rate against EM currencies reflects relative fundamentals in the US versus EM economies. When a global business cycle accelerates, the broad trade-weighted US dollar weakens. If this growth acceleration is led by China and other emerging economies, the greenback depreciates considerably versus EM currencies. The opposite is also true. In other words, the US dollar exchange rate’s strong negative correlation to EM equities is primarily due to the fact that the greenback’s exchange rates against EM currencies reflect both the global business cycle as well as EM growth and fundamentals. Chart I-8Divergence Between DM And EM Currencies
Divergence Between DM And EM Currencies
Divergence Between DM And EM Currencies
In recent months, the greenback has: (1) depreciated due to the global economic recovery; (2) tumbled versus DM currencies due to the still raging pandemic and the socio-political instability in the US as well as the Fed’s commitment to staying behind the inflation curve in the years to come; and (3) not fallen much against EM (ex-China, Korea and Taiwan) currencies because their fundamentals have been poor, as discussed above. Bottom Line: Exchange rates in EM (ex-China, Korea and Taiwan) have failed to appreciate versus the dollar despite the latter’s plunge versus other DM currencies (Chart I-8). The positive effect of improving global growth and rising commodities prices on EM currencies (ex-China, Korea and Taiwan) has been offset by these countries’ inferior domestic fundamentals. Flows And Cash On The Sidelines Chart I-9Cash On The Sidelines Has Been Produced By The Fed's Debt Monetization
Cash On The Sidelines Has Been Produced By The Fed's Debt Monetization
Cash On The Sidelines Has Been Produced By The Fed's Debt Monetization
What about capital flows? Aren’t they essential in driving EM financial markets? Of course, they are important. However, we view flows as resulting from and determined by fundamentals. Over the medium and long term, we assume that capital flows to regions where the return on capital is high or rising. Thus, we see ourselves as responsible for directing investors to those areas that we have identified as providing a high or rising return on capital (and cautioning investors when the opposite is true). The presumption is that beyond short-term volatility, investment flows will gravitate to countries/sectors/asset classes with high or rising returns on capital, just as they will abandon areas of low or falling returns on capital. In brief, fundamentals drive flows and flows determine asset price performance. Isn’t sizable cash on the sidelines a reason to be bullish? Yes, there is substantial cash on the sidelines. Along with zero short-term rates, this has been the potent force leading investors to purchase equities, credit and other risk assets since late March. Below we examine the case of the US, but this has also been true in many markets around the world. The top panel of Chart I-9 demonstrates that US institutional and retail money market funds – a measure of cash on the sidelines - presently stand at $4.2 trillion, having increased by $900 billion since March. Yet, the Fed and US commercial banks have increased their debt securities holdings by $2.9 trillion since March. Furthermore, the Fed and US commercial banks hold $10.6 trillion of debt securities (Chart I-9, middle panel) – amounting to 18% of the aggregate equity and US dollar fixed-income market value (Chart I-9, bottom panel). These securities, held by the Fed and US commercial banks, are not available to non-bank investors. Chart I-10Investors' Cash Holdings Ratio Is Still Elevated
Investors' Cash Holdings Ratio Is Still Elevated
Investors' Cash Holdings Ratio Is Still Elevated
Excluding debt securities owned by the Fed and commercial banks, we reckon that cash on the sidelines is equal to 8.4% of the value of equities and US dollar debt securities available to non-bank investors (Chart I-10). This is a relatively high cash ratio. Unprecedented purchases by the Fed and US commercial banks have not only removed a considerable chuck of debt securities from the market; they have also created money “out of thin air”. When central or commercial banks acquire a security from, or lend to, a non-bank entity, they are creating new money “out of thin air”. No one needs to save for the central bank and commercial banks to lend to or purchase a security from a non-bank. In short, savings versus spending decisions by economic agents (non-banks) do not affect the stock of money supply. We have deliberated on these topics at length in past reports. In sum, the Fed’s large purchases of debt securities amount to a de facto monetization of public and private debt. These operations have both reduced the amount of securities available to investors and boosted the latter’s cash balances. Hence, the Fed has boosted asset prices not only indirectly, by lowering short-term interest rates, but also directly, by printing new money and shrinking the amount of securities available to investors. We have in recent months argued that global risk assets are overpriced relative to fundamentals. However, investors have continued to deploy cash in asset markets, pushing prices higher. Given the zero money market interest rates and the still elevated cash balances, one can envision a scenario in which cash continues to be deployed in asset markets, pushing valuations to bubble levels across all risk assets. Pressure on investors to deploy their cash amid rising asset prices implies that only a major negative shock might be able to reverse this rally. There have been plenty of reasons to be cautious, including escalating US-China geopolitical tensions, the increasing odds of a contested US presidential election and, hence, elevated political uncertainty, the possibility of a US fiscal cliff, and a potential second wave of the pandemic. However, investors have so far shrugged off all of these and continue to allocate capital to risk assets. Bottom Line: Increased central bank intervention in asset markets may diminish the importance of fundamentals in determining the price of risk assets. This would also mean that the role of momentum investing and psychology may increase. Investment Strategy Currencies: The US dollar has become oversold and could stage a rebound in the near term. The euro has risen to its technical resistance (Chart I-11). The EM currency index (ex-China, Korea and Taiwan) has failed to break above its 200-day moving average (Chart I-12, top panel). The emerging Asian trade-weighted currency index (ADXY) has rebounded to the upper boundary of its falling channel (Chart I-12, bottom panel). Chart I-11A Short-Term Resistance For Euro/USD
A Short-Term Resistance For Euro/USD
A Short-Term Resistance For Euro/USD
Chart I-12EM Currencies Have Not Entered A Bull Market
EM Currencies Have Not Entered A Bull Market
EM Currencies Have Not Entered A Bull Market
Such technical profiles suggest that EM currencies have not yet entered a bull market despite the greenback’s considerable depreciation against DM currencies. This is a reflection of the poor fundamentals of EM (ex-China, Korea and Taiwan). In short, the odds of a US dollar rebound are rising. This could dent commodities prices and weigh on EM currencies. We continue recommending shorting a basket of EM currencies versus the euro, CHF and JPY. The downside in these DM currencies versus the greenback is limited. The euro could drop to 1.15, but not much below that level. Our basket of EM currencies to short includes: BRL, CLP, ZAR, TRY, PHP, KRW and IDR. Chart I-13EM Local Currency Bonds: Looking For A Better Entry Point
EM Local Currency Bonds: Looking For A Better Entry Point
EM Local Currency Bonds: Looking For A Better Entry Point
Fixed-Income Markets: We have been neutral on EM local currency bonds and EM credit markets (USD bonds) since April 23 and June 4, respectively. The strategy is to wait for a correction in these markets before going long. The rebound in the US dollar and correction in commodities will provide a better entry point for these fixed-income markets (Chart I-13). Equities: On July 30, we recommended shifting the EM equity allocation within a global equity portfolio from underweight to neutral. In the near term, EM share prices will likely continue underperforming their DM counterparts. A bounce in the US dollar, rising geopolitical tensions between the US and China, as well as the continuation of a FAANGM-driven mania in US equities will result in EM equity underperformance versus DM. However, in the medium- to long-term, the balance of risks no longer justifies an underweight allocation. Arthur Budaghyan Chief Emerging Markets Strategist arthurb@bcaresearch.com Equities Recommendations Currencies, Credit And Fixed-Income Recommendations
Highlights Achieving 2 percent inflation, whether as a point-target or as an average over time, will continue to be a mission impossible. As central banks continue to push the monetary policy pedal to the metal, it will underpin the valuation of equities and other risk-assets. So long as bond yields do not spike, stock market sell offs will be short-lived rather than an outright bear market. Within bonds, steer towards those where the monetary policy toolbox is not fully depleted, namely US T-bonds. Within currencies, steer towards those where the monetary policy toolbox is already depleted, namely the Swiss franc and the yen. Inflationary fiscal policy, by spiking bond yields, risks collapsing the valuation underpinning of $450 trillion of global risk-assets and catalysing a deflationary bear market. Fractal trade: Euro strength is vulnerable. Feature Chart of the WeekUltra-Low Bond Yields Do Not Create Consumer Price Inflation, They Create Asset Price Inflation
Ultra-Low Bond Yields Do Not Create Consumer Price Inflation, They Create Asset Price Inflation
Ultra-Low Bond Yields Do Not Create Consumer Price Inflation, They Create Asset Price Inflation
Five years ago, we published a Special Report, Mission Impossible: 2% Inflation. We predicted that 2 percent inflation would remain elusive. Or that in the rare economies that it did appear, it would be runaway, rather than a sedate 2 percent. Either way, the 2 percent inflation point-target that had become a quasi-religious commandment for the world’s central banks would be a ‘mission impossible’.1 Our August 2015 report was heterodox and provocative. Some people pushed back, arguing that the all-powerful central banks could pick and hit whatever inflation target they desired. Yet five years on, we have been vindicated. Last week, the Federal Reserve finally threw in the towel on the 2 percent inflation point-target (Chart I-2). Chart I-2"Forecasts For 2 Percent Inflation Were Never Realised On A Sustained Basis"
"Forecasts For 2 Percent Inflation Were Never Realised On A Sustained Basis"
"Forecasts For 2 Percent Inflation Were Never Realised On A Sustained Basis"
“Over the years, forecasts from FOMC participants and private-sector analysts routinely showed a return to 2 percent inflation, but these forecasts were never realised on a sustained basis… (hence) our new statement indicates that we will seek to achieve inflation that averages 2 percent over time…”2 We suspect that, just like the Fed, European central banks will soon move their goal posts. Nevertheless, today we are doubling down on our August 2015 prediction. Achieving 2 percent inflation, whether as a point-target or as an average over time, will continue to be a mission impossible (Chart I-3). Chart I-3Mission Impossible: 2 Percent Inflation
Mission Impossible: 2 Percent Inflation
Mission Impossible: 2 Percent Inflation
Price Stability Is A State, Not A Number The current school of central bankers have misunderstood price stability. They have defined it as an over-precise inflation rate: two point zero. Yet most people feel price stability imprecisely and intuitively. A recent IFO paper points out that households’ inflation perceptions are “more in line with the imperfect information view prevailing in social psychology than with the rational actor view assumed in mainstream economics.”3 The human brain cannot distinguish between very low rates of inflation or deflation, a range we just perceive as ‘price stability’. In Real-Feel Inflation: Quantitative Estimation of Inflation Perceptions, Michael Ashton confirms that “it would be challenging for a consumer to distinguish 1 percent inflation from 2 percent inflation – that fine of a gradation in perception would be extremely unusual to find.”4 The human brain cannot distinguish between very low rates of inflation or deflation. As the entire range of ultra-low inflation just feels like one state of price stability, it is impossible for central banks to fine-tune our inflation expectations within that range. Therefore, our behaviour in terms of wage demands and willingness to borrow also stays unchanged. And if our behaviour is unchanged, what is the transmission mechanism to 2 percent inflation – or for that matter, any arbitrarily chosen inflation rate? Hence, inflation targeting can ‘phase-shift’ an economy between the states of price instability and price stability. Most notably, its inception in the 1990s ultimately phase-shifted many advanced economies into the state of price stability (Chart I-4). But once in either state, inflation targeting cannot fine-tune inflation to a desired number such as 2 percent, 4 percent, or 10 percent. Chart I-4Inflation Targeting Phase-Shifted Advanced Economies Into Price Stability
Inflation Targeting Phase-Shifted Advanced Economies Into Price Stability
Inflation Targeting Phase-Shifted Advanced Economies Into Price Stability
A recent NBER paper Inflation Expectations As A Policy Tool? points out that in advanced economies, “the inattention of households and firms to inflation is likely a reflection of policy-makers’ success in stabilizing inflation around a low level for decades. This price stability has reduced the benefit to being informed about aggregate inflation, leading many to rely on readily available price signals.”5 The ultimate proof is that even market-based inflation expectations just track realised inflation. Central Banks Have Gone Backwards In his must-read What’s Wrong With The 2 Percent Inflation Target, the late and great Paul Volcker argued that price stability is “that state in which expected changes in the general price level do not effectively alter business or household decisions. It is ill-advised to define that state with a point target, such as 2 percent, as false precision can lead to dangerous policies.”6 The irony, and tragedy, is that both the Fed and the ECB have gone backwards. Their original definitions of price stability were more correct than their more recent iterations. False precision can lead to dangerous policies. At the Federal Reserve’s July 1996 policy meeting, Chairman Alan Greenspan argued that if the aim of inflation targeting was a truly stable price level, it entailed an inflation target of 0-1 percent. But one of the persons present was not so sure. The dissenter was a Fed governor called Janet L. Yellen. She countered that if inflation ended up at 0-1 percent, the zero-bound of interest rates would prevent “real interest rates becoming negative on the rare occasions when required to counter a recession”, an argument that Jay Powell repeated last week. “Expected inflation feeds directly into the general level of interest rates… so if inflation expectations fall below our 2 percent objective, interest rates would decline in tandem. In turn, we would have less scope to cut interest rates to boost employment during an economic downturn.” Meanwhile in Europe, the ECB’s original inflation target of below 2 percent was close to Greenspan’s proposal of 0-1 percent. But in 2003 the ECB changed its inflation target to its current “below but close to 2 percent.” The reason, according to Mario Draghi: “The founding fathers of the ECB thought about the rebalancing of the different members. To rebalance these disequilibria, since the countries do not have the exchange rate, they must readjust their prices. This readjustment is much harder if you have zero inflation than if you have 2 percent.” Hence, the Fed, ECB and other central banks are targeting inflation at an arbitrary 2 percent to always allow some leeway for negative real rates. The central bank argument can be summarised as: we desperately need you to expect 2 percent inflation. Because otherwise, we won’t be able to help you by cutting real interest rates in a downturn. Yet this argument is facile, as it takes no account of the true science of inflation expectation formation (Chart I-5 and Chart I-6). And it is dangerous, as it takes no account of the financial and economic risks of pushing the monetary policy pedal to the metal. Chart I-5Inflation Expectations Just Track Realised Inflation
Inflation Expectations Just Track Realised Inflation
Inflation Expectations Just Track Realised Inflation
Chart I-6Inflation Expectations Just Track Realised Inflation
Inflation Expectations Just Track Realised Inflation
Inflation Expectations Just Track Realised Inflation
Beware The Twists In The Inflation Story Now we come to a couple of twists in the story. When bond yields become ultra-low, their impact on consumer price inflation breaks down – because the economy is already in the state of price stability – but the impact on stock market inflation increases exponentially (Chart of the Week). We refer readers to previous reports in which we have detailed this dynamic.7 The good twist is that as central banks continue to push the monetary policy pedal to the metal, it will underpin the valuation of equities and other risk-assets. So long as bond yields do not spike, stock market sell offs will be short-lived rather than an outright bear market. Remarkably, this has held true even this year in the worst economic downturn since the Depression. The current school of central bankers have misunderstood price stability. Within bonds, steer towards those where the monetary policy toolbox is not fully depleted, namely US T-bonds (Chart I-7 and Chart I-8). Conversely, within currencies, steer towards those where the monetary policy toolbox is already depleted, namely the Swiss franc and the yen. Chart I-7Steer Towards Bonds Where Monetary Policy Is Not Fully Depleted...
Steer Towards Bonds Where Monetary Policy Is Not Fully Depleted...
Steer Towards Bonds Where Monetary Policy Is Not Fully Depleted...
Chart I-8...Namely US ##br##T-Bonds
...Namely US T-Bonds
...Namely US T-Bonds
Finally, given that any economy can ultimately phase-shift to price instability, when should we worry about inflation in advanced economies? Not yet. To expand the broad money supply, somebody must borrow and spend money. If policymakers really want to create rampant inflation, that somebody is the government. It must borrow and spend money at will, with the central bank creating the money. In other words, the central bank loses its independence and government spending goes vertical. So far, we are not remotely close to this situation because government spending has barely replaced the lost incomes and livelihoods of the pandemic. Indeed, things could get worse once the current income replacement schemes end. Yet, in theory at least, government spending could ultimately go vertical. This would lead to the final bad twist. As bond yields spiked in response, the entire valuation support of global risk-assets would collapse, catalysing a devastating bear market. Given that the $450 trillion worth of global risk-assets (including real estate) is five times the size of the $90 trillion global economy, we reach an important conclusion. The road to inflation, if ever taken, goes via deflation. Fractal Trading System* This week we note that the recent strength in EUR/USD is vulnerable to a countertrend pullback. However, as we are already exposed to this via the correlated position in long USD/PLN, there is no new trade. The rolling 1-year win ratio now stands at 59 percent. Chart I-9EUR/USD
EUR/USD
EUR/USD
When the fractal dimension approaches the lower limit after an investment has been in an established trend it is a potential trigger for a liquidity-triggered trend reversal. Therefore, open a countertrend position. The profit target is a one-third reversal of the preceding 13-week move. Apply a symmetrical stop-loss. Close the position at the profit target or stop-loss. Otherwise close the position after 13 weeks. * For more details please see the European Investment Strategy Special Report “Fractals, Liquidity & A Trading Model,” dated December 11, 2014, available at eis.bcaresearch.com. Dhaval Joshi Chief European Investment Strategist dhaval@bcaresearch.com Footnotes 1 Please see the European Investment Strategy Special Report ‘Mission Impossible: 2% Inflation’, dated August 20, 2015, available at eis.bcaresearch.com. 2 Please see New Economic Challenges and the Fed's Monetary Policy Review, August 27, 2020 available at https://www.federalreserve.gov/newsevents/speech/powell20200827a.htm 3 Please see Households’ Inflation Perceptions and Expectations: Survey Evidence from New Zealand, IFO Working Paper, February 2018 available at https://www.ifo.de/DocDL/wp-2018-255-hayo-neumeier-inflation-perceptions-expectations.pdf 4 Please see Real-Feel Inflation: Quantitative Estimation of Inflation Perceptions by Michael Ashton, National Association for Business Economics available at https://link.springer.com/content/pdf/10.1057/be.2011.35.pdf 5 Please see Inflation Expectations As A Policy Tool? NBER, May 28th, 2018 available at http://conference.nber.org/conf_papers/f117592.pdf 6 Please see https://www.bloomberg.com/opinion/articles/2018-10-24/what-s-wrong-with-the-2-percent-inflation-target 7 Please see the European Investment Strategy Weekly Report ‘Risk: The Great Misunderstanding Of Finance’, dated October 25, 2018, available at eis.bcaresearch.com. Fractal Trading System Cyclical Recommendations Structural Recommendations Closed Fractal Trades Trades Closed Trades Asset Performance Currency & Bond Equity Sector Country Equity Indicators Bond Yields Chart II-1Indicators To Watch - Bond Yields
Indicators To Watch - Bond Yields
Indicators To Watch - Bond Yields
Chart II-2Indicators To Watch - Bond Yields
Indicators To Watch - Bond Yields
Indicators To Watch - Bond Yields
Chart II-3Indicators To Watch - Bond Yields
Indicators To Watch - Bond Yields
Indicators To Watch - Bond Yields
Chart II-4Indicators To Watch - Bond Yields
Indicators To Watch - Bond Yields
Indicators To Watch - Bond Yields
Interest Rate Chart II-5Indicators To Watch - Interest Rate Expectations
Indicators To Watch - Interest Rate Expectations
Indicators To Watch - Interest Rate Expectations
Chart II-6Indicators To Watch - Interest Rate Expectations
Indicators To Watch - Interest Rate Expectations
Indicators To Watch - Interest Rate Expectations
Chart II-7Indicators To Watch - Interest Rate Expectations
Indicators To Watch - Interest Rate Expectations
Indicators To Watch - Interest Rate Expectations
Chart II-8Indicators To Watch - Interest Rate Expectations
Indicators To Watch - Interest Rate Expectations
Indicators To Watch - Interest Rate Expectations
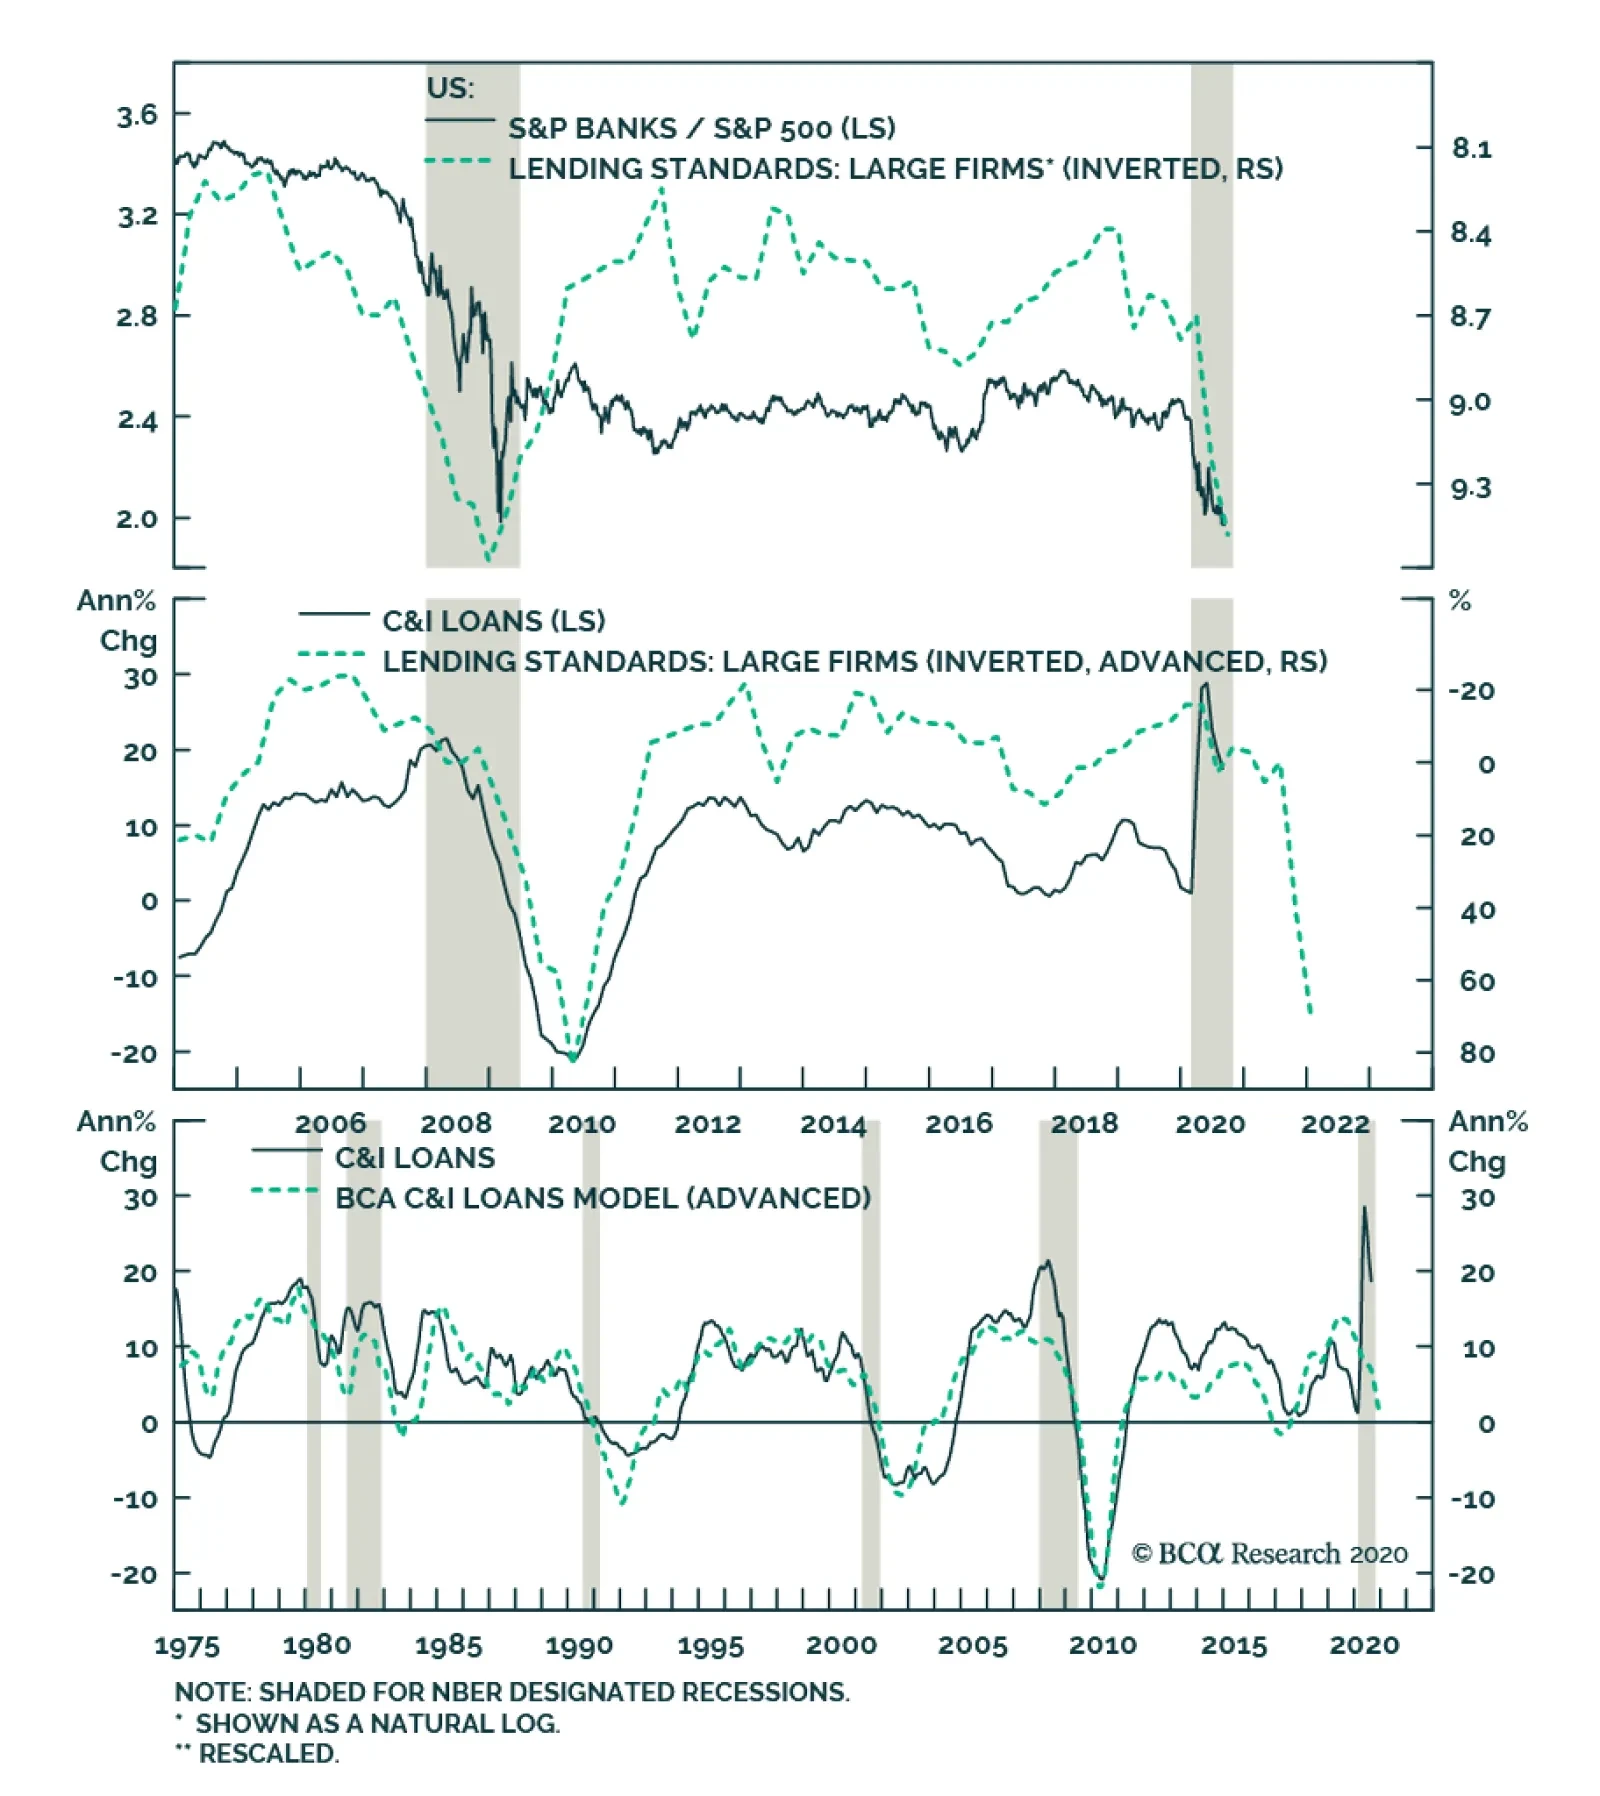
BCA Research’s US Equity Strategy service put the S&P banks index on downgrade alert. Following the recent Fed stress results and the resulting dividend cuts, banks have continued to trail both the broad equity market and their early cyclical peers:…
No Relief For Banks
No Relief For Banks
Neutral - Downgrade Alert Bank stocks fail to catch a break. Following the recent Fed stress results and the resulting dividend cuts, banks have continued to trail both the broad equity market and their early cyclical peers: consumer discretionary stocks. Worryingly, on all three income generation fronts, dark clouds are gathering for banks, the nervous system of the US economy. While the initial knee jerk reaction of corporates was to tap their existing credit lines in order to fight the pandemic that caused an exponential rise in C&I loan growth, going forward a steep reversal is looming (middle & bottom panels). Bankers are tightening lending standards at the fastest pace in a decade despite ZIRP, weighing heavily on relative share prices (top panel). On the price of credit front, the Fed’s recent perching of the fed funds rate on the zero line for as far as the eye can see all but guarantees a tough pricing power environment for banks. The latest FDIC Quarterly Banking Profile revealed that the banking industry broke the 3 handle on net interest margins coming in at 2.81%, the lowest level since the history of the data dating back to 1984. Finally, with regard to credit quality, a double digit unemployment rate, along with commercial real estate ails will propel non-performing loans, which are extremely lagging by nature. While credit quality deterioration is late to show up, it wreaks immediate havoc on bank income statements as loan loss provisions. Aggressive provisioning will likely continue at least until the end of the year. Bottom Line: Stay neutral the S&P banks index, but it is now on downgrade alert.
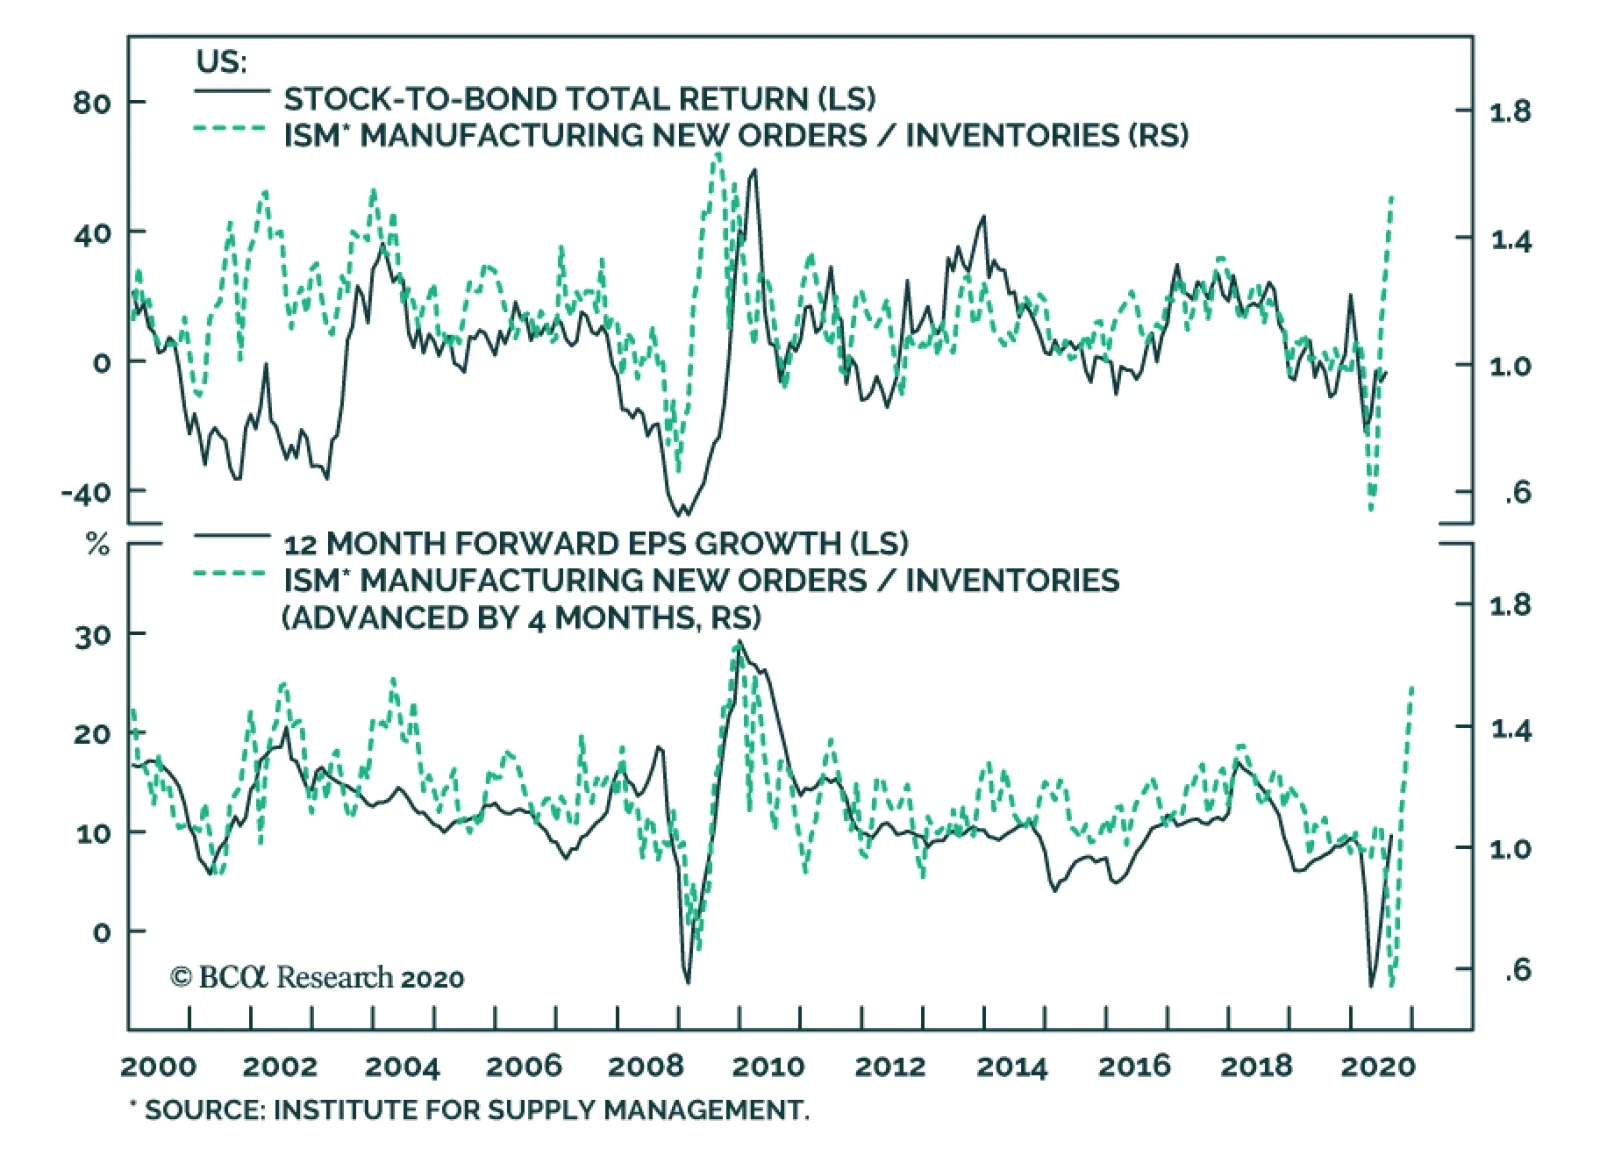
While the market PMIs for August were slightly revised down relative to their flash estimates, the ISM manufacturing survey, which has more weight toward smaller businesses, rose vigorously from 54.2 to 56, handily beating expectations of 54.8. The…
BCA Research’s Global Fixed Income Strategy & US Bond Strategy service highlights that the official shift to an average inflation targeting regime represents a massive structural break relative to how the Fed conducted monetary policy in the past. The…
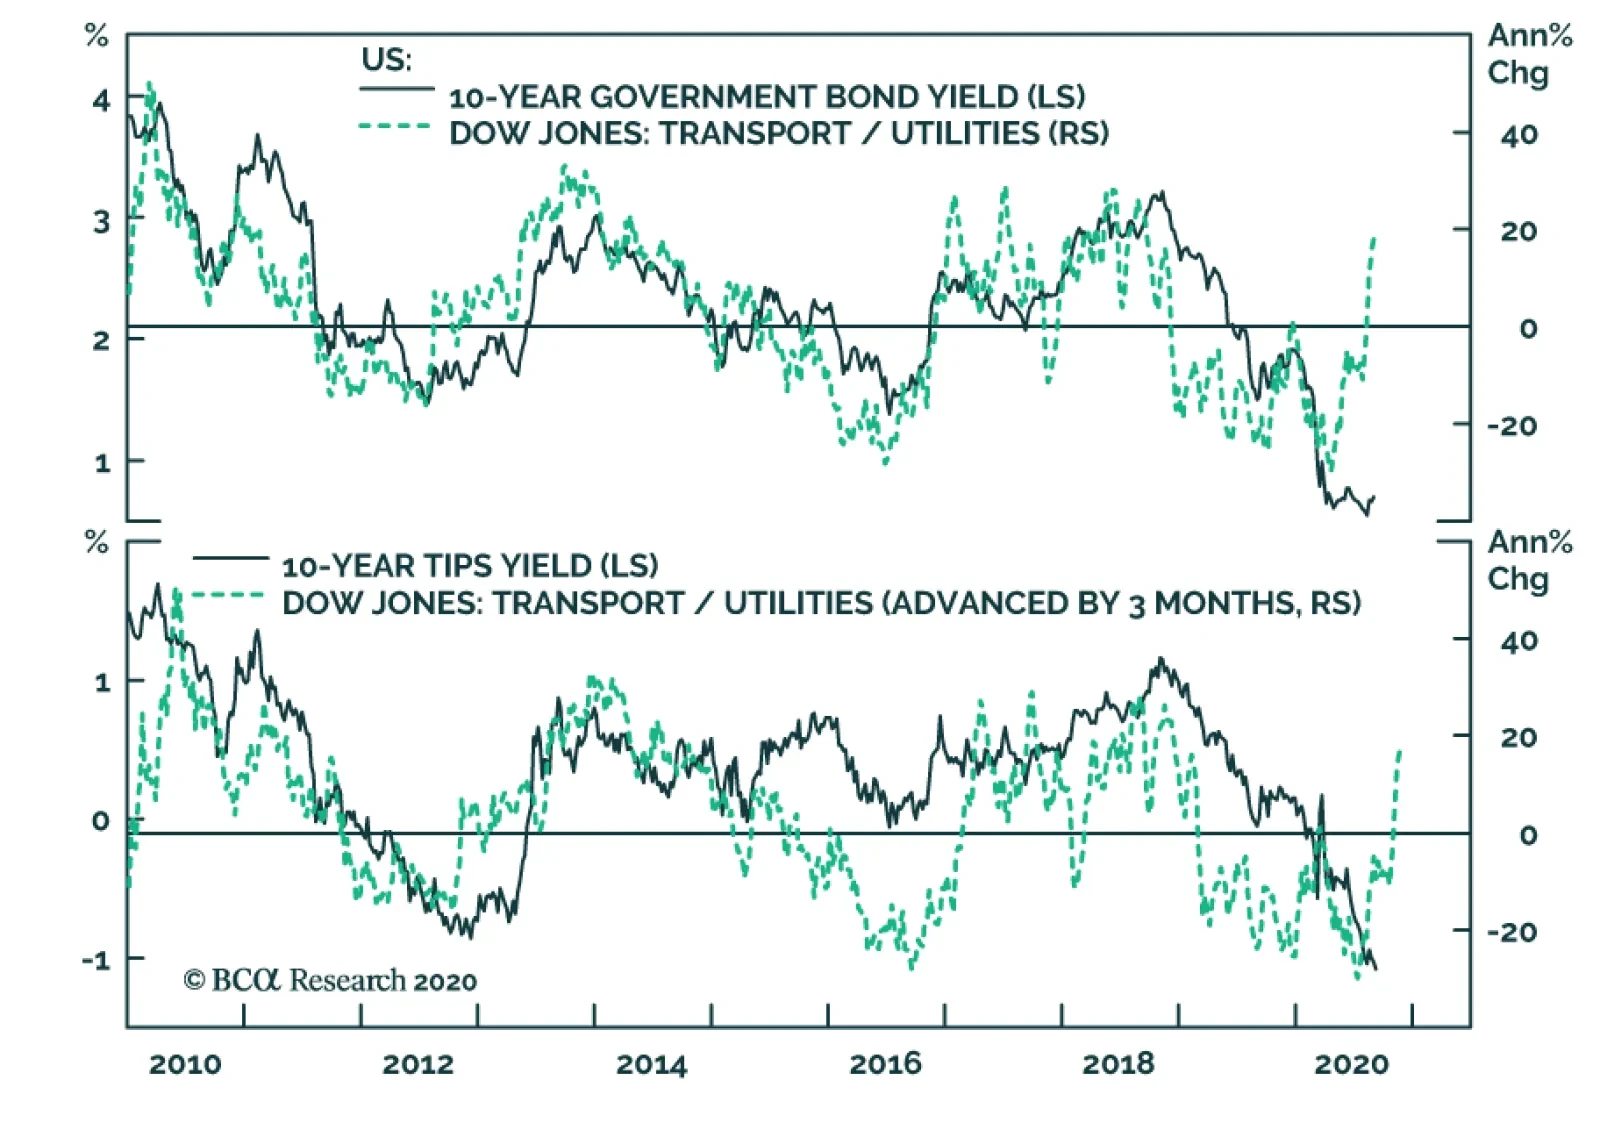
The outperformance of transportation stocks relative to utilities has gained pace in the month of August. This internal market dynamics is important because it confirms that the outlook for cyclical equities is improving relative to defensive ones. A…
Over the past weeks, we have been cautioning investors not to chase the equity market higher as the risk/reward trade-off at current levels is tilted to the downside. While we maintain a 9-12 month bullish view on the broad market, a short-term correction due to technical and/or (geo)political reasons is likely in the cards. Consequently, patient investors will be rewarded with a compelling entry point likely in the coming months. Below are five reasons, in no particular order, arguing that a playable short-term pullback is in order: Reason #1: The 200-day Moving Average Moving averages are a perfect tool to put the speed of any rally in perspective and to highlight extreme investor optimism. Chart 1 shows standardized SPX and Nasdaq 100 (NDX) price ratios with respect to their 200-day moving averages. If we look at the current cycle, whenever both the SPX and NDX crossed above the one standard deviation (std) line, a sizable pullback was quick to follow. While NDX has been well above its 1 std line for some time, last week’s price action finally pushed the SPX into the overstretched column. The implication is that a correction is looming. Reason 1
Reason 1
Reason 1
Reason #2: Monthly Moving Averages For the second reason, we look at the concept of price deviations from the moving average through a different lens – Bollinger bands (BBs). A traditional (20,2) BB includes a 20-period moving average of the price, as well as 20-period 2-standard standard deviation lines. While it can be plotted on any time frame, we use monthly data as set ups in longer time frames (i.e. monthly) dictate the behavior of the shorter (i.e. daily) time frames. Chart 2 shows the S&P 500 together with its (20,2) BBs on a monthly time frame. Whenever the market spikes above the 2 std line, a sizable correction ensues. Currently, the market is squarely above the 2 std line, which has historically been a precursor to a 5-10% drawdown. Reason 2
Five Reasons Not To Chase Equities In the Near-Term
Five Reasons Not To Chase Equities In the Near-Term
Reason #3: Growth/Value Staying on the topics of extreme rallies, Chart 3 shows the year-over-year growth rate in the S&P growth / S&P value share price ratio. In the entire history of the data, never has it printed a jaw-dropping 34% growth rate, not even after the depths of GFC or to the lead up to the dotcom March 2000 peak. Such a pace is clearly not sustainable and since growth stocks are dominated by FAANG-like companies that have done all of the heavy lifting year-to-date, a reset in the S&P growth / S&P value ratio will weigh on the overall market. A selloff in the bond market will likely serve as a catalyst to boost the allure of beaten down value stocks at the expense of overvalued tech titans. Reason 3
Reason 3
Reason 3
Reason #4: Options/Volatility Markets Option and related volatility market movements reveal some vulnerabilities in the broad equity market. More specifically, the VIX and the VXN which by construction are inversely correlated with the S&P 500 and NASDAQ 100, respectively, serve as an excellent timing tool. We look at the 20-day moving correlation of those respective variables, and similarly to Reason #1, a reliable sell signal is given once both (VIX, SPX) and (VXN, NDX) 20-day moving correlations shoot into positive territory (Chart 4). While the (VXN, NDX) correlation has been going haywire over the past quarter as likely single stock call option buying has been heavily hedged by NDX put buying, the (VIX, SPX) moving correlation only slingshot higher at the end of last week - finally producing a decisive sell signal. Again, similarly to Reason #2, each sell signal resulted into a sizable correlation in the SPX, warning that a 5-10% pullback – the sixth since the March lows – is inevitable in the coming weeks. Reason 4
Reason 4
Reason 4
Reason #5: Bad Breadth Tech stocks have clearly been the work horse behind this rally pushing markets into uncharted territory in a very short period of time since the March lows. However, and as we highlighted in our previous research, it is only a handful of tech titans that propelled the markets to all-time highs. Overconcentration of returns in just a few tickers is not healthy, and a reset is only a question of time. Chart 5 highlights that today only 64% of NASDAQ Composite stocks are trading above their respective 50-day moving average, which stands in marked contrast to the all-time highs in the NASDAQ Composite. Such a divergence is unsustainable and typically gets resolved by a snap back in equity prices. While Chart 5 cannot be used as a precise timing tool, it has been consistently leading the NASDAQ Composite especially at peaks, cautioning that a healthy pullback is forthcoming. Bottom Line: While we maintain a cyclical and structural (see upcoming Weekly Report) bullish stance in the broad equity market, the shorter-term risk/reward trade-off is tilted to the downside, and presents a playable opportunity. Reason 5
Reason 5
Reason 5
Recommended Allocation
Monthly Portfolio Update: Can Monetary Policy Alone Propel The Market?
Monthly Portfolio Update: Can Monetary Policy Alone Propel The Market?
Chart 1Only Internet Stocks Have Kept On Rising
Only Internet Stocks Have Kept On Rising
Only Internet Stocks Have Kept On Rising
It has been a very strange bull market. Although global equities are up 52% since their bottom on March 23rd, the rally has been limited largely to internet-related stocks. Excluding the three sectors (IT, Consumer Discretionary, and Communications) which house the internet names, equities have moved only sideways since May (Chart 1). Moreover, the rally comes amid sporadic serious new outbreaks of COVID-19 cases, most recently in Europe (Chart 2). Fears of the pandemic and much-reduced business activity in leisure-related industries have caused consumer confidence to diverge from the stock market in an unprecedented way (Chart 3). Chart 2New Outbreaks Of COVID-19 In Europe
New Outbreaks Of COVID-19 In Europe
New Outbreaks Of COVID-19 In Europe
Chart 3Why Are Stocks Rising When Consumers Are So Wary?
Why Are Stocks Rising When Consumers Are So Wary?
Why Are Stocks Rising When Consumers Are So Wary?
The only explanation for these phenomena is the unprecedented amount of monetary stimulus, which is causing excess liquidity to flow into risk assets. Since March, the balance-sheets of major central banks have increased by $7 trillion (Chart 4), and M2 money supply growth has soared (Chart 5). Chart 4Central Banks Have Grown Their Balance-Sheets...
Central Banks Have Grown Their Balance-Sheets...
Central Banks Have Grown Their Balance-Sheets...
Chart 5...Leading To A Big Rise in Money Growth
...Leading To A Big Rise in Money Growth
...Leading To A Big Rise in Money Growth
Moreover, the Fed’s new strategic framework announced in late August represents a commitment to keep monetary policy loose even when the economy begins to overheat. The Fed will (1) target 2% inflation on average over time which means that, after a period of low inflation, it will “aim to achieve inflation moderately above 2 percent for some time”; and (2) treat its employment mandate as asymmetrical, so that when employment is below potential the Fed will be accommodative, but that a rise in employment above its “maximum level” will not necessarily trigger tightening. Historically the Fed has raised rates when unemployment approached its natural rate (Chart 6). The new policy implies it will no longer do so. The aim of the policy is to raise inflation expectations which have become unanchored, with headline PCE inflation above the Fed’s 2% target for only 14 out of 102 months since the target was introduced in February 2012 (Chart 6, panel 3). Chart 6The Fed's Behavior Will Be Different In Future
The Fed's Behavior Will Be Different In Future
The Fed's Behavior Will Be Different In Future
Chart 7More Permanent Job Losses To Come
More Permanent Job Losses To Come
More Permanent Job Losses To Come
This commitment to easier monetary policy for longer will certainly help risk assets. But will it be enough? The global economic environment remains weak. Permanent job losses continue to increase, as workers initially put on furlough or dismissed temporarily, are fired (Chart 7). A second wave of COVID-19 cases in the Northern Hemisphere winter would worsen the situation. While central banks everywhere remain committed to aggressive policy, fiscal policy decision-makers are getting cold feet, with the UK’s wage-replacement scheme due to end in October, and government support in the US set to decline absent a big new fiscal package agreed by Congress (Chart 8). Credit risks are beginning to emerge, with bankruptcies surging (Chart 9), and mortgage delinquencies starting to rise (Chart 10). As a result, banks are becoming significantly more reluctant to lend (Chart 11). Chart 8Fiscal Support Is Starting To Slide
Fiscal Support Is Starting To Slide
Fiscal Support Is Starting To Slide
Chart 9Bankruptcies Are Surging…
Monthly Portfolio Update: Can Monetary Policy Alone Propel The Market?
Monthly Portfolio Update: Can Monetary Policy Alone Propel The Market?
Chart 10...Along With Mortgage Delinquencies
...Along With Mortgage Delinquencies
...Along With Mortgage Delinquencies
Chart 11Banks Turning Increasingly Cautious
Banks Turning Increasingly Cautious
Banks Turning Increasingly Cautious
To those concerns, we should add political risk ahead of the US presidential election. President Trump is probably not as far behind as the 7-percentage point gap in opinion polls suggests: After the Republican National Convention, online betting sites give him a 46% probability of being reelected (Chart 12). Over the next two months, he could be aggressive in foreign policy, particularly towards China. A disputed election is not unlikely. Investors might be wise to hedge against that possibility: BCA Research’s Geopolitical service recommends buying December VIX futures, which are still cheaply priced, and selling January VIX futures (Chart 13). 1 Chart 12Trump Could Still Pull It Off
Trump Could Still Pull It Off
Trump Could Still Pull It Off
Chart 13Hedge Against A Disputed Election Result
Monthly Portfolio Update: Can Monetary Policy Alone Propel The Market?
Monthly Portfolio Update: Can Monetary Policy Alone Propel The Market?
Given the power of monetary stimulus, we are reluctant to bet against equities – not least since the yield on fixed-incomes assets is so low. Nonetheless, we see the risk of a sharp correction over the coming six months, driven by a second pandemic wave, a renewed downturn in the global economy, or political events. We continue to recommend, therefore, only a neutral position on global equities. We would hold a large overweight in cash, to keep powder dry for when a better buying opportunity for risk assets arises. But a warning: The long-run return from all asset classes will be poor. The global bond index is unlikely to produce a nominal return much above zero over the coming decade. While equities look more attractive, our valuation indicator points to a nominal annual return of only around 3% (Chart 14). For the US, valuation suggests a return of zero. Investors will need to become more realistic about their return assumptions. The 7% annual return still assumed by the average US pension fund might have made sense when the yield on BBB-rated corporate bonds was 8%, but it no longer does when it has fallen to 2.3% (Chart 15). Chart 14Long-Term Equity Returns Will Be Poor
Long-Term Equity Returns Will Be Poor
Long-Term Equity Returns Will Be Poor
Chart 15Investors' Return Assumptions Are Unrealistic
Investors' Return Assumptions Are Unrealistic
Investors' Return Assumptions Are Unrealistic
Chart 16Value Sectors' Profits Have Been Terrible
Value Sectors' Profits Have Been Terrible
Value Sectors' Profits Have Been Terrible
Equities: The most vigorous debate among BCA Research strategists currently is over whether growth stocks will continue to outperform, or whether value will take over leadership. The Global Asset Allocation service is on the side of growth. The poor performance of value stocks (concentrated in Financials, Energy, and Materials) is explained by the structural decline in their profits for the past 12 years (Chart 16). With the yield curve unlikely to steepen and non-performing loans set to rise, we do not see Financials’ earnings recovering. China’s economic shifts represent a long-term headwind for Materials. Internet stocks are expensively valued, but we do not see them underperforming until (1) their earnings’ growth slows sharply, (2) regulation on them is significantly tightened, or (3) long-term bond yields rise, lowering the NPV of their future earnings. This view drives our Overweight on US equities versus Europe and Japan. US stocks have continued to outperform even in the risk-on rally since March (Chart 17). We are a little more enthusiastic (with a Neutral recommendation) about Emerging Market stocks, which are very cheaply valued (Chart 18). Chart 17US Stocks Have Outperformed Even In A Risk-On Market
US Stocks Have Outperformed Even In A Risk-On Market
US Stocks Have Outperformed Even In A Risk-On Market
Chart 18EM Stocks Are Cheap
EM Stocks Are Cheap
EM Stocks Are Cheap
Chart 19Short USD Is Now A Consensus Trade
Monthly Portfolio Update: Can Monetary Policy Alone Propel The Market?
Monthly Portfolio Update: Can Monetary Policy Alone Propel The Market?
Currencies: The US dollar has depreciated by 10% since mid-March. Over the next 12 months, the trend for the USD is likely to continue to be down. The new Fed policy emphasizes that real rates will stay low, and US inflation will probably be higher than in other developed economies. Nonetheless, short-USD/long-euro positions have become consensus (Chart 19) and, given the safe-haven nature of the dollar, a period of risk-off could push the dollar back up temporarily. Chart 20IG Spreads Are No Longer Attractive
Investment Grade Breakeven Spreads IG Spreads Are No Longer Attractive
Investment Grade Breakeven Spreads IG Spreads Are No Longer Attractive
Fixed Income: We don’t expect to see a sustained rise in nominal US Treasury yields, despite the Fed’s new monetary policy framework. The Fed has an implicit yield curve control policy, and would react if yields showed signs of rising significantly. TIPS breakevens should eventually rise further to reflect the likelihood of higher inflation in the longer term, though the recent sharp rise in inflation (core CPI rose by 0.6% month-on-month in July, the largest increase since 1991) will likely subside and so the upside for breakeven yields might be limited over the next six months. We are becoming a little more cautious on credit. Investment-grade spreads are now close to historic lows and so returns are likely to be limited (Chart 20). We lower our recommendation to Neutral. Ba-rated bonds still offer attractive yields and are supported by Fed purchases. But we would not go further down the credit curve, and so stay Neutral on high yield. This by definition means that we must also be Neutral within fixed income on government bonds, which is compatible with our view that rates will not rise much. Note, though, that we remain Underweight the fixed-income asset class overall, but no longer have a preference for spread product within it. One exception is EM dollar-denominated debt, both sovereign and corporate, which offers spreads that are attractive in a world of low returns from fixed income. Chart 21Crude Prices Can Rise Further As Demand Recovers
Crude Prices Can Rise Further As Demand Recovers
Crude Prices Can Rise Further As Demand Recovers
Commodities: Industrial metals prices have further to run up, as China continues its credit stimulus, which should lead to a rise in infrastructure investment and increased imports of commodities. The outlook for crude oil will be dominated by the demand side: OPEC forecasts demand destruction this year of 9 million barrels per day (compared to consensus expectations of 8 million) and so will be cautious about loosening its supply constraints. Demand should be boosted by increased driving, as people avoid using public transport for commuting and airlines for vacations. Based on a robust demand forecast (Chart 21), BCA Research’s energy strategists see Brent crude stable at around current levels through to the end of 2020 but averaging $65 a barrel next year. Garry Evans, Senior Vice President Global Asset Allocation garry@bcaresearch.com Footnotes 1 Please see Geopolitical Strategy Special Report, “What Is The Risk Of A Contested US Election?” dated July 27, 2020. GAA Asset Allocation
Highlights Fed Policy Changes: The official shift to an average inflation targeting regime represents a massive structural break relative to how the Fed conducted monetary policy in the past. The main takeaway for investors should be that inflation expectations will carry more weight than ever in the Fed’s thinking, with far less emphasis on estimated measures like the output gap. Investment Implications: The Fed’s new policy framework supports our current US fixed income recommendations: a neutral duration stance; overweighting TIPS versus nominal US Treasuries; positioning for real yield curve steepeners; and overweighting US spread product most directly supported by the Fed’s balance sheet (i.e. investment grade corporates and Ba-rated high-yield). Feature The pandemic forced the Federal Reserve to move its annual Jackson Hole Economic Policy Symposium online this year. That change deprived policymakers of a late-August vacation in the mountains of Wyoming, but offered the public a rare glimpse at the full proceedings live on YouTube.1 Federal Reserve Chairman Jerome Powell took advantage of that larger audience to announce significant changes to the Fed’s Statement on Longer-Run Goals and Monetary Policy Strategy. Though many of the basic elements of the new strategy were well telegraphed in advance, the adjustments are hugely significant and will shape the conduct of US – and, potentially, global - monetary policy for years to come. This Special Report presents the most important takeaways – and fixed income investment implications - from the Fed’s new approach to setting monetary policy. Say Hello To Average Inflation Targeting The most significant change has to do with how the Fed defines its price stability mandate. In its old Statement, the Fed defined its 2% inflation target as “symmetrical”, meaning that the Fed would be equally concerned if inflation were running persistently above or below the target. In the Fed’s words, communicating this symmetry was enough to “keep longer-term inflation expectations firmly anchored.” The Fed now believes that a more aggressive approach is required to keep inflation expectations anchored. The new Statement reads: In order to anchor longer-term inflation expectations at [2 percent], the Committee seeks to achieve inflation that averages 2 percent over time, and therefore judges that, following periods when inflation has been running persistently below 2 percent, appropriate monetary policy will likely aim to achieve inflation moderately above 2 percent for some time.2 In other words, the Fed’s 2% inflation target is no longer purely forward-looking. It is now dependent on the history of realized US inflation, and thus is now much more like a price level target than an inflation target. We will know that the Fed has seen enough inflation overshooting when long-term expectations are anchored at levels consistent with its 2% inflation target. For example, Chart 1 shows how the headline PCE price index would have evolved since the end of 2007 had it averaged 2% growth per year, exactly equal to the Fed’s target. Starting from today, PCE inflation would need to average 3% for the next seven years, or 2.5% for the next fourteen years, for the index to converge with this target. In other words, if the Fed seeks to achieve average 2% inflation since 2007, we are in for a prolonged period of overshooting the old 2% target. Chart 1An Illustration Of Average Inflation Targeting
An Illustration Of Average Inflation Targeting
An Illustration Of Average Inflation Targeting
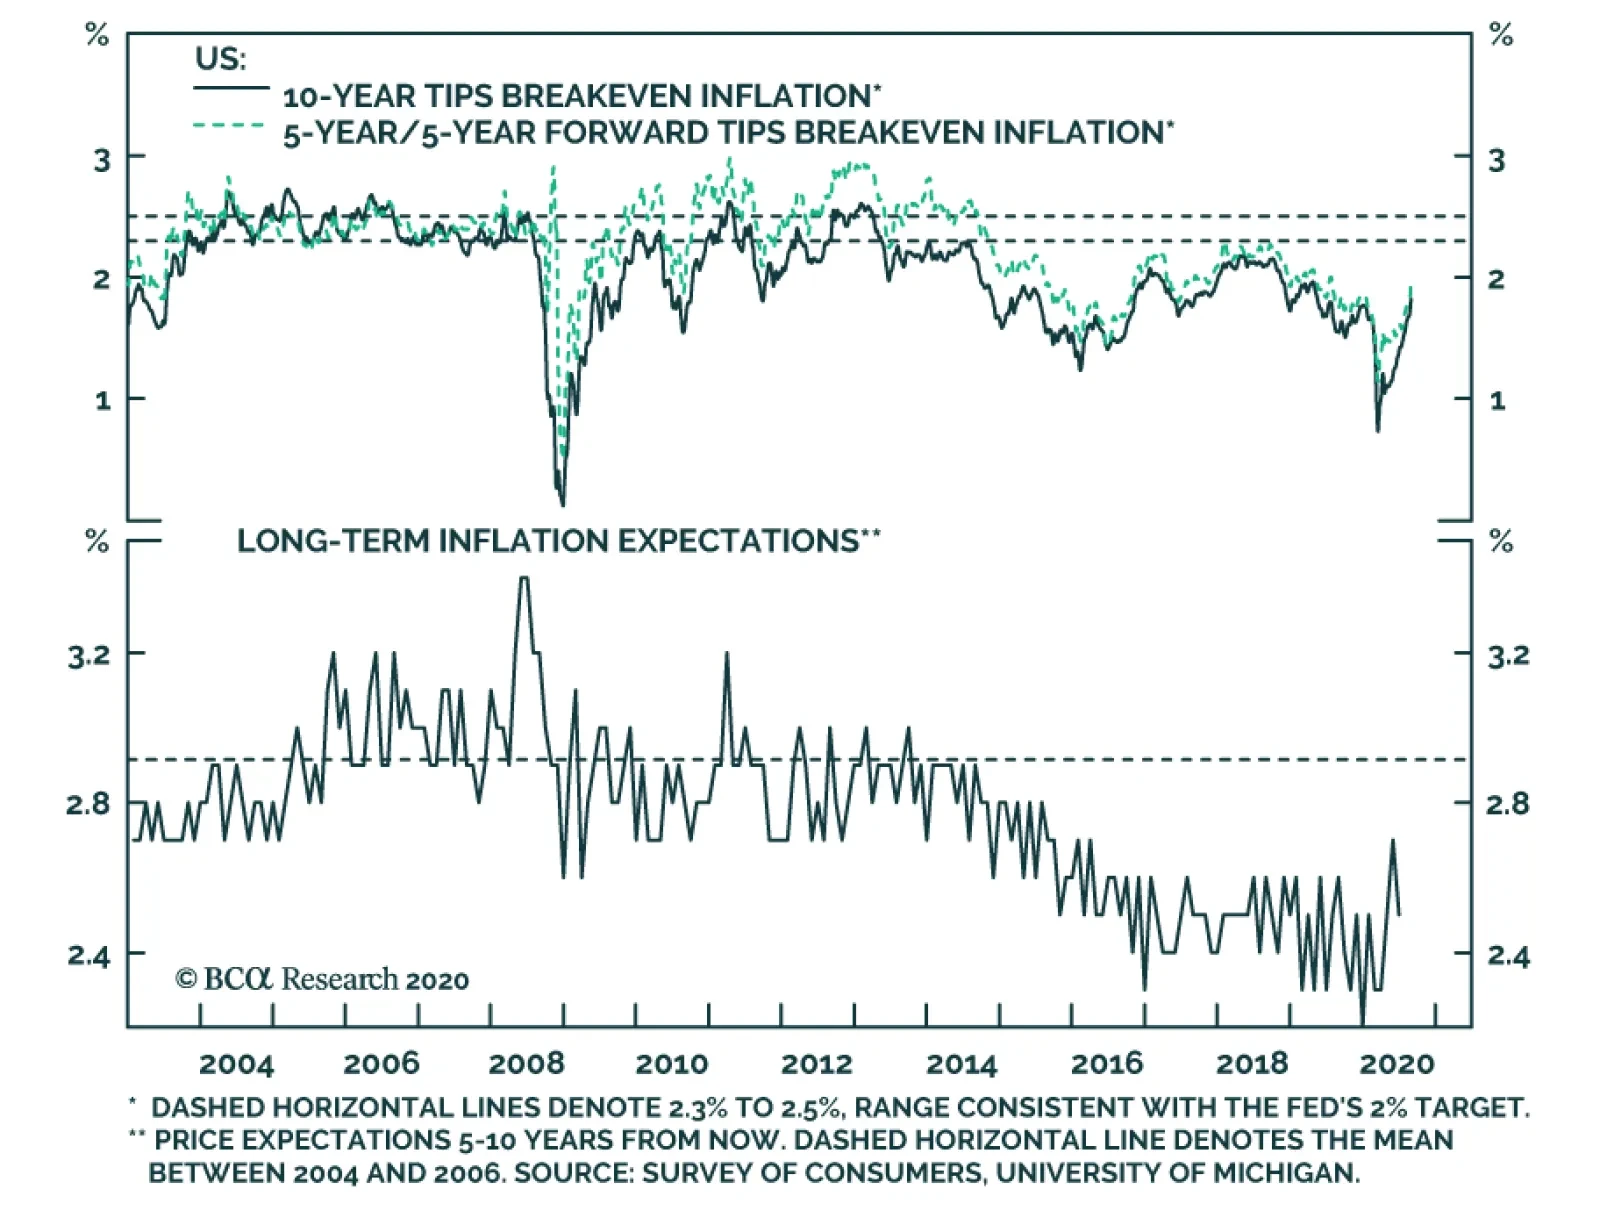
Notice that we had to make several assumptions in our above example. First, we had to assume that the Fed will seek to achieve average 2% inflation since the end of 2007. The Fed could just as easily choose a different start date for calculating the 2% average. We also assumed that the year-over-year PCE inflation rate never breaks above 3% during the overshooting phase. As of now, we have no sense of whether the Fed would act to make sure that inflation only overshoots 2% by a small amount (say, between 0.5 and 1 percentage point) or whether it would tolerate a larger overshoot. A larger overshoot would potentially be more de-stabilizing, but it would allow the Fed to catch up to its price level target more quickly. We will probably get some more information about these missing details when the Fed translates its new framework into more explicit forward rate guidance (see section titled "Are There Any Additional Changes Coming?" below), but the Fed will still want to retain some flexibility. That is, we shouldn’t expect the Fed to tie its hands with a strict policy rule. This means that the question of how much inflation would prompt any future Fed tightening could linger for some time. Faced with this ambiguity, investors are advised to focus more keenly than ever on inflation expectations (Chart 2). Note that in the above excerpt from the revised Statement on Longer-Run Goals and Monetary Policy Strategy, the explicit goal of average inflation targeting is to “anchor long-term inflation expectations at [2 percent]”. This means that we will know that the Fed has seen enough inflation overshooting when long-term expectations are anchored at levels consistent with its 2% inflation target. We view this “well anchored” level as a range between 2.3% and 2.5% for long-dated TIPS breakeven inflation rates (top two panels). When TIPS breakevens reach those levels, we should expect the Fed to shift toward a more restrictive policy stance. Chart 2The Fed Wants Higher Inflation Expectations
The Fed Wants Higher Inflation Expectations
The Fed Wants Higher Inflation Expectations
How long will it take for TIPS breakevens to reach our target range? We expect it will take quite some time because Fed communications alone cannot drive long-term TIPS breakevens back to target. Rather, inflation expectations tend to follow trends in the actual inflation data, so expectations will only return to well-anchored levels once inflation has risen significantly. Further, long-dated inflation expectations tend to adapt slowly to changes in the actual inflation data. Notice in Chart 3 that the 5-year/5-year forward CPI swap rate correlates much more strongly with the 8-year rate of change in CPI inflation than it does with the 1-year rate of change. This suggests that, most likely, 12-month inflation will have to run above 2% for some time before long-term TIPS breakevens sustainably return to our target range. One way to understand the link between actual inflation and inflation expectations is to look at the distribution of individual inflation forecasts. Chart 4 shows the distribution of 10-year headline CPI inflation forecasts from the Survey of Professional Forecasters from 2004 – a year when inflation expectations were well anchored around 2% – and from August 2020. Notice that a similar proportion of respondents at both points in time expect inflation to be near the Fed’s target, in a range of 2% to 2.5%. The difference is that, in 2004, a large minority of respondents anticipated a significant overshoot of the inflation target. Today, hardly anyone anticipates a significant overshoot, and many expect a significant undershoot. Chart 3Inflation Expectations Adapt Slowly To The Actual Data
Inflation Expectations Adapt Slowly To The Actual Data
Inflation Expectations Adapt Slowly To The Actual Data
Chart 4Distribution Of Inflation Forecasts ##br##(2004 & Today)
A New Dawn For US Monetary Policy
A New Dawn For US Monetary Policy
Since market prices can be thought of as a weighted average of the entire distribution of inflation forecasts, it follows that to drive TIPS breakevens higher we need to see investors shift their forecasts from the left tail of the distribution to the right tail. This will only happen if actual inflation rises, and probably only if it stays durably above 2% for a prolonged period. Chart 5shows that the percentage of respondents that expect inflation to average above 3% for the next ten years tends to follow both the long-run inflation rate and the median inflation forecast. Chart 5Few Expect Inflation To Be Above 3%
Few Expect Inflation To Be Above 3%
Few Expect Inflation To Be Above 3%
Bottom Line: The official shift to an average inflation targeting regime represents a massive structural break relative to how the Fed conducted monetary policy in the past. The main takeaway for investors should be that inflation expectations carry more weight than ever in the Fed’s thinking. In particular, we should expect the Fed to move to a more restrictive policy stance only when long-maturity TIPS breakeven inflation rates return to a well-anchored range of 2.3% to 2.5%. Some Key Questions Following The Fed’s Big Shift Does The Phillips Curve Still Matter? The second big change that the Fed made to its official Statement on Longer-Run Goals and Monetary Policy Strategy is in how it views the unemployment rate relative to its “natural” level. Specifically, the change has to do with making estimates of the natural rate of unemployment (NAIRU) less important in the Fed’s reaction function. In its old Statement, the Fed talked about minimizing “deviations of employment from the Committee’s assessments of its maximum level”. The revised Statement talks about mitigating “shortfalls of employment from the Committee’s assessment of its maximum level.” This one word change says a lot about the Fed’s faith in the Phillips curve. In the past, the Fed viewed an unemployment rate below its estimate of NAIRU as a signal that inflation was poised to accelerate. This often led to premature tightening, and over time, a pattern of missing the inflation target to the downside. Now, the Fed is explicitly saying that it only cares about shortfalls of employment from its estimated maximum level. If the labor market appears overheated, the Fed will not take this as a sign that inflation is about to accelerate. Rather, it will wait for the evidence to show up in the actual inflation data. The percentage of respondents that expect inflation to average above 3% for the next ten years tends to follow both the long run inflation rate and the median inflation forecast. This change sends a very clear signal that the Fed will put much less emphasis on expected “Phillips curve effects” in the future than it has in the past. In addition to long-term implications, this change will likely also impact the type of forward rate guidance the Fed provides this year. What’s Missing? It is also interesting to touch on the things that Powell did not mention in his Jackson Hole speech. First, as noted above, Powell provided few details on the length of time over which the Fed will seek to hit average 2% inflation and did not specify any upper limit to the amount of inflation the Fed would tolerate during the overshooting phase. Perhaps more importantly, Powell also did not say much about how the Fed will seek to drive inflation higher, and whether there are additional tools at his disposal that have not yet been rolled out. We think there is good reason for this. In effect, we think the Fed is more or less tapped out in terms of the amount of additional monetary easing it can provide. Negative interest rates have already been ruled out. A Yield Curve Control policy of capping intermediate-maturity bond yields has been discussed, but this policy doesn’t accomplish much beyond what the Fed is already doing with its forward rate guidance. For example, a policy of capping the 2-year Treasury yield at the current level of 0.13% has essentially the same impact on bond prices as convincing the market that the fed funds rate will stay in a range between 0% and 0.25% for the next two years or more. The notion that the Fed is “out of bullets” was hammered home during the final Jackson Hole panel on Friday. The speakers for the panel titled “Post-Pandemic Monetary Policy and the Effective Lower Bound” shifted much of the onus for boosting growth, with policy interest rates at the effective lower bound, toward fiscal policymakers. Given the limitations on the amount of additional easing that the Fed can deliver, the potent impact of the changes announced last week will not really be felt until the economic recovery is further underway. Only once inflation starts to rise will we get a test of the Fed’s resolve to stay on the sidelines. Now that the changes have been enshrined in an official Fed document, we have no doubt that they will follow through. What About The Role Of QE? Chart 6The Future Of QE: Go Big & Go Fast
The Future Of QE: Go Big & Go Fast
The Future Of QE: Go Big & Go Fast
Not every speaker at Jackson Hole, however, felt that central banks had run out of policy options. Bank of England (BoE) Governor Andrew Bailey gave a speech on Day Two of the conference that focused on the use of central bank balance sheets as a more regular part of policymakers’ toolkits over the next decade with policy rates at the effective lower bound. Bailey noted that the use of quantitative easing (QE) in the future would be less about signaling future central bank intentions on interest rates, or forcing changes to the composition of assets held by the private sector, and would be more about “going big and going fast” to calm financial markets during periods of instability.3 Some past examples of such use of QE include the 2008 Global Financial Crisis, the 2011/12 European Debt Crisis and the 2016 UK Brexit shock (Chart 6). In Bailey’s view, QE will now have to be “state contingent”, based on the nature of the financial market shock and where liquidity (cash) needs are greatest at that time. In 2008, it was the banking system that needed liquidity, so central banks expanded their balance sheets in ways that got cash directly to the banks – like repos and government bond purchases. In 2020, the demand for liquidity from the COVID-19 shock came more from non-bank entities, like investment funds or the corporate sector itself. Therefore, central bank balance sheets had to be used to support loans to the private sector or even buying private assets like corporate debt, on top of the usual QE buying of sovereign debt to help drive down risk-free bond yields. What does that mean for the new policy regime of the Fed? It means that the type of market intervention we saw earlier this year – with the Fed announcing a variety of measures to support liquidity like corporate bond purchases when markets were not functioning – will become more commonplace during periods of severe market stress. This is because there cannot be any “emergency” Fed rate cuts to calm markets if the Fed is keeping rates at very low levels to try and make up for past undershoots of its inflation target. Chart 7The Fed Has Room To Do More QE In The Future
The Fed Has Room To Do More QE In The Future
The Fed Has Room To Do More QE In The Future
This also means that the balance sheets of the Fed, and other major global central banks, will likely continue to get larger over time. Tapering of balance sheets, as the Fed engineered during 2014-19, will become very rare events before inflation expectations are stabilized at policymaker targets. That does raise issues of capacity constraints for QE programs, as Bailey mentioned in his speech, where the central bank footprint in financial markets becomes so large as to impair market functionality. That is the case today where the Bank of Japan now owns nearly 50% of all outstanding Japanese government bonds (JGB) and the day-to-day liquidity in the JGB market is extremely challenging for market participants that need to buy and trade JGBs, like Japanese banks and investment funds. Bailey noted that there was still ample capacity for the BoE to ramp up its buying of UK Gilts (and even UK corporate debt) before the sheer size of its presence became a BoJ-like problem for the UK bond market (Chart 7). The same can be argued in the US, where the Fed only owns a little over 20% of outstanding US Treasuries – the supply of which is growing rapidly thanks to large US budget deficits. Are There Any Additional Changes Coming? As we outlined in a recent US Bond Strategy Webcast, after revising the Statement on Longer-Run Goals and Monetary Policy Strategy, the Fed’s next step will be to provide more explicit guidance about the economic conditions that will have to be in place before it considers lifting the fed funds rate.4 We speculate that this next announcement will occur before the end of the year, possibly at this month’s FOMC meeting, and that the guidance will be similar to the Evans Rule employed in 2012. The Evans Rule was a promise that the Fed would not lift rates at least until the unemployment rate was below 6.5% or inflation was above 2.5%. For the 2020 version of the Evans Rule, policymakers had been debating whether to specify both an unemployment target and an inflation target, as was done in 2012, or whether to specify only an inflation target. With the Fed’s new Statement putting much less emphasis on Phillips curve effects and estimates of NAIRU, it now appears much more likely that the 2020 version of the Evans Rule will have only an inflation trigger, or perhaps an inflation trigger and an inflation expectations trigger. Bottom Line: There are still many lingering unanswered questions about the new Fed strategy, but what we do know is that the Fed will focus more on inflation, rather than forecasts of inflation, when making future interest rate decisions. The Fed will also likely use its balance sheet more as a market stability tool during times of crisis. Investment Implications Chart 8Financial Conditions
Financial Conditions
Financial Conditions
The first implication of the Fed’s big shift has to do with the long-run outlook for risk asset prices (corporate bonds, equities and other fixed income spread product). With the Fed committing to give the economic recovery more runway before choking it off, risk asset valuations have been provided with a massive tailwind. In fact, the longer it takes for inflation to move up, the longer the Fed will stay on hold and the more expensive risk asset valuations will become. It is even possible that, if inflation remains subdued for a few more years, risk asset valuations will become so stretched that the Fed might have to exercise its financial stability “out clause”. That is, if the Fed viewed a growing asset bubble as a threat to the economic recovery and/or financial system, it could abandon its inflation target and lift interest rates to deflate that bubble. This out clause is specifically enshrined in the Fed’s Statement on Longer-Run Goals and Monetary Policy Strategy: Moreover, sustainably achieving maximum employment and price stability depends on a stable financial system. Therefore, the Committee’s policy decisions reflect its longer-run goals, its medium-term outlook, and its assessments of the balance of risks, including risks to the financial system that could impede the attainment of the Committee’s goals. We should stress that US financial asset valuations are currently nowhere near expensive enough to prompt this sort of move (Chart 8). However, that picture could change after a few more years of low inflation and zero interest rates. We have been saying since March 2019 that the two most important indicators to watch for gauging the eventual pace of Fed tightening are inflation expectations and financial conditions.5 Last week’s announcement serves to reinforce that view. The Fed could abandon its inflation target and lift interest rates to combat a growing asset bubble. A second investment implication of the Fed’s announcement is that TIPS will continue to outperform nominal US Treasuries until there is an eventual re-anchoring of long-run TIPS breakeven inflation rates in a range between 2.3% and 2.5%. As noted above, this structural investment position could take some time to pan out, and we may even get an opportunity to tactically position for periods of TIPS underperformance if breakevens start to look too high compared to the actual inflation data.6 For now, our models suggest that TIPS breakevens are fairly valued relative to the actual inflation data, and we recommend staying overweight TIPS versus nominal Treasuries as a core allocation in fixed income portfolios. We would also advise investors to enter flatteners along the inflation protection curve (TIPS breakevens or CPI swaps). This recommendation flows directly from the Fed’s announcement. If the Fed is eventually successful at achieving a temporary overshoot of its 2% inflation target, then the cost of short-maturity inflation protection should rise above the cost of long-maturity inflation protection. That is, the inflation protection curve should invert (Chart 9). This would be a stark dislocation compared to the past, but it is a logical one if the Fed is to be attacking its inflation target from above instead of from below. As for nominal Treasury yields, our baseline view is that yields will be flat-to-higher over the next 12 months, with the amount of upside dictated by the pace of economic recovery. The Fed’s extraordinarily dovish monetary policy will keep some downward pressure on nominal yields, but expectations of Fed tightening will eventually infiltrate the long end of the curve. Given that the Fed’s grip is much firmer at the short end of the curve than at the long end, we prefer to play the nominal Treasury curve through yield curve steepeners rather than through outright duration bets (Chart 10). Chart 9Position For Inflation Curve Inversion
Position For Inflation Curve Inversion
Position For Inflation Curve Inversion
Chart 10Enter Nominal Curve Steepeners
Enter Nominal Curve Steepeners
Enter Nominal Curve Steepeners
Finally, the level of real yields is perhaps the trickiest to get right in the current environment. The Fed’s dovish policies are clearly meant to push real yields down, but now that those policies have been announced, it may signal that we are near the trough. In fact, real yields actually rose somewhat on Thursday after the Fed’s announcement. As with nominal yields, we prefer to play the real Treasury (TIPS) curve via steepeners (Chart 11). Whether or not the Fed is able to apply further downward pressure on real yields, as long as its policies are viewed as reflationary and the economic recovery is maintained, then the real yield curve has ample room to steepen. Chart 11Enter Real Curve Steepeners
Enter Real Curve Steepeners
Enter Real Curve Steepeners
Bottom Line: The Fed’s new policy framework supports our current US fixed income recommendations: a neutral duration stance; overweighting TIPS versus nominal US Treasuries; positioning for real yield curve (TIPS) steepeners; and overweighting US spread product most directly supported by the Fed’s balance sheet (i.e. investment grade corporates and Ba-rated high-yield). Ryan Swift US Bond Strategist rswift@bcaresearch.com Robert Robis, CFA Chief Fixed Income Strategist rrobis@bcaresearch.com Footnotes 1 https://www.youtube.com/user/KansasCityFed 2 https://www.federalreserve.gov/monetarypolicy/guide-to-changes-in-statement-on-longer-run-goals-monetary-policy-strategy.htm 3 The full text of BoE Governor Bailey’s speech can be found here: https://www.bankofengland.co.uk/speech/2020/andrew-bailey-federal-reserve-bank-of-kansas-citys-economic-policy-symposium-2020 4 https://www.bcaresearch.com/webcasts/detail/338 5 Please see US Bond Strategy Weekly Report, “The New Battleground For Monetary Policy”, dated March 26, 2019, available at usbs.bcaresearch.com 6 This possibility is discussed in US Bond Strategy Weekly Report, “Positioning For Reflation And Avoiding Deflation”, dated August 11, 2020, available at usbs.bcaresearch.com