United States
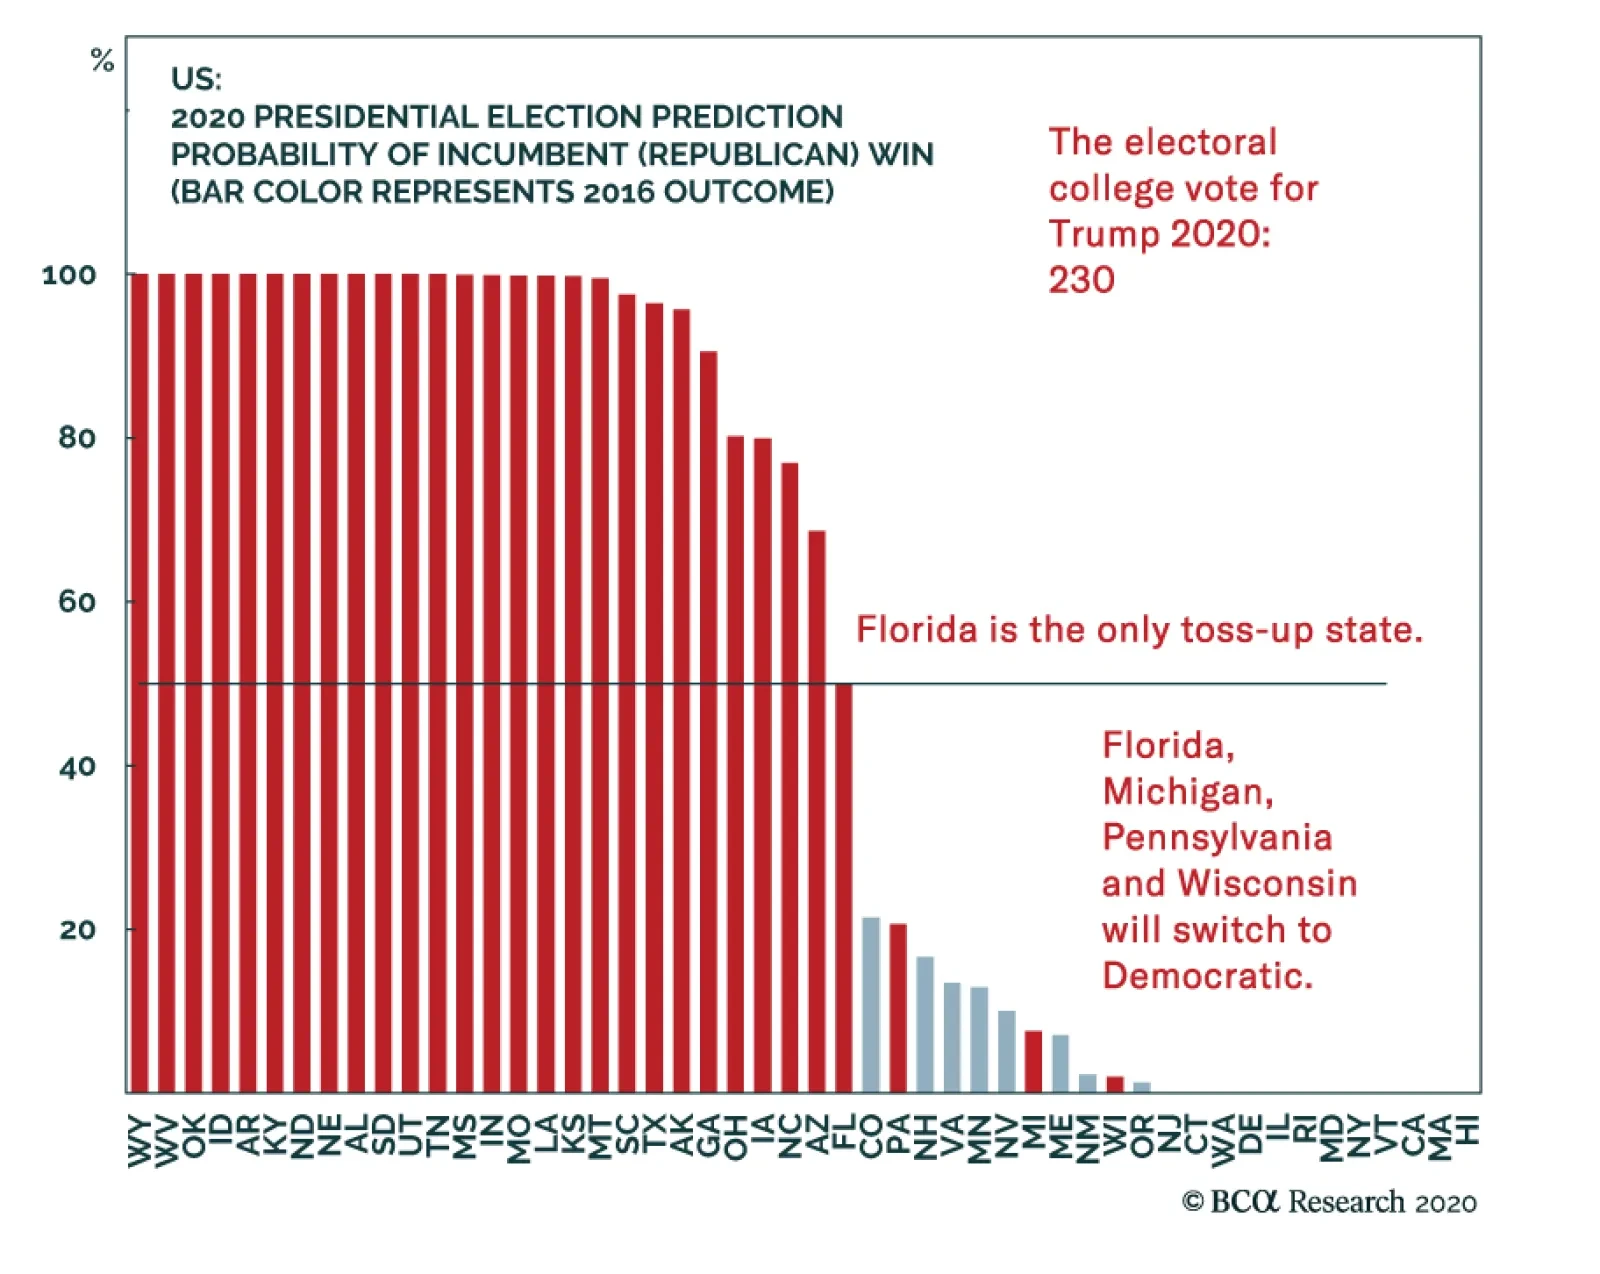
BCA Research’s Geopolitical Strategy service’s quantitative election model now shows Florida as a toss-up state with a 50% chance of flipping back into the Republican fold. As long as the economy continues recovering between now and November 3, Florida…
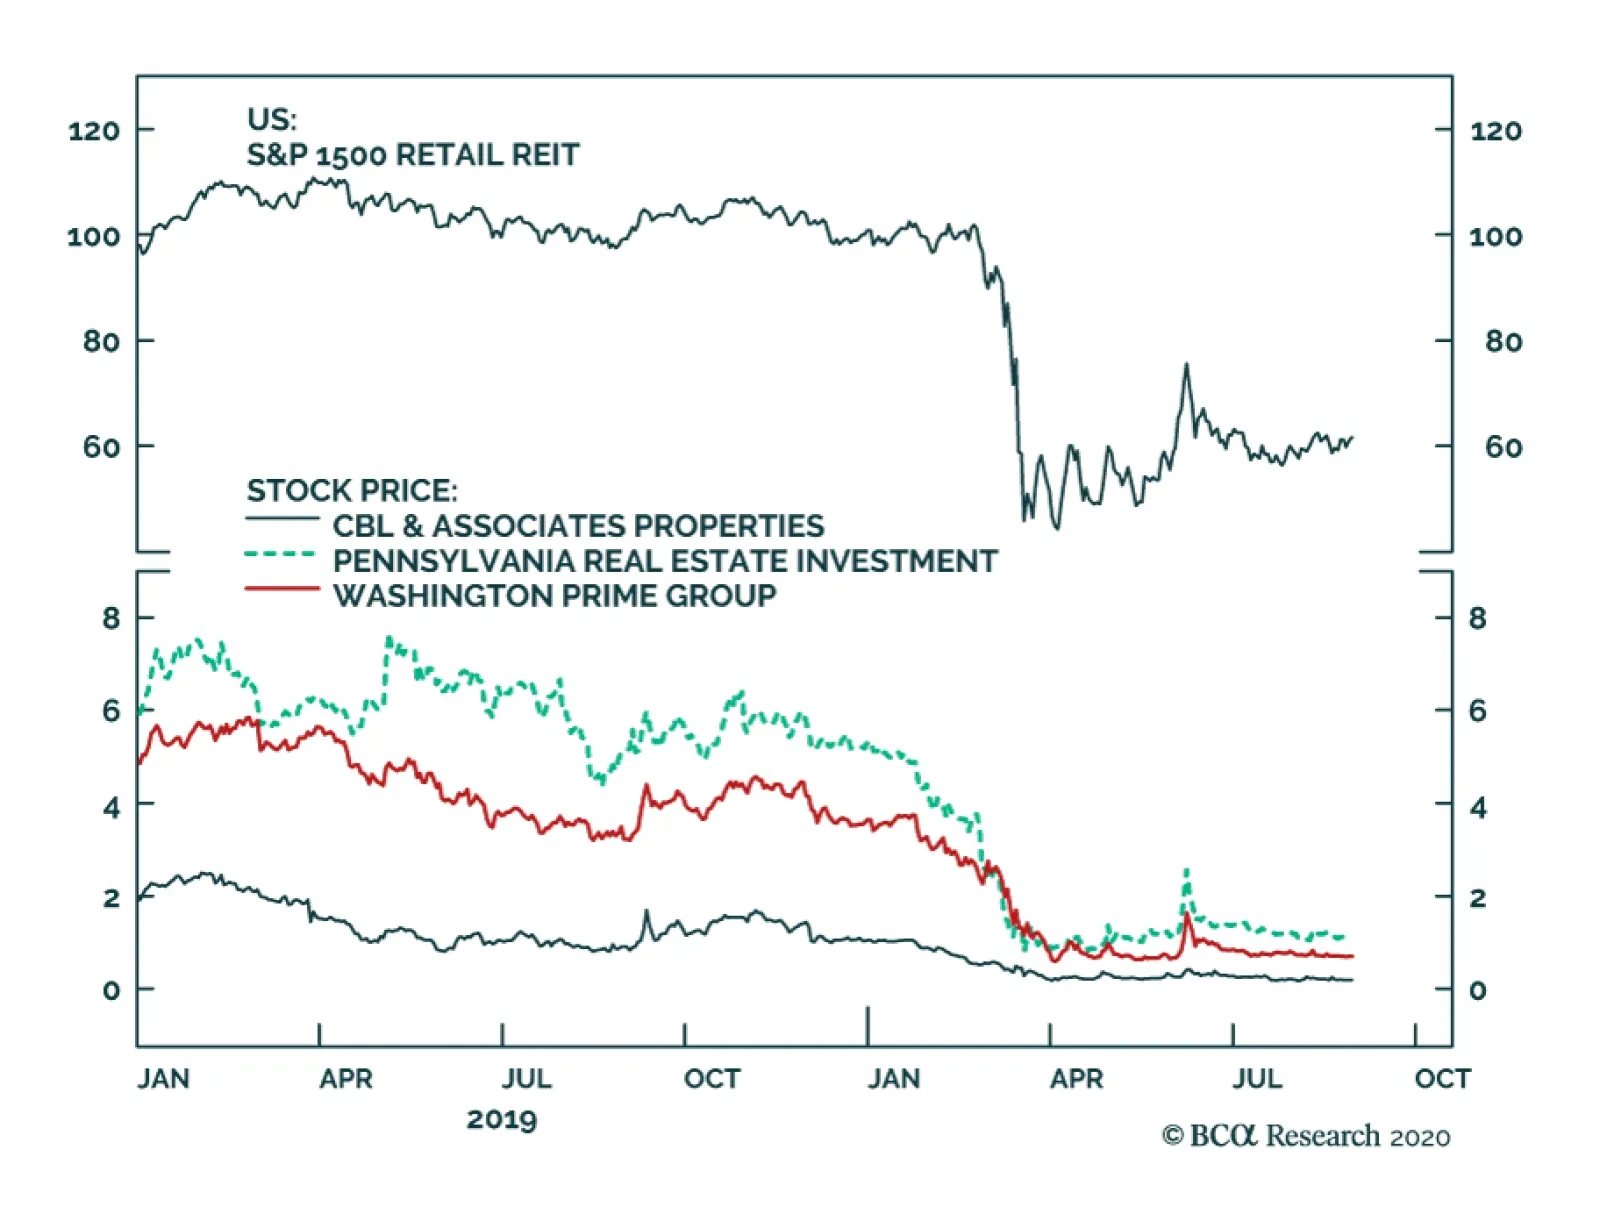
BCA Research’s US Investment Strategy service argues that despite investor worries, while several malls are likely to fail in in 2020 and 2021 their disappearances are not likely to hurt the economy. Retail properties do not undergird the banking system…
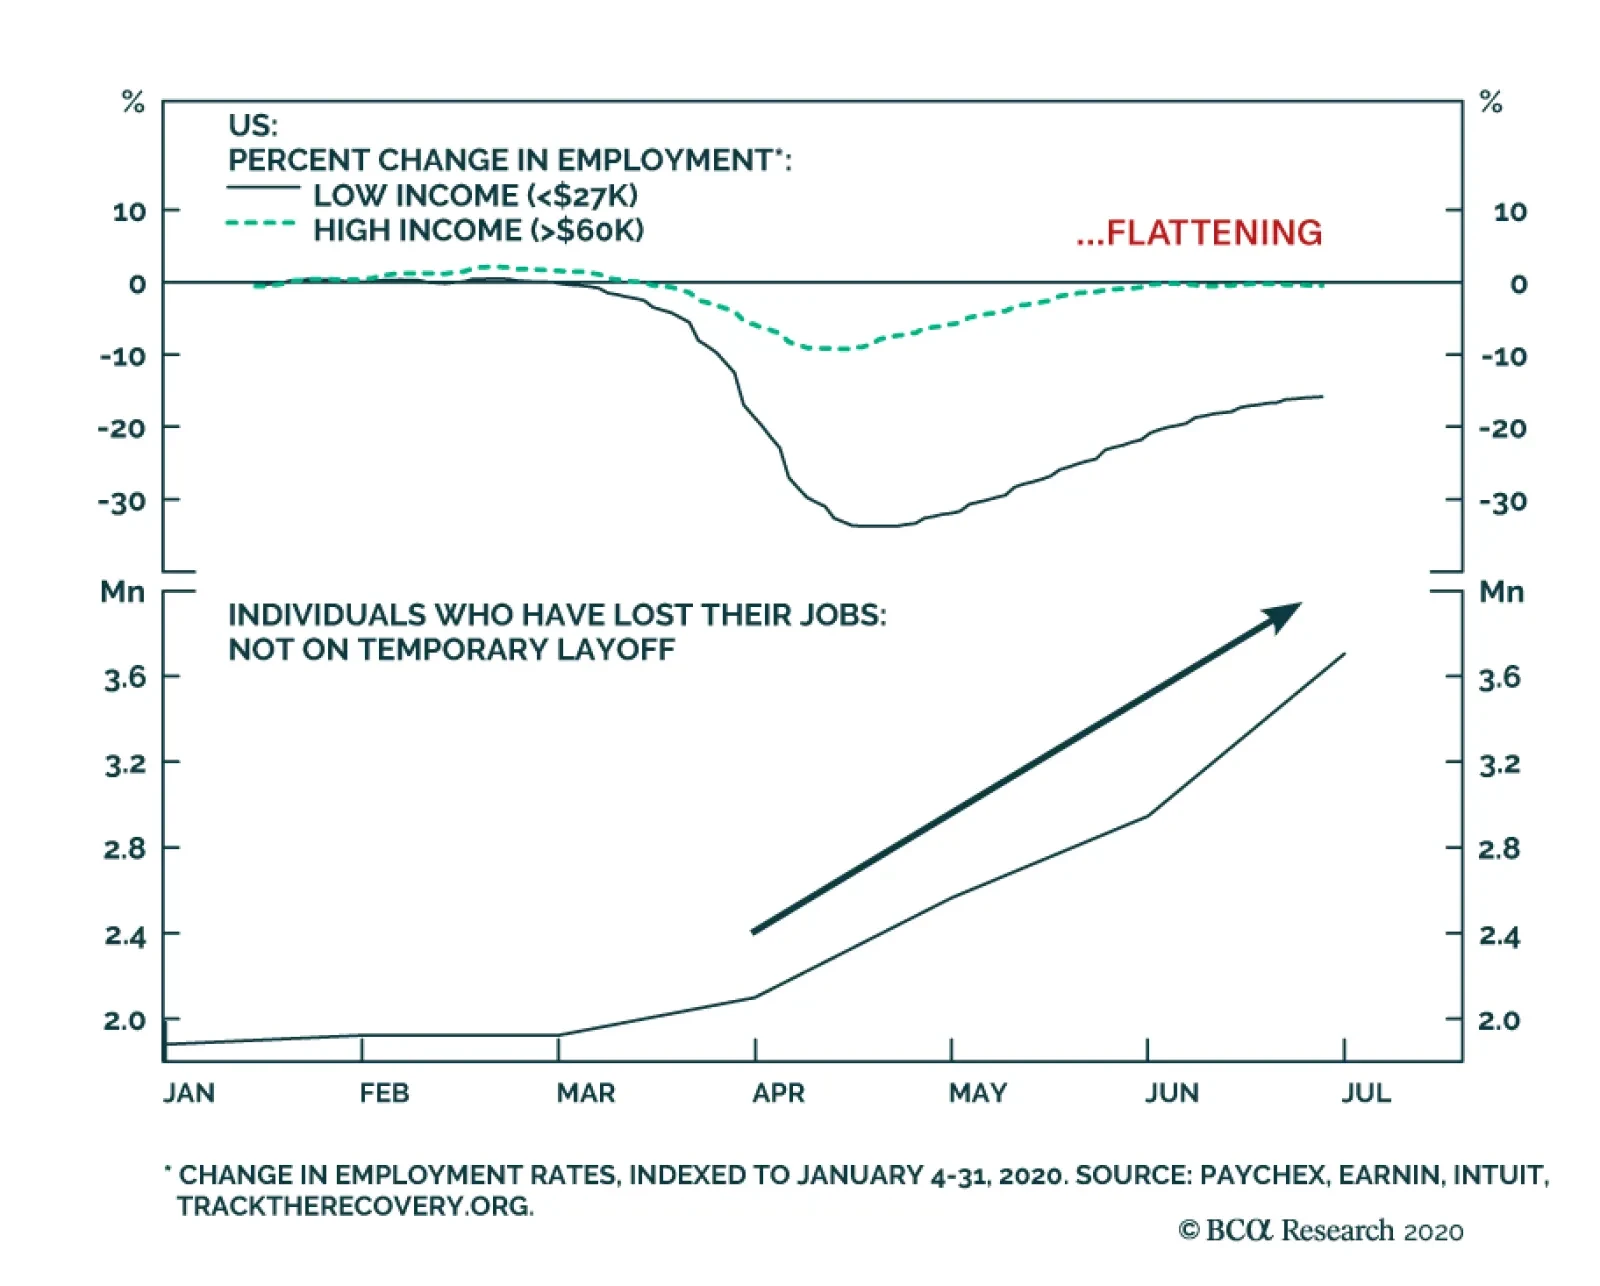
The US labor market recovery has been losing steam, and the rising number of permanent job losses is concerning. Moreover, higher-wage workers have not seen any gain in employment since late May. A stagnation in job creation was to be expected after the…

Highlights President Trump is making a comeback in our quantitative election model. An upgrade from our 35% odds of a Trump win is on the horizon, pending a fiscal relief bill. The Fed’s pursuit of “maximum employment,” the necessities of the pandemic response, fiscal largesse, a US shift toward protectionism, and the strategic need to counter China will pervade either candidate’s presidency. A Democratic “clean sweep” would add insult to injury for value stocks, but these stocks don’t have much more downside relative to growth stocks. Trump’s tariffs, or Biden’s taxes, will hit the outperformance of Big Tech, as will the recovery of inflation expectations. Feature More than at any time in recent US history, voters believe that the 2020 election is definitive in charting two distinct courses for the country (Chart 1). No doubt 2020 is an epic election with far-reaching implications. However, from an investment point of view, a Trump and a Biden administration have more in common than consensus holds. Chart 1An Epic Choice About The US’s Future
Trump Versus Biden: Tariffs Versus Taxes
Trump Versus Biden: Tariffs Versus Taxes
The US political parties have finalized their policy platforms, giving investors greater clarity about what policies the parties will try to implement over the next four years.1 While the presidential pick is critical for American foreign and trade policy, the Senate is just as important as the president for US equity sectors. The only dramatic changes would come if the Democrats achieved a clean sweep of government – yet this result is likely as things stand today (Chart 2). Investors should prepare. It would prolong the suffering of value stocks relative to growth stocks by hitting the US health care and energy sectors hard. Chart 2“Blue Wave” Still The Likeliest Scenario
Trump Versus Biden: Tariffs Versus Taxes
Trump Versus Biden: Tariffs Versus Taxes
The State Of Play A “Blue Wave” is still the likeliest outcome – and that’s where the stark policy differences emerge. The race is tightening. Our quantitative election model looks at state leading indicators, margins of victory in 2016, the range of the president’s approval rating, and a “time for change” variable that gives the incumbent party an advantage if it has not been in the White House for eight years. The model now shows Florida as a toss-up state with a 50% chance of flipping back into the Republican fold (Chart 3). Chart 3Florida Now 50/50 In Our Election Quant Model – 45% Chance Of Trump Win
Trump Versus Biden: Tariffs Versus Taxes
Trump Versus Biden: Tariffs Versus Taxes
As long as the economy continues recovering between now and November 3, Florida should flip and Trump should go from 230 Electoral College votes to 259. One other state – plus one of the stray electoral votes from either Nebraska or Maine, which Trump is like to get – would deliver him the Oval Office again. The model says that Trump has a 45% chance of victory, up from 42% last month. Subjectively, we are more pessimistic than the model. Pandemic, recession, and social unrest have taken a toll on voters and unemployment is nearly three times as high as when Trump’s approval rating peaked in March. Consumer confidence is weak, albeit making an effort to trough. Voters take their cue from the jobs market more than the stock market, although the stock rally is certainly helpful for the incumbent. We await the completion of a new fiscal relief bill in Congress before upgrading Trump to closer to our model’s odds and the market consensus of 45%. Another Social Lockdown? COVID-19 subsiding in the US a boon for Trump in final two months of campaign. The first concern for the next president is COVID-19. On the surface Trump and Biden are diametrically opposed. President Trump is obviously disinclined to impose a new round of lockdowns and the Republican platform calls for normalizing the economy in 2021. By contrast, the Democrats claim they will contain the virus even at a high economic cost. Biden says he will be willing to shut down the entire US economy again if scientists deem it necessary.2 There is apparently political will for new draconian lockdowns – but it is not likely to be sustained after the election unless the next wave of the virus is overwhelming (Chart 4). Biden will need to be cognizant of the economy if he is to succeed. Chart 4Biden Has Some Support For Another Lockdown
Trump Versus Biden: Tariffs Versus Taxes
Trump Versus Biden: Tariffs Versus Taxes
However, it is doubtful that Trump would refuse to lock down the economy in his second term if his advisers told him it was necessary. After all, it is Trump, not Biden, who implemented the lockdowns this year. Arguably he reopened the economy too soon with the election in mind. But if that is true, then it isn’t an issue for his second term, since he can’t run for president a third time. This is a theme we often come back to: reelection removes a critical impediment to Trump’s policies in a second term as opposed to his first. Bottom Line: The coronavirus outbreak and the country’s top experts will decide if new lockdowns are warranted, regardless of president, but the bar for a complete shutdown is high. COVID-19 is subsiding in both the US and in countries like Sweden that never imposed draconian lockdowns (Chart 5). Still, given that the equity market has recovered to pre-COVID highs, investors would be wise to hedge against a bad outcome this winter. Chart 5Pandemic Subsiding In US And ‘Laissez-Faire’ Sweden
Trump Versus Biden: Tariffs Versus Taxes
Trump Versus Biden: Tariffs Versus Taxes
Maximum Employment The monetary policy backdrop will be ultra-dovish regardless of the presidency. The Fed is now pursuing average inflation targeting and “maximum employment,” according to Fed Chairman Jay Powell, speaking virtually on August 27 at the Kansas City Fed’s annual Jackson Hole summit. This means that if Trump wins, he will not have to fight running battles with Powell over rate hikes. The monetary backdrop for either president will be more reminiscent of that faced by President Obama from 2009-12 – extremely accommodative. It is possible that Trump’s “growth at all costs” attitude could lead to speculative bubbles that the Fed would need to prick. Already the NASDAQ 100 is off the charts. Elements of froth reminiscent of the dotcom bubble era are mushrooming (Chart 6). Nobody has any idea yet how the Fed will square its maximum employment mission with the need to prevent financial instability, but it will err on the side of low rates. Chart 6Frothy NDX
Frothy NDX
Frothy NDX
Chart 7The Mother Of All V-Shapes
The Mother Of All V-Shapes
The Mother Of All V-Shapes
Biden will be more likely to tamp down financial excesses through executive orders – or to deter excesses through taxes if he controls the Senate. But there is no reason the executive branch would be more vigilant than the Fed itself. Higher inflation will push real rates down and weaken the dollar almost regardless of who wins the presidency. Trump’s trade wars – and any major conflict with China – would tend to prop up the greenback relative to Biden’s less hawkish, more multilateral, approach. But either way the combination of debt monetization, twin deficits, and global economic recovery spells downside for the dollar. This in turn spells upside for the S&P500 and inflation-friendly (or deflation-unfriendly) equity sectors in the longer run (Chart 7). Fiscal Largesse The next president will struggle with a massive fiscal hangover resembling late 1940s. The Fed’s new strategy ensures that fiscal policy will prove the driving factor in the US macro outlook. Regardless of who wins the election, the budget deficit will fall from its extreme heights amid the COVID-19 crisis over the next four years (Chart 8). If government spending falls faster than private activity recovers, overall demand will shrink and the economy will be foisted back into recession. Chart 8Budget Deficit Will Decrease As Economy Normalizes
Budget Deficit Will Decrease As Economy Normalizes
Budget Deficit Will Decrease As Economy Normalizes
The deep 1948-49 recession occurred because of the government’s climbing down from wartime levels of spending (Chart 9). Premature fiscal tightening would jeopardize the 2021 recovery. Yet neither candidate is a fiscal hawk. Trump is a big spender; Biden is a Democrat. The House Democrats will control the purse strings. Republican senators, the only hawkish actors left, are not all that hawkish in practice. They agreed with Trump and the Democrats in passing bipartisan spending blowouts from 2017-20. They will likely conclude another such deal just before the election. Chart 9Sharp Deficit Correction Would Jeopardize Recovery
Sharp Deficit Correction Would Jeopardize Recovery
Sharp Deficit Correction Would Jeopardize Recovery
So Trump would maintain high levels of spending without raising taxes; Biden would spend even more, albeit with higher taxes. Table 1Biden Would Raise $4 Trillion In Revenue Over Ten Years
Trump Versus Biden: Tariffs Versus Taxes
Trump Versus Biden: Tariffs Versus Taxes
On paper, Biden would add a net ~$2 trillion to the US budget deficit over ten years, as shown in Tables 1 and 2. But these are loose costings. Nobody knows anything until actual legislation is produced. The risk to spending levels lies to the upside until the employment-to-population ratio improves (Chart 10). Trump’s net effect on the deficit is even harder to estimate because the Republican Party platform is so vague. What we know is that Trump couldn’t care less about deficits. Back of the envelope, if Congress permanently cut the employee side of the payroll tax for workers who earn less than $8,000 per month, as Trump has suggested, the deficit would increase by roughly $4.8 trillion over ten years.3 Table 2Biden Would Spend $6 Trillion In Programs Over Ten Years
Trump Versus Biden: Tariffs Versus Taxes
Trump Versus Biden: Tariffs Versus Taxes
Chart 10Massive Labor Slack Will Encourage Government Spending
Massive Labor Slack Will Encourage Government Spending
Massive Labor Slack Will Encourage Government Spending
House Democrats will hardly agree to any major new tax cuts – and certainly not gigantic ones that would “raid Social Security.” This accusation will be popular and Trump will want to avoid it during the campaign as well – his 2020 platform does not explicitly mention the payroll tax. Many of Trump’s other proposals would focus on extending the Tax Cut and Jobs Act. For example, it is possible that Trump could extend the full expensing of companies’ depreciation costs for capital purchases, set to expire in 2022 and 2026, to the tune of $419 billion over ten years.4 Thus the overall contribution of government spending to GDP growth will be higher than in the recent past. This trend was established prior to COVID (Chart 11). The rise of populism supports this prediction, as Trump has always insisted he will never cut mandatory (entitlement) spending – a major change to Republican orthodoxy now enshrined in its policy platform. Chart 11Government Role To Increase In America
Government Role To Increase In America
Government Role To Increase In America
Chart 12No Cuts To Defense Likely Either
No Cuts To Defense Likely Either
No Cuts To Defense Likely Either
Meanwhile Biden is not only rejecting spending cuts but also coopting the profligate spending agenda of the left wing of his party. Practically speaking, social spending cannot be cut by Trump – and yet Biden cannot cut defense spending much either, since competition with Russia and China is growing (Chart 12). The common thread in both party platforms is fiscal largesse at a time of monetary dovishness, i.e. reflation. Other Common Denominators Market is overrating Biden’s China friendliness. Both Trump and Biden promise to build infrastructure, energize domestic manufacturing, and lower pharmaceutical prices. The two candidates are competing vociferously over who will bring more American manufacturing jobs home. President Trump won the Republican nomination in 2016 partly because he stole the Democrats’ thunder on “fair trade” over “free trade.” Biden’s agenda is effusive on these Trump (and Bernie Sanders) themes – his party sees an existential risk in the Rust Belt if it cannot steal that thunder back. The manufacturing agenda centers on China-bashing. China runs the largest trade surplus with the US, it has a negative image in the public eye, and it has alarmed the military-industrial complex by rising to the status of a peer strategic competitor over the technologies of tomorrow. Where Trump once spoke of a “border adjustment tax,” or a Reciprocal Trade Act, Biden speaks openly of a carbon border tax: “the Biden Administration will impose carbon adjustment fees or quotas on carbon-intensive goods from countries that are failing to meet their climate and environmental obligations.”5 China’s coal-guzzling economy would obviously be the prime target. It is true that Biden will seek to engage China and reset the relationship. He will probably maintain Trump’s tariff levels or even slap a token new tariff, but he will then settle down for a two-track policy of dialogue with China and coalition-building with the democracies. The result may be a reprieve from strategic tensions for a year or so. Investors are exaggerating Biden’s positive impact on China relations, judging by the correlation of China-exposed US equities with the Democrats’ odds of winning. The truth is that Biden will maintain the Obama administration’s “Pivot to Asia,” which was about countering China. The secular power struggle will persist and China-exposed stocks, especially tech, will be the victims (Chart 13). Chart 13Market Over-Optimistic About Biden Vis-à-Vis China
Market Over-Optimistic About Biden Vis-à-Vis China
Market Over-Optimistic About Biden Vis-à-Vis China
Senate election will likely tip with White House – but checks and balances are best for equities. Control of the Senate will determine whether the big differences between the two candidates materialize. Biden can’t raise taxes without the Senate; Trump can’t wage trade wars of choice as Congress is supreme over commerce and could take his magic tariff wand away from him. Trump can use executive orders to pare back immigration, but he cannot force the House Democrats to approve a southern border wall. In fact, he dropped “the Wall” from his agenda this time around. (It didn’t help that former Trump adviser Steve Bannon has been arrested for allegedly scamming people out of their money to pay for a wall.) Biden will be far looser on immigration than Trump and the reviving economy will attract foreign workers. But the Obama administration showed that during times of high unemployment, even Democrats have a limit to the influx they will allow (Chart 14). Meanwhile Biden can use executive orders to impose aspects of his version of the Green New Deal, but he cannot pass carbon pricing laws or other sweeping climate policy if Republican Senators are there to stop him. For this reason, a divided government is likely to produce three cheers from the markets. The single most market-positive scenario is Biden plus a Republican Senate, which suggests a moderation of the trade war and yet no new taxes. Second best would be Trump with a Democratic Congress that would clip his wings on tariffs, but enable him to veto any anti-market laws. The stock market’s performance to date is more reminiscent of a “gridlock” election outcome, in which the two parties split the executive and legislative branches of government in some way, as opposed to a unified single-party government (Chart 15). Chart 14Immigration Faces Limits Even Under Democrats
Trump Versus Biden: Tariffs Versus Taxes
Trump Versus Biden: Tariffs Versus Taxes
Chart 15Stock Market Expects Gridlock?
Stock Market Expects Gridlock?
Stock Market Expects Gridlock?
Investors should not be complacent, however, because the political polling so far suggests that the Senate race is on a knife’s edge. The balance of power will tilt whichever way the heavily nationalized, heavily polarized White House race tilts (Chart 16). A “blue sweep” is still a fairly high probability. Indeed a Biden win will most likely produce a Democratic sweep while a Trump win will produce the status quo. Chart 16Tight Senate Races Will Turn On White House Race
Trump Versus Biden: Tariffs Versus Taxes
Trump Versus Biden: Tariffs Versus Taxes
Biden’s Agenda After A Blue Sweep Democrats would remove the filibuster – another big difference in outcomes. Biden is more likely to benefit from Democratic control of Congress if he wins. He is also more likely to rely on his top advisers and the party apparatus. Hence the Democratic platform matters more than the Republican platform in this cycle. Investors should set as their base case that a new president will largely succeed in passing his top one or two priorities. Less conviction is warranted after the initial rush of policymaking, as political capital will fall and the economic context will change. But in the honeymoon period, a president can get a lot done, especially if his party controls Congress. Investors would have been wrong to bet against George W. Bush’s Economic Growth and Tax Relief Act (2001), Barack Obama’s Affordable Care Act (2009), or Trump’s Tax Cut and Jobs Act (2017). Yet they could never have known that COVID-19 would strike in Trump’s fourth year and overturn the very best macroeconomic forecasts. Critically, if Democrats take the Senate, our base case is that they will remove the filibuster, i.e. the use of debate to block legislation. Biden has suggested that he would look at doing so. President Obama recently linked it to racist Jim Crow laws of the late nineteenth and early twentieth centuries, making it hard for party members to defend keeping the filibuster. Senate minority leader Charles Schumer (D, NY) has signaled a willingness to change the Senate rules if he becomes majority leader. Removing the filibuster would change the game of US lawmaking, enabling the Senate to pass laws with a simple majority of 51 votes – i.e. 50 plus a Democratic vice president. This is entirely within reach. While a handful of moderate Democratic senators may oppose such a dramatic move at first, the Democratic Party leadership will corral its members once it faces the reality of the 60-vote requirement blocking its agenda. The party will remember the last time it took power after a national crisis, in 2009, and the frustrations that the filibuster caused despite having at that time a much stronger Senate majority than it can possibly have in 2021. Populism is rife in the US and it is all about shattering norms. Moreover, the filibuster has already been eroding over the past two administrations (vide judicial appointments). Revoking it would enable Democrats to pass a lot more ambitious legislation, and many more laws, than in previous administrations. This is important because Biden’s agenda is more left-wing than some investors realize given his history as a traditional Democrat. In order to solidify the increasingly powerful progressive faction of his party, symbolized by Vermont Senator Bernie Sanders, Biden created task forces to merge his agenda with that of Sanders. Sanders and his fellow progressive Senator Elizabeth Warren of Massachusetts have much more influence in the party than their 35% share of the Democratic primary vote implies. The youth wing of the party shares their enthusiasm for Big Government. Here are the key structural changes that matter to investors: Offering public health insurance – A public health option will benefit from government subsidies and thus outcompete private options, reducing their pricing power. The lowest income earners will be enrolled in the program automatically, rapidly boosting its size (Chart 17). Enabling Medicare to negotiate drug prices – Medicare’s drug spending is equivalent to almost 45% of Big Pharma’s total sales. Enabling this government program to bargain with companies over prices will push down prices substantially. However, the sector’s performance is not really tied to election dynamics because President Trump is also pledging to cap drug prices – it is an effect of populism (Chart 18). Doubling the federal minimum wage – The wage will rise from $7.25 to $15 per hour, hitting low margin franchises and small businesses alike. Chart 17Health Care Gives Back Gains After Biden Nomination
Health Care Gives Back Gains After Biden Nomination
Health Care Gives Back Gains After Biden Nomination
Chart 18Big Pharma Faces Onslaught From Both Parties
Big Pharma Faces Onslaught From Both Parties
Big Pharma Faces Onslaught From Both Parties
Eliminating carbon emissions from power generation by 2035 – Countries are already rapidly shifting from coal to natural gas, but the Biden agenda would attempt to move rapidly away from fossil fuels completely (Chart 19). If legislation passes it will revolutionize the energy sector. Prohibiting “right to work” laws – This is only one example of a sweeping pro-labor agenda that would involve an extensive regulatory push and possibly new laws. New laws would prevent states from passing “right to work” laws that give workers more freedoms to eschew labor unions. The removal of the filibuster makes this possible. Moreover Biden will be aggressive in using executive orders to implement a pro-labor agenda, going further than Bill Clinton or Barack Obama attempted to do in recognition of the party’s shift to the left of the political spectrum. Chart 19Blue Sweep Would Bring Climate Policy Onslaught
Trump Versus Biden: Tariffs Versus Taxes
Trump Versus Biden: Tariffs Versus Taxes
Subsidizing college tuition and low-income housing. US housing subsidies currently make up 25% of domestic private investment in housing and Biden’s government would roll out a significant expansion of these programs. Granting Washington, DC statehood – This is unlikely to happen as two-thirds of Americans are against it. But without the filibuster, Democrats could conceivably railroad it through. Trump’s Agenda Trump’s signature is tariffs – and globally exposed stocks know it. If Trump wins, his domestic legislative agenda will be stymied, other than laws directly aimed at fighting the pandemic and reviving the economy. As mentioned, Trump is unlikely to pass a law building a wall on the southern border. It is conceivable that Trump could pass a comprehensive immigration reform bill with House Democrats, but that is not a priority on the platform and Trump would have to pivot toward compromise. That would depend on Democrats winning the Senate or forcing him to negotiate with the House. Hence a Trump second term will mostly focus on foreign and trade policy. The Republican platform is aggressive on economic decoupling from China, which is ranked third behind tax cuts and pandemic stockpiles.6 Trump, vindicated on protectionism, would likely go after other trade surplus nations. The Chinese could offer some concessions, producing a Phase Two deal early in his second term to avoid sweeping tariffs and encourage him to wage trade war against Europe (Chart 20). Chart 20Trump = Global Trade War
Trump = Global Trade War
Trump = Global Trade War
Trump’s foreign policy would consist of reducing US commitments abroad. Withdrawing from Afghanistan and other scattered conflicts is hardly a game changer. Shifting some forces back from Germany and especially South Korea is far more consequential. It will create power vacuums. But the US is not likely to abandon the allies wholesale. Chart 21Defense Stocks Will Get Wind In Sails
Defense Stocks Will Get Wind In Sails
Defense Stocks Will Get Wind In Sails
Trump has moderated his positions on NATO and other defense priorities over his first term. It is possible he could revert back to his original preferences in a second term, however, so global power vacuums and geopolitical multipolarity will remain a major source of risk for global investors. He will probably also succeed in maintaining large defense spending, despite a Democratic House, given the reality of great power struggle with China and Russia. Geopolitical multipolarity means that defense stocks will continue to enjoy a tailwind from demand both at home and abroad (Chart 21). Investment Takeaways Energy sector struggles most under Democrats. Biden and Trump are both offering reflationary agendas. Where the two agendas diverge most notably, the impacts are largely market-negative – Trump via tariffs, Biden via taxes. The current signals from the market suggest that growth stocks benefit more from a Democratic clean sweep than value stocks (bottom panel, Chart 22). However, the general collapse in value stocks versus growth suggests that there is not much more downside even if the Democrats win (top panel, Chart 22), especially if the 10-year yield rises, as we have been writing in recent research: a selloff in the bond market is the last QE5 puzzle-piece to fall into place. Fed policy, fiscal largess, and the dollar’s decline will support a global cyclical recovery and downtrodden value stocks regardless of the president. The difference is that Biden would slow their relative recovery by piling regulatory burdens on energy as well as health care, which in the US context are a value play. As a reminder, and contrary to popular belief, health care stocks are the largest constituent of the S&P value index with a market cap weight of 21%.7 Trump’s populist “growth at any cost” and deregulatory agenda would persist in a second term and clearly favor value. Yet, if his trade wars get out of hand, they would also weigh on the recovery of these stocks. The difference is that tech stocks are not priced for a Phase Two trade war. If Trump wins it will be a rude awakening. Not to mention that Trump and populist Republicans will seek to target the tech sector for what is increasingly flagrant favoritism in political and cultural debates. Democrats are much more clearly aligned with tech. While they have ambitions of reining in the tech giants as part of the progressive drive against corporate power writ large, Joe Biden will struggle to take on Big O&G, Big Pharma, Big Insurance, and Big Tech at the same time in a single four-year term. The logical conclusion is that he will spare Silicon Valley, which maintained a powerful alliance with the Obama administration. He cannot afford to betray his progressive base when it comes to climate policy, so the Obama alliance with domestic O&G producers will suffer. Tech will face regulatory risks but they will not be existential. Chart 22Not Much Downside Left For Value Stocks
Not Much Downside Left For Value Stocks
Not Much Downside Left For Value Stocks
The fact that the final version of the Democratic Party platform did not contain a section on removing federal subsidies for fossil fuels is merely rhetorical.8 The one clear market reaction from this election cycle is the energy sector’s abhorrence of Democratic policies (Chart 23). The difference is that energy is priced for it whereas tech is priced for perfection. Chart 23Energy Sector Loses From Blue Sweep
Energy Sector Loses From Blue Sweep
Energy Sector Loses From Blue Sweep
Matt Gertken Geopolitical Strategist mattg@bcaresearch.com Anastasios Avgeriou US Equity Strategist anastasios@bcaresearch.com Footnotes 1 In this report we work from the latest policy platforms available. See “Trump Campaign Announces President Trump’s 2nd Term Agenda: Fighting For You!” Trump Campaign, donaldjtrump.com ; and the draft “2020 Democratic Party Platform” Democratic National Committee, demconvention.com. 2 Bill Barrow, “Biden Says he’d shut down economy if scientists recommended,” Associated Press, August 23, 2020, abcnews.go.com. 3 See Seth Hanlon and Christian E. Weller, “Trump’s Plan To Defund Social Security,” Center for American Progress, August 12, 2020, americanprogress.org; “The 2020 Annual Report Of The Board Of Trustrees Of The Federal Old-Age And Survivors Insurance And Federal Disability Insurance Trust Funds,” Social Security Administration, April 22, 2020, ssa.gov. 4 Erica York, “Details And Analysis Of The CREATE JOBS Act,” Tax Foundation, July 30, 2020, taxfoundation.org. 5 See “The Biden Plan For A Clean Energy Revolution And Environmental Justice,” Biden Campaign, joebiden.com. 6 A Democratic Congress could take back the constitutional power over commerce that it delegated to the president back in the 1960s-70s, limiting Trump’s ability to wage trade war. If Republicans hold the Senate, they still might restrain Trump’s protectionism, as they did with his threatened Mexico tariffs in early 2019, but they would not do so until he has already taken a major disruptive action. 7 See “S&P 500 Value,” S&P Dow Jones Indices, spglobal.com. 8 Andrew Prokop, “The Democratic Platform, Explained,” Vox, August 18, 2020, vox.com.
Highlights Several malls are likely to fail in 2020 and 2021, but the overall economy will emerge unscathed … : Although lenders will recover a good bit less than par and equity holders will be wiped out, the losses will not create an observable macroeconomic drag. … because no critical element of the financial system has concentrated exposure to them: The amounts involved are not that large and the banking system’s stake is negligible. Malls disrupted the existing retailing footprint during their rise, and now it’s their turn to be disrupted: Creative destruction is natural and healthy. It will be a net positive for the economy if obsolete malls make way for more productive uses of their space. Feature As detailed in the first part of our Mallpocalypse Special Report, enclosed shopping malls are under pressure from a variety of forces. Department stores, which have typically anchored malls, are in the throes of a protracted structural decline; the apparel retailers that fill most of the leasable area between the anchors are in disarray; and e-commerce continues to take share from brick-and-mortar retailers. The pandemic, which forced many malls to close for an extended period and will likely undermine foot traffic until an effective vaccine is available, intensified the pressure. It pushed several national store chains into bankruptcy, emboldened many of their peers to stop paying rent and stymied malls’ pivot to gyms, movie theaters, restaurants and entertainment centers to fill their vacant spaces. Property analysts and investors estimate that the weakest 25% of malls face the possibility of extinction. Their owners’ equity stakes are likely to be wiped out and their lenders will recover considerably less than par. This installment examines the macroeconomic consequences of mall investors’ losses and the obsolescence of a formerly important aspect of the capital stock. Our view is that the malls’ demise does not constitute a macro threat; the mallpocalypse is not the commercial real estate analogue of the subprime crisis. Mall Exposures Are Diffused The sparks generated by the subprime mortgage collapse helped fuel the conflagration of the global financial crisis because they eroded commercial banks’ capital base; hobbled two major investment banks such that counterparties refused to deal with them; brought about declines in the prices of homes, which constitute a meaningful share of the collateral of the US banking system; and crippled the massive multi-line insurer that had been the biggest seller of the credit default swaps that the major banks and broker-dealers were using to hedge some of their residential mortgage exposures. With so many of the biggest players circling the wagons, liquidity dried up, credit spreads blew out and a major financial crisis ensued. No bank or major bank counterparty is sitting on a pile of mall mortgages. Mall failures will not have anything close to the same impact. Retail properties do not undergird the banking system like single-family homes and exposure to them is diffused across owners and creditors that can sustain losses without setting off broad ripple effects. More than half of US malls1 are owned by publicly traded REITs with the remaining ownership scattered among several privately held specialist investors. Developing and owning real estate is a leveraged pursuit and mall owners aren’t shy about borrowing, especially Simon Property Group (SPG), the largest player in the space (Table 1). Like some of its mall REIT peers, and nearly all its shopping center/strip mall counterparts, however, it does the bulk of its borrowing via bond issues. The effect is to reduce the concentration of creditor exposures; instead of borrowing from a bank or a syndicate of banks, SPG and many other publicly traded REITs sell bonds to a range of institutional investors. The mortgages it does take out predominantly wind up being securitized and dispersed across the institutional investor community. Table 1Large US Mall Owners
Mallpocalypse, Part 2: Who’s On The Hook?
Mallpocalypse, Part 2: Who’s On The Hook?
Creditor exposures to mall owners are thereby atomized, making losses a micro issue rather than a macro one. Distributing credit losses across a wide swath of investors neutralizes the systemic risk posed by any given borrower or common group of borrowers. Alan Greenspan was compelled to recant his spectacularly ill-timed praise for securitization’s risk-mitigating properties, but it was conceptually sound. Residential mortgage securitization wasn’t the problem per se, it was that the private-label mortgage market had become a largely closed system in which the banks swapped positions with one another, amplifying counterparty exposures within the banking system without anyone seeming to care, if indeed they were aware. Table 2Top 15 Holders Of SPG Debt
Mallpocalypse, Part 2: Who’s On The Hook?
Mallpocalypse, Part 2: Who’s On The Hook?
The primary owners of SPG’s bonds are the dominant index ETF sponsors, insurers and active mutual fund managers (Table 2). They are unlevered investors whose involvement diversifies exposure to credit losses away from the banks, thereby dissipating systemic risk. Although their losses cause financial conditions to tighten at the margin as spreads widen in response, they don’t disrupt financial intermediation in the way that sizable bank losses do. The worst outcome is a barely observable decline in funds available for consumption or investment and marginal employment declines as defaulting borrowers and their chastened creditors tighten their belts. Institutional investors are agents for the wealthier households that own a disproportionate share of financial instruments. They have a low marginal propensity to consume, which is to say that their consumption patterns are relatively insensitive to one-off income reversals and their investment losses don’t therefore perturb the broad economy. Equity holders in ailing mall REITs may have their stakes wiped out (Chart 1, bottom panel), adding insult to the injuries retail REIT investors have already sustained so far this year (Chart 1, top panel), but no critical intermediaries are shareholders and the overall market cap of retail REITs is not meaningful. Chart 1Trees Falling In Abandoned Mall Courtyards Do Not Make A Sound
Trees Falling In Abandoned Mall Courtyards Do Not Make A Sound
Trees Falling In Abandoned Mall Courtyards Do Not Make A Sound
The Big Short 2.0 Investors who foresaw a future in which e-commerce wipes out department stores and other national chains with sizable mall footprints have sought out ways to bet against malls. Many of them have gravitated to selling the CMBX 6 Index (Box 1). The trade has been talked about so much in credit circles over the last few years that the financial media have labeled it The New Big Short, after the book and movie about investors who anticipated the wreckage of the subprime crisis. The New York Times devoted an article to it last week, and Bloomberg, The Wall Street Journal and countless credit market blogs have been following it for a while. Box 1: The CMBS Insurance Marketplace Credit default swaps (CDS), developed in the mid-nineties as a tool for hedging lending exposures, have become a wildly popular way for investors to bet on the fate of a given bond issue or security. Bonds can be quite illiquid relative to equities, and CDS vastly ease the process of obtaining exposure to them. They are effectively an insurance contract in which the protection buyer pays the protection seller a flat annual fee to indemnify the buyer against missed or partial interest or principal payments. The CMBX indices provide a reference point for buying and selling protection on a large basket of commercial mortgage backed securities (CMBS). They are composed of 25 equally weighted CMBS of common vintage, each of which contains at least 40 loans, and they are divided into quality tranches from AAA to BB, based on the level of credit enhancement provided to each tranche. The BB tranche absorbs losses first, then the BBB- tranche, and so on, up to the AAA tranche. The protection seller is said to go long the index while the buyer shorts it. CMBX trades between counterparties are zero-sum. They produce no aggregate increase or decrease in wealth because the longs’ and the shorts’ return profiles are perfect inverses. The weakest mall REITs aren't long for this world, but their ultimate demise will not trigger any broader repercussions. The CMBX 6, consisting of whole loans issued in 2012, became the darling of the retail bears because a comparatively large 44% of the face value of its mortgages backed retail properties (27% non-mall retail, 17% malls). As of late 2019, the index contained loans on 37 malls (Table 3). Publicly traded REITs have a stake in 26 of the 37 malls in the index and account for 70% of the outstanding principal balance. Table 3Mall Mortgages In The CMBX 6 Index
Mallpocalypse, Part 2: Who’s On The Hook?
Mallpocalypse, Part 2: Who’s On The Hook?
Live By Disruption, Die By Disruption Obsolete malls are not likely to hurt the macroeconomy. Their disappearance will reslice the pie, creating micro winners and losers, but it shouldn’t cause it to shrink. Unwanted malls are a drag on the capital stock, because they’re not worth the cost of maintaining them, and converting the sites to better uses should act to boost productivity. Creative destruction is a positive feature of capitalism and a sign of economic health. The macro-economy didn't suffer when malls disrupted traditional downtown shopping districts and there's no reason to think it will now that the malls themselves are being disrupted. To those inclined to think we’re being cavalier about economic shifts and the near-term disruptions they provoke, we would point to the decades when the malls themselves were the disruptors. Mall construction – and branch department stores – thrived amidst the city-to-suburb migration that unfolded across the ‘50s, ‘60s and ‘70s. Population and wealth flooded out of the cities and into the suburbs, leaving some nasty micro-level scars as once-thriving retail quarters in the urban core became derelict. That outmigration did not produce a wave of bank failures, however. Citing Detroit’s experience in the ‘50s through the ‘70s in its Special Report examining the potential commercial real estate impact of a sizable uptake in work-from-home arrangements, our Global Investment Strategy service found no evidence that urban flight imposed undue stress on the financial system.2 Outmigration was also pervasive along the mid-Atlantic I-95 corridor in those decades. Suburbs of New York, Philadelphia and Washington, DC all experienced phenomenal growth while their core metropolitan areas shrank (Chart 2, top three panels). Even a growing city like Atlanta (Chart 2, bottom panel) saw its surrounding suburban counties welcome six times as many net new residents over the period. Chart 2City And Suburb Net Population Change By Decade
Mallpocalypse, Part 2: Who’s On The Hook?
Mallpocalypse, Part 2: Who’s On The Hook?
Despite inevitable home price declines in several city neighborhoods and reduced demand for retail and office space, aggregate residential (Chart 3) and commercial mortgage performance (Chart 4) held up quite well and there was no uptick in bank failures (Chart 5). Inflation helped to hold down defaults then in a way it won’t now, but the bottom line is that the shift in consumer preferences toward shopping malls did not feed broader disruptions, even though credit exposures were nearly entirely concentrated within the banking system. With exposure to mall operators’ equity, mortgages and unsecured loans widely dispersed away from the banking system, and retail accounting for only a modest share of commercial property value (Chart 6), the shift away from shopping malls will not have broader macro consequences. Chart 3Urban Flight Didn't Undermine Residential ...
Urban Flight Didn't Undermine Residential ...
Urban Flight Didn't Undermine Residential ...
Chart 4... Or Commercial Mortgage Performance
... Or Commercial Mortgage Performance
... Or Commercial Mortgage Performance
Chart 5Urban Flight Didn't Promote Bank Stress
Urban Flight Didn't Promote Bank Stress
Urban Flight Didn't Promote Bank Stress
Of Diamonds And Malls The forces behind the rise and fall of malls closely resemble the forces that drove the postwar waves of stadium construction: population shifts, increased reliance on automobiles and fashion’s impermanence. For the first half of the twentieth century, professional baseball’s sixteen franchises were spread across just ten cities. Its geographic footprint stretched from Boston to Washington on the Atlantic seaboard and along the Ohio River, the Great Lakes and the Mississippi to Chicago and St. Louis. The spread of franchises beyond the northeast and industrial midwest has tracked and foreshadowed the southern and westward movement of the population. Franchise moves, expansion and the mothballing of old city-center stadiums without parking led to a multi-decade boom in stadium construction that roughly coincided with the boom in mall construction. On undeveloped parcels on their outskirts, one city after another erected bland, utilitarian stadiums that were as uniform as the malls that had begun to dot suburban highway interchanges. They were hulking concrete structures with synthetic Astro-turf surfaces that could host baseball in the spring and summer and football in the winter, with capacity for between 50,000 and 70,000 fans and their cars. The early ‘90s witnessed a new stadium construction boom, motivated by franchises’ desire to reconfigure their seating to maximize revenues from businesses who used the games as a vehicle for entertaining clients. Stadiums without luxury boxes and enclosed suites were swiftly seen as obsolete. The popularity of Baltimore’s new park (1992), showcasing a retro design that hearkened back to the days of center city stadiums with brick facades and asymmetric quirks, made the stadiums of the sixties and seventies look hopelessly passé. The stock of dual-sport, artificial turf stadiums with concrete facades was eradicated over the next decade-plus, including Houston’s iconic Astrodome. The first fully enclosed stadium, billed as “the eighth wonder of the world” upon its 1965 opening, was the subject of rapturous national media coverage akin to the attention lavished on Southdale, the first mall, a decade before. The conversion of the stadiums did not bring ruin for any franchise, its municipal host,3 or the syndicate of banks and muni bond buyers that financed it. In cities where the new stadiums have been built closer to the center of town, the new ballparks have been a catalyst for a range of commercial and residential development. The broadly positive impact of scrapping faded stadiums for newer, better designed replacement stock looks like what we might expect from the scrapping of obsolete malls to make way for properties able to make better use of the space. Investment Implications Investors should not fear negative economic or market consequences from the retirement of underperforming malls. Their exit will not produce investment losses on a scale that slows the economy or interrupts banks’ intermediation function. Specialist real estate investors may find several opportunities in an industry in which the three most important factors are location, location and location. Credit and equity analysts and PMs may well find ways to profit from micro distinctions, but the lack of macro impacts means the demise of a meaningful share of the country’s malls does not have asset allocation implications. Investors in US assets will continue to be best served by taking their asset allocation cues from the fiscal and monetary policy backdrop. Mallpocalypse may be a clever phrase, but culling the nation’s underperforming malls from the capital stock won’t have adverse impacts on financial markets or the broad economy. Doug Peta, CFA Chief US Investment Strategist dougp@bcaresearch.com Footnotes 1 There are around 1,300 malls in the US, including outlet malls and lifestyle centers. 2 Please see the August 28, 2020 Global Investment Strategy Special Report, "Working From Home, Urban Flight, And Commercial Real Estate Loans: How Bad Can Things Get?" available at gis.bcaresearch.com. 3 The merits of using public funds to subsidize stadium construction for private concerns are hotly contested. Taking the existing level of public subsidies as a given, however, successful facilities upgrades confer an overall economic benefit, even if it involves a transfer of wealth from taxpayers to private entities.
Stick With This Juggernaut
Stick With This Juggernaut
Software stocks have been on a tear. This defensive-tech index has bested the SPX by 34% year-to-date, and in absolute terms is up a whopping 45%. While such a breakneck pace is clearly unsustainable, and a short-term breather is in order, software stocks have been high-flying as they are trying to satisfy investors’ insatiable appetite for cloud exposure. True, some recent IPO activity is reminiscent of the dotcom bubble excesses (re:BIGC doubled in a mere 5 trading days) as investors are scrambling to gain any cloud exposure at any price. Circling back to the S&P software index, encouragingly this has been a capex-led advance, as software outlays now capture a larger slice of corporate budgets (top panel). As a result, software stocks have rallied along side swelling profits (second panel). Granted, valuations are trading at a large premium versus the broad market, however, the 12-month forward P/E is hovering near the historical average and way below the 1990s peak (middle panel). When corrected for the long-term growth rate, the relative P/E/G ratio is near parity and below the historical mean (bottom & fourth panels). Bottom Line: While software stocks have run too far too fast, appear expensive to the naked eye and a near-term breather is needed, the earnings-led advance keeps us on the cyclically bullish side. The ticker symbols for the stocks in the S&P software index are: BLBG: S5SOFT – MSFT, ADBE, CRM, ORCL, INTU, NOW, ADSK, ANSS, SNPS, CDNS, FTNT, PAYC, CTXS, NLOK, TYL.
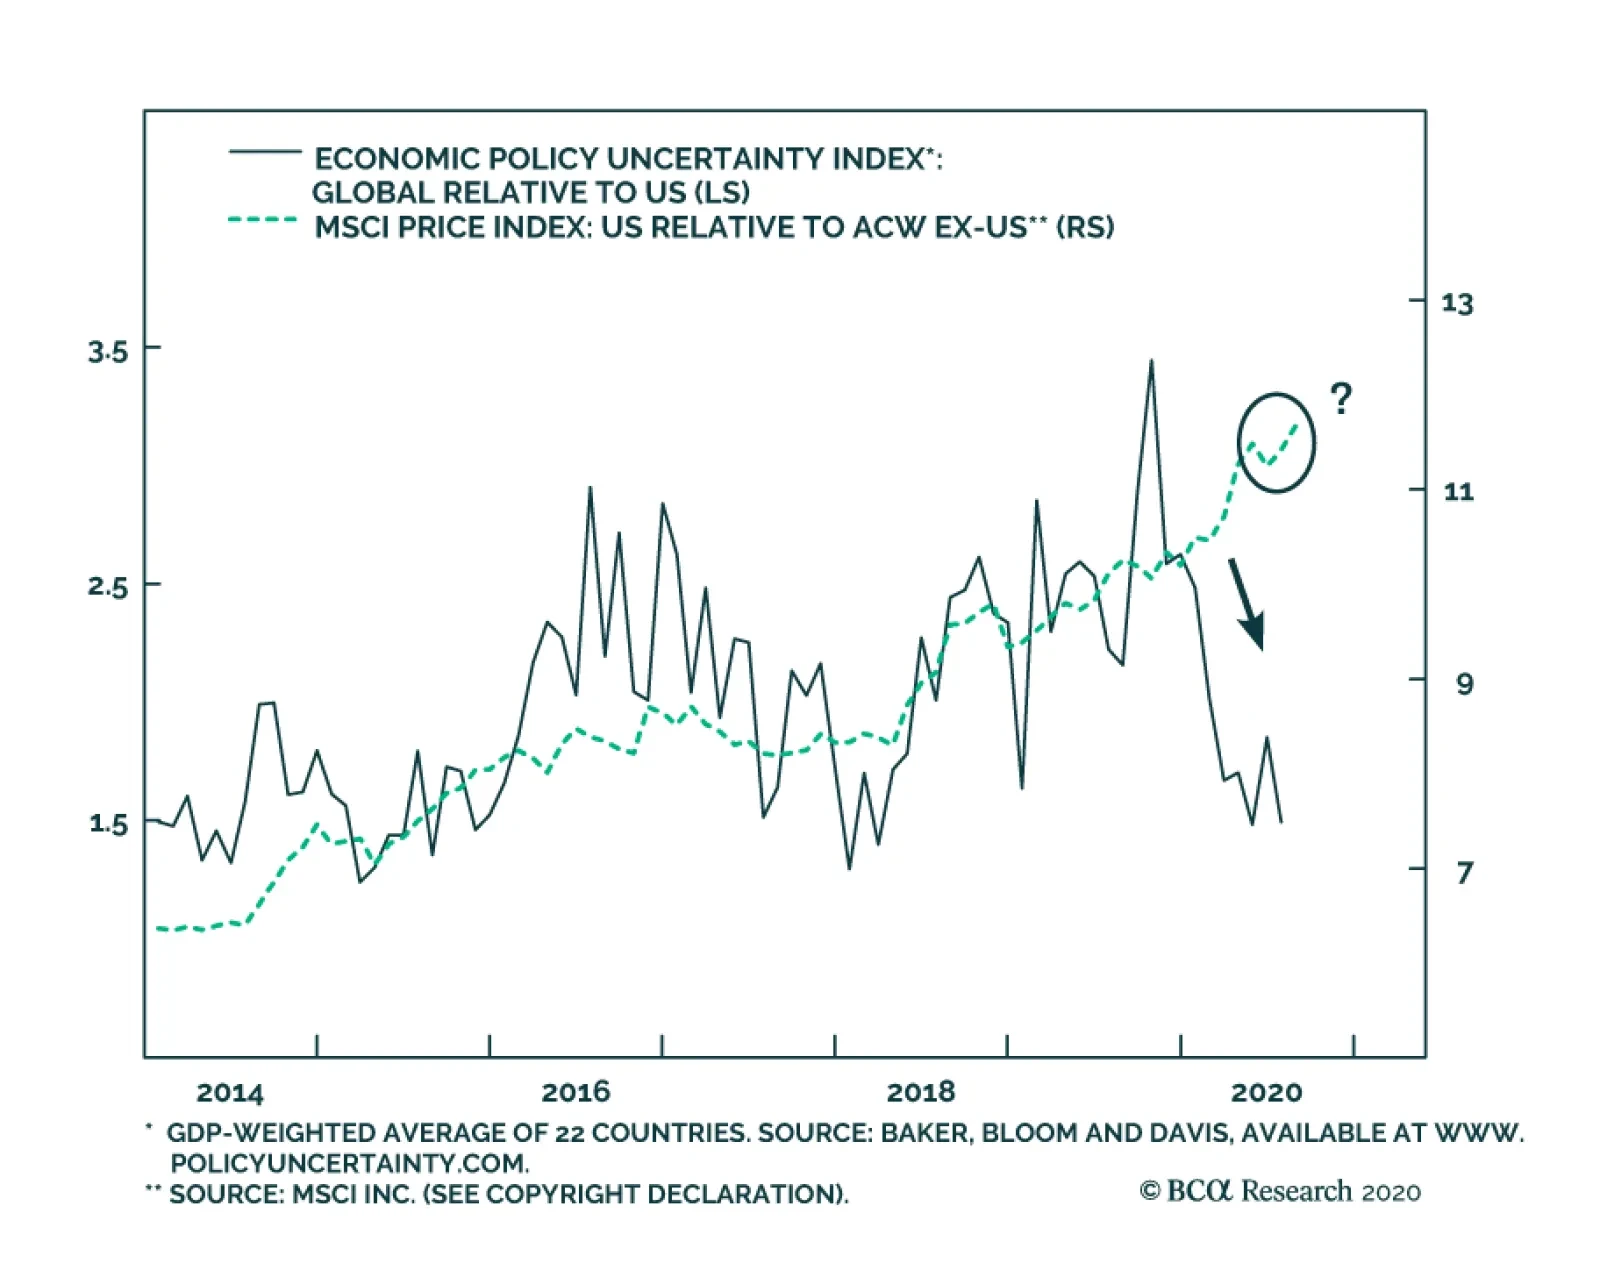
BCA Research's Geopolitical Strategy service believes that President Trump is staging a comeback in the election campaign. This makes the presidential election a very close call. The US policy uncertainty index, which has been rising relative to…
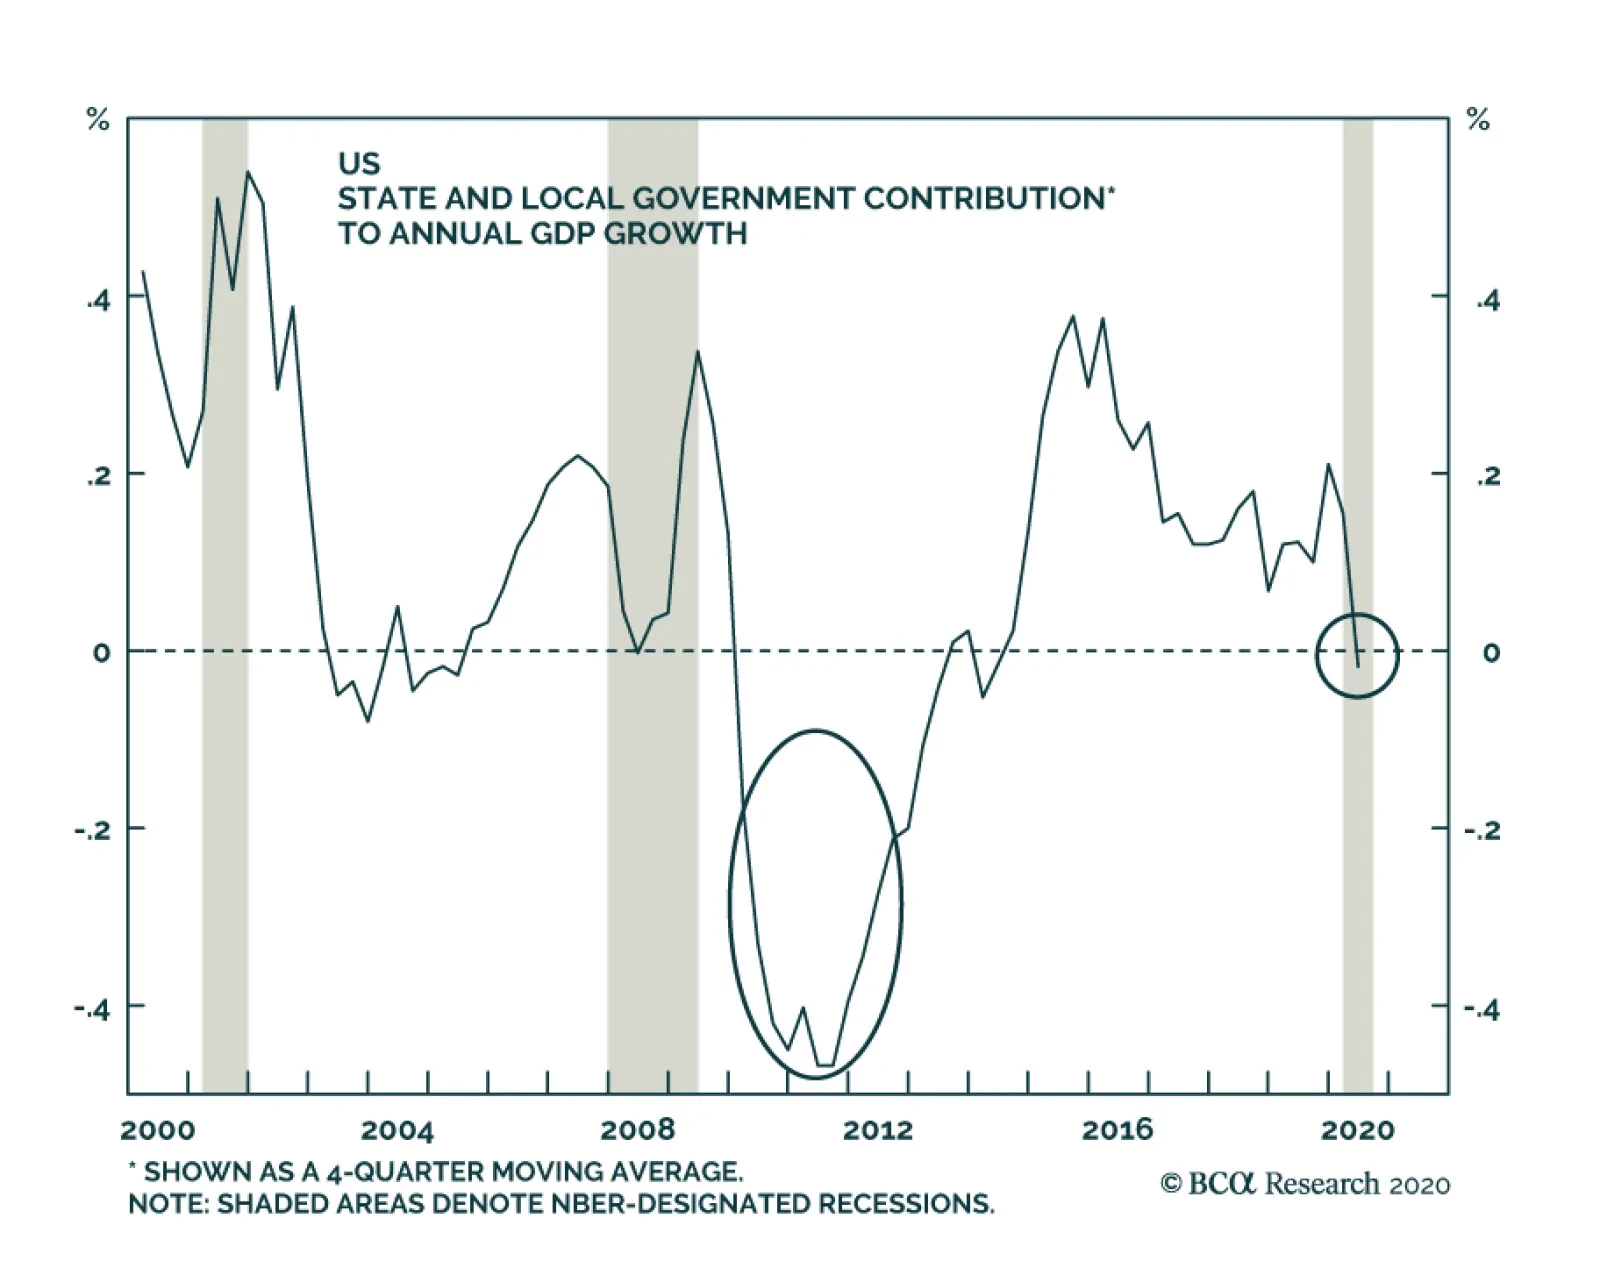
Persistent State & Local Fiscal Drag Must Be Prevented This Time
…
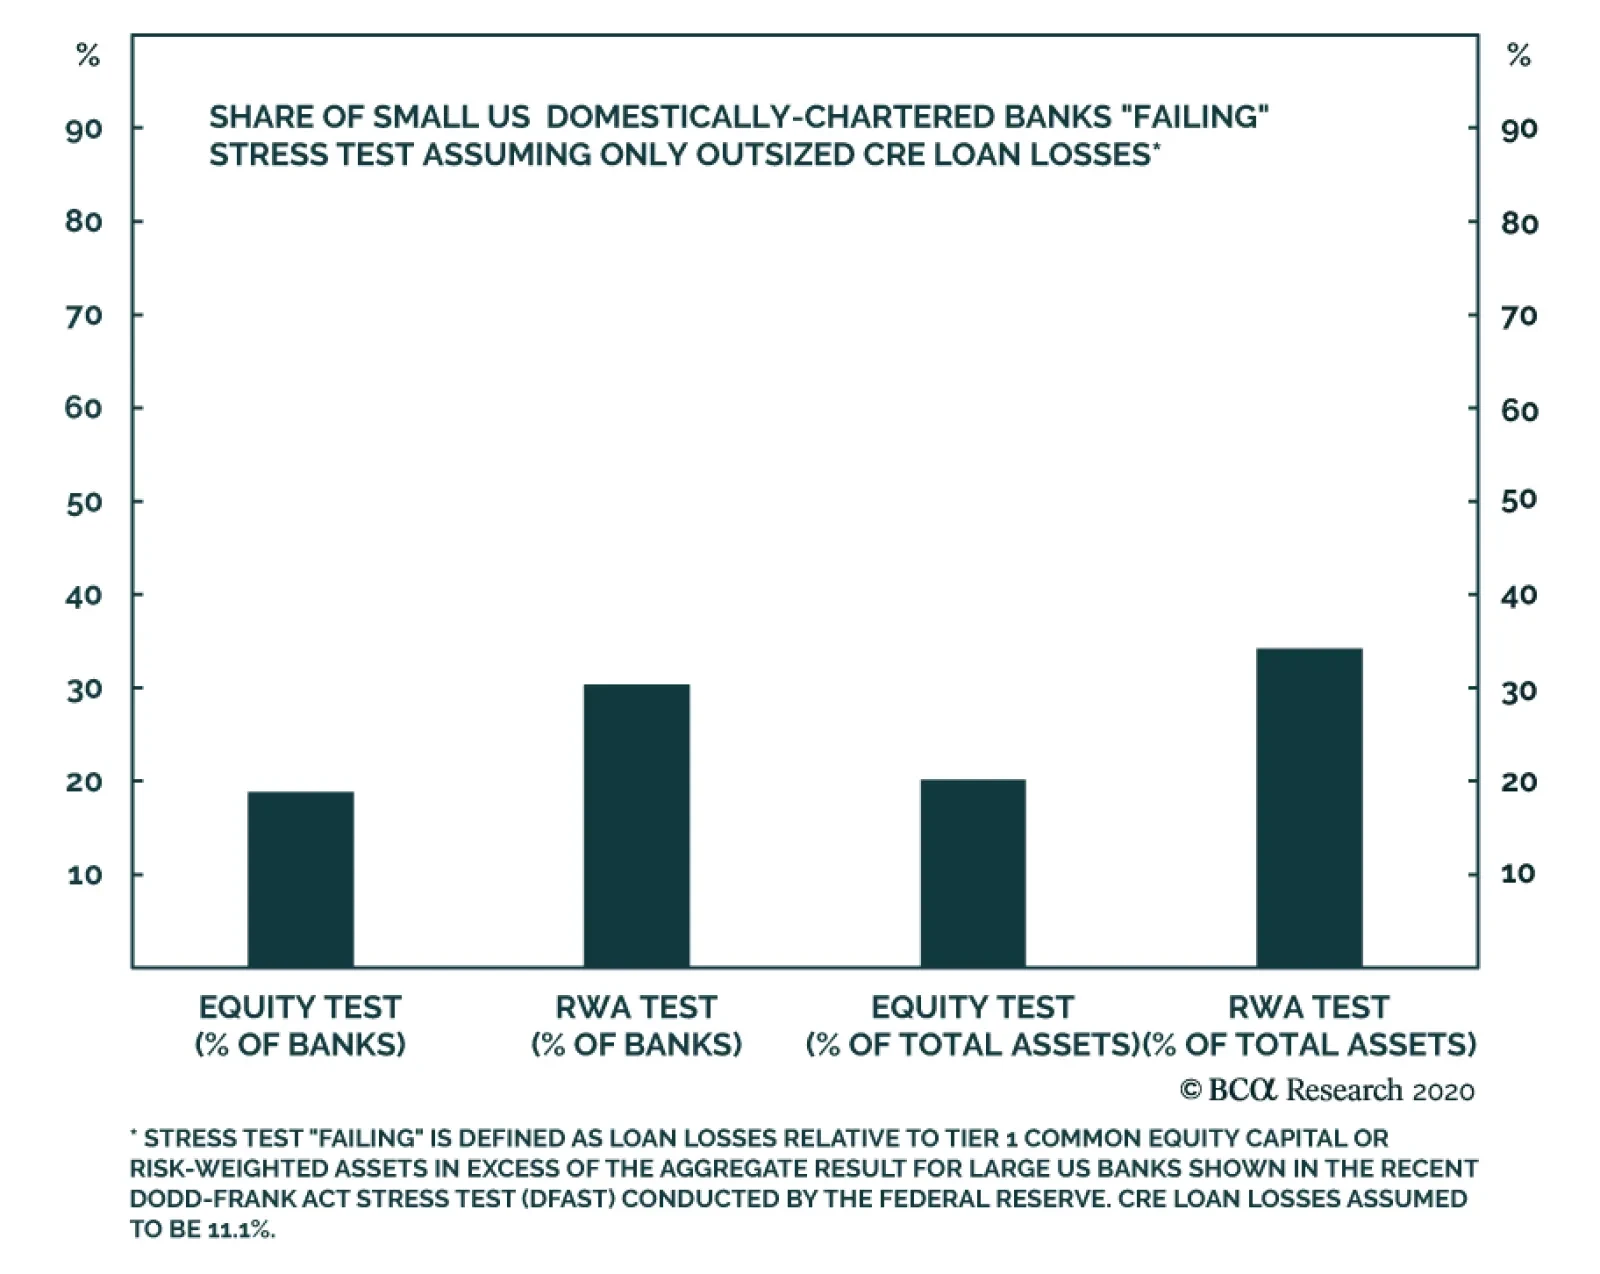
BCA Research's Global Investment Strategy service in a recent report assessed the risks to the US banking system from a potential downturn in commercial real estate. In a scenario of high CRE loan losses alone scenario, the result is an overall CRE…
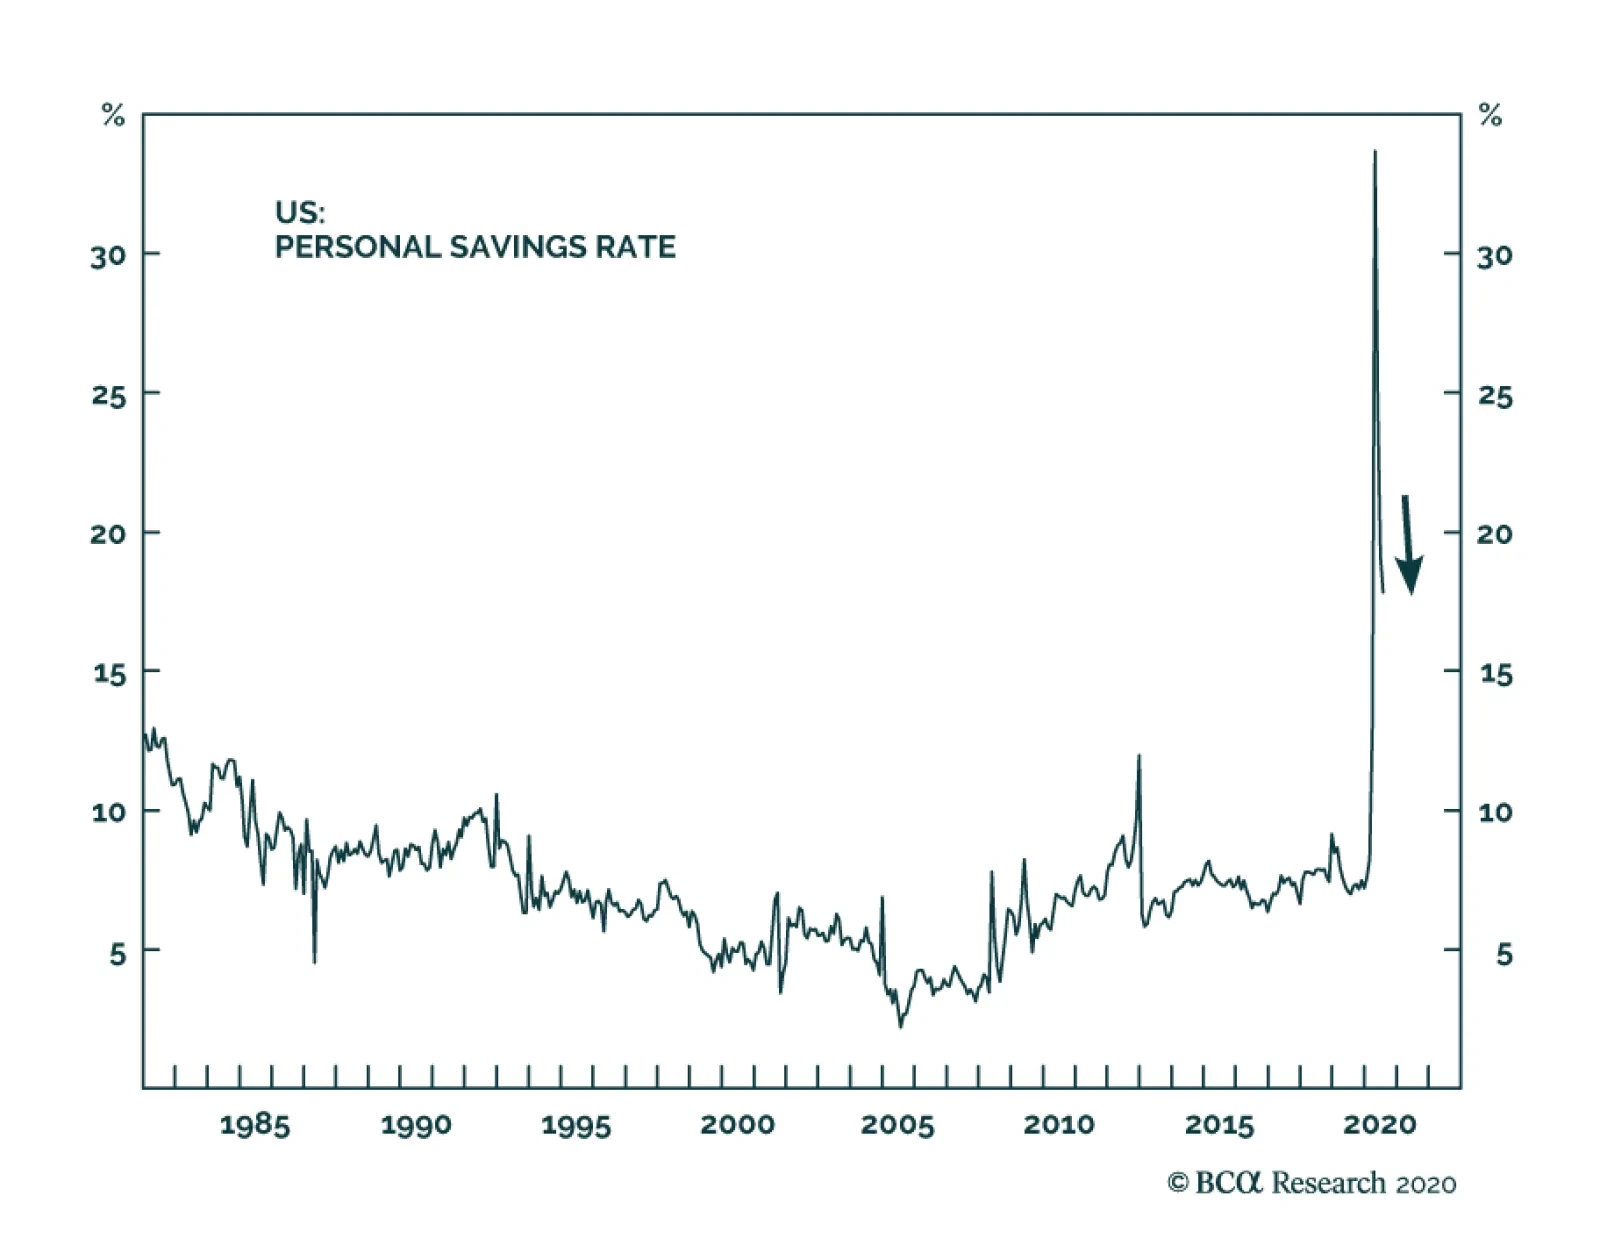
Household income and spending rose in July from their June levels. On a percentage basis, personal income rose 0.4% in July compared to -1% in June while the pace of personal spending slowed down from 6.2% in June to 1.9% in July. The US household…