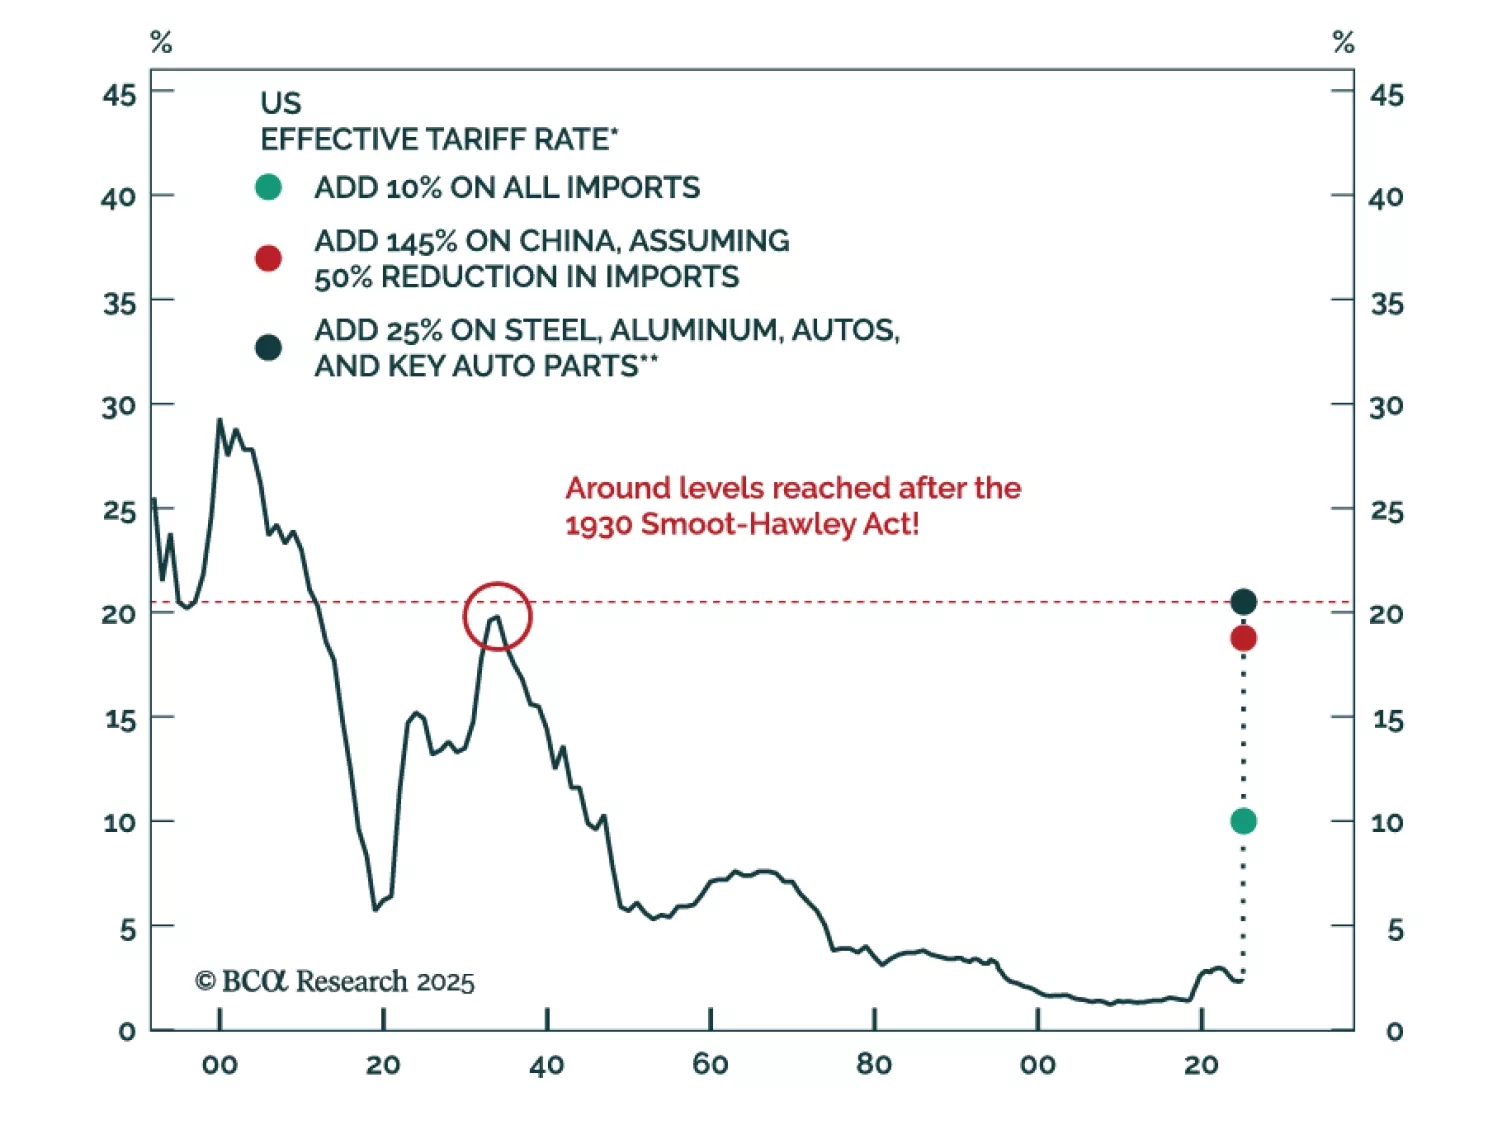
Sorry, you need to enable JavaScript to visit this website.
Skip to main content

Valuations

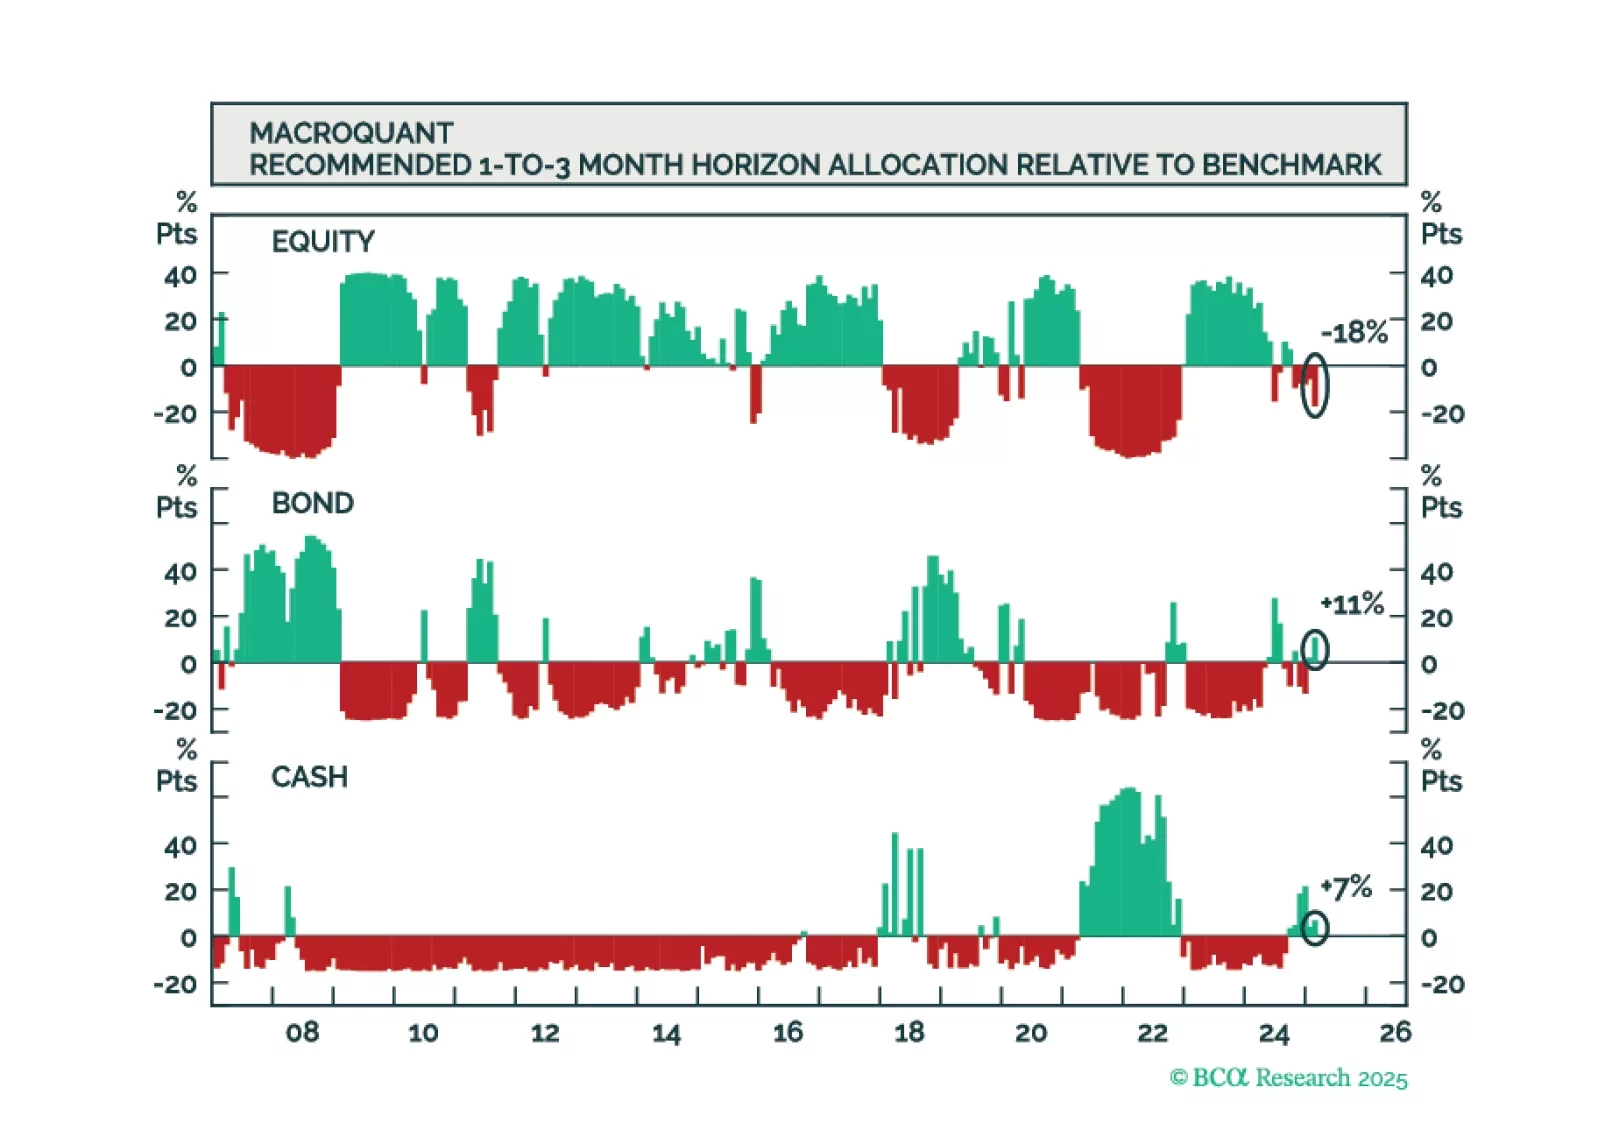
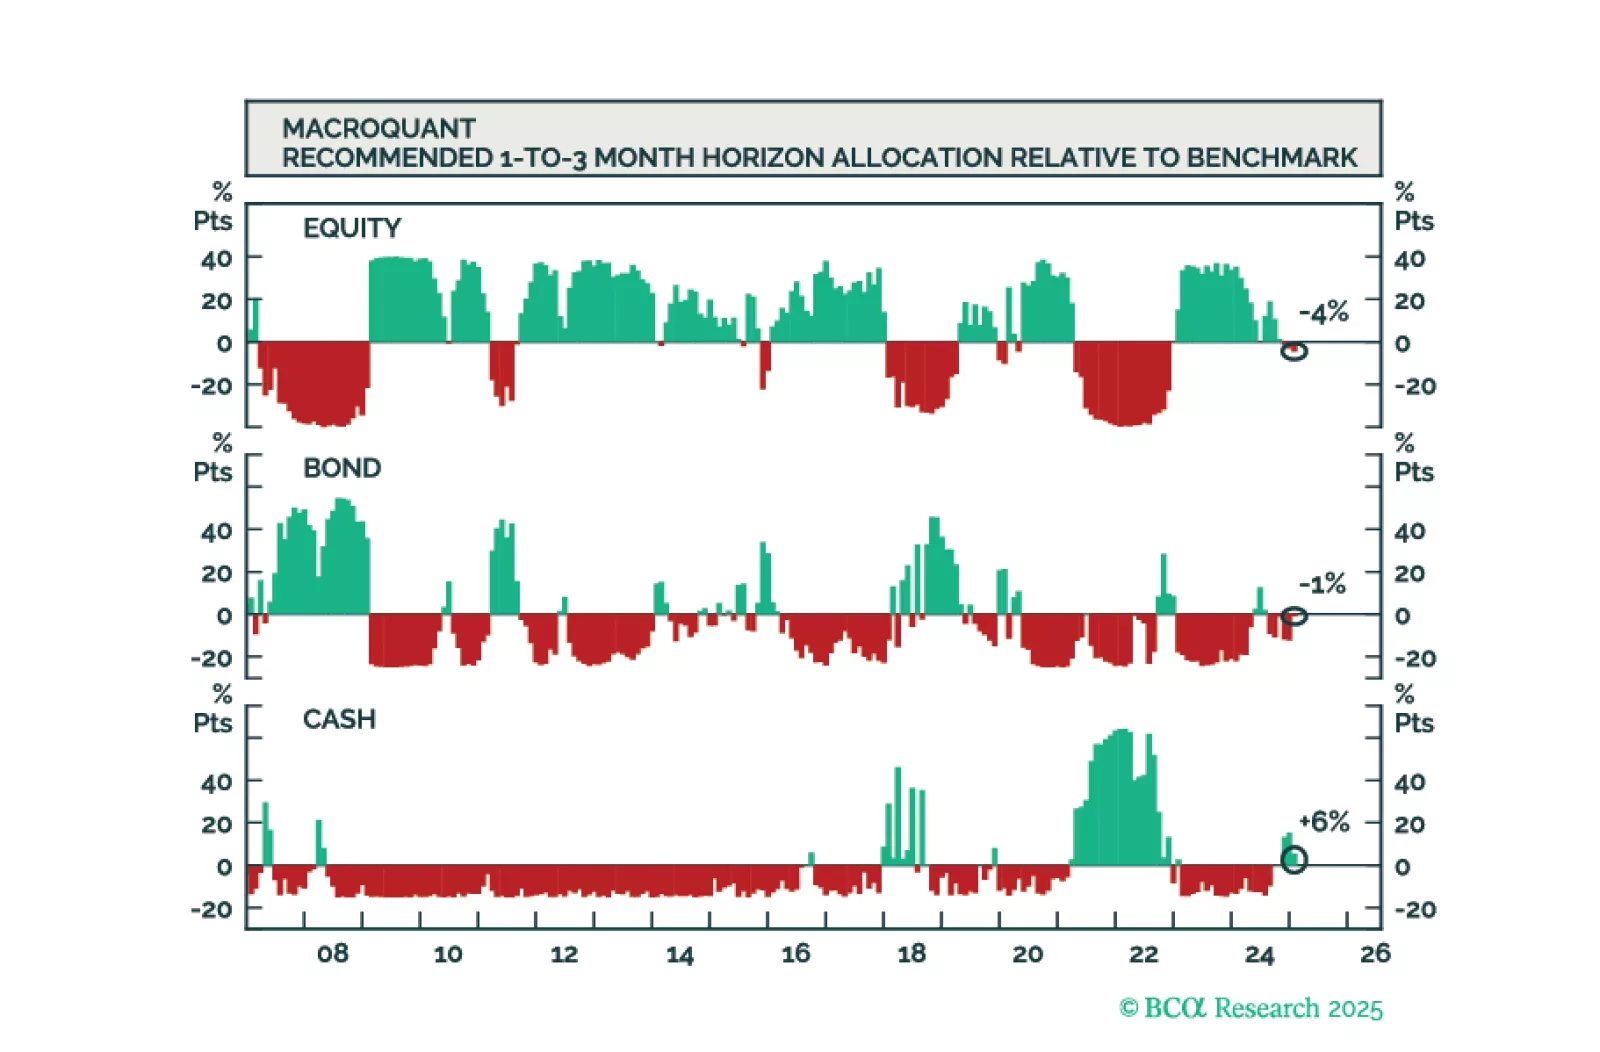
Going into April, MacroQuant recommends a modest underweight on stocks, offset by an overweight on bonds and cash. While MacroQuant is modestly bearish on stocks, we suspect that the downside risks to equities may be greater than what the model assumes.

In this Second Quarter Strategy Outlook, we explore the major trends that are set to drive financial markets for the rest of 2025 and beyond.

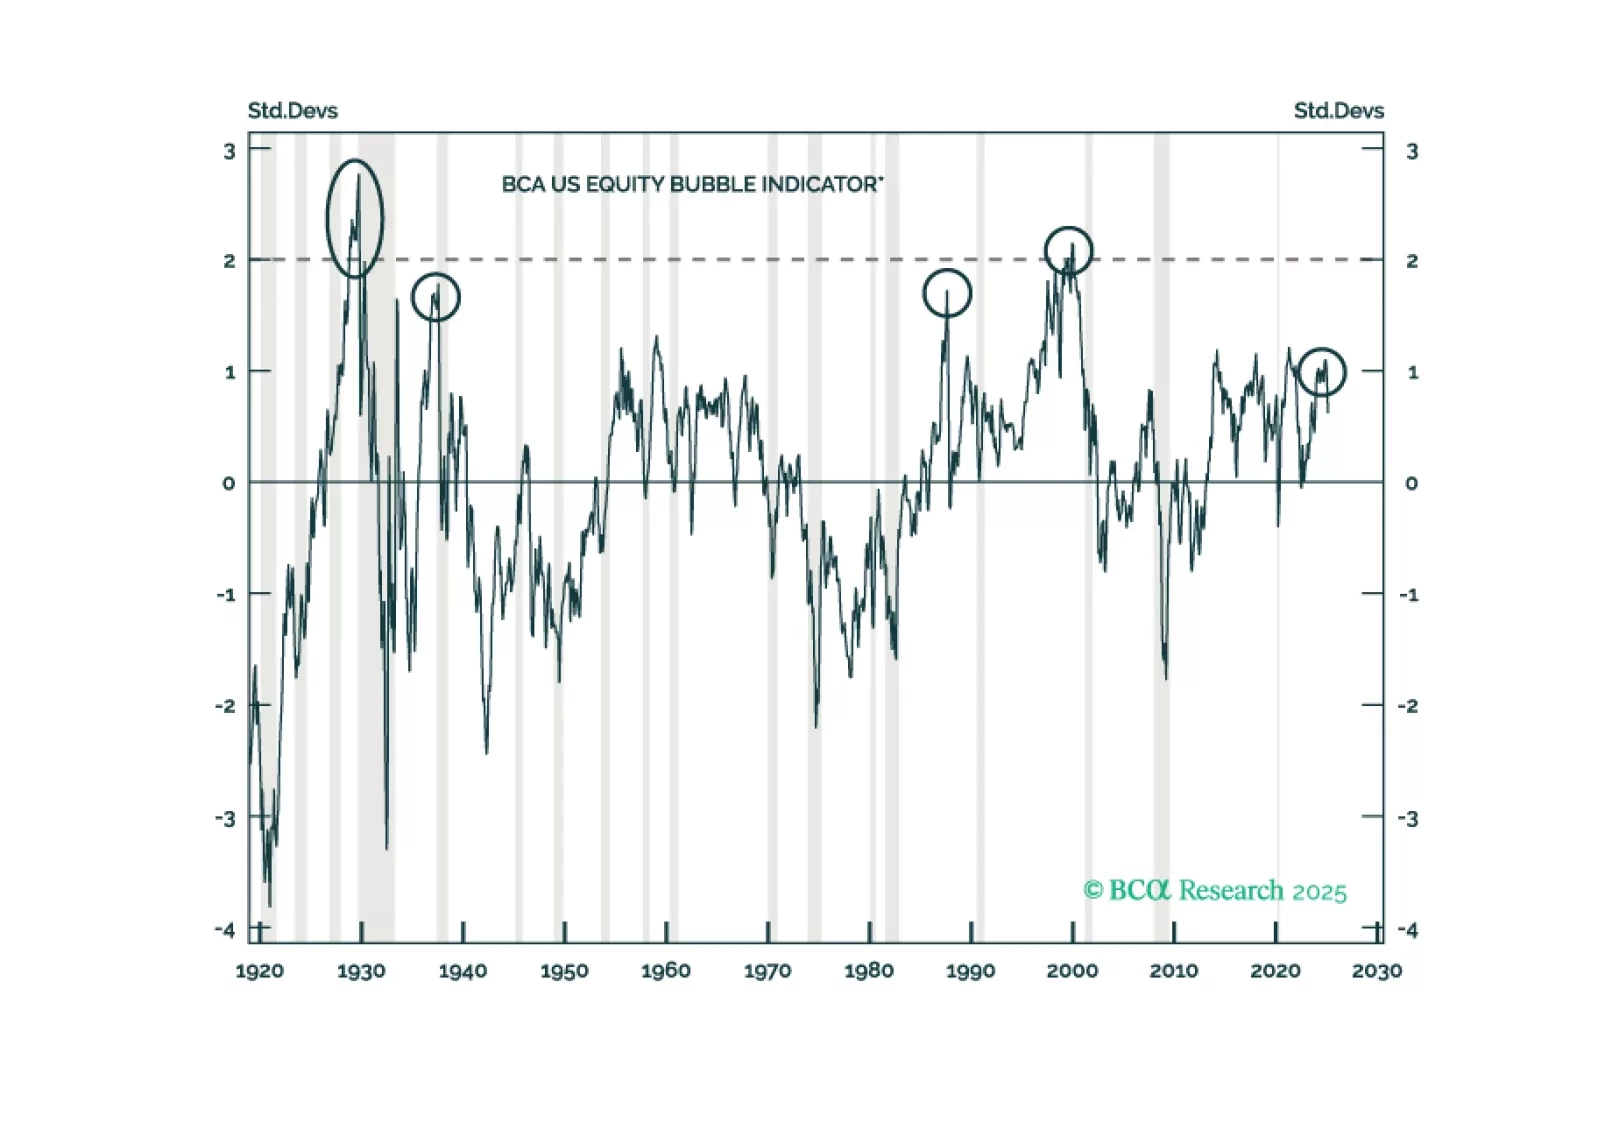
In Section II, Jonathan presents a new indicator that investors can use to track the odds of bubble formation in real time and shows how it fits into a larger framework that accurately explains US bear market severity over the past century. The US equity market is not in a bubble today, but it is meaningfully overvalued. Investors should expect a relatively severe cumulative loss from equities in a recession scenario.

Despite our bearish predisposition towards stocks, we are open-minded to anything that could challenge our thesis. As such, in this report, we review five upside scenarios for equities.

After entering 2025 with depressed growth expectations, measures of European sentiment have seemingly bottomed, and European assets rallied. However, given the changing geopolitical order and Europe’s forceful response thus far, are we at a structural turning…

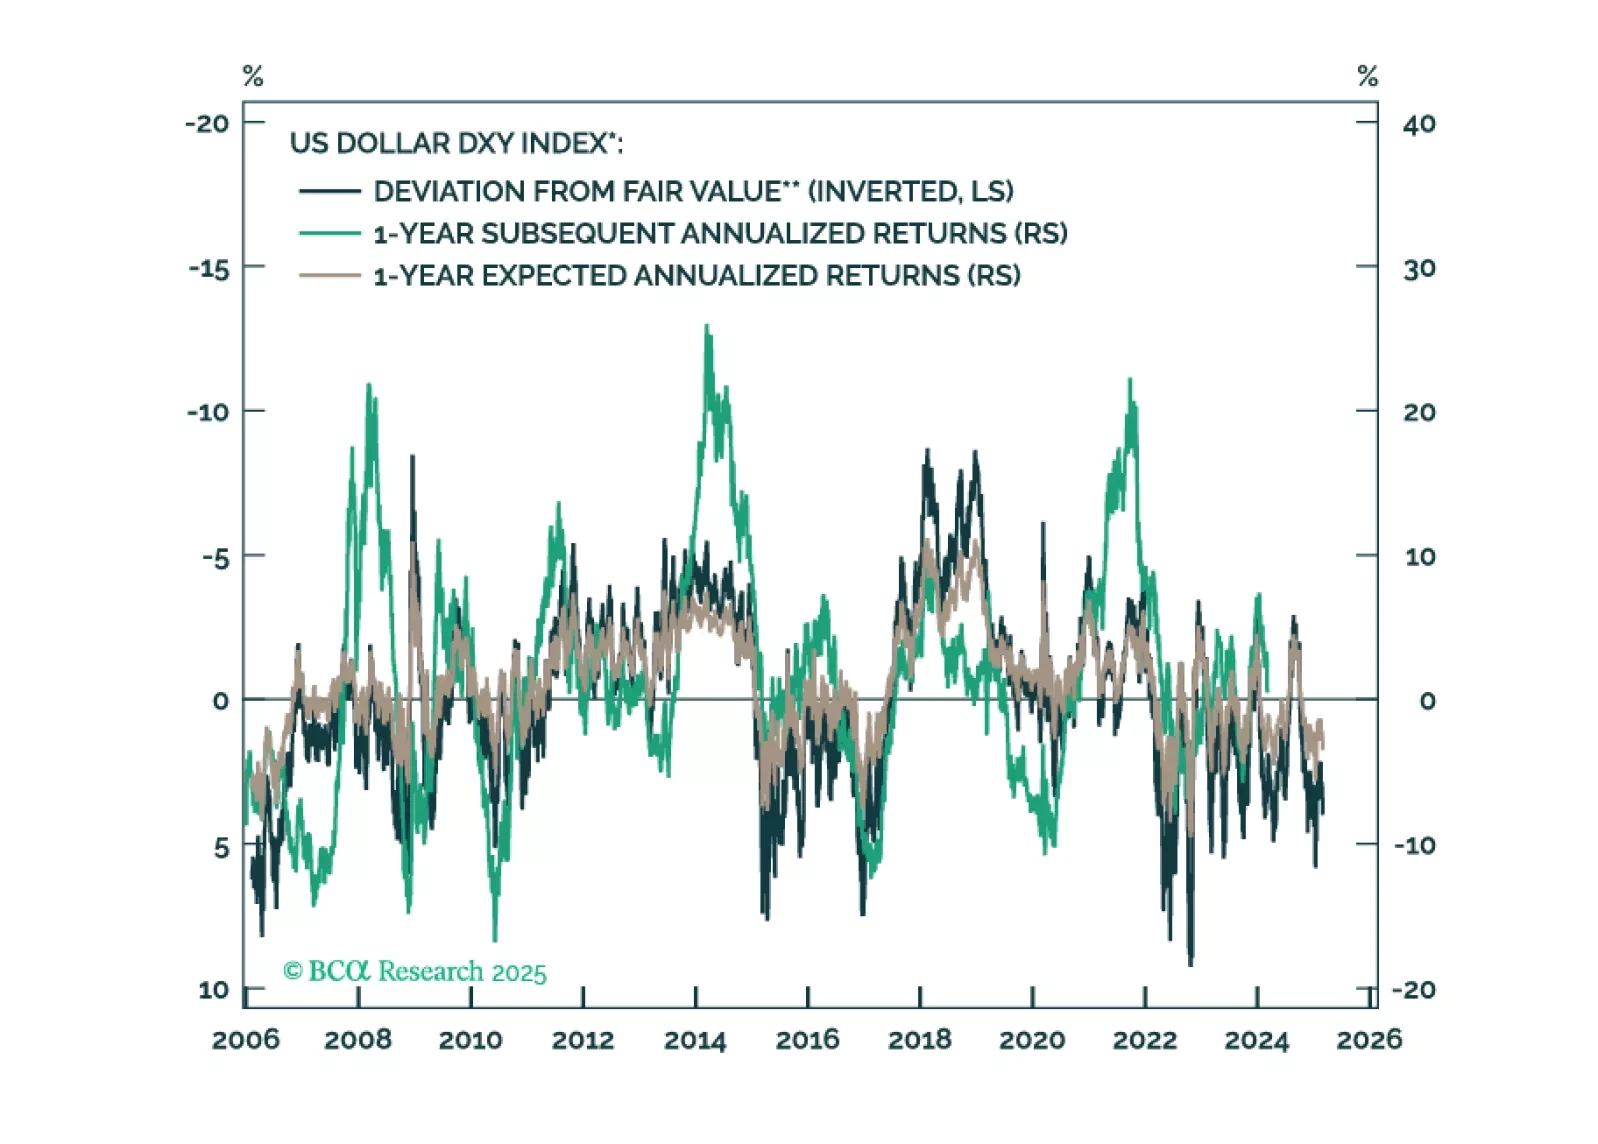
This report is our Part III series on valuation and subsequent returns, where we recalibrate our short-term models to emphasize signals over the next nine-to-twelve months. We will henceforth call these models STTM: Short Term Timing Models.

The MacroQuant model is no longer bullish on stocks but is not yet prepared to turn underweight. Subjectively, the Global Investment Strategy team is more bearish on equities than the model.

 
The MacroQuant model is no longer bullish on stocks but is not yet prepared to turn underweight. Subjectively, the Global Investment Strategy team is more bearish on equities than the model.

 
In its budget plans last week, the Indian fiscal authorities announced major tax cuts for households – the equivalent of about US$12 billion, 0.3% of GDP – to boost consumer spending. Soon thereafter, the central bank cut its policy rates by 25 bps – for the first time in five years. Can these stimulus measures put a floor under Indian growth, and hence, stock prices?The short answer is no. This economy and the stock markets are set for more weakness. We downgraded Indian stocks from neutral to underweight in EM and Emerging Asian portfolios on October 4th last year. Since its peak on September 27th, this bourse has corrected by about 18% in US dollar terms and has underperformed the EM equity benchmark by 13% (Chart 1). Investors should brace for further selloff and underperformance.  Chart 1 Indian Stocks Have More Downside Indian Stocks Have More Downside Fiscal Stance: A Change Of TackDuring the past several years, India’s fiscal spending plans focused far more on building infrastructure and other productive capacities than on current expenditures. The government’s capital spending doubled as a share of GDP over the past four years (Chart 2). Chart 2 Fiscal Policy Will Stay Very Tight Fiscal Policy Will Stay Very Tight The new budget plan, however, emphasizes boosting household consumption (via generous income tax cuts) to generate economic growth. There has been no rise in planned government capital spending for the next fiscal year (as a % of GDP). Can this change of fiscal policy help turn the country’s slowing growth around? We believe that an improvement is unlikely. The reasons are as follows.Only about 31 million citizens in India pay personal income tax. That amounts to less than 10% of households. These are the top decile of households in terms of income and usually have a lower propensity to spend their extra income than the less well-off. The bottom 90% of households will not benefit from the tax breaks at all. The upshot is that tax cuts will have little impact on lifting overall consumer spending growth.What’s more, the government plans to reduce the fiscal deficit next year by another 0.4 percentage points of GDP (from 4.8% of GDP this year to 4.4%). This implies that the government will cut fiscal spending elsewhere by 0.8% of GDP (after accounting for 0.3% of GDP for tax cuts and 0.1% of GDP rise in interest payments). In many cases, that spending was intended for the government’s various economic and social welfare schemes aimed at relatively low-income populations. As such, the vast majority of India’s population and almost all low-income households could see their real income from government schemes stagnate or even fall due to the new budgetary plans. That means little or no consumption boost from this cohort. This is at a time when Indian household income growth has already been sluggish for several years. Rural wages have not grown at all in inflation-adjusted terms over the past five years (Chart 3, top panel). Urban households are not doing much better. Less than 20% of respondents in RBI’s latest industrial outlook survey reported a rise in paid salaries or other remunerations – the lowest level in a decade, save the pandemic period (Chart 3, bottom panel).Not surprisingly, consumer durable sales are sluggish. Two-wheeler sales – often a barometer of households’ discretionary spending – have stagnated (Chart 4).The bottom line is that the combined effect of tax breaks for a small sliver of the population and non-trivial budgetary spending cuts will lead to a further slowdown in India’s overall household consumption.  Chart 3 Wage Growth Has Been Very Subdued Wage Growth Has Been Very Subdued Chart 4 Depressed Consumer Durable Sales Indicate Poor Household Purchasing Power Depressed Consumer Durable Sales Indicate Poor Household Purchasing Power Not Much Relief From Monetary Policy   In addition to last Friday’s 25-basis point rate cut, the RBI has announced some other measures in the last several weeks. These include cutting the cash reserve ratio by 50 basis points (to 4%), open market operations, and dollar-rupee swaps – all to ease the liquidity crunch. However, collectively these measures will be insufficient to lift the current deeply negative banking sector liquidity into positive territory (Chart 5). The ongoing liquidity crunch is mostly due to RBI’s persistent defense of the rupee. The central bank has been selling foreign currency for months to support the domestic currency (Chart 6). In so doing, it mopped up a vast amount of rupees from the market.  Chart 5 Banking System Liquidity Is Deeply Negative Banking System Liquidity Is Deeply Negative Chart 6 RBI Intervention In Forex Markets Has Drained Banking Sector Liquidity RBI Intervention In Forex Markets Has Drained Banking Sector Liquidity Notably, even after the rate cut, the central bank retained the policy stance as “neutral,” and did not change it to “accommodative”. This indicates that the Indian central bank is not planning to embark on a substantial reduction in borrowing costs for now. Therefore, policy rates will remain quite elevated, even though core inflation has eased to well within the RBI’s target bands of 2-6%. As such, real borrowing costs will be hovering near decade-high levels (Chart 7).Given that borrowers will have to contend with elevated real borrowing costs for a while longer, India’s credit deceleration has further to run. The country’s bank credit impulse (excluding mortgage loans), the second derivative of bank loans, is already contracting measurably. This is usually a bad omen for economic activity (Chart 8).  Chart 7 Real Borrowing Costs Are Very High Real Borrowing Costs Are Very High Chart 8 A Negative Bank Credit Impulse Will Hurt The Economy A Negative Bank Credit Impulse Will Hurt The Economy The reason for looking at the credit impulse instead of credit growth is that bank credit is a “stock” variable, whereas “GDP” is a flow variable. Since we are trying to ascertain the future GDP growth rate – which is a “change” in a flow variable – the analogous metric for credit that one should use is also the “change in credit flow”, in other words, the credit impulse.   The message is similar if we look at the money supply impulse. As of January, India’s broad money supply (M3) impulse has fallen to zero. This has been a good indicator of India’s business cycles and is pointing to continued weakness in nominal growth (Chart 9).  Chart 9 Slowing Broad Money Impulse Points To Weaker Nominal Growth Ahead Slowing Broad Money Impulse Points To Weaker Nominal Growth Ahead This is a cause for concern, as it’s nominal growth, rather than real growth, that determines profits and stock price growth. The bottom line is that persistently tight fiscal and monetary policies are hurting India’s domestic demand, and, hence, the nation’s business cycle. Profits Are Set To ContractIndian corporate earnings will likely contract as persistently tight monetary and fiscal policies will continue to hurt firms’ topline growth and margins. Given the still very high equity valuations, profit disappointments will extend the selloff in this bourse.RBI's compilation of 2900 companies shows that the nominal sales growth rate slowed to 6.6% as of September 2024, the latest figures available. Operating profit growth slowed to 4.5%.Profits have likely slowed further since then – as borne out in corporate income tax payments, which turned negative in the 12 months to December 2024. Historically, corporate tax payments have been a good gauge of firms’ sales and profits. Negative growth in corporate tax payments foreshadows shrinking corporate earnings (Chart 10).Profit margins will fall, as decelerating revenue growth will hurt margins due to operating leverage. Falling margins usually dampen stock multiples (Chart 11). Thus, both drivers of Indian stock prices, corporate earnings growth, and margins, have a negative outlook. Chart 10 Contracting Corporate Tax Payments Indicate Shrinking Profits Contracting Corporate Tax Payments Indicate Shrinking Profits Chart 11 Falling Profit Margins Will Dampen Stock Multiples Falling Profit Margins Will Dampen Stock Multiples Incidentally, bottom-up analysts are currently expecting Indian EPS to grow at a lofty 15.7% in nominal rupee terms over the coming year – as opposed to 7% growth in the past 12 months. Given that corporate sales growth is now down to single digits and will likely downshift further, profits will likely shrink in nominal local currency terms (Chart 12, top panel). Meanwhile, net earnings revisions have become increasingly negative in recent months. Stock multiples will also de-rate in tandem (Chart 12, bottom panel). In sum, this market is in for major disappointments. Contracting corporate profits will feed into broader economic weakness. Firms typically restrain their capital expenditure (capex) and hiring plans when profits fall (Chart 13). In India, capex, rather than household consumption, has been the mainstay of its growth post-pandemic. Any setback therein will dent the economy’s outlook.  Chart 12 Indian Profits Are Set To Contract Indian Profits Are Set To Contract Chart 13 Falling Profits Will Discourage Firms’ Capital Expenditure Falling Profits Will Discourage Firms’ Capital Expenditure In another indication of dwindling capex plans, inbound FDI has largely dried up. In the 12 months to September, net inbound FDI into India (after subtracting repatriations of past FDI), has fallen to a paltry $32 billion (0.9% of GDP) – the lowest amount in a decade (Chart 14). A likely global tariff war in the coming months will not help either. Any uncertainty regarding the sales outlook usually discourages firms from making new capital expenditure plans, and tariff-related worries will do just that. Indeed, India itself could well face new tariffs from the Trump administration. India’s own import tariffs for certain items have been quite high. Last week, the government slashed many of them. For example, some items like luxury cars saw a tariff rate reduction from 70% to 40% and used vehicles from 40% to 20%. Average tariffs are now down from 13% to 11%, which is still high by global standards. If the new US government ends up imposing tariffs on India, that will be a major blow to the Indian economy.Indian companies will also be apprehensive that China, facing tariff and non-tariff barriers in US markets, might redirect some of its exports elsewhere – including to India. That will make them even more cautious regarding new investment expenditures. In sum, sliding profits and tariff uncertainties will lead to weaker capex and employment. That, in turn, will further hurt domestic demand, firms’ sales, and profits. Investment ConclusionsEquities: Despite the recent sell-off, Indian stocks remain extremely expensive. Our composite valuation measure shows this bourse to be overvalued by two standard deviations. The same is true for India’s relative valuation vis-à-vis its EM peers (Chart 15). Chart 14 FDI To India Has Dried Up FDI To India Has Dried Up Chart 15 Indian Stocks Are Still Two Sigma Overvalued Indian Stocks Are Still Two Sigma Overvalued The combination of potential profit contraction and expensive equity valuations makes a toxic cocktail for this equity market. This market needs to correct much further before it becomes attractive again.Absolute-return investors should stay away from this bourse. EM and Emerging Asian equity portfolios should stay underweight India. We reiterate our short Indian stocks / long Chinese A-shares trade, which was initiated on September 27, 2024.Currency: India’s currency outlook remains poor. Despite RBI’s repeated interventions to support the currency, the rupee has depreciated by over 4% versus the US dollar in the past four months – a trend that will likely continue. As a country with a current account deficit, India needs persistent and adequate net capital inflows to finance this deficit. In the absence thereof, the rupee fails to hold its value. Given the ongoing large portfolio outflows, the rupee is likely to depreciate further in the coming months (Chart 16).Domestic Bonds: Indian bond yields track the country’s economic growth closely (Chart 17). They are headed lower as the RBI has fallen behind in terms of monetary policy easing. The longer the RBI delays in initiating a sizable easing, the lower the yields will fall. Chart 16 Large Portfolio Outflows Are Hurting The Rupee Large Portfolio Outflows Are Hurting The Rupee Chart 17 Indian Bond Yields Are Headed Lower Indian Bond Yields Are Headed Lower Fixed-income investors should stay long Indian domestic bonds but hedge the currency risk - we recommended hedging it on October 4, 2024. Dedicated EM bond portfolios should stay overweight India because in common currency terms on a total return basis, Indian domestic bonds will outperform their EM peers. Indian local currency bonds also offer one of the best long-term opportunities within the EM fixed-income space.Rajeeb PramanikSenior EM Strategistrajeeb.pramanik@bcaresearch.com 
Despite disruptive headlines, equity market volatility remains contained. The S&P 500 has been in a tight range since the last VIX spike, and news of a disruptive, cheaper AI technology has not sustainably brought down US tech stocks. Both implied and…