Sorry, you need to enable JavaScript to visit this website.
Skip to main content

Wheat

The annual Prospective Plantings report released by the US Department of Agriculture (USDA) last week was slightly bullish for corn, neutral for soybeans, and slightly bearish for wheat. It forecasts a 5% drop in corn acreage, a 3% increase in soybean…
Prices of agricultural commodities have come under intensified downward pressure this year. Corn, soybean, and wheat prices have fallen by 8.6%, 8.3%, and 4.9% respectively so far this year. Multiple factors are behind the selloff. First, ag prices…

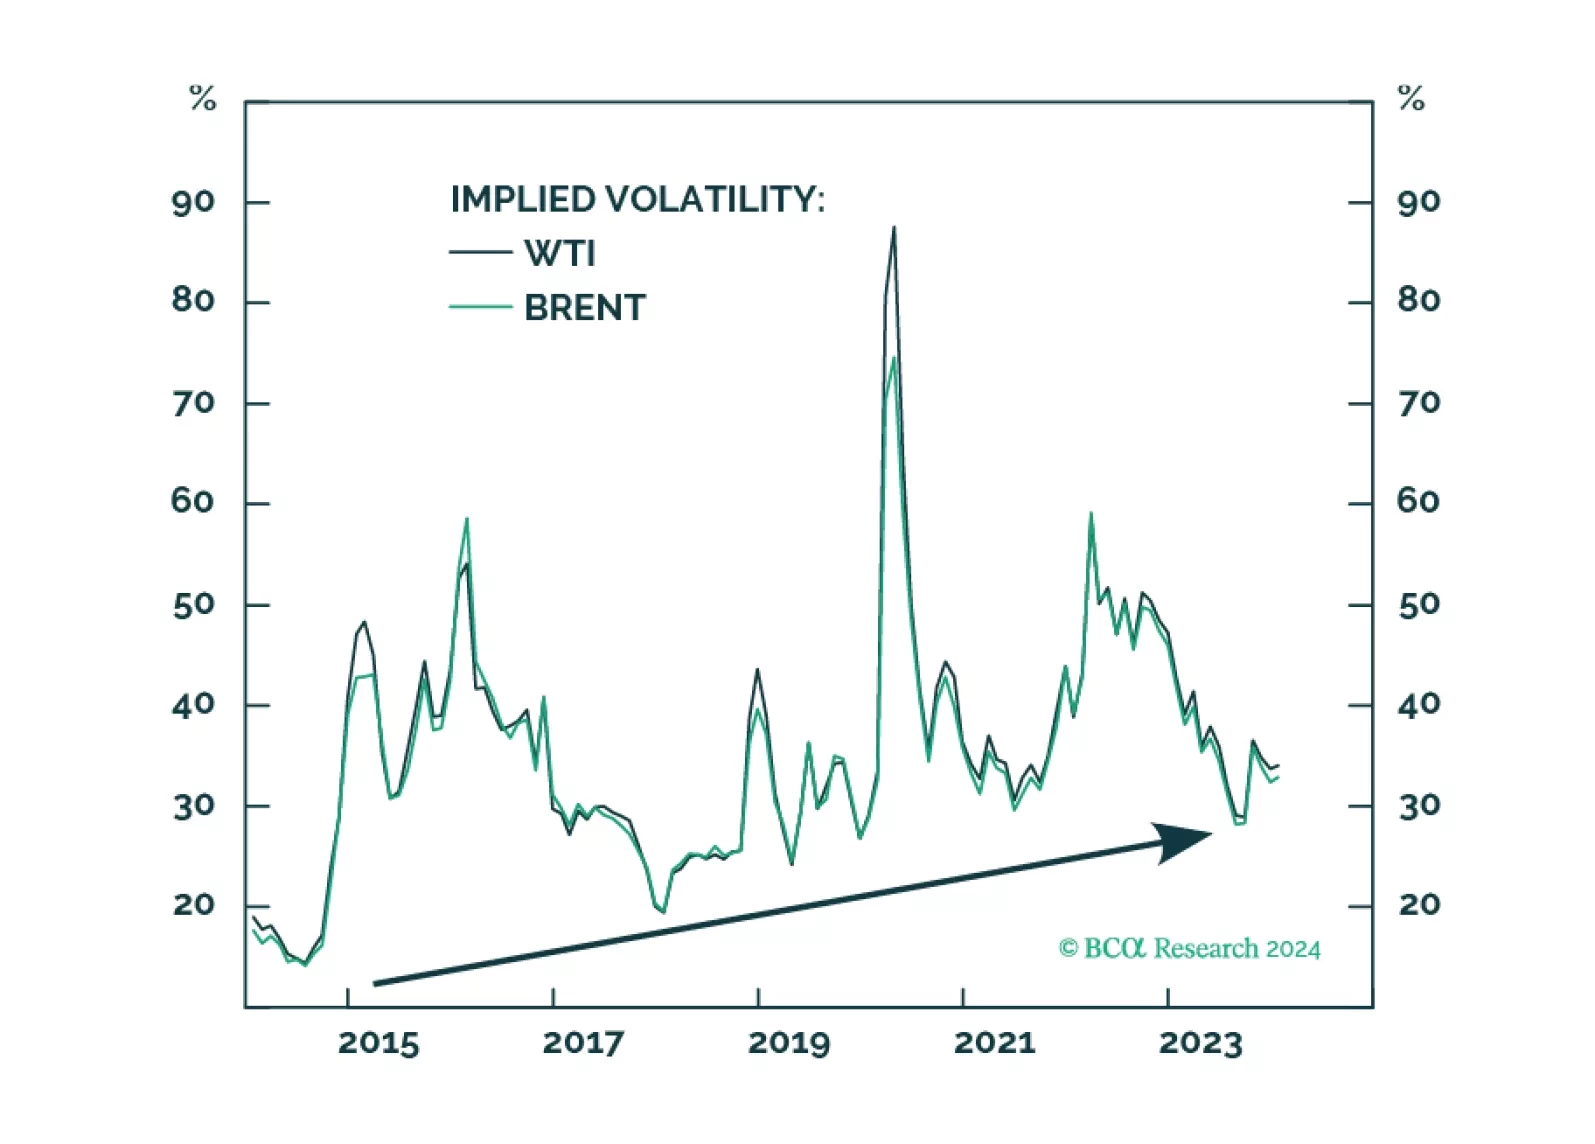
Commodity volatility will continue its rising trend since 2014. The US is on the brink of a major election, the outcome of which could reduce its willingness to engage with the outside world. So, states seeking to carve out their own spheres of influence are incentivized to raise the economic costs to the US and discourage its influence in their regions. These states can do this by interfering in key trading routes in their regions. As a result, geopolitical threats to maritime chokepoints are a structural as well as cyclical problem and will persist due to the revival of superpower competition.

Wheat, corn, and soybean all traded lower at the Chicago Board of Trade on Wednesday following the US Department of Agriculture’s latest release of its monthly World Agricultural Supply and Demand Estimates (WASDE) – down 4.2%, 3.5%, and 2.4%, respectively. …
Executive Summary   The surge in food prices following Russia's invasion of Ukraine will drive EM headline inflation higher, given more of individuals' incomes in these economies are spent on food. Economies in the MENA will remain at risk for higher food prices, given their reliance on wheat imports from Ukraine and Russia, which together comprise ~ 30% of global wheat exports.  Wheat is the most widely traded grain in the world; its production is second only to that of corn.  Higher shipping and input costs – especially for fertilizers – will exacerbate the upside price pressure on grains, particularly wheat. Tenuous social contracts raise the risk of social unrest in MENA reminiscent of the Arab Spring unrest of 2011, which was fueled by food scarcity, economic stagnation and popular anger at autocratic governments. A strong USD will continue to raise the local-currency cost of grains and food, which also will fuel EM inflation. The War Increased Food Prices… High Food Prices Drive EM Inflation High Food Prices Drive EM Inflation Bottom Line: Wheat prices will remain volatile with a bias to the upside for as long as the Russia-Ukraine war persists.  The uncertain evolution of this war means EM states will be more exposed to grain-price volatility and higher inflation.  This could prove to be destabilizing to MENA states in particular.  Separately, we update our recommendations below.  Feature High food prices will drive EM headline inflation, owing to the fact a higher proportion of individuals’ incomes in these economies are spent on food. These pressures are particularly acute for wheat following Russia's invasion of Ukraine. Related Report  Commodity & Energy StrategyCopper Demand Will Ignore Recession Wheat is the most widely traded grain in the world, according to the World Population Review (WPR).1 In terms of global production, it is second only to corn, totaling 760mm tons in 2020. In order, the top three wheat producers in the world are China, India, and Russia, which account for 41% of global output. The US is the fourth-largest producer. The WPR notes that if the EU were to be counted as a single country, its wheat production would be second only to China (Chart 1). Within emerging markets, the Middle East and North African (MENA) nations will be worst hit by rising wheat prices.2 This is because the bulk of their wheat imports are sourced from Russia and Ukraine, and shipped from Black Sea ports, which are literally caught in the crosshairs of the Russia-Ukraine war. Many of these states do not have sufficient grain reserves to tide themselves over this crisis, and will be forced to import food at elevated prices. A strong USD, which this past week hit a 19-year high, will add to the price of USD-denominated commodity imports, particularly wheat. Russia’s invasion of Ukraine will continue to exacerbate EM food scarcity and drive input costs – e.g., fertilizers – and shipping rates higher. This will keep food and wheat prices volatile with a strong bias to the upside (Chart 2). Chart 1Wheat Production Faces Concentration Risk High Food Prices Drive EM Inflation High Food Prices Drive EM Inflation Chart 2The War Increased Food Prices… High Food Prices Drive EM Inflation High Food Prices Drive EM Inflation In addition to the inflation risk from high food and energy prices, the tenuous social contracts in many states again raises the risk of social unrest in MENA, as occurred in the 2011 Arab Spring protests against food scarcity, economic stagnation and autocratic government.3 War Disruptions Will Continue Russia’s invasion of Ukraine jeopardized wheat supply from two countries which together constitute nearly 30% of total global wheat exports. The invasion will continue to keep wheat prices volatile and biased to the upside (Chart 3). The UN Food and Agriculture Organization (FAO) forecasts Ukraine’s 2021/22 wheat output will drop below its 5-year average, since at least 20% of total arable land cannot be used due to the war. While nearly 60% lower than this time last year, Ukrainian wheat exports in March were not completely shut down. However, they were re-routed around the direct routes from the Black Sea.4 In March, Ukraine managed to export 309k tons of wheat. Chart 3...Particularly Wheat ...Particularly Wheat ...Particularly Wheat Ukraine will need to rely on these convoluted routes until port services are either restored or unblocked. Exports through more circuitous routes will delay distribution and increase transport costs. This, of course, also adds to the delivered cost of wheat that is being rerouted and slows the overall distribution of grains globally. Additionally, Ukrainian exports via other countries will be disrupted by those countries’ own trade slowdowns, since global bottlenecks affects all trade. Thus far, Russia has been able to maintain wheat exports. Russia continued to supply wheat to global markets in March and April. The USDA estimates that during the 2021/22 crop year, which ends in June, Russian wheat exports will total 33mm tons, which is just 2mm tons lower than the USDA's pre-crisis estimate.5 Because of high carryover stocks and record production, Russia's exports in the 2022/23 crop year are expected to be more than 40mm tons. Sourcing Alternative Wheat Supplies With a sizable portion of global wheat supply at risk – primarily from Ukraine – other exporting countries will need to increase output to fill this gap (Chart 4). This production, however, is not guaranteed, as it depends primarily on weather and fertilizer prices. New trade routes will also need to be created. This will tax existing export infrastructures as shipping dynamics are reconfigured. Particularly important will be how far the new-found sources of supply have to travel to deliver grain, shipping availability, and, of course, the incremental costs incurred to move supplies. As of 2021, the EU – the Black Sea states’ principle competitor in the wheat-export market – and 48% of total wheat exports to Middle East and African countries (Chart 5). The EU's ability to increase exports for the remainder of the 2021/22 crop year will depend on its production, since demand for exports will be guaranteed given the crisis in the Black Sea. Chart 4Other Exporters Will Need To Ramp Up High Food Prices Drive EM Inflation High Food Prices Drive EM Inflation Chart 5MENA Is EU’s Primary Wheat Export Market High Food Prices Drive EM Inflation High Food Prices Drive EM Inflation The European Commission expects the EU to export a record 40mm tons of wheat for the 2022/23 market year, 6mm tons higher than its expected 2021/22 exports. Based on past trade patterns, these excesses will go to the Middle East, Northern and Sub-Saharan Africa. Strong USD Favors LatAm Exports US wheat exports will not be competitive this year or next, given the strong USD and relatively high prices (Chart 6). Additionally, this year’s winter-wheat crop will be affected by current drought conditions in the key Hard Red Winter wheat growing regions of Western Kansas, Colorado, Oklahoma and Texas. Canada faces a similar issue to its North American neighbor. Compared to other major wheat exporting states, it exports wheat at the second highest price, after the US. Furthermore, in 2021/22 Canadian wheat output is expected to be the lowest in 14 years following a warm and dry summer. The USDA expects strong Argentinian and Brazilian wheat exports in 2021/22. Compared to exports from the EU, US, Australia and Canada, wheat from these two sources is cheaper and hence will attract price sensitive bids from the Middle East and Africa. Chart 6US Wheat Remains Non-Competitive US Wheat Remains Non-Competitive US Wheat Remains Non-Competitive A strong USD will incentivize the LatAm giants’ wheat exports since their input costs are in local-currency terms and their revenues are in USD. While some countries have taken advantage of high wheat and food prices to increase exports, others have imposed restrictions or outright bans on exports, which will continue to drive prices higher. Kazakhstan, which constitutes nearly 5% of global wheat exports, now has a quota on such exports, which will affect Central Asian import markets. India was expected to constitute an uncharacteristically large share of wheat exports this year and next. However, the country is experiencing its hottest March in 122 years, which most likely will reduce its harvest this year and incentivize it to keep wheat stocks at home. The world’s second largest wheat producing and consuming nation expects a 6% drop in production this year.6 Fertilizer Costs Will Remain High … Countries’ abilities to increase production will depend on fertilizer availability and costs. The USDA cited high fertilizer prices as one of the causes for lower expected Australian wheat output in 2022/23. Prices of natural gas – the primary feedstock for fertilizers – took off like a rocket following Russia's invasion of Ukraine. High natgas prices feed directly into fertilizer costs (Chart 7). The EU's proposal to ban Russian oil imports could see Russia embargo natgas supply in retaliation, which would further spike natgas and fertilizer costs. This will have knock-on effects on all ags markets. Fertilizer export bans announced by Russia and China are another factor driving fertilizer prices higher (Chart 8). High fertilizer costs most likely will dissuade farmers from using fertilizers in volumes associated with more normal market conditions, and likely will cause them to wait on planting and treating acreage, which will lower crop quality or delay planting. Both scenarios will lead to higher crop prices (Chart 9). Chart 7High Natgas Prices Feeds Right Into Fertilizers High Natgas Prices Feeds Right Into Fertilizers High Natgas Prices Feeds Right Into Fertilizers Chart 8Russia, China Are Big Fertilizer Exporters High Food Prices Drive EM Inflation High Food Prices Drive EM Inflation Chart 9Nitrogen Fertilizer Prices Continue To Rise Nitrogen Fertilizer Prices Continue To Rise Nitrogen Fertilizer Prices Continue To Rise …As Do Shipping Costs Redrawing trade routes – i.e., finding new supplies and new shippers to compensate for the loss of Ukrainian wheat exports – will be expensive. For example, US grain shipping costs soared to an 8-year high after countries, led by China, dramatically increased soybean imports from the US due to a drought in Brazil.7 In 2021, high shipping costs led directly to higher food prices (Chart 10).8 Shipping, like any other commodity, is a function of supply and demand for different types of vessels capable of carrying grain from one part of the world to another. On the supply-side, port closures in China and the Black Sea are increasing port congestion, and making ships available for moving grains scarce. The Ukraine war has stranded ships in the Black Sea and forced merchants to re-route their shipments. This increases sailing times, which has the effect of contributing to supply scarcity in shipping markets. Fewer available ships, coupled with high fuel prices are keeping freight rates elevated. A low orderbook of expected new-vessel additions to the global shipping fleet in 2022 and 2023, along with guidance for ships to reduce speeds to increase fuel efficiency, will exacerbate current ship supply scarcity.9 On the demand side, the major international economic organizations have reduced 2022 GDP estimates due to lower economic activity. Lower economic activity will translate into lower ship demand and hence reduce prices (Chart 11). Chart 10Shipping Prices Remain Elevated Shipping Prices Remain Elevated Shipping Prices Remain Elevated Chart 11Shipping Demand Driven By Economic Activity Shipping Demand Driven By Economic Activity Shipping Demand Driven By Economic Activity   Shipping prices will drop meaningfully once port congestion clears. This will depend on the duration of COVID-19 in China and the evolution of the Russia-Ukraine war. A recession – the probability of which will increase if the EU bans Russian oil imports and Russia retaliates with its own natgas ban – acts as a downside risk to shipping costs. Investment Implications The gap in Black Sea wheat exports produced by the Russia-Ukraine war will require a ramp-up in other countries’ supply. Higher production is contingent on weather conditions and input costs. Changing weather patterns, due to climate change, will increase food insecurity, and make it more difficult to predict how ag markets – particularly grain trading – will handle this shock and other shocks down the road. We remain neutral agricultural commodities but will follow wheat and food market developments closely.   Ashwin Shyam Research Analyst Commodity & Energy Strategy ashwin.shyam@bcaresearch.com Paula Struk Research Associate Commodity & Energy Strategy paula.struk@bcaresearch.com Robert P. Ryan Chief Commodity & Energy Strategist rryan@bcaresearch.com   Commodity Round-Up Energy: Bullish Going into the Northern Hemisphere's summer driving season, US retail gasoline prices are trading at record levels -- $4.328/gal ($181.78/bbl) as of 9 May 2022, according to the US Energy Information Administration (Chart 12). Regular gasoline (RBOB specification traded on the NYMEX) for delivery in the NY Harbor settled at $144.27/bbl ($3.4349/gal) on Tuesday, giving refiners a rough wholesale margin (versus Brent crude oil) of $41.81/bbl. Retail diesel fuel prices also have been extremely well bid, posting record highs as well of $5.623/gal ($236.17/bbl) on 9 May 2022 (Chart 13). On the NYMEX, the ultra-low sulfur diesel fuel contract for July delivery settled at $3.6793/gal ($154.53/bbl). Jet fuel prices also are extremely well bid, as demand increases against a backdrop of lower refinery output pushed NY Harbor prices to $7.61/gal ($319.62/bbl) on 4 April 2022. NY Harbor jet-fuel prices have been much stronger than US Gulf prices and European prices seen in the Amsterdam-Rotterdam-Antwerp (ARA) markets, which were averaging ~ $3.60/gal, according to the EIA. This is accounted for by robust demand – evident since mid-2021, when it recovered pandemic-induced losses – and lower-than-normal output of jet by refiners. Assuming the US does not go into a profound recession, refined-product markets likely will remain tight during the summer-driving season and into the rest of this year, in our estimation. As is the case with the Exploration & Production companies, refiners also have been parsimonious with their capex, which translates into lower capacity to meet demand. Base Metals: Bullish Per the latest US CFTC data, we believe hedge funds and speculators investing in copper are dismissing bullish micro fundamentals and are focusing on bearish macroeconomic factors, such as the probability of an economic slow down increases. This would explain why funds’ short positions have exceeded long positions for the first time since end-May 2020. We have written about medium-to-long-term bullish micro fundamentals at length in previous reports.10 On micro fundamentals, the Chilean constitutional assembly passed articles expanding environmental protection from mining over the weekend. These will be added to the draft constitution to be voted on in September. The article expanding state control in Chilean mining activity did not pass and will be renegotiated before being sent back to the constitutional assembly for a second vote. Uncertain governance will affect mining investment in the state, as BHP recently highlighted. Chart 12 High Food Prices Drive EM Inflation High Food Prices Drive EM Inflation Chart 13 High Food Prices Drive EM Inflation High Food Prices Drive EM Inflation           Footnotes 1     Please see Wheat Production by Country 2022, published by worldpopulationreview.com. 2     Awika (2011) notes, "… cereal grains are the single most important source of calories to a majority of the world population. Developing countries depend more on cereal grains for their nutritional needs than the developed world. Close to 60% of calories in developing countries are derived directly from cereals, with values exceeding 80% in the poorest countries." Please see Joseph M. Awika (2011), "Major Cereal Grains Production and Use around the World," published by the American Chemical Society. The three most important grains in this regard are rice, corn and wheat. 3    Please see Egypt's Arab Spring: The bleak reality 10 years after the uprising, published by dw.com on January 25, 2021. 4    Please see First Ukrainian corn cargo leaves Romanian Black Sea port, published by Reuters on April 29, 2022. 5    All USDA estimates mentioned in this report are taken from the USDA’s Grain and Feed Annual for each country. 6    Please refer to After five record crops, heat wave threatens India’s wheat output, export plans, published by Reuters on May 2, 2022. 7     Please refer to U.S. Grain Shipping Costs Soar With War and Drought Swinging Demand, published by Bloomberg on March 18, 2022. 8    For a more detailed discussion, please refer to Risk of Persistent Food-Price Inflation, which we published on November 11, 2021. 9    For estimates of orderbook vessels in 2022/23 please see Shipping market outlook 2022 Container vs Dry bulk, published by IHS Markit on November 30, 2021; slower speeds could reduce effective shipping capacity by 3-5%, according to S&P Global (see Shipping efficiency targets could prompt slower speeds and reduced capacity: market sources). 10   For the latest on this, please see Copper Demand Will Ignore Recession, which we published on April 14, 2022.   Investment Views and Themes Recommendations   Recommendations: We are re-establishing our positions in XME, PICK and XOP, which were stopped out APRIL 22, 2022 with gains of 42.42%, 9.77% and 20.91%, respectively, at tonight's close. We also will be adding the VanEck Oil Refiners ETF (CRAK) to our recommendations, given our bullish view of the global refining sector. Strategic Recommendations   Trades Closed in 2022 Image  
Highlights Going into the new crop year, we expect the course of the broad trade-weighted USD to dictate the path taken by grain and bean prices (Chart of the Week). Higher corn stocks in the coming crop year, flat wheat stocks and lower rice stocks will leave grain markets mostly balanced vs the current crop year.  Soybean stocks and carryover estimates from the USDA and International Grains Council (IGC) are essentially unchanged year-on-year (y/y). In the IGC's estimates, changes in production, trade, and consumption for the major grains and beans largely offset each other, leaving carryovers unchanged. Supply-demand fundamentals leave our outlook for grains and beans neutral.  This does not weaken our conviction that continued global weather volatility will tip the balance of price risk in grains and beans over the coming year to the upside. Our strategically bearish USD view also tips the balance of price risk in grains – and commodities generally – to the upside. We believe positioning for higher-volatility weather events and a lower US dollar is best done with index products like the S&P GSCI and the COMT ETF, which tracks a version of the GSCI optimized for backwardation.  Feature Chart of the WeekUSD Will Drive Global Grain Markets USD Will Drive Global Grain Markets USD Will Drive Global Grain Markets Chart 2Opening, Closing Grain Stocks Will Be Largely Unchanged Global Grain, Bean Markets Balanced; USD Expected To Drive '21/22 Prices Global Grain, Bean Markets Balanced; USD Expected To Drive '21/22 Prices Going into the new crop year, opening and closing stocks are expected to remain flat overall vs the current crop years, with changes in production and consumption largely offsetting each other in grain and bean markets (Chart 2).1 This will leave overall prices a function of weather – which no one can predict – and the path taken by the USD over the coming year. The IGC's forecast calls for mostly unchanged production and consumption for grains and beans globally, with trade volumes mostly flat y/y. This leaves global end-of-crop-year carryover stocks essentially unchanged at 594mm tons. The USDA expects wheat ending stocks at the end of the '21/22 crop year up a slight 0.5%; rice down ~ 4.5%, and corn up ~ 4%. Below we go through each of the grain and bean fundamentals, and assess the impact of COVID-19 on global trade in these commodities. We then summarize our overall view for the grain and bean complex, and our positioning recommendations. Rice The IGC forecasts higher global rice production and consumption, and, since they expect both to change roughly by the same amount, ending stocks are projected to remain unchanged in the '21/22 crop year relative to the current year (Chart 3). The USDA, on the other hand, is expecting global production to increase by ~ 1mm MT in the new crop year, with consumption increasing by ~ 8mm MT. This leaves ending inventories for the new crop year just under 8mm MT below '20/21 ending stocks, or 4.5%. Chart 3Global Rice Balances Roughly Unchanged Global Rice Balances Roughly Unchanged Global Rice Balances Roughly Unchanged Corn The IGC forecasts global corn production will rise 6.5% to a record high in the '21/22 crop year, while global consumption is expected to increase 3.6%. Trade volumes are expected to fall ~ 4.2%, leaving global carryover stocks roughly unchanged (Chart 4). In the USDA's modelling, global production is expected to rise 6.6% in the '21/22 crop year to 1,195mm MT, while consumption is projected to rise ~ 2.4% to 1,172mm MT. The Department expects ending balances to increase ~ 11mm MT, ending next year at 291.2mm MT, or just over 4% higher. Chart 4Corn Balances Y/Y Remain Flat Corn Balances Y/Y Remain Flat Corn Balances Y/Y Remain Flat Wheat The IGC forecasts global wheat production in the current crop year will increase by ~ 16mm MT y/y, which will be a record if realized. Consumption is expected to rise 17mm MT, with trade roughly unchanged. This leaves expected carryover largely unchanged at ~ 280mm MT globally (Chart 5). The USDA's forecast largely agrees with the IGC's in its ending-stocks assessment for the new crop year. Global wheat production is expected to increase 16.6mm MT y/y in '21/22, and consumption will rise ~ 13mm MT, or 1.7% y/y. Ending stocks for the new crop year are expected to come in at just under 292mm MT, or 0.5% higher. Chart 5Ending Wheat Stocks Mostly Unchanged Ending Wheat Stocks Mostly Unchanged Ending Wheat Stocks Mostly Unchanged Soybeans Both the IGC and USDA expect increases in soybean ending stocks for the '21/22 crop year. However, the USDA’s estimates for ending stocks are nearly double the IGC projections.2 We use the IGC's estimates in Chart 6 to depicts balances. USDA - 2021/22 global soybean ending stocks are set to increase by ~3 mm MT to 94.5 mm MT, as higher stocks from Brazil and Argentina are partly offset by lower Chinese inventories. US production is expected to make up more than 30% of total production, rising 6% year-on-year. Chart 6Higher Bean Production Meets Higher Consumption Higher Bean Production Meets Higher Consumption Higher Bean Production Meets Higher Consumption Impact Of COVID-19 On Ags Trade Global agricultural trade was mostly stable throughout the COVID-19 pandemic. China was the main driver for this resilience, accounting for most of the increase in agricultural imports from 2019 to 2020. Ex-China, global agricultural trade growth was nearly zero. During this period, China was rebuilding its hog stocks after an outbreak of the African Swine Flu, which prompted the government to grant waivers on tariffs in key import sectors, which increased trade under the US-China Phase One agreement. As a result, apart from COVID-19, other factors were influencing trade. Arita et. al. (2021) attempted to isolate the impact of COVID on global agricultural trade.3 Their report found that COVID-19 – through infections and deaths – had a small impact on global agricultural trade. Government policy restrictions and reduced mobility in response to the pandemic were more detrimental to agricultural trade flows than the virus itself in terms of reducing aggregate demand. Policy restrictions and lower mobility reduced trade by ~ 10% and ~ 6% on average over the course of the year. Monthly USDA data shows that the pandemic was not as detrimental to agricultural trade as past events. Rates of decline in global merchandise trade were sharper during the Great Recession of 2007 – 2009 (Chart 7). Many agricultural commodities are necessities, which are income inelastic. Furthermore, shipping channels for these types of commodities did not require substantial human interactions, which reduced the chances of this trade being a transmission vector for the virus, when governments declared many industries using and producing agricultural commodities as necessities. This could explain why agricultural trade was spared by the pandemic. Amongst agricultural commodities, the impact of the pandemic was heterogenous. For necessities such as grains or oilseeds, there was a relatively small effect, and in few instances, trade actually grew. For example, trade in rice increased by ~4%. The value of trade in higher-end items, such as hides, Chart 7COVID-19 Spares Ag Trade Global Grain, Bean Markets Balanced; USD Expected To Drive '21/22 Prices Global Grain, Bean Markets Balanced; USD Expected To Drive '21/22 Prices Chart 8Grains Rallied During Pandemic Global Grain, Bean Markets Balanced; USD Expected To Drive '21/22 Prices Global Grain, Bean Markets Balanced; USD Expected To Drive '21/22 Prices tobacco, wine, and beer fell during the pandemic. This was further proof of the income inelasticity of many agricultural products which kept global trade in this sector resilient. Indeed, the UNCTAD estimates global trade for agriculture foods increased 18% in 1Q21 relative to 1Q19. Over this period, Bloomberg's spot grains index was up 47.08% (Chart 8). Investment Implications We remain neutral grains and beans based on our assessment of the new crop-year fundamentals. That said, we have a strong-conviction view global weather volatility will tip the balance of price risk in grains over the coming year to the upside. Our strategically bearish USD view also tips the balance of price risk in grains – and commodities generally – to the upside. Weather-induced grain and bean prices volatility is supportive for our recommendations in the S&P GSCI and the COMT ETF, which tracks a version of the GSCI optimized for backwardation. These positions are up 5.8% and 7.9% since inception, and are strategic holdings for us.   Robert P. Ryan Chief Commodity & Energy Strategist rryan@bcaresearch.com Ashwin Shyam Research Associate Commodity & Energy Strategy ashwin.shyam@bcaresearch.com   Commodities Round-Up Energy: Bullish US natural gas prices remain well supported by increased power-generation demand due to heat waves rolling through East and West coasts, lower domestic production and rising exports. The US EIA estimates natgas demand for July rose 3.9 bcf/d vs June, taking demand for the month to 75.8 bcf/d. Exports – pipeline and LNG – rose 0.4 bcf/d to 18.2 bcf/d, while US domestic production fell to 92.7 bcf/d, down 0.2 bcf/d from June's levels. As US and European distribution companies and industrials continue to scramble for gas to fill inventories, we expect natgas to remain well bid as the storage-injection season winds down. We remain long 1Q22 call spreads, which are up ~214% since the position was recommended April 8, 2021 (Chart 9). Base Metals: Bullish Labor and management at BHP's Escondida copper mine – the largest in the world – have a tentative agreement to avoid a strike that would have crippled an already-tight market. The proposed contract likely will be voted on by workers over the next two days, according to reuters.com. Separately, the head of a trade group representing Chile's copper miners said prices likely will remain high over the next 2-3 years as demand from renewables and electric vehicles continues to grow. Diego Hernández, president of the National Society of Mining (SONAMI), urged caution against expecting a more extended period of higher prices, however, mining.com reported (Chart 10). We remain bullish base metals generally, copper in particular, which we expect to remain well-bid over the next five years. Precious Metals: Bullish US CPI for July rose 0.5% month-over-month, suggesting the inflation spike in June was transitory. While lower inflation may reduce demand for gold, it will allow the Fed to continue its expansionary monetary policy. The strong jobs report released on Friday prompted markets and some Fed officials to consider tapering asset purchases sooner than previously expected. The jobs report also boosted an increasing US dollar. A strong USD and an increase in employment were negative for gold prices on Monday. There also were media reports of a brief “flash crash” caused by an attempt to sell a large quantity of gold early in the Asian trading day, which swamped available liquidity at the time. This also was believed to trigger stops and algorithmic trading programs, which exacerbated the move. The potential economic impact of the COVID-19 Delta variant is the only unequivocally supportive development for gold prices. Not only will this increase safe-have demand for gold, but it will also prevent the Fed from being too hasty in tapering its asset purchases and subsequently raising interest rates. Chart 9 Natgas Prices Recovering Natgas Prices Recovering Chart 10 Copper Prices Going Down Copper Prices Going Down Footnotes 1     The wheat crop year in the US begins in June; the rice crop year begins this month; and the corn and bean crop years begin in September. 2     Historical data indicate this difference is persistent, suggesting different methods of calculating ending stocks.  The USDA estimates ending stocks for the '21/22 crop year will be 94.5mm tons, while the IGC is projecting a level of 53.8mm.  3    Please refer to ‘Has Global Agricultural Trade Been Resilient Under Coronavirus (COVID-19)? Findings from an Econometric Assessment. This is a working paper published by Shawn Arita, Jason Grant, Sharon Sydow, and Jayson Beckman in May 2021.   Investment Views and Themes Strategic Recommendations Tactical Trades Commodity Prices and Plays Reference Table Trades Closed in 2021 Summary of Closed Trades Image
Highlights Entering 2H21, oil and metals' price volatility will rise as inventories are drawn down to cover physical supply deficits brought about by the re-opening of major economies ex-China. As demand increases and oil and metals supply become more inelastic, forward curves will backwardate further.  This will weaken commodity-price correlations with the USD and boost commodity-index returns. Going into next week's OPEC 2.0 meeting, the Kingdom of Saudi Arabia (KSA) and Russia likely will hold off on further production increases, until greater clarity around US-Iran negotiations and the return of Iran as a bona fide exporter is available. Chinese authorities will release 100k MT of copper, aluminum and zinc into tight domestic markets in July.  A two-day rally followed the news. Since bottoming in March 2020, the XOP and XME ETFs covering oil and gas producers and metals miners are up ~ 218% and ~ 196%, respectively, following the ~ 230% move in crude oil and the ~ 100% rise copper prices.  Higher volatility will present buying opportunities for these ETFs  (Chart of the Week). We remain long commodity index exposure – S&P GSCI and COMT ETF – expecting steeper backwardations. We will go long the PICK ETF at tonight's close again, after being stopped out last week with a 23.9% return. Feature Heading into 2H21, industrial commodity markets will continue to tighten.  In the case of oil, this is caused by OPEC 2.0's production-management strategy – i.e., keeping supply below demand – and capital discipline among producers in the price-taking cohort.1 Base metals, on the other hand, are tightening because demand is recovering much faster than supply.2 Re-opening of major economies will boost refined-product demand in oil markets – e.g., gasoline and jet fuel – which will leave refiners little choice but to continue drawing on inventories to cover supply shortfalls in the near term (Chart 2). Chart of the WeekResources ETFs Follow Prices Higher Resources ETFs Follow Prices Higher Resources ETFs Follow Prices Higher Chart 2Refiners Will Continue Drawing Crude Investments Refiners Will Continue Drawing Crude Investments Refiners Will Continue Drawing Crude Investments Base metals – particularly copper and aluminum – will remain well bid in the face of constrained supply and higher consumption ex-China.  Despite China's widely anticipated decision to release strategic stockpiles of copper, aluminum and zinc next month into a tight domestic market – which we flagged last month – continued inventory draws will be required to cover physical deficits in these markets, particularly in copper (Chart 3).3 Chart 3Copper Inventories Will Draw As Demand Ex-China Rises Copper Inventories Will Draw As Demand Ex-China Rises Copper Inventories Will Draw As Demand Ex-China Rises Chart 4Steeper Backwardation, Higher Volatility Oil, Metals Vol Creates Buying Opportunities Oil, Metals Vol Creates Buying Opportunities Higher Vol On The Way As demand for industrial commodities increases and inventories continue to draw, forward curves will become more backwardated – i.e., material delivered promptly (next day or next week) will command a higher price than commodities delivered next month or next year: Consumers value current supply above deferred supply, and producers and merchants have to charge more to cover inventory replacement costs, which increase when prompt demand outstrips supply. The steepening of forward curves for industrial commodities will lead to higher price volatility in oil and metals markets, particularly copper: Demand will confront increasingly inelastic supply.  In this evolution, prices will be forced to allocate inelastic supply as demand increases.  Sometimes-sharp changes in price are required to equilibrate available supply with demand when this happens.  This can be seen clearly in oil markets, but it holds true for all storable commodities (Chart 4).4 Investment Implications Industrial commodity markets are entering a more volatile phase, which will be characterized by sharp price movements up and down over the short term, as demand continues to outpace supply. Our analysis suggests this is the beginning of a more volatile phase in industrial commodity markets.  The balance of risk in industrial commodity prices will remain to the upside as volatility increases. In the short term, fundamental imbalances can be addressed over a relatively short months-long horizon – i.e., OPEC 2.0 can release spare capacity over a 3-4 month interval to accommodate rising demand – so that price increases do not destroy demand as oil-exporters are rebuilding their fiscal balance sheets. Base metals markets will have a tougher time in the short run finding the supply to meet surging demand, but it can be done over the next year or so without prices getting to the point where demand-destruction sets in. Over the medium to long term, investor-owned oil and gas producers literally are being directed by policymakers, shareholders and courts toward an extended wind-down of production and investment in future production.  Markets have been pricing through just such a situation in the post-COVID-19 world, with OPEC 2.0 managing supply against falling demand and still managing to reduce inventories significantly.  If the world follows the IEA's pathway to a decarbonized future – in which no investment in new oil or gas production is required after 2025 – this will become the status quo for these markets going forward.5 Metals producers, on the other hand, are being encouraged to increase marketable supply at a rapid pace to accommodate demand driven by the build-out of renewable energy – chiefly wind and solar – and the grids that will be required to move this energy. Producers, however, remain reluctant to do so, fearing their capex investment to build out supply will produce physical surpluses that depress returns, similar to the last China-led commodity super-cycle. Supplying the necessary base metals to make this happen will be difficult at best, according to Ivan Glasenberg, CEO at Glencore.  At this week's Qatar Economic Forum, he said copper supply will have to double between now and 2050 to meet expected demand for this critical metal.  “Today, the world consumes 30 million tonnes of copper per year and by the year 2050, following this trajectory, we’ve got to produce 60 million tonnes of copper per year,” he said.  “If you look at the historical past 10 years, we’ve only added 500,000 tonnes per year … Do we have the projects? I don’t think so. I think it will be extremely difficult.”6 The volatility we are expecting in oil, gas and base metals prices, will present buy-the-dip opportunities in related equities vehicles.  Since bottoming in March 2020, the XOP and XME ETFs covering oil and gas producers and metals miners are up ~ 218% and ~ 196%, respectively, matching the ~ 230% move in crude oil and the ~ 100% rise in copper prices.  We remain long commodity index exposure – S&P GSCI, which is up 5.9% and the COMT ETF, which is up 7.6% – expecting steeper backwardations.  The trailing stop on our MSCI Global Metals & Mining Producers ETF (PICK) position recommended 10 December 2020 was elected, which stopped us out with a gain of 23.9%.  We are getting long the PICK again at tonight's close.   Robert P. Ryan Chief Commodity & Energy Strategist rryan@bcaresearch.com Ashwin Shyam Research Associate Commodity & Energy Strategy ashwin.shyam@bcaresearch.com   Commodities Round-Up Energy: Bullish Commercial crude oil stocks in the US (ex-SPR barrels) fell 7.6mm barrels w/w in the week ended 18 June 2021, according to the US EIA. Including products, US crude and product inventories were down 5.8mm barrels. US domestic crude oil production was down 100k b/d, ending the week at 11.1mm b/d. Overall product supplied, the EIA's proxy for refined-product demand, was up 180k b/d at 20.75mm b/d, which is 129k b/d below 2019 demand for the same period. At 9.44mm b/d, gasoline demand was just below comparable 2019 consumption of 9.47mm b/d, while jet-fuel demand remains severely depressed vs. comparable 2019 consumption at 1.58mm b/d (vs. 1.92mm b/d).  Distillate demand (e.g., diesel fuel) for the week ended 18 June 2021 was 3.95mm b/d vs. 3.97mm b/d for the comparable 2019 period. Base Metals: Bullish Benchmark spot iron ore (62% Fe) prices are holding above $210/MT in trading this week, as demand for the steel input remains strong in China (Chart 5). The Chinese Communist Party (CCP) increased its level of intervention in the iron ore market this week, launching investigations into “malicious speculation,” vowing to “severely punish” anyone found to be engaged in such behavior, according to ft.com.7 Benchmark iron ore prices hit $230/MT in May. We continue to expect exports from Brazil to pick up in 2H21, which will push prices lower in 2H21. Precious Metals: Bullish In the aftermath of last Wednesday’s FOMC meeting gold prices lost nearly $86/oz (Chart 6). Our colleagues at BCA Research's USBS believe markets are paying too much attention to the Fed’s dot plots, and not to the central bank’s verbal guidance.8 Originally, the Fed stated that it will only start raising interest rates once a checklist of three conditions have been met. This checklist includes guidance on actual and expected inflation rates and the labor market. Gold prices did not react to Chair Powell's testimony before the House Select Subcommittee on the Coronavirus Crisis. Ags/Softs: Neutral US spring wheat prices are rallying on the back of dry weather in the northern Plains, while forecasts for benign crop weather in the Midwest pressured soybeans lower this week, according to successfulfarming.com. Chart 5 BENCHMARK IRON ORE 62% FE, CFR CHINA (TSI) GOING DOWN BENCHMARK IRON ORE 62% FE, CFR CHINA (TSI) GOING DOWN Chart 6 US Dollar To Keep Gold Prices Well Bid US Dollar To Keep Gold Prices Well Bid     Footnotes 1     Please see our most recent oil price forecasts published last week in Balance Of Risks Tilts To Higher Oil Prices.  It is available at ces.bcaresearch.com. 2     Please see A Perfect Energy Storm On The Way published on June 3, 2021 for further discussion. 3    Please see Less Metal, More Jawboning published on May 27, 2021, which flagged China's likely decision to release strategic stockpiles of base metals. 4    Chart 4 shows implied volatility as a function of the slope of the forward curve, i.e., the difference between the 1st- and 13th-nearby futures divided by the 1st-nearby future vs implied volatilities for Brent and WTI options.  This modeling extends Kogan et al (2009), mapping realized volatilities calculated using historical settlements of crude oil futures against the slope of crude oil futures conditioned on 6th- vs. 3rd-nearby futures returns (in %). Please see Kogan, L., Livdan, D., & Yaron, A. (2009), "Oil Futures Prices in a Production Economy With Investment Constraints." The Journal of Finance, 64:3, pp. 1345-1375. 5    Please see fn 2's discussion of the IEA's Net Zero by 2050, A Roadmap for the Global Energy Sector beginning on p. 5 under The Case For A Carbon Tax. 6    Please see Copper supply needs to double by 2050, Glencore CEO says published on June 23, 2021 by reuters.com.  Of course, being a copper producer with large-scale base-metals projects due to come on line in the next year or so, Mr. Glasenberg could be talking his book, but as Chart 3 shows, copper has been and likely will be in physical deficits for years. 7     Please see China cracks down on iron ore market, published by ft.com on June 21, 2021. 8    Please see How To Re-Shape The Yield Curve Without Really Trying, published on June 22, 2021.   Investment Views and Themes Strategic Recommendations Tactical Trades Commodity Prices and Plays Reference Table Trades Closed in 2021 Summary of Closed Trades Image
Highlights Global shortages of medical equipment – including medicines – are frontloaded until emergency production kicks in. As the crisis abates, political recriminations between the US and China will surge. The US will seek to minimize medical supply exposure to China going forward, a boon for India and Mexico. China has escaped the COVID-19 crisis with minimal impact on food supply. Pork prices are surging due to African Swine Flu, but meat is a luxury. Still, the “Misery Index” is spiking and this will increase social instability. Food insecurity, inflation, and large current account deficits suggest that emerging market currencies will remain under pressure. Turkey and South Africa stand to suffer while we remain overweight Malaysia. Feature Chart 1Collapse In Economic Activity Collapse In Economic Activity Collapse In Economic Activity With a third of the world population under some form of lockdown, general activity in the world’s manufacturing powerhouses has collapsed (Chart 1). The breakdown is a double whammy on market fundamentals. On the supply side, government-mandated containment efforts force workers in non-essential services to stay home while, on the demand side, households confined to their homes are unable to spend. Acute demand for medical supplies is causing shortages, while supply disruptions threaten states that lack food security. While global monetary and fiscal stimulus will soften the blow (Chart 2), the economic shock is estimated to be a 2% contraction in real GDP for every month of strict isolation. If measures are extended beyond April, markets will sell and new stimulus will be applied. Already the US Congress is negotiating the $1-$2 trillion infrastructure package that we discussed in our March 4 report, and cash handouts will be ongoing. When the dust settles the political fallout will be massive. Authoritarian states like China and especially Iran will face greater challenges maintaining domestic stability. Democracies like Italy and the US, which lead the COVID-19 case count, are the most likely to experience a change in leadership (Chart 3). Initially the ruling parties of the democracies are receiving a bump in opinion polling, but this will fade as households will be worse off and will likely vent their grievances at the ballot box. Chart 2 Chart 3 Until a vaccine or treatment is discovered, medical equipment and social distancing are the only weapons against the pandemic. National production is (rightly) being redirected from clothing and cars to masks and ventilators to meet the spike in demand. Will the supply shock cause shortages in food and medicine – essential goods for humankind? In this report we address the impact of COVID-19 on global supply security and assess the market implications. Medical Equipment Shortages Will Spur Protectionism Chart Policymakers are fighting today’s crisis with the tools of the 2008 crisis, but a lasting rebound in financial markets will depend on surmounting the pandemic, which is prerequisite to economic recovery (Table 1). As the US faces the peak of its COVID-19 outbreak, public health officials and doctors are raising the alarm on the shortage of medical supplies. A recent US Conference of Mayors survey reveals that out of the 38% of mayors who say they have received supplies from their state, 84.6% say they are inadequate (Chart 4). Italy serves as a warning: A reported 8% of the COVID-19 cases there are doctors and health professionals, often treating patients without gloves or with compromised protective gear. These workers are irreplaceable and when they succumb the virus cannot be contained. In the US, doctors and nurses are re-using masks and sometimes treating patients behind a mere curtain, highlighting the supply shortage. While the shortages are mainly driven by a surge in demand from both medical institutions and households, they also come from the supply side, particularly China. Factory closures and transportation disruptions in China earlier this year, coupled with Beijing’s government-mandated export curbs, reduced Chinese exports, a major source of US and global supplies (Chart 5). Chart 4 Chart 5 Other countries have imposed restrictions on exports of products used in combating the spread of COVID-19. Following export restrictions by the French, German, and Czech governments in early March, the European Commission intervened on March 15 to ensure intra-EU trade. It also restricted exports of protective medical gear outside of the EU. At least 54 nations have imposed new export restrictions on medical supplies since the beginning of the year.1 Both European and Chinese measures will reduce supplies in the US, the top destination for most of these halted exports (Chart 6). Chart 6 Thus it is no wonder that the Trump administration has rushed to cut import duties and boost domestic production. The administration has released strategic stockpiles and cut tariffs on Chinese medical equipment used to treat COVID-19. With the whole nation mobilized, supply kinks should improve greatly in April. After a debacle in rolling out test kits (Chart 7), the US is rapidly increasing its testing capabilities to manage the crisis, with over a million tests completed as of the end of March (Chart 8). Meanwhile a coalition of companies is taking shape to make face masks. The president has invoked the defense production act to force companies to make ventilators. Chart 7 Chart 8 However, with the pandemic peaking in the US, the hardest-hit regions will continue experiencing shortages in the near term. Shortages are prompting public outcry against the US government for its failure to anticipate and redress supply chain vulnerabilities that were well known and warned against. A report in The New York Times tells how Mike Bowen, owner of Texas-based mask-maker Prestige Ameritech, has advised the past three presidents about the danger in the fact that the US imports 95% of its surgical masks. “Aside from sitting in front of the White House and lighting myself on fire, I feel like I’ve done everything I can,” he said. He is currently inundated with emergency orders from US hospitals. The same report tells of a company called Strong Manufacturers in North Carolina that had to cut production of masks because it depends on raw materials from Wuhan, China, where the virus originated.2 The Trump administration will suffer the initial public uproar, but the US government will also seek to reduce import dependency going forward, and it will likely deflect some of the blame by focusing on the supply risks posed by China. Beijing, for its part, is launching a propaganda campaign against the US to distract from its own failures at home (some officials have even blamed the US for the virus). Meanwhile it is cranking up production and shipping medical supplies to crisis hit areas like Italy to try to repair its global image after having given rise to the virus. In addition, the city of Shenzhen is sending 1.2 million N95 masks to the US on the New England Patriots’ team plane. Even Russia is sending small donations. But these moves work to propagandistic efforts in these countries and will ultimately shame the Americans into taking measures to improve self-sufficiency. Bottom Line: The most important supply shortage amid the global pandemic is that of medical equipment. While these shortages will abate sooner rather than later, the supply chain vulnerabilities they have exposed will trigger new policies of supply redundancy and import substitution. The US in particular will seek to reduce dependency on China. That COVID-19 is aggravating rather than reducing tensions between these states, despite China’s role as a key supplier in a time of need, highlights the secular nature of their rising tensions. The US-China Drug War Shortages of pharmaceuticals are also occurring, despite the fact that the primary pandemic response is necessarily “non-pharmaceutical” (e.g. social distancing). The US Food and Drug Administration (FDA) announced the first COVID-19 related drug shortage in the US on February 27. While the specific drug was not disclosed, the announcement notes that “the shortage is due to an issue with manufacturing of an active pharmaceutical ingredient used in the drug.”3 The FDA is monitoring 20 other (non-critical) drugs potentially at risk of shortages because the sole source is China. The global spread of the pandemic will increase these shortages. On March 3 India announced export restrictions on 26 drugs, including paracetamol and several antibiotics, due to supply disruptions caused by the Chinese shutdown. While Chinese economic activity has since picked up, India is now among the string of countries under a nationwide lockdown. Similar measures enforced across Europe will also hamper the production and transportation of these goods. The implication is that even if Chinese drugs return to market, supplies further down the chain and from alternative suppliers will take a hit. The risk that this will evolve into a drug shortage depends on the intensity of the outbreak. Drug companies generally hold 3-6 months’ worth of inventories. Consequently, while inventories are likely to draw as supplies are disrupted, consumers may not experience an outright shortage immediately. In the US, as with equipment and protective gear, the government’s strategic stockpile will buffer against shortfalls in supplies of critical drugs. COVID-19 is aggravating rather than reducing US-China tensions. Nevertheless the supply chain is getting caught up in the larger US-China strategic conflict. Even before the pandemic, the US-China trade war brought attention to the US’s vulnerabilities to China’s drug exports. This dispute is not limited to illicit drugs, as with China’s production of the opioid fentanyl, but also extends to mainstream medicines, as highlighted in the selection of public statements shown in Table 2. Chart Chart 9 How much does the US rely on China for medicine? According to FDA data, just over half of manufacturing facilities producing regulated drugs in finished dosage form for the US market are located abroad, with China’s share at 7% (Chart 9).4 The figures are higher for manufacturing facilities producing active pharmaceutical ingredients, though still not alarming – 72% of the facilities are located abroad, with 13% in China. Of course, high-level data understate China’s influence. The complex nature of global drug supply chains means that the source of finished dosage forms masks dependencies and dominance higher up the supply chain (Figure 1). Chart For instance, active pharmaceutical ingredients produced in Chinese facilities are used as intermediate goods by finished dosage facilities in India as well as China. The FDA reports that Indian finished dosage facilities rely on China for three-quarters of the active ingredients in their generic drug formulations, which are then exported to the US and the rest of the world. Any supply disruption in China – or any other major drug producer – will lead to shortages further down the supply chain. Chart 10 Chinese influence becomes more apparent when the sample is restricted to generic prescription drugs. These are especially relevant because nearly 70% of Americans are on at least one prescription drug, of which more than 90% are dispensed in the generic form. In this case, 87% of ingredient manufacturers and 60% of finished dosage manufacturers are located outside the US, with 17% of ingredient facilities and 8% of dosage facilities in China (Chart 10). Of all the facilities that manufacture active ingredients that are listed on the World Health Organization’s Essential Medicines List – a compilation of drugs that are considered critical to the health system – 71% are located aboard with 15% located in China (Chart 11). Moreover, manufacturers are relatively inflexible when adapting to market conditions and shortages. Drug manufacturing facilities generally operate at above 80% of their capacity and are thus left with little immediate capacity to ramp up production in reaction to shortages elsewhere. In addition, manufacturers face challenges in changing ingredient suppliers – there is no centralized source of information on them, and additional FDA approvals are required. The US will look to reduce its dependency on China for its drug supplies regardless of 2020 election outcome. China also has overwhelming dominance in specific categories. The Council on Foreign Relations reports that China makes up 97% of the US antibiotics market.5 Other common drugs that are highly dependent on China for supplies include ibuprofen, acetaminophen, hydrocortisone, penicillin, and heparin (Chart 12). Chart 11 Chart 12 Taking it all together, US vulnerability can be overstated. Consider the following: Of the 370 drugs on the Essential Medicines List that are marketed in the US, only three are produced solely in China. None of these three are used to treat top ten causes of death in the United States. Import substitution is uneconomical. Foreign companies, especially Chinese companies, are attractive due to their lower costs and lax regulations. While China’s influence extends higher up the supply chain, this is true for US markets as well as other consumer markets. While China can cut off the US from the finished dosages it supplies, it cannot do the same for the ingredients that are used by facilities in other countries and eventually make their way to the US in finished dosage form. Americans are demanding that drug prices be reduced and an obvious solution is looser controls on imports. The recent activation of the Defense Production Act shows that the US can take action to boost domestic production in emergencies. Nevertheless, China is growing conspicuous to the American public due to general trade tensions and COVID-19. As it moves up the value chain, it also threatens increasing competition for the US and its allies. Hence the US government will have a strategic reason to cap China’s influence that is also supported by corporate interests and popular opinion. This will lead to tense trade negotiations with China and meanwhile the US will seek alternative suppliers. China will not want to lose market share or leverage over the United States, so it may offer trade concessions at some point to keep the US engaged. Ultimately, however, strategic tensions will catalyze US policy moves to reduce the cost differential with China and promote its rivals. Pressure on China over its currency, regulatory standards, and scientific-technological acquisition will continue regardless of which party wins the White House in 2020. The Democrats would increase focus on China’s transparency and adherence to international standards, including labor and environmental standards. Both Republicans and Democrats will try to boost trade with allies. The key beneficiaries will be India, Southeast Asia, and the Americas. Taiwan’s importance will grow as a middle-man, but so will its vulnerability to strategic tensions. Bottom Line: The US and the rest of the world are suffering shortfalls of equipment necessary to combat COVID-19. There is also a risk of drug shortages stemming from supply disruptions and emergency protectionist policies. These shortages look to be manageable, but they have exposed national vulnerabilities that will be reduced in future via interventionist trade policies. While the US and Europe will ultimately manage the outbreak, the political fallout will be immense. The US will look to reduce its dependency on China. This will increase investment in non-China producers of active pharmaceutical ingredients, such as India and Mexico. The US tactics against China will vary according to the election result, but the strategic direction of diversifying away from China is clear and will have popular impetus in the wake of COVID-19. Food Security In addition to the challenges posed by COVID-19 on medical supplies, food – another essential good – also faces risk of shortages. China is a case in point. Food prices there were on the rise well before the COVID-19 outbreak, averaging 17.3% in the final quarter of 2019. However inflation was limited to pork and its substitutes – beef, lamb and poultry – and reflected a reduction in pork supplies on the back of the African Swine Flu outbreak. While year-on-year increases in the prices of pork and beef averaged 102.8% and 21.0%, respectively, grain, fresh vegetable, and fresh fruit prices averaged 0.6%, 1.5%, and -5.0% in Q42019 (Chart 13). Chart 13Chinese Inflation Has (Thus far) Been Contained To Pork Chinese Inflation Has (Thus far) Been Contained To Pork Chinese Inflation Has (Thus far) Been Contained To Pork Chart 14China's Misery Index Is Spiking - A Political Liability China's Misery Index Is Spiking - A Political Liability China's Misery Index Is Spiking - A Political Liability However China’s COVID-19 containment measures had a more broad-based impact on food supplies, threatening to push up China’s Misery Index (Chart 14). Travel restrictions, roadblocks, quarantined farm laborers, and risk-averse truck drivers introduced challenges not only in ensuring supplies were delivered to consumers, but also to daily farm activity and planting. The absence of farm inputs needed for planting such as seeds and fertilizer, and animal feed for livestock, was especially damaging in regions hardest hit by the pandemic. Livestock farmers already struggling with swine flu-related reductions in herd sizes were forced to prematurely cull starving animals, cutting the stock of chicken and hogs. Now as the country transitions out of its COVID-19 containment phase and moves toward normalizing activity (Chart 15), food security is top of the mind. Authorities are emphasizing the need to ensure sufficient food supplies and adopt policies to encourage production.6 This is especially important for crops due to be planted in the spring. Delayed or reduced plantings would weight on the quality and quantity of the crops, pushing prices up. Chart 15 With food estimated to account for 19.9% of China’s CPI basket – 12.8% of which goes towards pork (Chart 16) – a prolonged food shortage, or a full-blown food crisis, would be extremely damaging to Chinese families and their pocketbooks. Chart 16 However, apart from soybeans and to a lesser extent livestock, China’s inventories are well stocked (Chart 17) and are significantly higher than levels amid the 2006-2008 and 2010-2012 food crises. Inventories have been built up specifically to provide ammunition precisely in times of crisis. Corn and rice stocks are capable of covering consumption for nearly three quarters of a year, and wheat stocks exceeding a year’s worth of consumption. Thus, while not completely immune, China today is better able to weather a supply shock. Moreover, with the exception of soybeans, China is not overly dependent on imports for agricultural supplies (Chart 18). Chart 17   Chart 18 As the COVID-19 epicenter shifts to the US and Europe, farmers there are beginning to face the same challenges. Reports of delays in the arrival of shipments of inputs such as fertilizer and seeds have prompted American farmers to prepare for the worst and order these goods ahead of time. Chart 19 While these proactive measures will help reduce risks to supply, farmers in Europe and parts of the US who typically rely on migrant laborers will need to search for alternative laborers as the planting season nears. Just last week France’s agriculture minister asked hairdressers, waiters, florists, and others that find themselves unemployed to take up work in farms to ensure food security. As countries become increasingly aware of the risks to food supplies, some have already introduced protectionist measures, especially in the former Soviet Union: The Russian agriculture ministry proposed setting up a quota for Russian grain exports and has already announced that it is suspending exports of processed grains from March 20 for 10 days. Kazakhstan suspended exports of several agricultural goods including wheat flour and sugar until at least April 15. On March 27, Ukraine’s economy ministry announced that it was monitoring wheat export and would take measures necessary to ensure domestic supplies are adequate. Vietnam temporarily suspended rice contracts until March 28 as it checked if it had sufficient domestic supplies. The challenge is that, unlike China, inventories in the rest of the world are not any higher than during the previous food crisis and do not provide much of a buffer against supply shortfalls (Chart 19). Higher food prices would be especially painful to lower income countries where food makes up a larger share of household spending (Chart 20). In addition to using their strategic food stockpiles, governments will attempt to mitigate the impact of higher food prices by implementing a slew of policies: Chart 20 Trade policies: Producing countries will want to protect domestic supplies by restricting exports – either through complete bans or export quotas. Importing countries will attempt to reduce the burden of higher prices on consumers by cutting tariffs on the affected goods. Consumer-oriented policies: Importing countries will provide direct support to consumers in the form of food subsidies, social safety nets, tax reductions, and price controls. Producer-oriented policies: Governments will provide support to farmers to encourage greater production using measures such as input subsidies, producer price support, or tax exemptions on goods used in production. While these policies will help alleviate the pressure on consumers, they also result in greater government expenditures and lower revenues. Thus, subsidizing the import bill of a food price shock can weigh on public finances, debt levels, and FX reserves. Currencies already facing pressure due to the recessionary environment, such as Turkey, South Africa and Chile will come under even greater downward pressure. Food inventories ex-China are insufficient to protect against supply shortages. Bottom Line: COVID-19’s logistical disruptions are challenging farm output. This is especially true when transporting goods and individuals across borders rather than within countries. This will be especially challenging for food importing countries, as some producers have already started erecting protectionist measures and this will result in an added burden on government budgets that are already extended in efforts to contain the economic repercussions of the pandemic. Investment Implications Chart 21Ag Prices Inversely Correlated With USD Ag Prices Inversely Correlated With USD Ag Prices Inversely Correlated With USD China will continue trying to maximize its market share and move up the value chain in drug production. At the same time, the US is likely to diversify away from China and try to cap China’s market share. This will result in tense trade negotiations regardless of the outcome of the US election. The COVID-19 experience with medical shortages and newfound public awareness of potential medical supply chain vulnerabilities means that another round of the trade war is likely. Stay long USD-CNY. Regarding agriculture, demand for agricultural commodities is relatively inelastic. This inelasticity should prevent a complete collapse in prices even amid a weak demand environment. Thus given the risk on supplies, prices face upward pressure. However, not all crops are facing these same market dynamics. While wheat and rice prices have started to move in line with the dynamics described above, soybeans and to a greater extent corn prices have not reacted as such (Chart 21). In the case of soybeans, we expect demand to be relatively muted. China accounts for a third of the world’s soybean consumption. 80% of Chinese soybeans are crushed to produce meal to feed China’s massive pork industry. However, the 21% y/y decline in pork output in 2019 on the back of the African Swine Flu outbreak will weigh on demand and mute upward pressures on supplies. Demand for corn will also likely come in weak. The COVID-19 containment measures and the resulting halt in economic activity reduce demand for gasoline and, as a consequence, reduce demand for corn-based ethanol, which is blended with gasoline. In addition to the above fundamentals, ag prices have been weighed down by a strong USD which makes ex-US exporters relatively better off, incentivizing them to raise exports and increase global supplies. A weaker USD – which we do not see in the near term – would help support ag prices. It is worth noting that if there is broad enforcement of protectionist measures, then producers will not be able to benefit from a stronger dollar. In that case we may witness a breakdown in the relationship between ag prices and the dollar. In light of these supply/demand dynamics, we expect rice and wheat prices to be well supported going forward and to outperform corn and soybeans.   Roukaya Ibrahim Editor/Strategist Geopolitical Strategy RoukayaI@bcaresearch.com   Matt Gertken Vice President Geopolitical Strategist mattg@bcaresearch.com   Footnotes 1 See "Tackling COVID-19 Together: The Trade Policy Dimension," Global Trade Alert, University of St. Gallen, Switzerland, March 23, 2020. 2 See Rachel Abrams et al, "Governments and Companies Race to Make Masks Vital to Virus Fight," The New York Times, March 21, 2020. 3 The announcement also notes that there are other alternatives that can be used by patients. See "Coronavirus (COVID-19) Supply Chain Update," US FDA, February 27, 2020. 4 All regulated drugs include prescription (brand and generic), over the counter, and compounded drugs. 5 Please see Huang, Yanzhong, "The Coronavirus Outbreak Could Disrupt The US Drug Supply," Council on Foreign Relations, March 5, 2020. 6 The central government ordered local authorities to allow animal feed to pass through checkpoints amid the lockdowns. In addition, Beijing has relaxed import restrictions by lifting a ban on US poultry products and announcing that importers could apply for waivers on goods tariffed during the trade war such as pork and soybeans. The lifting of these restrictions also serves to help China meet its phase one trade deal commitments. Please see "Coronavirus hits China’s farms and food supply chain, with further spike in meat prices ahead," South China Morning Post, dated February 21, 2020.
Highlights Given that rising crop yields have been the main vehicle through which global supply of agricultural commodities grew to meet expanding demand, the risks posed to yields due to climate change are non-trivial. The impact of climate change will manifest itself in the form of two simultaneous trends: the gradual rise in temperatures alongside more frequent and severe weather events. While the latter will threaten immediate supply, the former is a slower moving process, and its net negative impact is unlikely to manifest before 2030. The implications of climate change on agriculture producers are non-uniform. Low-latitude countries with economies that are highly dependent on the agriculture sector will suffer most. Expect greater volatility in agriculture prices as the frequency of weather events will raise uncertainty. Feature The steady expansion of global population and rising per-capita calorie consumption has directly translated to growing demand for agricultural products of all types. However, these demand-side pressures increasingly will be met with disruptions to global supply of agricultural commodities, as the impact of climate change raises uncertainty. In any given year, the aggregate decisions of farmers all over the world – i.e., the choice of which crops to plant and how much acreage to dedicate to each crop – determine the supply and market prices of ags. In this competitive market, each farmer attempts to maximize his or her welfare by planting the crops that are expected to yield the greatest profit. Chart 12010/11 Shock Highlights Ag Vulnerability To Weather 2010/11 Shock Highlights Ag Vulnerability To Weather 2010/11 Shock Highlights Ag Vulnerability To Weather The collective action of these producers in reaction to perceived demand generally leads to stable prices, especially for staple commodities such as grains and oilseeds, which differ from industrial commodities in that they are not highly correlated with global business cycles. Demand trends are long-term and slow moving, and typically do not result in abrupt price pressures, as farmers have time to adjust and adapt to changing consumer preferences. Unforeseen, weather-induced supply-side shocks, therefore, are the main source of sudden price changes in ag markets. Such a shock was dramatically on display during the drought-induced crop failures in major grain and cereal producing regions in the most recent global food crisis of 2010/11. While this massive supply shock was not the first of its kind (Chart 1, on page 1), it highlighted the vulnerability of ag markets to weather risks and specifically the evolving environment under climate change. A 2019 study quantifies the impact of shifting weather patterns on the agricultural market, finding that year-to-year changes in climate factors during the growing season explain 20%-49% of change in corn, rice, soybean, and wheat yields, with climate extremes accounting for 18%-43% of this variation.1 In theory, the impact can manifest in several ways, sometimes contradictory: Extreme weather events: An increase in the frequency and intensity of droughts or floods which threaten to wipe out crops or reduce yields, creating unpredictable supply shocks. The gradual rise in temperature: Each crop has cardinal temperatures – defined by the minimum, maximum and optimum – that determine its boundaries for growth. Increases in temperatures induced by global warming may push the boundary, reducing yields in some regions. Changes in precipitation patterns: In many areas precipitation is projected to increase – both in short bursts and over longer periods. This will lead to greater soil erosion resulting in deterioration in the quality of soil. In other regions, precipitation will decrease, and drought is expected to become more frequent.2 Moreover, the interaction of these factors – along with other region-specific variables – will amplify the impact on crops: Rising temperatures and greater precipitation will result in greater amounts of water in the atmosphere, producing increased water vapor and greater cloud cover. This will reduce solar radiation, and will harm crop productivity. Elevated atmospheric carbon dioxide and CO2 fertilization: Greater CO2 concentrations brought on by continued growth in air pollution are positive for crops as they stimulate photosynthesis and plant growth. However, the impact differs across crops with plants such as soybeans, rice and wheat set to benefit relatively more than plants such as corn.3 Moreover, elevated atmospheric CO2 levels can help crops respond to environmental stresses and reduce yield losses due to ozone and crop water loss through partial stomatal closure and a reduction in ozone penetration into leaves. Temperature changes and the magnitude and intensity of precipitation impact soil moisture and surface runoff. Indirect effects of climate change – weeds, pests and pathogens – also present challenges as they require changes to management practices and may raise farming costs required. The impact of climate change on agriculture markets is already evident in increasing intensity and frequency of extreme weather events. The confluence of these factors, and the region- and crop-specific nature of these variables, makes it impossible to estimate the impact of evolving climate conditions on ag products with great accuracy. Nevertheless, our research suggests that the impact of climate change on ag markets will create opportunities in this evolving and highly uncertain market. Abrupt Shocks Amid Gradual Warming: The Long And Short View The impact of climate change on agriculture markets is already evident in the increasing intensity and frequency of extreme-weather events such as heatwaves, floods, and droughts. Charts 2A, 2B, and 2C, illustrate the impact of major weather events in crop-producing regions of the U.S. on yields, production and acreage for the crop year in which the events took place. Chart 2AExtreme Weather Events Reduce U.S. Corn Supplies … Extreme Weather Events Reduce U.S. Corn Supplies Extreme Weather Events Reduce U.S. Corn Supplies Chart 2B… Soybean Supplies … Extreme Weather Events Reduce U.S. Soybean Supplies Extreme Weather Events Reduce U.S. Soybean Supplies Chart 2C… And Wheat Supplies In A Big Way Extreme Weather Events Reduce U.S. Wheat Supplies In A Big Way Extreme Weather Events Reduce U.S. Wheat Supplies In A Big Way Chart 3Climate-Induced U.S. Supply Shocks Associated With Price Spikes Climate-Induced U.S. Supply Shocks Associated With Price Spikes Climate-Induced U.S. Supply Shocks Associated With Price Spikes   While the individual losses are a function of the magnitude of the event, the events highlighted translate to a 16%, 10%, and 7% decline in corn, soybean, and wheat yields, respectively. These supply disruptions generally do not extend beyond the event year, as the new crop year offers farmers a clean slate to raise output and maximize profits. Given that the U.S. is a major global supplier of these crops, extreme weather events and the subsequent supply reductions lead to non-negligible price pressures (Chart 3). While crop conditions thus far have failed to deteriorate in trend (Chart 4), greater frequency and intensity of weather events raise the probability of a decline in overall crop and could lower supply.   Chart 4Crop Conditions Have Generally Held Up Climate Change Special Series: An Introduction Climate Change Special Series: An Introduction Expanding the analysis to other major crop-producing regions of the world, we find that once again, extreme-weather events are associated with a decline in yields and production in the corresponding crop year (Chart 5). This exercise also indicates that the impact of droughts is significantly more pronounced than the impact of floods.4 While the weather-induced supply shocks described above are unpredictable, abrupt, and have an immediate impact on output and prices, the gradual warming of temperatures is a slow-moving process. Consequently, the impact will manifest in the form of gradual changes that are difficult to capture and quantify, especially given the mitigating effect of CO2 fertilization – i.e., higher yields resulting from higher CO2 in the atmosphere. Nonetheless, rising temperatures will become a serious risk in crop-planting regions both in the U.S. and globally (Chart 6). While rising temperatures are expected to bring about increasingly more wide-ranging supply disruptions (Chart 7), the net impact over the coming decade is not a clear negative. Chart 5Weather Events, Especially Droughts, Hurt Global Supplies Climate Change Special Series: An Introduction Climate Change Special Series: An Introduction Chart 6Rising Global Temperatures Will Pose A Serious Risk … Climate Change Special Series: An Introduction Climate Change Special Series: An Introduction Chart 7… Especially Above The 2°C Mark Climate Change Special Series: An Introduction Climate Change Special Series: An Introduction One study expects the positive impact of CO2 fertilization on yields to overwhelm the negative effect of rising temperatures over the coming decade (Table 1). Elsewhere, studies forecast different responses, with some predicting incremental yield gains over the coming decade before temperatures rise to levels that overwhelm the benefits of greater CO2. Similarly, according to the FAO’s assessment, the net negative impact of climate change on global crop yields will only become apparent with a high degree of certainty post-2030.5 Table 1Estimates For The Response Of Global Average Crop Yields To Warming And CO2 Changes Over The Next Decades Climate Change Special Series: An Introduction Climate Change Special Series: An Introduction Bottom Line: Given that rising crop yields have been the main vehicle through which global ag supply grew to meet expanding demand, the risks posed to yields due to climate change are non-trivial. Supply disruptions generally do not extend beyond the event year, as the new crop year offers farmers a clean slate to raise output and maximize profits. The impact will manifest itself in the form of two simultaneous trends: the gradual rise in temperatures alongside more frequent and severe weather events. While the latter will threaten immediate supply, the former is a slower moving process, and its net negative impact is unlikely to manifest before 2030. The Winners … And Losers Rising temperatures are expected to result in a negligible impact on ag markets over the coming decade; yet this finding is not uniform across all regions. The FAO study cited above finds that by 2030, the projected impact on crop yields will be slightly net negative in developing countries. However, in developed countries, the effect will be net positive. In terms of global supply, the impact of climate change over the coming decade is expected to remain relatively contained, affecting certain regions at various times without causing major global disruptions. That said, as global warming and extreme weather persist, the ramifications will begin to extend beyond individual regions, and will cause supply shocks on a global scale. In part, this can be explained by a greater potential for net reductions in crop yields in warmer, low-latitude areas and semi-arid regions of the world.6 This non-uniform impact will create relative winners and losers. Producers located in temperate regions – where climate change does not yet pose as serious a threat – are set to profit from their increased role in global supply. Conversely, tropical regions are much more vulnerable to climate change. This is especially true for those whose economies are highly dependent on agriculture (Chart 8). Chart 8Agricultural Economies In Tropical Regions Are Most Vulnerable Climate Change Special Series: An Introduction Climate Change Special Series: An Introduction On net, the overall economies of DM countries – which generally are not economically dependent on agriculture and are located in northern regions – will be relatively more insulated from the impact of climate change on the agriculture sector. Aside from the impact on producers, the implications on consumers are also region-dependent. Clearly the direct impact of climate change on global agriculture will be higher food prices, which directly impacts the food component of inflation generally. As a result, consumers who spend a large share of their income to food – generally consumers in lower income countries – will be hardest hit (Chart 9). Chart 9Higher Food Prices Disproportionately Hurt Consumers In Lower Income Countries Climate Change Special Series: An Introduction Climate Change Special Series: An Introduction In theory, a food supply shock is transitory, and given that food is usually excluded from core inflation gauges targeted by central banks, monetary policy should not react to these price spikes. All the same, aside from this direct impact on inflation, food inflation can also pass-through into other components of the CPI basket, for example through wage pressures or inflation expectations. This would lead to a more persistent impact on core inflation, forcing policy makers to react to these transitory forces, complicating the monetary policy response function for these countries. Given that inflation expectations are less well-anchored in lower income economies and that food makes up a larger share of consumption expenditures in these economies, they are most vulnerable to weather-induced food shocks. Chart 10Subsidies Partially Insulate Against International Shocks Climate Change Special Series: An Introduction Climate Change Special Series: An Introduction In countries where food prices are highly subsidized, the impact of higher global food prices will not immediately translate to higher domestic prices. This explains why there is no one-to-one relationship between global food prices and domestic food prices (Chart 10). Instead, the higher prices are absorbed by the governments, resulting in an expansion in government expenditures. This distorts the local food market, as it prevents demand from adjusting to the higher prices, and could potentially result in an undershoot in inventories that makes global markets even more vulnerable to further supply shocks. Bottom Line: The implications of climate change on ag producers are non-uniform. While higher-latitude regions are set to benefit, at least in the short-run, low-latitude countries with economies that are highly dependent on the agriculture sector will suffer most. On the consumer side, individuals who spend a large share of their income on food are set to suffer most. While consumers in countries that subsidize the crops will be protected from the immediate inflation risk, they may feel a delayed impact due to an increase in budget expenditures needed to cover the larger import bill. Mitigation Efforts While the potential impact of climate change on the agriculture sector can be large, it will be at least partially managed through adoption of mitigation policies (Diagram 1). Diagram 1Adaptation Reduces Vulnerability Climate Change Special Series: An Introduction Climate Change Special Series: An Introduction A key question in determining the extent of this behavior is whether warming temperatures and the increased occurrence and intensity of extreme events will be sufficient to justify a major acceleration of investment in agriculture. These efforts would range from simple management changes on the part of farmers to technological advances that raise the productivity of farming or reduce the vulnerability of farmers to climate change. For example, farmers across the U.S. have been planting corn and soybeans earlier in the spring, resulting in an advancement in planting dates (Chart 11). The earlier planting has also been accompanied by a longer growing season with the average number of days in the season increasing. Farmers are also adapting by altering their decisions on which crops to plant. For example, since soybean and corn are planted in many of the same regions of the U.S., farmers often plant more soybeans than corn when experiencing weather shocks. Chart 11Weather Events, Especially Droughts, Hurt Global Supplies Climate Change Special Series: An Introduction Climate Change Special Series: An Introduction The agriculture sector is also using more efficient machinery that can plant and harvest crops much faster as well as developing heartier seeds and more potent fertilizers. In turn, farmers will alter their decision making by selecting crop varieties or species that are more resistant to heat and drought. Or they will change fertilizer rates, amounts and timing of irrigation, along with other water-management techniques. Farmers also are making wider use of integrated pest and pathogen management techniques, in order to raise the effectiveness of pest, disease, and weed control. Given that the number of firms in the agriculture sector are fewer in developed markets than in the rest of the world, management decisions can be more easily implemented in the former. Farmers across the U.S. have been planting corn and soybeans earlier in the spring, resulting in an advancement in planting dates. On the other hand, emerging market countries where ag output is driven by numerous individual farmers will have a more difficult time implementing policies. Individual farms may not have the means to support themselves, which raises the potential impact of climate change. What is more, climate-change mitigation efforts may require projects, programs, or funds set aside by the government to support these efforts. This is more likely to occur in wealthier developed countries. Bottom Line: Adaptation and mitigation measures on the part of farmers have the potential to reduce the impact of climate change. That said, farmers in richer countries with the funds and institutions in place to support the ag sector likely will fare better. Investment Implications Over the coming decade, the ramifications of climate change are likely to be contained to a regional level. Although global supply will be vulnerable to regional disruptions, the impact will, in part, be mitigated by inventories, which have been rising for years. These stocks will create a buffer against unpredictable supply shocks (Chart 12). Chart 12Higher Inventories Needed To Buffer Against Unpredictable Shocks Climate Change Special Series: An Introduction Climate Change Special Series: An Introduction However, given that the global soybean market resembles an oligopoly with Brazil, the U.S., and Argentina accounting for 81% of global supply, global soybean prices will be more vulnerable to supply events in these regions than other crops (Chart 13). Chart 13Soybeans Most Vulnerable To Shocks Affecting Major Producers Climate Change Special Series: An Introduction Climate Change Special Series: An Introduction At the other end of the spectrum, global wheat markets will be relatively more insulated from isolated weather events impacting any one major producer as each of these regions contributes a relatively small share to global wheat output. This analysis also finds that yields and supply generally recover in the crop year following an extreme climate event. This implies that while the extent of damage from these events can be severe, they are not persistent unless the increasing frequency of extreme events leads to a secular change. Aside from the price impact, the weather and temperature changes will manifest in the form of greater volatility in supply, translating to greater price volatility. Options-implied volatilities for corn, wheat and soybeans have been on a general downtrend since the two major global food scares in 2007/08 and 2010/11 (Chart 14). We expect the trend to reverse going forward as the frequency of weather events will create greater price uncertainty. We summarize the findings of this report in Table 3 (Appendix, on page 16). Chart 14Volatility Will Go Up Climate Change Special Series: An Introduction Climate Change Special Series: An Introduction Roukaya Ibrahim Editor/Strategist RoukayaI@bcaresearch.com Jeremie Peloso Research Analyst JeremieP@bcaresearch.com Amr Hanafy Research Associate AmrH@bcaresearch.com Hugo Bélanger Senior Analyst HugoB@bcaresearch.com Isabelle Dimyadi Research Associate Isabelled@bcaresearch.com Appendix Table 2Extreme Weather Events In The U.S. Climate Change Special Series: An Introduction Climate Change Special Series: An Introduction Table 3Summary Table Climate Change Special Series: An Introduction Climate Change Special Series: An Introduction Footnotes 1 Please see Vogel et al, The effects of climate extremes on global agricultural yields, Environ. Res. Lett 14 054010, 2019. 2 As a consequence of greenhouse gas emissions precipitation is expected to increase in high altitude regions such as much of the U.S. and decrease in subtropical regions such as the southwest U.S., Central America, southern Africa, and the Mediterranean basin. 3 Plants can be broken down into either C3 or C4 based on the way they assimilate atmospheric CO2 into different physiological components. While rising CO2 causes C3 plants to raise the rate of photosynthesis and reduce the respiration rate, C4 plants do not experience a rise in photosynthesis since  photosynthesis is already saturated. For example, studies show that soybean yields increased 12%-15% under 550 ppm vs. 370 ppm CO2 concentrations while corn experienced negligible yield increases. 4 Please see Lesk C., P. Rowhani, and N. Ramankutty, Influence of extreme weather disasters on global crop production, Nature, 529(7584), 84-87, 2016. 5 Please see The State Of Food And Agriculture: Climate Change, Agriculture, And Food Security, Food and Agriculture Organization of the United Nations, 2016. 6 Please see Stevanovic et al., The impact of high-end climate change on agricultural welfare, Sci-Adv 2(8), 2016.
The steady expansion of global population and rising per-capita calorie consumption has directly translated to growing demand for agricultural products of all types. However, these demand-side pressures increasingly will be met with disruptions to global supply of agricultural commodities, as the impact of climate change raises uncertainty. In any given year, the aggregate decisions of farmers all over the world – i.e., the choice of which crops to plant and how much acreage to dedicate to each crop – determine the supply and market prices of ags. In this competitive market, each farmer attempts to maximize his or her welfare by planting the crops that are expected to yield the greatest profit. The collective action of these producers in reaction to perceived demand generally leads to stable prices, especially for staple commodities such as grains and oilseeds, which differ from industrial commodities in that they are not highly correlated with global business cycles. Demand trends are long-term and slow moving, and typically do not result in abrupt price pressures, as farmers have time to adjust and adapt to changing consumer preferences. Unforeseen, weather-induced supply-side shocks, therefore, are the main source of sudden price changes in ag markets. Such a shock was dramatically on display during the drought-induced crop failures in major grain and cereal producing regions in the most recent global food crisis of 2010/11. While this massive supply shock was not the first of its kind (Chart 1), it highlighted the vulnerability of ag markets to weather risks and specifically the evolving environment under climate change. A 2019 study quantifies the impact of shifting weather patterns on the agricultural market, finding that year-to-year changes in climate factors during the growing season explain 20%-49% of change in corn, rice, soybean, and wheat yields, with climate extremes accounting for 18%-43% of this variation.1 In theory, the impact can manifest in several ways, sometimes contradictory: Chart 12010/11 Shock Highlights Ag Vulnerability To Weather 2010/11 Shock Highlights Ag Vulnerability To Weather 2010/11 Shock Highlights Ag Vulnerability To Weather Extreme weather events: An increase in the frequency and intensity of droughts or floods which threaten to wipe out crops or reduce yields, creating unpredictable supply shocks. The gradual rise in temperature: Each crop has cardinal temperatures – defined by the minimum, maximum and optimum – that determine its boundaries for growth. Increases in temperatures induced by global warming may push the boundary, reducing yields in some regions. Changes in precipitation patterns: In many areas precipitation is projected to increase – both in short bursts and over longer periods. This will lead to greater soil erosion resulting in deterioration in the quality of soil. In other regions, precipitation will decrease, and drought is expected to become more frequent.2 Moreover, the interaction of these factors – along with other region-specific variables – will amplify the impact on crops: Rising temperatures and greater precipitation will result in greater amounts of water in the atmosphere, producing increased water vapor and greater cloud cover. This will reduce solar radiation, and will harm crop productivity. Elevated atmospheric carbon dioxide and CO2 fertilization: Greater CO2 concentrations brought on by continued growth in air pollution are positive for crops as they stimulate photosynthesis and plant growth. However, the impact differs across crops with plants such as soybeans, rice and wheat set to benefit relatively more than plants such as corn.3 Moreover, elevated atmospheric CO2 levels can help crops respond to environmental stresses and reduce yield losses due to ozone and crop water loss through partial stomatal closure and a reduction in ozone penetration into leaves. Temperature changes and the magnitude and intensity of precipitation impact soil moisture and surface runoff. Indirect effects of climate change – weeds, pests and pathogens – also present challenges as they require changes to management practices and may raise farming costs required. The confluence of these factors, and the region- and crop-specific nature of these variables, makes it impossible to estimate the impact of evolving climate conditions on ag products with great accuracy. Nevertheless, our research suggests that the impact of climate change on ag markets will create opportunities in this evolving and highly uncertain market. Abrupt Shocks Amid Gradual Warming: The Long And Short View The impact of climate change on agriculture markets is already evident in increasing intensity and frequency of extreme-weather events. The impact of climate change on agriculture markets is already evident in the increasing intensity and frequency of extreme-weather events such as heatwaves, floods, and droughts. Charts 2A, 2B, and 2C, illustrate the impact of major weather events in crop-producing regions of the U.S. on yields, production and acreage for the crop year in which the events took place. While the individual losses are a function of the magnitude of the event, the events highlighted translate to a 16%, 10%, and 7% decline in corn, soybean, and wheat yields, respectively. These supply disruptions generally do not extend beyond the event year, as the new crop year offers farmers a clean slate to raise output and maximize profits. Chart 2AExtreme Weather Events Reduce U.S. Corn Supplies Extreme Weather Events Reduce U.S. Corn Supplies Extreme Weather Events Reduce U.S. Corn Supplies Chart 2BExtreme Weather Events Reduce U.S. Soybean Supplies Extreme Weather Events Reduce U.S. Soybean Supplies Extreme Weather Events Reduce U.S. Soybean Supplies Chart 2CExtreme Weather Events Reduce U.S. Wheat Supplies In A Big Way Extreme Weather Events Reduce U.S. Wheat Supplies In A Big Way Extreme Weather Events Reduce U.S. Wheat Supplies In A Big Way Chart 3Climate-Induced U.S. Supply Shocks Associated With Price Spikes Climate-Induced U.S. Supply Shocks Associated With Price Spikes Climate-Induced U.S. Supply Shocks Associated With Price Spikes Given that the U.S. is a major global supplier of these crops, extreme weather events and the subsequent supply reductions lead to non-negligible price pressures (Chart 3). While crop conditions thus far have failed to deteriorate in trend (Chart 4), greater frequency and intensity of weather events raise the probability of a decline in overall crop and could lower supply. Chart 4Crop Conditions Have Generally Held Up Agriculture In The Age Of Climate Change Agriculture In The Age Of Climate Change Expanding the analysis to other major crop-producing regions of the world, we find that once again, extreme-weather events are associated with a decline in yields and production in the corresponding crop year (Chart 5). This exercise also indicates that the impact of droughts is significantly more pronounced than the impact of floods.4 The net impact of rising temperatures over the coming decade is not a clear negative. While the weather-induced supply shocks described above are unpredictable, abrupt, and have an immediate impact on output and prices, the gradual warming of temperatures is a slow-moving process. Consequently, the impact will manifest in the form of gradual changes that are difficult to capture and quantify, especially given the mitigating effect of CO2 fertilization – i.e., higher yields resulting from higher CO2 in the atmosphere. Nonetheless, rising temperatures will become a serious risk in crop-planting regions both in the U.S. and globally (Chart 6). While rising temperatures are expected to bring about increasingly more wide-ranging supply disruptions (Chart 7), the net impact over the coming decade is not a clear negative. Chart 5Weather Events, Especially Droughts, Hurt Global Supplies Agriculture In The Age Of Climate Change Agriculture In The Age Of Climate Change Chart 6Rising Global Temperatures Will Pose A Serious Risk … Agriculture In The Age Of Climate Change Agriculture In The Age Of Climate Change   One study expects the positive impact of CO2 fertilization on yields to overwhelm the negative effect of rising temperatures over the coming decade (Table 1). Elsewhere, studies forecast different responses, with some predicting incremental yield gains over the coming decade before temperatures rise to levels that overwhelm the benefits of greater CO2. Similarly, according to the FAO’s assessment, the net negative impact of climate change on global crop yields will only become apparent with a high degree of certainty post-2030.5 Chart 7… Especially Above The 2 ℃ Mark Agriculture In The Age Of Climate Change Agriculture In The Age Of Climate Change Table 1Estimates For The Response Of Global Average Crop Yields To Warming And CO2 Changes Over The Next Decades Agriculture In The Age Of Climate Change Agriculture In The Age Of Climate Change Bottom Line: Given that rising crop yields have been the main vehicle through which global ag supply grew to meet expanding demand, the risks posed to yields due to climate change are non-trivial. The impact will manifest itself in the form of two simultaneous trends: the gradual rise in temperatures alongside more frequent and severe weather events. While the latter will threaten immediate supply, the former is a slower moving process, and its net negative impact is unlikely to manifest before 2030. The Winners … And Losers Rising temperatures are expected to result in a negligible impact on ag markets over the coming decade; yet this finding is not uniform across all regions. The FAO study cited above finds that by 2030, the projected impact on crop yields will be slightly net negative in developing countries. However, in developed countries, the effect will be net positive. In terms of global supply, the impact of climate change over the coming decade is expected to remain relatively contained, affecting certain regions at various times without causing major global disruptions. That said, as global warming and extreme weather persist, the ramifications will begin to extend beyond individual regions, and will cause supply shocks on a global scale. In part, this can be explained by a greater potential for net reductions in crop yields in warmer, low-latitude areas and semi-arid regions of the world.6 This non-uniform impact will create relative winners and losers. Producers located in temperate regions – where climate change does not yet pose as serious a threat – are set to profit from their increased role in global supply. Conversely, tropical regions are much more vulnerable to climate change. This is especially true for those whose economies are highly dependent on agriculture (Chart 8). Chart 8Agricultural Economies In Tropical Regions Are Most Vulnerable Agriculture In The Age Of Climate Change Agriculture In The Age Of Climate Change On net, the overall economies of DM countries – which generally are not economically dependent on agriculture and are located in northern regions – will be relatively more insulated from the impact of climate change on the agriculture sector. Aside from the impact on producers, the implications on consumers are also region-dependent. Clearly the direct impact of climate change on global agriculture will be higher food prices, which directly impacts the food component of inflation generally. As a result, consumers who spend a large share of their income to food – generally consumers in lower income countries – will be hardest hit (Chart 9). Chart 9Higher Food Prices Disproportionately Hurt Consumers In Lower Income Countries Agriculture In The Age Of Climate Change Agriculture In The Age Of Climate Change In theory, a food supply shock is transitory, and given that food is usually excluded from core inflation gauges targeted by central banks, monetary policy should not react to these price spikes. All the same, aside from this direct impact on inflation, food inflation can also pass-through into other components of the CPI basket, for example through wage pressures or inflation expectations. This would lead to a more persistent impact on core inflation, forcing policy makers to react to these transitory forces, complicating the monetary policy response function for these countries. Given that inflation expectations are less well-anchored in lower income economies and that food makes up a larger share of consumption expenditures in these economies, they are most vulnerable to weather-induced food shocks. Individuals who spend a large share of their income on food are set to suffer most. In countries where food prices are highly subsidized, the impact of higher global food prices will not immediately translate to higher domestic prices. This explains why there is no one-to-one relationship between global food prices and domestic food prices (Chart 10). Instead, the higher prices are absorbed by the governments, resulting in an expansion in government expenditures. This distorts the local food market, as it prevents demand from adjusting to the higher prices, and could potentially result in an undershoot in inventories that makes global markets even more vulnerable to further supply shocks Chart 10Subsidies Partially Insulate Against International Shocks Agriculture In The Age Of Climate Change Agriculture In The Age Of Climate Change Bottom Line: The implications of climate change on ag producers are non-uniform. While higher-latitude regions are set to benefit, at least in the short-run, low-latitude countries with economies that are highly dependent on the agriculture sector will suffer most. On the consumer side, individuals who spend a large share of their income on food are set to suffer most. While consumers in countries that subsidize the crops will be protected from the immediate inflation risk, they may feel a delayed impact due to an increase in budget expenditures needed to cover the larger import bill. Mitigation Efforts While the potential impact of climate change on the agriculture sector can be large, it will be at least partially managed through adoption of mitigation policies (Diagram 1). Diagram 1Adaptation Reduces Vulnerability Agriculture In The Age Of Climate Change Agriculture In The Age Of Climate Change A key question in determining the extent of this behavior is whether warming temperatures and the increased occurrence and intensity of extreme events will be sufficient to justify a major acceleration of investment in agriculture. These efforts would range from simple management changes on the part of farmers to technological advances that raise the productivity of farming or reduce the vulnerability of farmers to climate change. For example, farmers across the U.S. have been planting corn and soybeans earlier in the spring, resulting in an advancement in planting dates (Chart 11). The earlier planting has also been accompanied by a longer growing season with the average number of days in the season increasing. Farmers are also adapting by altering their decisions on which crops to plant. For example, since soybean and corn are planted in many of the same regions of the U.S., farmers often plant more soybeans than corn when experiencing weather shocks. Chart 11Farmers Are Planting Earlier In The Season Agriculture In The Age Of Climate Change Agriculture In The Age Of Climate Change The agriculture sector is also using more efficient machinery that can plant and harvest crops much faster as well as developing heartier seeds and more potent fertilizers. In turn, farmers will alter their decision making by selecting crop varieties or species that are more resistant to heat and drought. Or they will change fertilizer rates, amounts and timing of irrigation, along with other water-management techniques. Farmers also are making wider use of integrated pest and pathogen management techniques, in order to raise the effectiveness of pest, disease, and weed control. Given that the number of firms in the agriculture sector are fewer in developed markets than in the rest of the world, management decisions can be more easily implemented in the former. On the other hand, emerging market countries where ag output is driven by numerous individual farmers will have a more difficult time implementing policies. Individual farms may not have the means to support themselves, which raises the potential impact of climate change. What is more, climate-change mitigation efforts may require projects, programs, or funds set aside by the government to support these efforts. This is more likely to occur in wealthier developed countries. Bottom Line: Adaptation and mitigation measures on the part of farmers have the potential to reduce the impact of climate change. That said, farmers in richer countries with the funds and institutions in place to support the ag sector likely will fare better. Investment Implications Over the coming decade, the ramifications of climate change are likely to be contained to a regional level. Although global supply will be vulnerable to regional disruptions, the impact will, in part, be mitigated by inventories, which have been rising for years. These stocks will create a buffer against unpredictable supply shocks (Chart 12). Chart 12Higher Inventories Needed To Buffer Against Unpredictable Shocks Agriculture In The Age Of Climate Change Agriculture In The Age Of Climate Change However, given that the global soybean market resembles an oligopoly with Brazil, the U.S., and Argentina accounting for 81% of global supply, global soybean prices will be more vulnerable to supply events in these regions than other crops (Chart 13). At the other end of the spectrum, global wheat markets will be relatively more insulated from isolated weather events impacting any one major producer as each of these regions contributes a relatively small share to global wheat output. This analysis also finds that yields and supply generally recover in the crop year following an extreme climate event. This implies that while the extent of damage from these events can be severe, they are not persistent unless the increasing frequency of extreme events leads to a secular change. Aside from the price impact, the weather and temperature changes will manifest in the form of greater volatility in supply, translating to greater price volatility. Options-implied volatilities for corn, wheat and soybeans have been on a general downtrend since the two major global food scares in 2007/08 and 2010/11 (Chart 14). We expect the trend to reverse going forward as the frequency of weather events will create greater price uncertainty. Chart 13Soybeans Most Vulnerable To Shocks Affecting Major Producers Agriculture In The Age Of Climate Change Agriculture In The Age Of Climate Change   Chart 14Volatility Will Go Up Agriculture In The Age Of Climate Change Agriculture In The Age Of Climate Change   Roukaya Ibrahim, Editor/Strategist Commodity & Energy Strategy RoukayaI@bcaresearch.com Jeremie Peloso, Research Analyst U.S. Bond Strategy JeremieP@bcaresearch.com Hugo Bélanger, Senior Analyst Commodity & Energy Strategy HugoB@bcaresearch.com Amr Hanafy, Research Associate Global Asset Allocation AmrH@bcaresearch.com Isabelle Dimyadi, Research Associate Isabelled@bcaresearch.com     Appendix Table 2Extreme Weather Events In The U.S. Agriculture In The Age Of Climate Change Agriculture In The Age Of Climate Change   Footnotes 1      Please see Vogel et al, The effects of climate extremes on global agricultural yields, Environ. Res. Lett 14 054010, 2019. 2      As a consequence of greenhouse gas emissions precipitation is expected to increase in high altitude regions such as much of the U.S. and decrease in subtropical regions such as the southwest U.S., Central America, southern Africa, and the Mediterranean basin. 3           Plants can be broken down into either C3 or C4 based on the way they assimilate atmospheric CO2 into different physiological components. While rising CO2 causes C3 plants to raise the rate of photosynthesis and reduce the respiration rate, C4 plants do not experience a rise in photosynthesis since photosynthesis is already saturated. For example, studies show that soybean yields increased 12%-15% under 550 ppm vs. 370 ppm CO2 concentrations while corn experienced negligible yield increases. 4      Please see Lesk C., P. Rowhani, and N. Ramankutty, Influence of extreme weather disasters on global crop production, Nature, 529(7584), 84-87, 2016. 5      Please see The State Of Food And Agriculture: Climate Change, Agriculture, And Food Security, Food and Agriculture Organization of the United Nations, 2016. 6      Please see Stevanovic et al., The impact of high-end climate change on agricultural welfare, Sci-Adv 2(8), 2016.

Related Topics